La Plata County, CO
La Plata County Map
La Plata County Overview
55,983
TOTAL POPULATION
28,379
MALE POPULATION
27,604
FEMALE POPULATION
102.81
MALES / 100 FEMALES
97.27
FEMALES / 100 MALES
41.8
MEDIAN AGE
2.9
AVG FAMILY SIZE
2.4
AVG HOUSEHOLD SIZE
$44,614
PER CAPITA INCOME
$104,101
AVG FAMILY INCOME
$81,936
AVG HOUSEHOLD INCOME
27.0%
WAGE / INCOME GAP [ % ]
73.0¢/ $1
WAGE / INCOME GAP [ $ ]
$10,079
FAMILY INCOME DEFICIT
0.44
INEQUALITY / GINI INDEX
30,236
LABOR FORCE [ PEOPLE ]
64.5%
PERCENT IN LABOR FORCE
3.2%
UNEMPLOYMENT RATE
La Plata County Area Codes
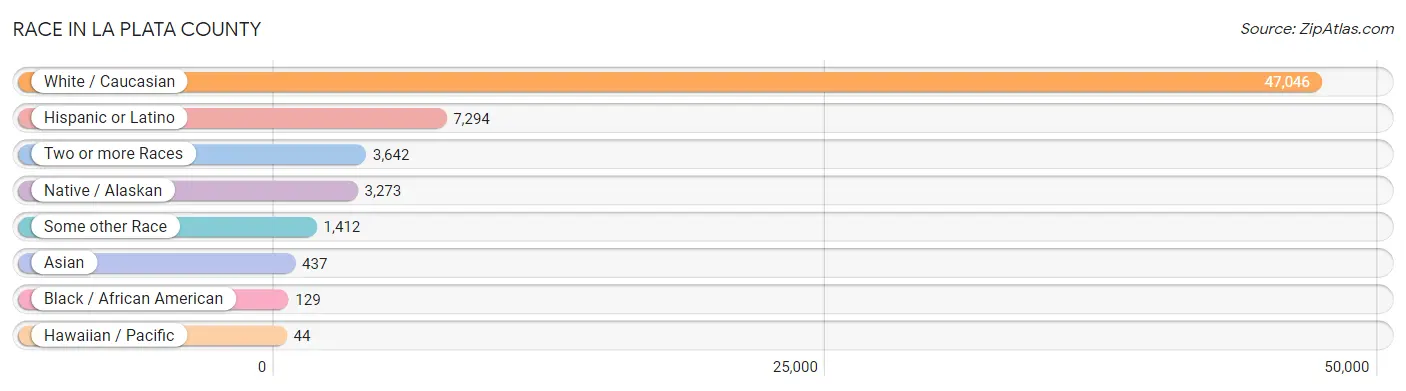
Race in La Plata County
The most populous races in La Plata County are White / Caucasian (47,046 | 84.0%), Hispanic or Latino (7,294 | 13.0%), and Two or more Races (3,642 | 6.5%).
| Race | # Population | % Population |
| Asian | 437 | 0.8% |
| Black / African American | 129 | 0.2% |
| Hawaiian / Pacific | 44 | 0.1% |
| Hispanic or Latino | 7,294 | 13.0% |
| Native / Alaskan | 3,273 | 5.9% |
| White / Caucasian | 47,046 | 84.0% |
| Two or more Races | 3,642 | 6.5% |
| Some other Race | 1,412 | 2.5% |
| Total | 55,983 | 100.0% |
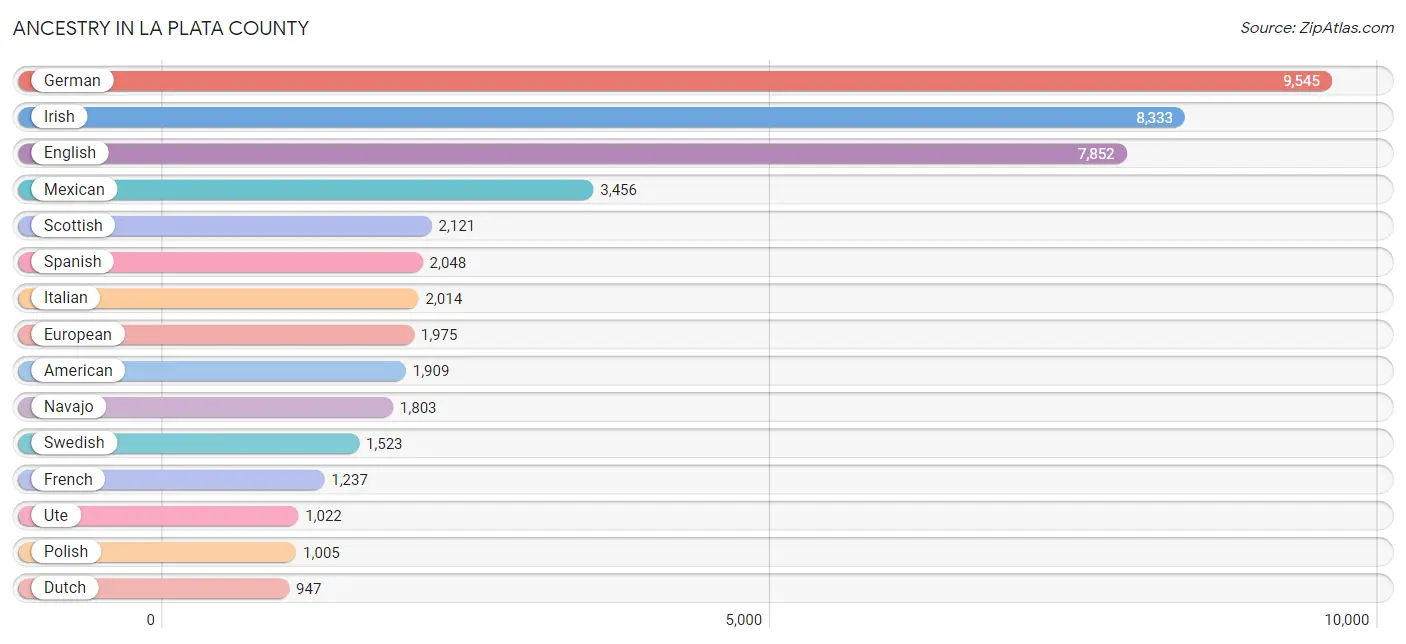
Ancestry in La Plata County
The most populous ancestries reported in La Plata County are German (9,545 | 17.1%), Irish (8,333 | 14.9%), English (7,852 | 14.0%), Mexican (3,456 | 6.2%), and Scottish (2,121 | 3.8%), together accounting for 55.9% of all La Plata County residents.
| Ancestry | # Population | % Population |
| African | 7 | 0.0% |
| Alaskan Athabascan | 64 | 0.1% |
| Aleut | 21 | 0.0% |
| Alsatian | 18 | 0.0% |
| American | 1,909 | 3.4% |
| Apache | 53 | 0.1% |
| Arab | 46 | 0.1% |
| Arapaho | 21 | 0.0% |
| Armenian | 39 | 0.1% |
| Australian | 25 | 0.0% |
| Austrian | 87 | 0.2% |
| Basque | 4 | 0.0% |
| Belgian | 133 | 0.2% |
| Belizean | 22 | 0.0% |
| Bhutanese | 209 | 0.4% |
| Blackfeet | 107 | 0.2% |
| Brazilian | 7 | 0.0% |
| British | 507 | 0.9% |
| Bulgarian | 49 | 0.1% |
| Burmese | 52 | 0.1% |
| Cajun | 14 | 0.0% |
| Cambodian | 6 | 0.0% |
| Canadian | 62 | 0.1% |
| Celtic | 45 | 0.1% |
| Central American | 119 | 0.2% |
| Central American Indian | 22 | 0.0% |
| Cherokee | 388 | 0.7% |
| Cheyenne | 23 | 0.0% |
| Chippewa | 21 | 0.0% |
| Choctaw | 96 | 0.2% |
| Colombian | 42 | 0.1% |
| Costa Rican | 88 | 0.2% |
| Croatian | 45 | 0.1% |
| Cuban | 89 | 0.2% |
| Czech | 339 | 0.6% |
| Czechoslovakian | 75 | 0.1% |
| Danish | 438 | 0.8% |
| Dutch | 947 | 1.7% |
| Dutch West Indian | 16 | 0.0% |
| Eastern European | 162 | 0.3% |
| Egyptian | 4 | 0.0% |
| English | 7,852 | 14.0% |
| Estonian | 4 | 0.0% |
| European | 1,975 | 3.5% |
| Fijian | 1 | 0.0% |
| Filipino | 12 | 0.0% |
| Finnish | 186 | 0.3% |
| French | 1,237 | 2.2% |
| French Canadian | 311 | 0.6% |
| German | 9,545 | 17.1% |
| Greek | 229 | 0.4% |
| Guatemalan | 29 | 0.1% |
| Honduran | 2 | 0.0% |
| Hungarian | 106 | 0.2% |
| Indian (Asian) | 182 | 0.3% |
| Inupiat | 25 | 0.0% |
| Irish | 8,333 | 14.9% |
| Iroquois | 4 | 0.0% |
| Italian | 2,014 | 3.6% |
| Kiowa | 3 | 0.0% |
| Korean | 98 | 0.2% |
| Laotian | 12 | 0.0% |
| Latvian | 17 | 0.0% |
| Lebanese | 26 | 0.1% |
| Lithuanian | 151 | 0.3% |
| Lumbee | 17 | 0.0% |
| Mexican | 3,456 | 6.2% |
| Native Hawaiian | 46 | 0.1% |
| Navajo | 1,803 | 3.2% |
| New Zealander | 15 | 0.0% |
| Nigerian | 29 | 0.1% |
| Northern European | 205 | 0.4% |
| Norwegian | 912 | 1.6% |
| Osage | 107 | 0.2% |
| Pakistani | 6 | 0.0% |
| Pennsylvania German | 12 | 0.0% |
| Peruvian | 8 | 0.0% |
| Polish | 1,005 | 1.8% |
| Portuguese | 147 | 0.3% |
| Potawatomi | 54 | 0.1% |
| Pueblo | 118 | 0.2% |
| Puerto Rican | 90 | 0.2% |
| Romanian | 35 | 0.1% |
| Russian | 202 | 0.4% |
| Samoan | 11 | 0.0% |
| Scandinavian | 246 | 0.4% |
| Scotch-Irish | 588 | 1.1% |
| Scottish | 2,121 | 3.8% |
| Seminole | 8 | 0.0% |
| Serbian | 4 | 0.0% |
| Sioux | 63 | 0.1% |
| Slavic | 24 | 0.0% |
| Slovak | 94 | 0.2% |
| Slovene | 24 | 0.0% |
| South African | 16 | 0.0% |
| South American | 53 | 0.1% |
| Spaniard | 467 | 0.8% |
| Spanish | 2,048 | 3.7% |
| Spanish American | 33 | 0.1% |
| Sri Lankan | 47 | 0.1% |
| Subsaharan African | 52 | 0.1% |
| Swedish | 1,523 | 2.7% |
| Swiss | 451 | 0.8% |
| Thai | 92 | 0.2% |
| Tlingit-Haida | 91 | 0.2% |
| Ukrainian | 93 | 0.2% |
| Ute | 1,022 | 1.8% |
| Venezuelan | 3 | 0.0% |
| Welsh | 636 | 1.1% |
| Yaqui | 35 | 0.1% | View All 110 Rows |
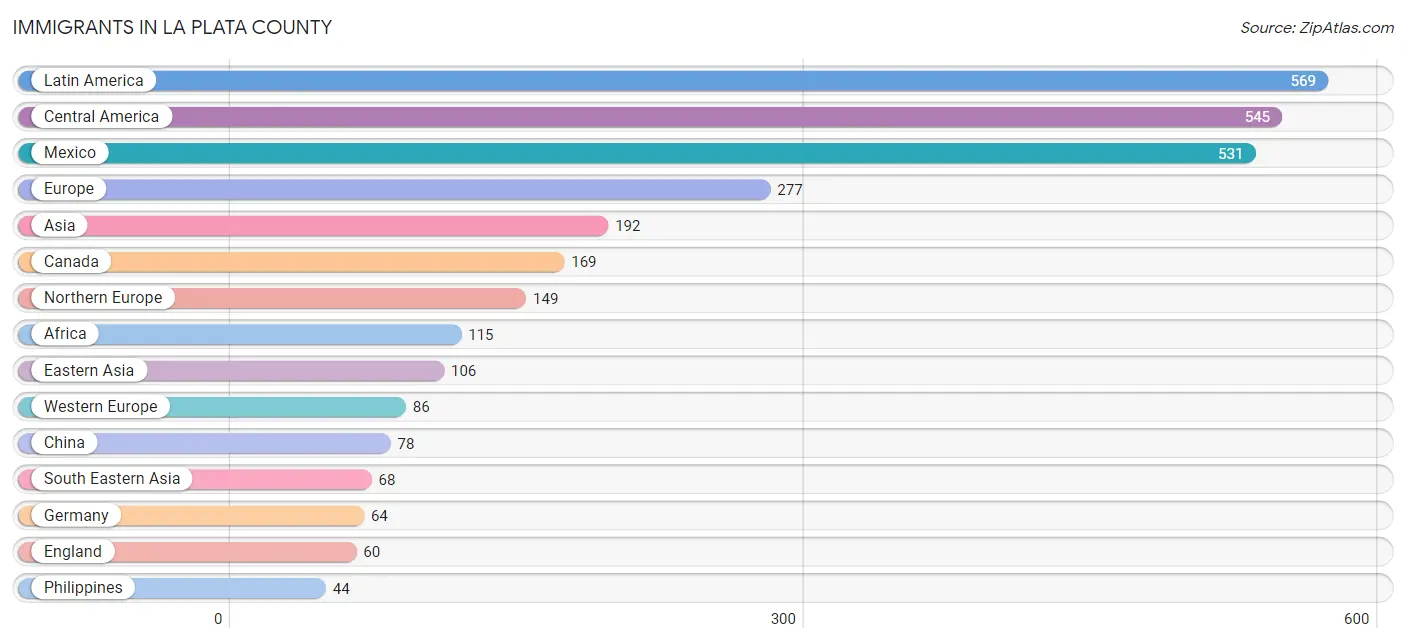
Immigrants in La Plata County
The most numerous immigrant groups reported in La Plata County came from Latin America (569 | 1.0%), Central America (545 | 1.0%), Mexico (531 | 0.9%), Europe (277 | 0.5%), and Asia (192 | 0.3%), together accounting for 3.8% of all La Plata County residents.
| Immigration Origin | # Population | % Population |
| Africa | 115 | 0.2% |
| Argentina | 8 | 0.0% |
| Asia | 192 | 0.3% |
| Australia | 38 | 0.1% |
| Cameroon | 10 | 0.0% |
| Canada | 169 | 0.3% |
| Caribbean | 13 | 0.0% |
| Central America | 545 | 1.0% |
| China | 78 | 0.1% |
| Costa Rica | 14 | 0.0% |
| Cuba | 13 | 0.0% |
| Denmark | 12 | 0.0% |
| Eastern Asia | 106 | 0.2% |
| Eastern Europe | 39 | 0.1% |
| Egypt | 4 | 0.0% |
| England | 60 | 0.1% |
| Europe | 277 | 0.5% |
| France | 12 | 0.0% |
| Germany | 64 | 0.1% |
| Hungary | 8 | 0.0% |
| India | 16 | 0.0% |
| Indonesia | 7 | 0.0% |
| Ireland | 13 | 0.0% |
| Japan | 28 | 0.1% |
| Latin America | 569 | 1.0% |
| Lithuania | 2 | 0.0% |
| Malaysia | 8 | 0.0% |
| Mexico | 531 | 0.9% |
| Middle Africa | 10 | 0.0% |
| Morocco | 29 | 0.1% |
| Nigeria | 22 | 0.0% |
| Northern Africa | 33 | 0.1% |
| Northern Europe | 149 | 0.3% |
| Oceania | 43 | 0.1% |
| Philippines | 44 | 0.1% |
| Poland | 8 | 0.0% |
| Russia | 14 | 0.0% |
| Sierra Leone | 12 | 0.0% |
| South Africa | 38 | 0.1% |
| South America | 11 | 0.0% |
| South Central Asia | 16 | 0.0% |
| South Eastern Asia | 68 | 0.1% |
| Southern Europe | 3 | 0.0% |
| Spain | 3 | 0.0% |
| Switzerland | 10 | 0.0% |
| Thailand | 6 | 0.0% |
| Ukraine | 3 | 0.0% |
| Venezuela | 3 | 0.0% |
| Vietnam | 3 | 0.0% |
| Western Africa | 34 | 0.1% |
| Western Asia | 2 | 0.0% |
| Western Europe | 86 | 0.2% | View All 52 Rows |
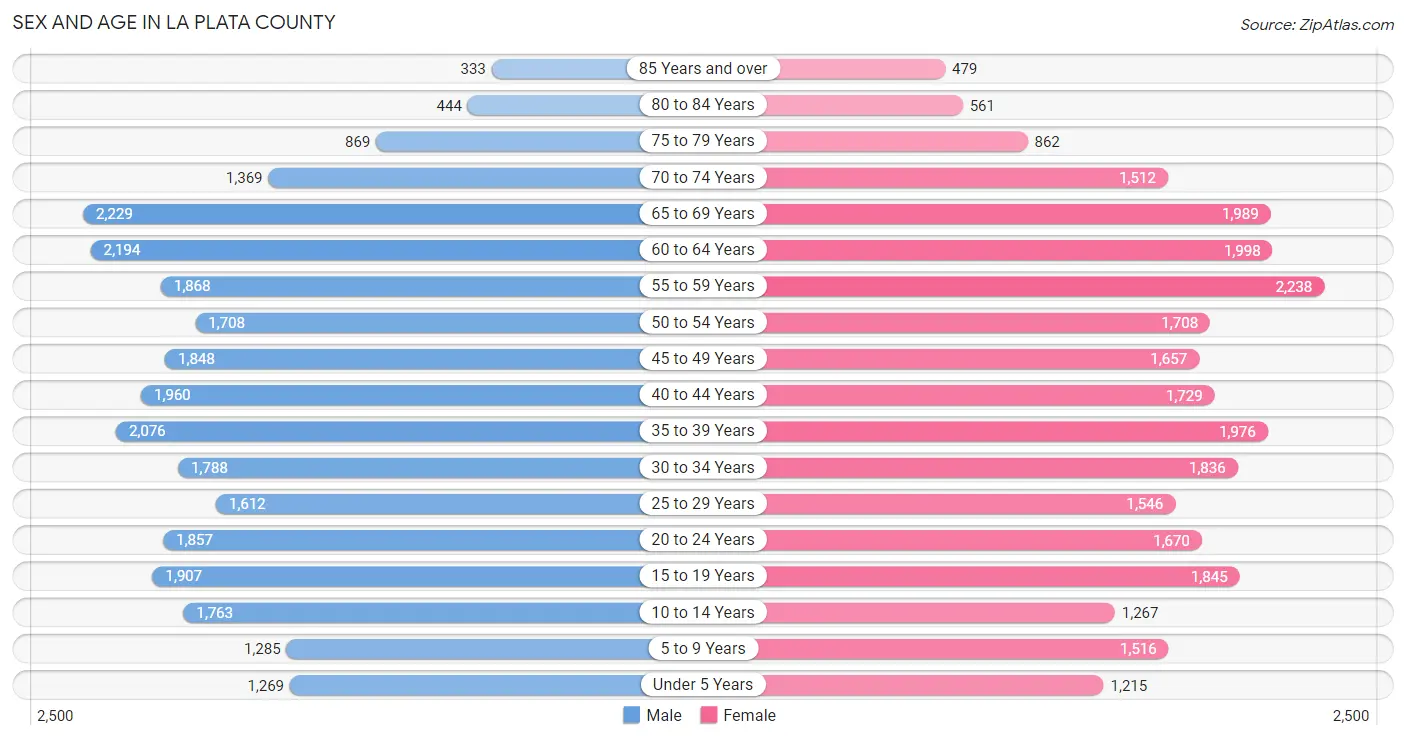
Sex and Age in La Plata County
Sex and Age in La Plata County
The most populous age groups in La Plata County are 65 to 69 Years (2,229 | 7.9%) for men and 55 to 59 Years (2,238 | 8.1%) for women.
| Age Bracket | Male | Female |
| Under 5 Years | 1,269 (4.5%) | 1,215 (4.4%) |
| 5 to 9 Years | 1,285 (4.5%) | 1,516 (5.5%) |
| 10 to 14 Years | 1,763 (6.2%) | 1,267 (4.6%) |
| 15 to 19 Years | 1,907 (6.7%) | 1,845 (6.7%) |
| 20 to 24 Years | 1,857 (6.5%) | 1,670 (6.0%) |
| 25 to 29 Years | 1,612 (5.7%) | 1,546 (5.6%) |
| 30 to 34 Years | 1,788 (6.3%) | 1,836 (6.7%) |
| 35 to 39 Years | 2,076 (7.3%) | 1,976 (7.2%) |
| 40 to 44 Years | 1,960 (6.9%) | 1,729 (6.3%) |
| 45 to 49 Years | 1,848 (6.5%) | 1,657 (6.0%) |
| 50 to 54 Years | 1,708 (6.0%) | 1,708 (6.2%) |
| 55 to 59 Years | 1,868 (6.6%) | 2,238 (8.1%) |
| 60 to 64 Years | 2,194 (7.7%) | 1,998 (7.2%) |
| 65 to 69 Years | 2,229 (7.9%) | 1,989 (7.2%) |
| 70 to 74 Years | 1,369 (4.8%) | 1,512 (5.5%) |
| 75 to 79 Years | 869 (3.1%) | 862 (3.1%) |
| 80 to 84 Years | 444 (1.6%) | 561 (2.0%) |
| 85 Years and over | 333 (1.2%) | 479 (1.7%) |
| Total | 28,379 (100.0%) | 27,604 (100.0%) |
Families and Households in La Plata County
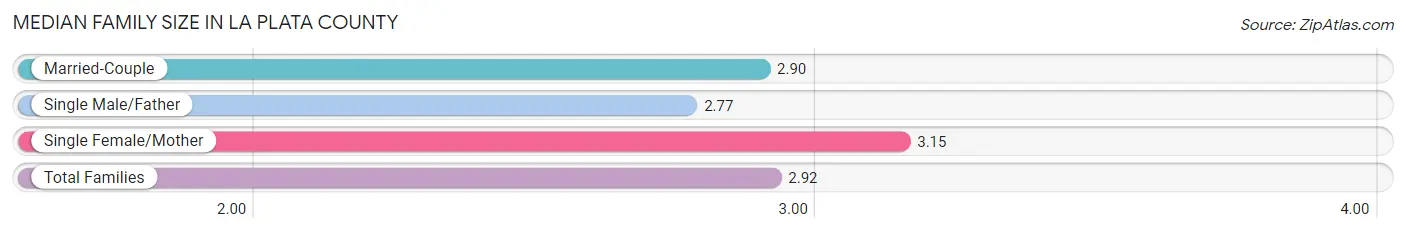
Median Family Size in La Plata County
The median family size in La Plata County is 2.92 persons per family, with single female/mother families (1,518 | 10.8%) accounting for the largest median family size of 3.15 persons per family. On the other hand, single male/father families (825 | 5.9%) represent the smallest median family size with 2.77 persons per family.
| Family Type | # Families | Family Size |
| Married-Couple | 11,660 (83.3%) | 2.90 |
| Single Male/Father | 825 (5.9%) | 2.77 |
| Single Female/Mother | 1,518 (10.8%) | 3.15 |
| Total Families | 14,003 (100.0%) | 2.92 |
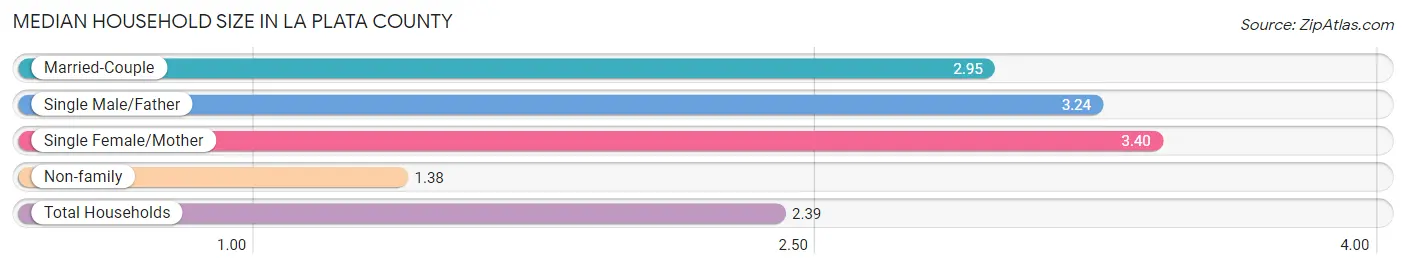
Median Household Size in La Plata County
The median household size in La Plata County is 2.39 persons per household, with single female/mother households (1,518 | 6.7%) accounting for the largest median household size of 3.4 persons per household. non-family households (8,688 | 38.3%) represent the smallest median household size with 1.38 persons per household.
| Household Type | # Households | Household Size |
| Married-Couple | 11,660 (51.4%) | 2.95 |
| Single Male/Father | 825 (3.6%) | 3.24 |
| Single Female/Mother | 1,518 (6.7%) | 3.40 |
| Non-family | 8,688 (38.3%) | 1.38 |
| Total Households | 22,691 (100.0%) | 2.39 |
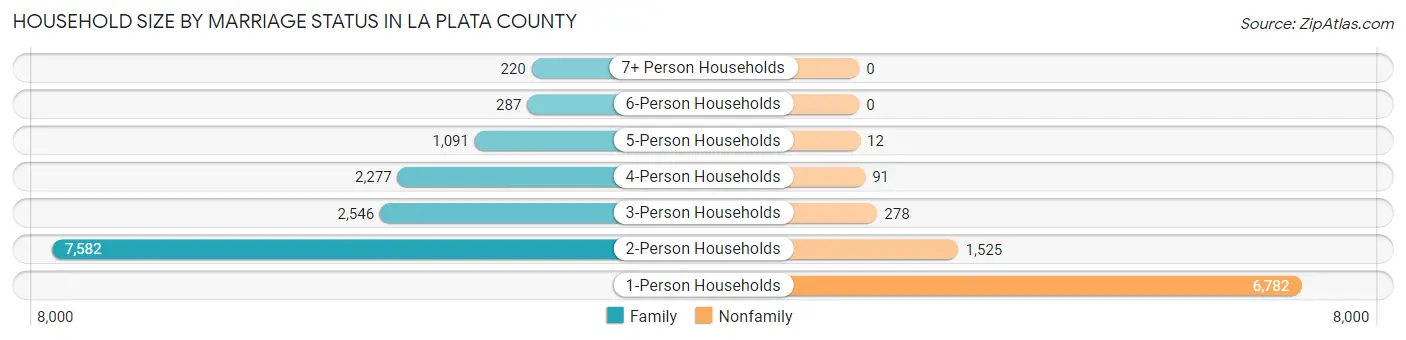
Household Size by Marriage Status in La Plata County
Out of a total of 22,691 households in La Plata County, 14,003 (61.7%) are family households, while 8,688 (38.3%) are nonfamily households. The most numerous type of family households are 2-person households, comprising 7,582, and the most common type of nonfamily households are 1-person households, comprising 6,782.
| Household Size | Family Households | Nonfamily Households |
| 1-Person Households | - | 6,782 (29.9%) |
| 2-Person Households | 7,582 (33.4%) | 1,525 (6.7%) |
| 3-Person Households | 2,546 (11.2%) | 278 (1.2%) |
| 4-Person Households | 2,277 (10.0%) | 91 (0.4%) |
| 5-Person Households | 1,091 (4.8%) | 12 (0.1%) |
| 6-Person Households | 287 (1.3%) | 0 (0.0%) |
| 7+ Person Households | 220 (1.0%) | 0 (0.0%) |
| Total | 14,003 (61.7%) | 8,688 (38.3%) |
Female Fertility in La Plata County
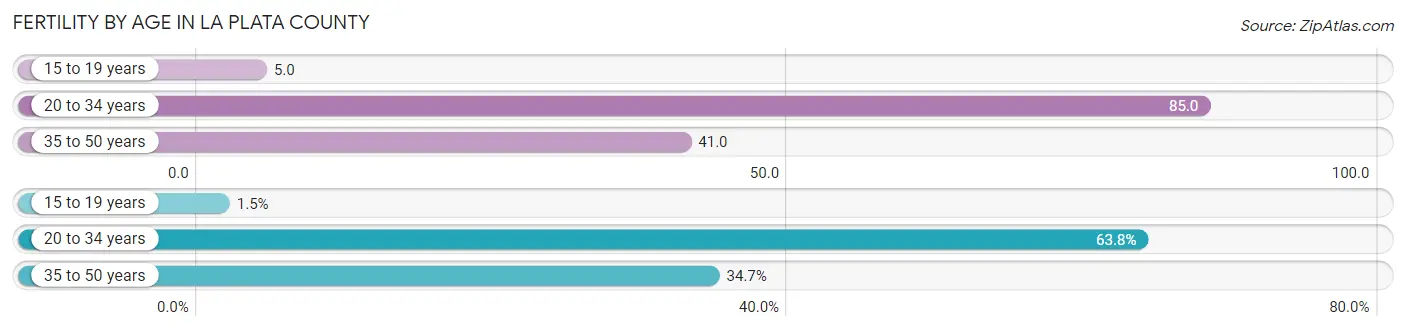
Fertility by Age in La Plata County
Average fertility rate in La Plata County is 53.0 births per 1,000 women. Women in the age bracket of 20 to 34 years have the highest fertility rate with 85.0 births per 1,000 women. Women in the age bracket of 20 to 34 years acount for 63.8% of all women with births.
| Age Bracket | Women with Births | Births / 1,000 Women |
| 15 to 19 years | 10 (1.5%) | 5.0 |
| 20 to 34 years | 430 (63.8%) | 85.0 |
| 35 to 50 years | 234 (34.7%) | 41.0 |
| Total | 674 (100.0%) | 53.0 |
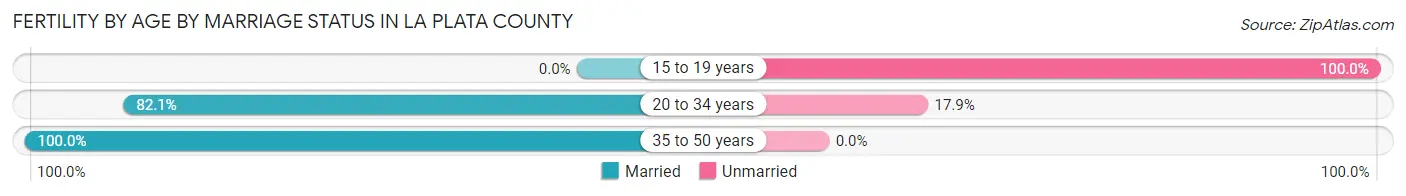
Fertility by Age by Marriage Status in La Plata County
87.1% of women with births (674) in La Plata County are married. The highest percentage of unmarried women with births falls into 15 to 19 years age bracket with 100.0% of them unmarried at the time of birth, while the lowest percentage of unmarried women with births belong to 35 to 50 years age bracket with 0.0% of them unmarried.
| Age Bracket | Married | Unmarried |
| 15 to 19 years | 0 (0.0%) | 10 (100.0%) |
| 20 to 34 years | 353 (82.1%) | 77 (17.9%) |
| 35 to 50 years | 234 (100.0%) | 0 (0.0%) |
| Total | 587 (87.1%) | 87 (12.9%) |
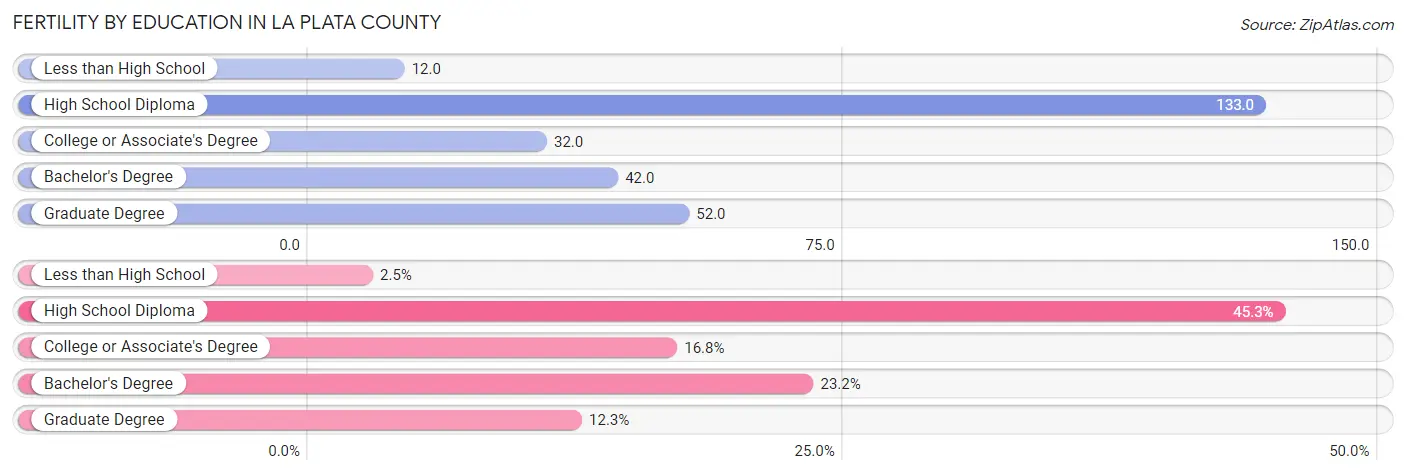
Fertility by Education in La Plata County
Average fertility rate in La Plata County is 53.0 births per 1,000 women. Women with the education attainment of high school diploma have the highest fertility rate of 133.0 births per 1,000 women, while women with the education attainment of less than high school have the lowest fertility at 12.0 births per 1,000 women. Women with the education attainment of high school diploma represent 45.3% of all women with births.
| Educational Attainment | Women with Births | Births / 1,000 Women |
| Less than High School | 17 (2.5%) | 12.0 |
| High School Diploma | 305 (45.3%) | 133.0 |
| College or Associate's Degree | 113 (16.8%) | 32.0 |
| Bachelor's Degree | 156 (23.2%) | 42.0 |
| Graduate Degree | 83 (12.3%) | 52.0 |
| Total | 674 (100.0%) | 53.0 |
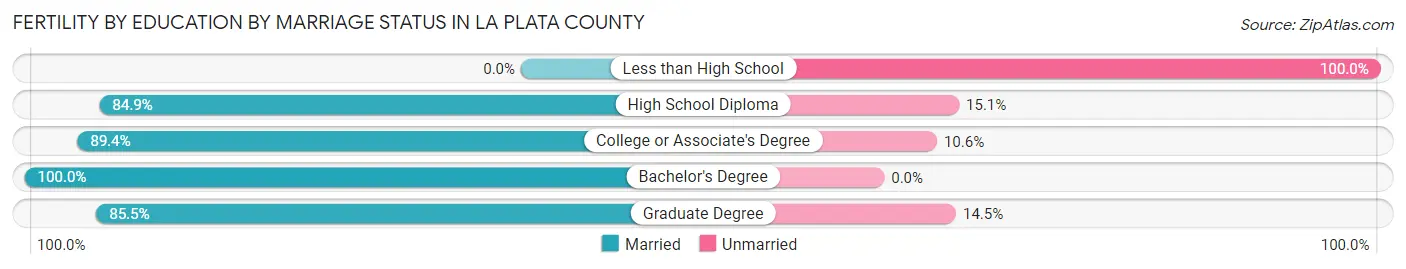
Fertility by Education by Marriage Status in La Plata County
12.9% of women with births in La Plata County are unmarried. Women with the educational attainment of bachelor's degree are most likely to be married with 100.0% of them married at childbirth, while women with the educational attainment of less than high school are least likely to be married with 100.0% of them unmarried at childbirth.
| Educational Attainment | Married | Unmarried |
| Less than High School | 0 (0.0%) | 17 (100.0%) |
| High School Diploma | 259 (84.9%) | 46 (15.1%) |
| College or Associate's Degree | 101 (89.4%) | 12 (10.6%) |
| Bachelor's Degree | 156 (100.0%) | 0 (0.0%) |
| Graduate Degree | 71 (85.5%) | 12 (14.5%) |
| Total | 587 (87.1%) | 87 (12.9%) |
Income in La Plata County
Income Overview in La Plata County
Per Capita Income in La Plata County is $44,614, while median incomes of families and households are $104,101 and $81,936 respectively.
| Characteristic | Number | Measure |
| Per Capita Income | 55,983 | $44,614 |
| Median Family Income | 14,003 | $104,101 |
| Mean Family Income | 14,003 | $125,730 |
| Median Household Income | 22,691 | $81,936 |
| Mean Household Income | 22,691 | $104,900 |
| Income Deficit | 14,003 | $10,079 |
| Wage / Income Gap (%) | 55,983 | 26.96% |
| Wage / Income Gap ($) | 55,983 | 73.04¢ per $1 |
| Gini / Inequality Index | 55,983 | 0.44 |
Earnings by Sex in La Plata County
Average Earnings in La Plata County are $41,397, $47,352 for men and $34,588 for women, a difference of 27.0%.
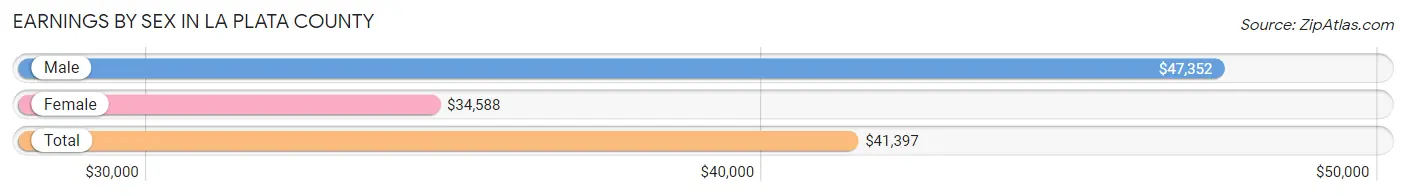
| Sex | Number | Average Earnings |
| Male | 17,344 (53.7%) | $47,352 |
| Female | 14,961 (46.3%) | $34,588 |
| Total | 32,305 (100.0%) | $41,397 |
Earnings by Sex by Income Bracket in La Plata County
The most common earnings brackets in La Plata County are $100,000+ for men (3,154 | 18.2%) and $55,000 to $64,999 for women (1,393 | 9.3%).
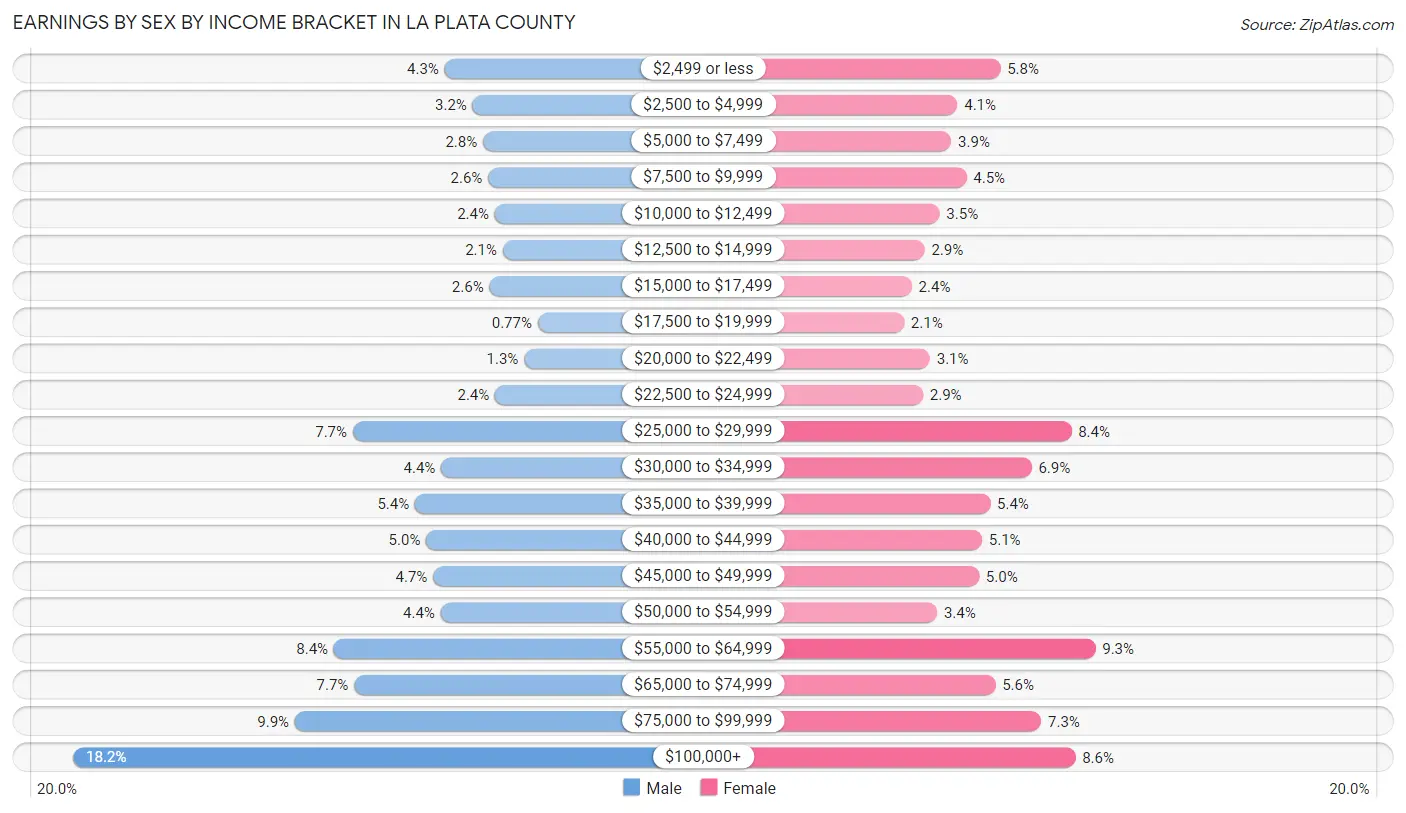
| Income | Male | Female |
| $2,499 or less | 738 (4.3%) | 861 (5.8%) |
| $2,500 to $4,999 | 556 (3.2%) | 619 (4.1%) |
| $5,000 to $7,499 | 489 (2.8%) | 585 (3.9%) |
| $7,500 to $9,999 | 456 (2.6%) | 670 (4.5%) |
| $10,000 to $12,499 | 413 (2.4%) | 519 (3.5%) |
| $12,500 to $14,999 | 360 (2.1%) | 435 (2.9%) |
| $15,000 to $17,499 | 448 (2.6%) | 364 (2.4%) |
| $17,500 to $19,999 | 134 (0.8%) | 320 (2.1%) |
| $20,000 to $22,499 | 222 (1.3%) | 466 (3.1%) |
| $22,500 to $24,999 | 411 (2.4%) | 426 (2.9%) |
| $25,000 to $29,999 | 1,336 (7.7%) | 1,258 (8.4%) |
| $30,000 to $34,999 | 762 (4.4%) | 1,036 (6.9%) |
| $35,000 to $39,999 | 932 (5.4%) | 804 (5.4%) |
| $40,000 to $44,999 | 858 (5.0%) | 757 (5.1%) |
| $45,000 to $49,999 | 813 (4.7%) | 741 (5.0%) |
| $50,000 to $54,999 | 765 (4.4%) | 505 (3.4%) |
| $55,000 to $64,999 | 1,458 (8.4%) | 1,393 (9.3%) |
| $65,000 to $74,999 | 1,327 (7.6%) | 832 (5.6%) |
| $75,000 to $99,999 | 1,712 (9.9%) | 1,089 (7.3%) |
| $100,000+ | 3,154 (18.2%) | 1,281 (8.6%) |
| Total | 17,344 (100.0%) | 14,961 (100.0%) |
Earnings by Sex by Educational Attainment in La Plata County
Average earnings in La Plata County are $56,734 for men and $40,714 for women, a difference of 28.2%. Men with an educational attainment of graduate degree enjoy the highest average annual earnings of $71,050, while those with less than high school education earn the least with $29,983. Women with an educational attainment of graduate degree earn the most with the average annual earnings of $59,597, while those with less than high school education have the smallest earnings of $28,839.
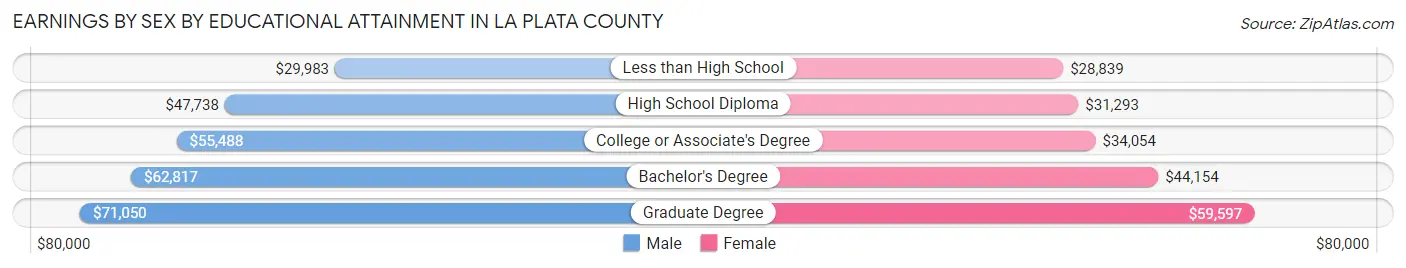
| Educational Attainment | Male Income | Female Income |
| Less than High School | $29,983 | $28,839 |
| High School Diploma | $47,738 | $31,293 |
| College or Associate's Degree | $55,488 | $34,054 |
| Bachelor's Degree | $62,817 | $44,154 |
| Graduate Degree | $71,050 | $59,597 |
| Total | $56,734 | $40,714 |
Family Income in La Plata County
Family Income Brackets in La Plata County
According to the La Plata County family income data, there are 3,389 families falling into the $100,000 to $149,999 income range, which is the most common income bracket and makes up 24.2% of all families. Conversely, the $10,000 to $14,999 income bracket is the least frequent group with only 140 families (1.0%) belonging to this category.
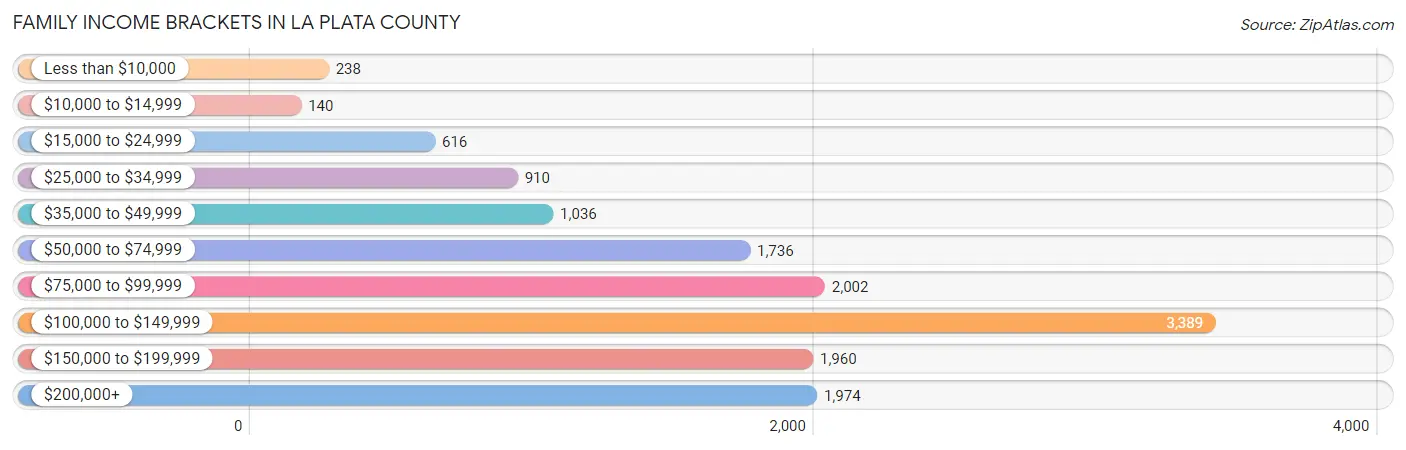
| Income Bracket | # Families | % Families |
| Less than $10,000 | 238 | 1.7% |
| $10,000 to $14,999 | 140 | 1.0% |
| $15,000 to $24,999 | 616 | 4.4% |
| $25,000 to $34,999 | 910 | 6.5% |
| $35,000 to $49,999 | 1,036 | 7.4% |
| $50,000 to $74,999 | 1,736 | 12.4% |
| $75,000 to $99,999 | 2,002 | 14.3% |
| $100,000 to $149,999 | 3,389 | 24.2% |
| $150,000 to $199,999 | 1,960 | 14.0% |
| $200,000+ | 1,974 | 14.1% |
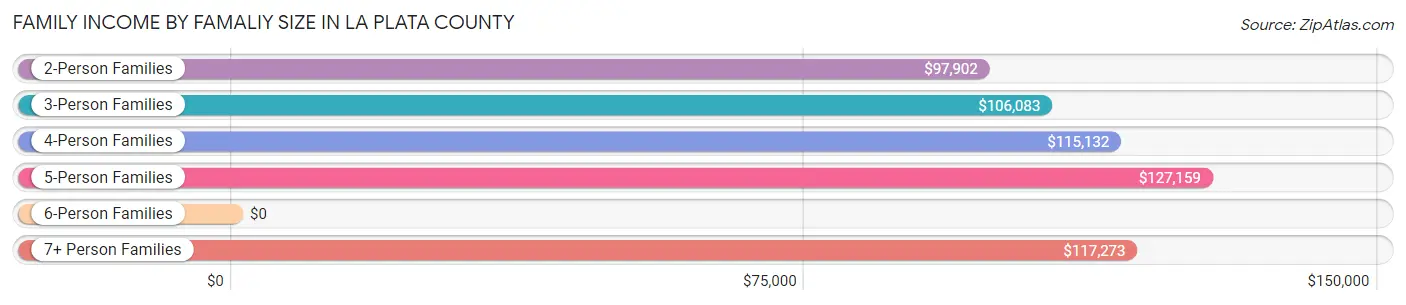
Family Income by Famaliy Size in La Plata County
5-person families (939 | 6.7%) account for the highest median family income in La Plata County with $127,159 per family, while 2-person families (7,962 | 56.9%) have the highest median income of $48,951 per family member.
| Income Bracket | # Families | Median Income |
| 2-Person Families | 7,962 (56.9%) | $97,902 |
| 3-Person Families | 2,556 (18.2%) | $106,083 |
| 4-Person Families | 2,062 (14.7%) | $115,132 |
| 5-Person Families | 939 (6.7%) | $127,159 |
| 6-Person Families | 266 (1.9%) | $0 |
| 7+ Person Families | 218 (1.6%) | $117,273 |
| Total | 14,003 (100.0%) | $104,101 |
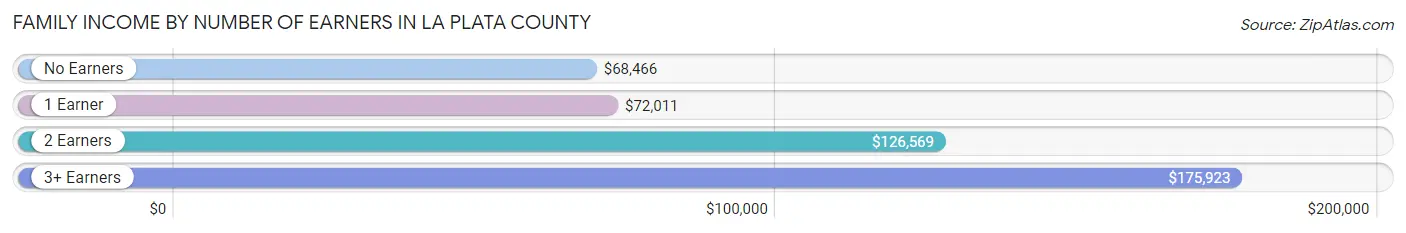
Family Income by Number of Earners in La Plata County
The median family income in La Plata County is $104,101, with families comprising 3+ earners (1,119) having the highest median family income of $175,923, while families with no earners (2,373) have the lowest median family income of $68,466, accounting for 8.0% and 17.0% of families, respectively.
| Number of Earners | # Families | Median Income |
| No Earners | 2,373 (17.0%) | $68,466 |
| 1 Earner | 4,451 (31.8%) | $72,011 |
| 2 Earners | 6,060 (43.3%) | $126,569 |
| 3+ Earners | 1,119 (8.0%) | $175,923 |
| Total | 14,003 (100.0%) | $104,101 |
Household Income in La Plata County
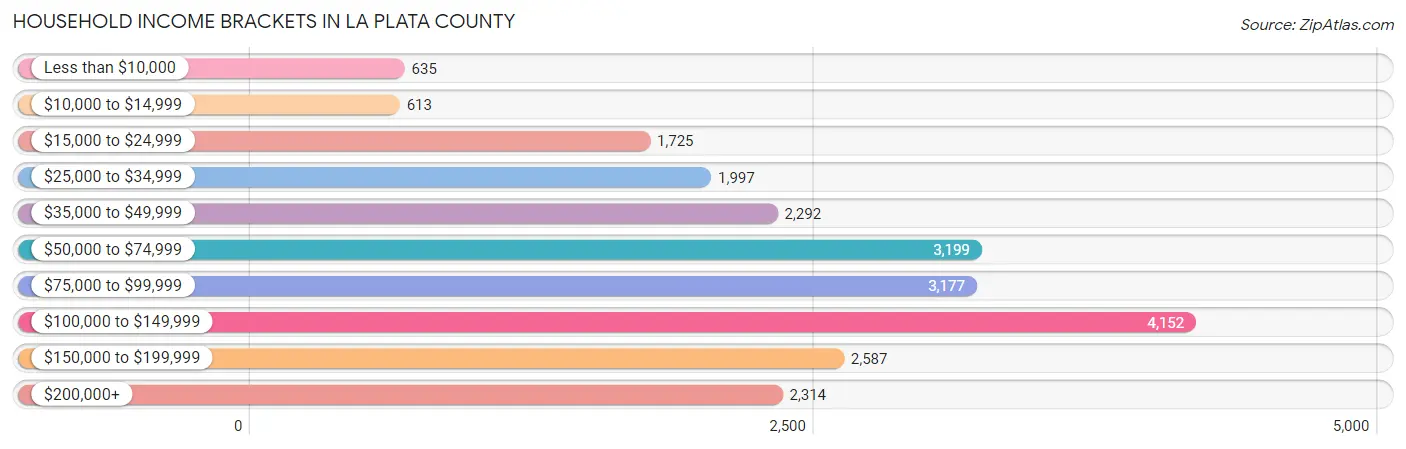
Household Income Brackets in La Plata County
With 4,152 households falling in the category, the $100,000 to $149,999 income range is the most frequent in La Plata County, accounting for 18.3% of all households. In contrast, only 613 households (2.7%) fall into the $10,000 to $14,999 income bracket, making it the least populous group.
| Income Bracket | # Households | % Households |
| Less than $10,000 | 635 | 2.8% |
| $10,000 to $14,999 | 613 | 2.7% |
| $15,000 to $24,999 | 1,725 | 7.6% |
| $25,000 to $34,999 | 1,997 | 8.8% |
| $35,000 to $49,999 | 2,292 | 10.1% |
| $50,000 to $74,999 | 3,199 | 14.1% |
| $75,000 to $99,999 | 3,177 | 14.0% |
| $100,000 to $149,999 | 4,152 | 18.3% |
| $150,000 to $199,999 | 2,587 | 11.4% |
| $200,000+ | 2,314 | 10.2% |
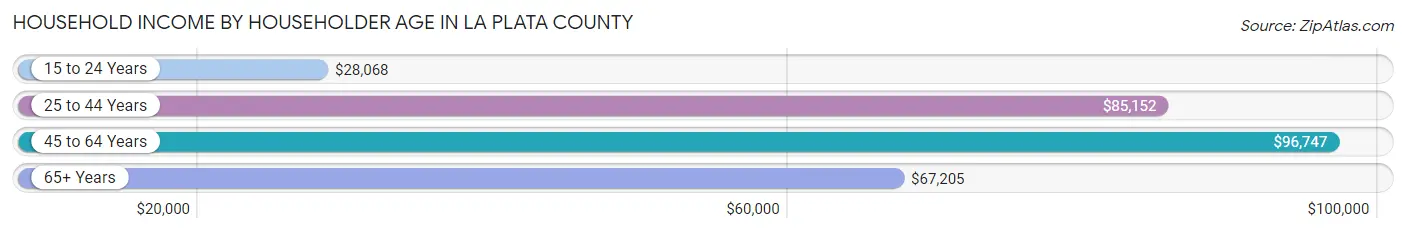
Household Income by Householder Age in La Plata County
The median household income in La Plata County is $81,936, with the highest median household income of $96,747 found in the 45 to 64 years age bracket for the primary householder. A total of 8,279 households (36.5%) fall into this category. Meanwhile, the 15 to 24 years age bracket for the primary householder has the lowest median household income of $28,068, with 888 households (3.9%) in this group.
| Income Bracket | # Households | Median Income |
| 15 to 24 Years | 888 (3.9%) | $28,068 |
| 25 to 44 Years | 6,959 (30.7%) | $85,152 |
| 45 to 64 Years | 8,279 (36.5%) | $96,747 |
| 65+ Years | 6,565 (28.9%) | $67,205 |
| Total | 22,691 (100.0%) | $81,936 |
Poverty in La Plata County
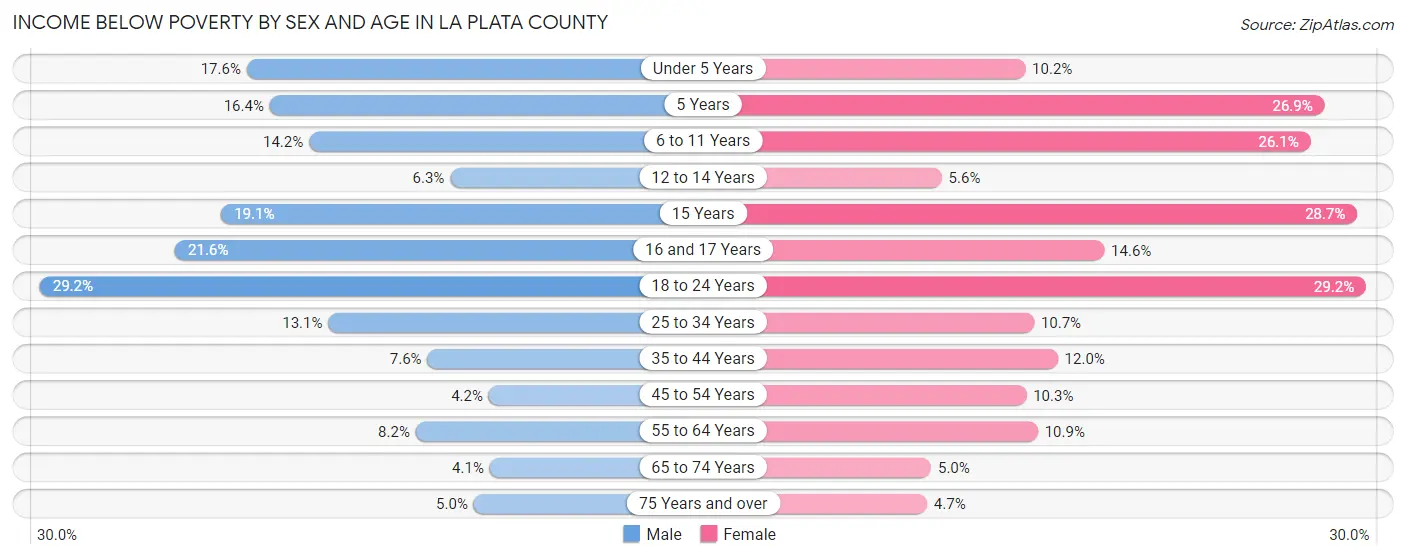
Income Below Poverty by Sex and Age in La Plata County
With 10.4% poverty level for males and 12.4% for females among the residents of La Plata County, 18 to 24 year old males and 18 to 24 year old females are the most vulnerable to poverty, with 660 males (29.1%) and 542 females (29.2%) in their respective age groups living below the poverty level.
| Age Bracket | Male | Female |
| Under 5 Years | 222 (17.6%) | 124 (10.2%) |
| 5 Years | 52 (16.4%) | 132 (26.9%) |
| 6 to 11 Years | 245 (14.2%) | 421 (26.1%) |
| 12 to 14 Years | 57 (6.3%) | 37 (5.6%) |
| 15 Years | 68 (19.1%) | 124 (28.7%) |
| 16 and 17 Years | 120 (21.6%) | 77 (14.6%) |
| 18 to 24 Years | 660 (29.1%) | 542 (29.2%) |
| 25 to 34 Years | 430 (13.1%) | 362 (10.7%) |
| 35 to 44 Years | 301 (7.6%) | 438 (12.0%) |
| 45 to 54 Years | 147 (4.2%) | 345 (10.3%) |
| 55 to 64 Years | 331 (8.2%) | 462 (10.9%) |
| 65 to 74 Years | 147 (4.1%) | 173 (5.0%) |
| 75 Years and over | 81 (5.0%) | 87 (4.7%) |
| Total | 2,861 (10.4%) | 3,324 (12.4%) |
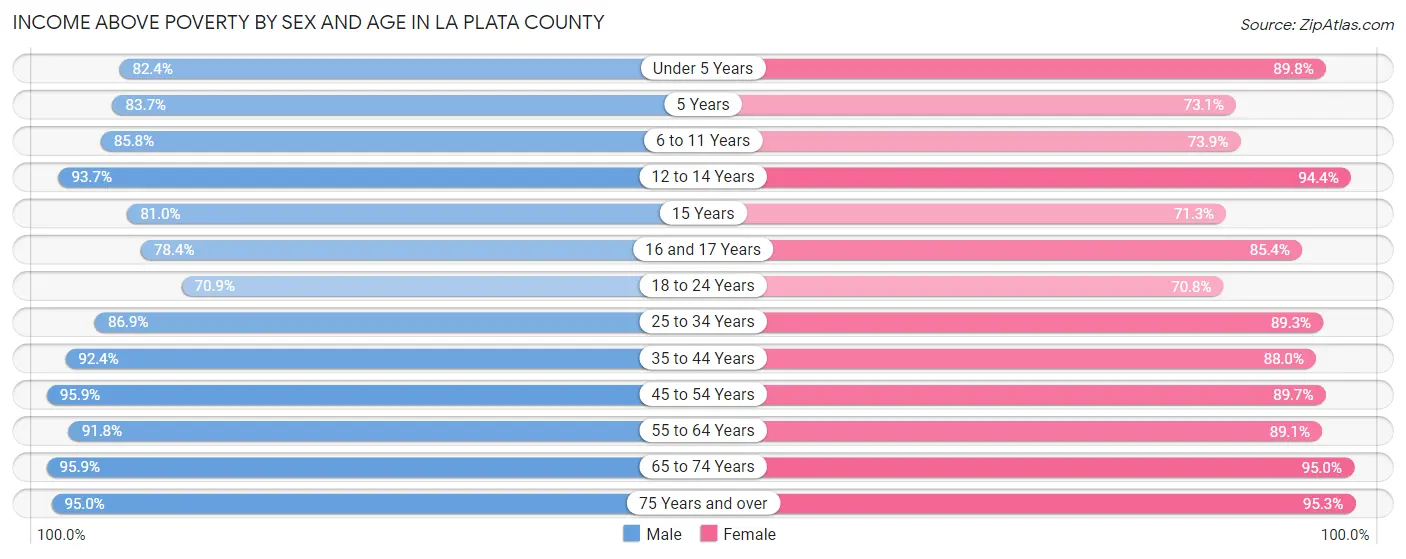
Income Above Poverty by Sex and Age in La Plata County
According to the poverty statistics in La Plata County, males aged 65 to 74 years and females aged 75 years and over are the age groups that are most secure financially, with 95.9% of males and 95.3% of females in these age groups living above the poverty line.
| Age Bracket | Male | Female |
| Under 5 Years | 1,037 (82.4%) | 1,090 (89.8%) |
| 5 Years | 266 (83.7%) | 359 (73.1%) |
| 6 to 11 Years | 1,485 (85.8%) | 1,192 (73.9%) |
| 12 to 14 Years | 848 (93.7%) | 628 (94.4%) |
| 15 Years | 289 (80.9%) | 308 (71.3%) |
| 16 and 17 Years | 435 (78.4%) | 450 (85.4%) |
| 18 to 24 Years | 1,604 (70.9%) | 1,315 (70.8%) |
| 25 to 34 Years | 2,855 (86.9%) | 3,020 (89.3%) |
| 35 to 44 Years | 3,677 (92.4%) | 3,207 (88.0%) |
| 45 to 54 Years | 3,391 (95.9%) | 3,013 (89.7%) |
| 55 to 64 Years | 3,695 (91.8%) | 3,774 (89.1%) |
| 65 to 74 Years | 3,437 (95.9%) | 3,305 (95.0%) |
| 75 Years and over | 1,543 (95.0%) | 1,747 (95.3%) |
| Total | 24,562 (89.6%) | 23,408 (87.6%) |
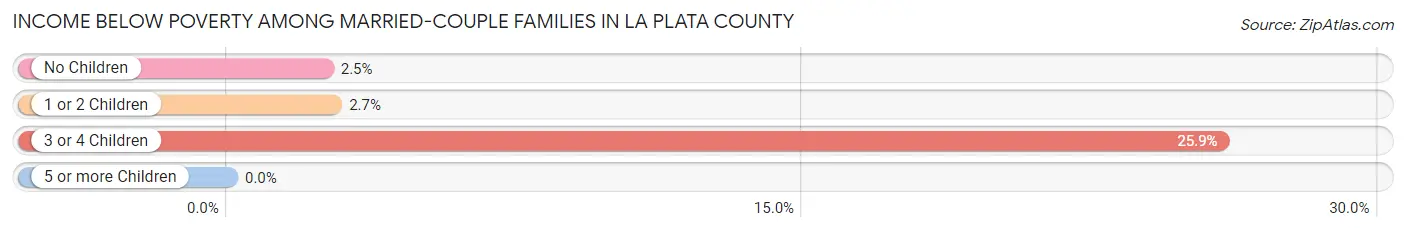
Income Below Poverty Among Married-Couple Families in La Plata County
The poverty statistics for married-couple families in La Plata County show that 4.0% or 467 of the total 11,660 families live below the poverty line. Families with 3 or 4 children have the highest poverty rate of 25.9%, comprising of 190 families. On the other hand, families with 5 or more children have the lowest poverty rate of 0.0%, which includes 0 families.
| Children | Above Poverty | Below Poverty |
| No Children | 7,449 (97.5%) | 191 (2.5%) |
| 1 or 2 Children | 3,072 (97.3%) | 86 (2.7%) |
| 3 or 4 Children | 544 (74.1%) | 190 (25.9%) |
| 5 or more Children | 128 (100.0%) | 0 (0.0%) |
| Total | 11,193 (96.0%) | 467 (4.0%) |
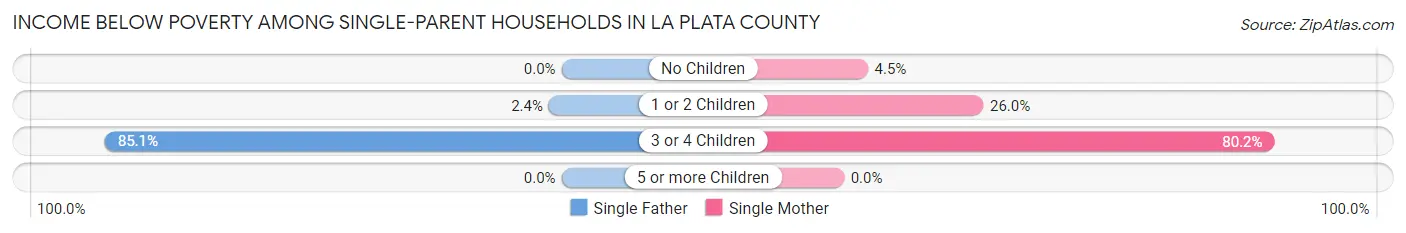
Income Below Poverty Among Single-Parent Households in La Plata County
According to the poverty data in La Plata County, 12.1% or 100 single-father households and 26.0% or 394 single-mother households are living below the poverty line. Among single-father households, those with 3 or 4 children have the highest poverty rate, with 91 households (85.1%) experiencing poverty. Likewise, among single-mother households, those with 3 or 4 children have the highest poverty rate, with 150 households (80.2%) falling below the poverty line.
| Children | Single Father | Single Mother |
| No Children | 0 (0.0%) | 21 (4.4%) |
| 1 or 2 Children | 9 (2.4%) | 223 (26.0%) |
| 3 or 4 Children | 91 (85.1%) | 150 (80.2%) |
| 5 or more Children | 0 (0.0%) | 0 (0.0%) |
| Total | 100 (12.1%) | 394 (26.0%) |
Income Below Poverty Among Married-Couple vs Single-Parent Households in La Plata County
The poverty data for La Plata County shows that 467 of the married-couple family households (4.0%) and 494 of the single-parent households (21.1%) are living below the poverty level. Within the married-couple family households, those with 3 or 4 children have the highest poverty rate, with 190 households (25.9%) falling below the poverty line. Among the single-parent households, those with 3 or 4 children have the highest poverty rate, with 241 household (82.0%) living below poverty.
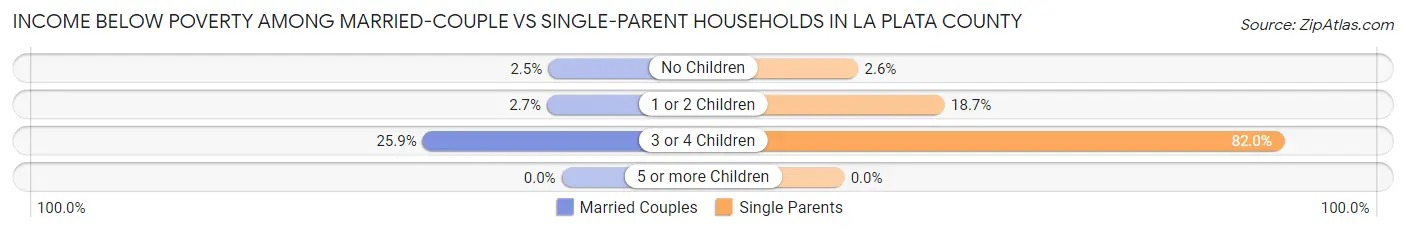
| Children | Married-Couple Families | Single-Parent Households |
| No Children | 191 (2.5%) | 21 (2.6%) |
| 1 or 2 Children | 86 (2.7%) | 232 (18.7%) |
| 3 or 4 Children | 190 (25.9%) | 241 (82.0%) |
| 5 or more Children | 0 (0.0%) | 0 (0.0%) |
| Total | 467 (4.0%) | 494 (21.1%) |
Employment Characteristics in La Plata County
Employment by Class of Employer in La Plata County
Among the 28,762 employed individuals in La Plata County, private company employees (16,083 | 55.9%), self-employed (not incorporated) (3,254 | 11.3%), and local government employees (2,766 | 9.6%) make up the most common classes of employment.
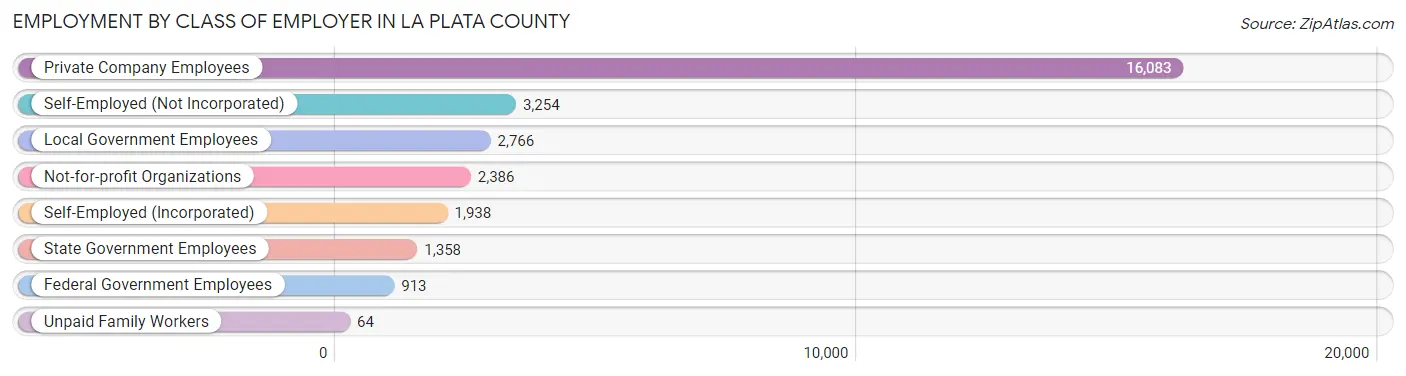
| Employer Class | # Employees | % Employees |
| Private Company Employees | 16,083 | 55.9% |
| Self-Employed (Incorporated) | 1,938 | 6.7% |
| Self-Employed (Not Incorporated) | 3,254 | 11.3% |
| Not-for-profit Organizations | 2,386 | 8.3% |
| Local Government Employees | 2,766 | 9.6% |
| State Government Employees | 1,358 | 4.7% |
| Federal Government Employees | 913 | 3.2% |
| Unpaid Family Workers | 64 | 0.2% |
| Total | 28,762 | 100.0% |
Employment Status by Age in La Plata County
According to the labor force statistics for La Plata County, out of the total population over 16 years of age (46,877), 64.5% or 30,236 individuals are in the labor force, with 3.2% or 968 of them unemployed. The age group with the highest labor force participation rate is 30 to 34 years, with 87.3% or 3,164 individuals in the labor force. Within the labor force, the 16 to 19 years age range has the highest percentage of unemployed individuals, with 12.3% or 176 of them being unemployed.
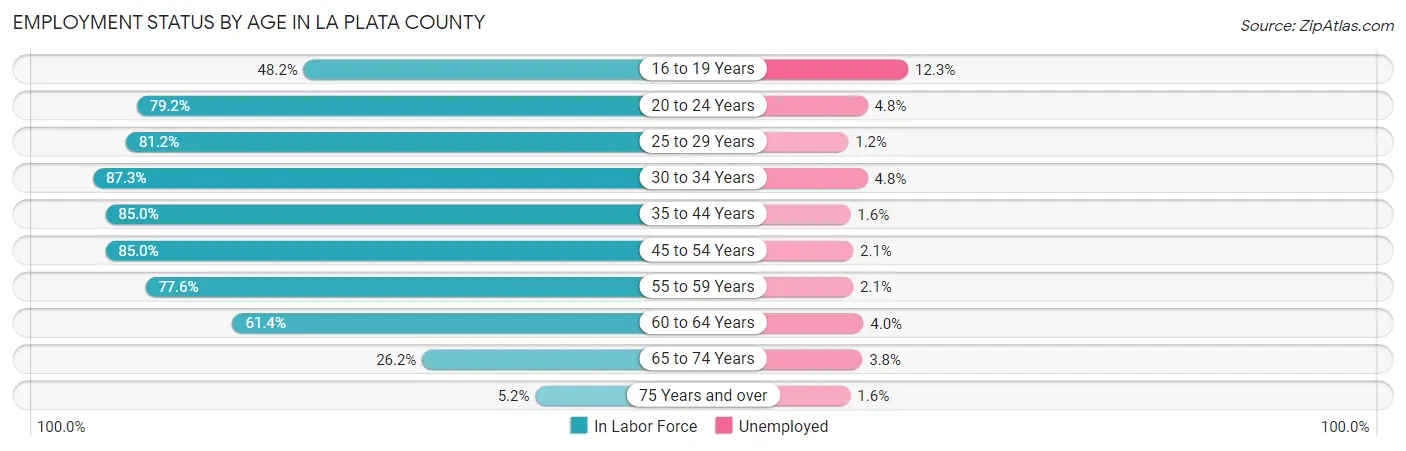
| Age Bracket | In Labor Force | Unemployed |
| 16 to 19 Years | 1,427 (48.2%) | 176 (12.3%) |
| 20 to 24 Years | 2,793 (79.2%) | 134 (4.8%) |
| 25 to 29 Years | 2,564 (81.2%) | 31 (1.2%) |
| 30 to 34 Years | 3,164 (87.3%) | 152 (4.8%) |
| 35 to 44 Years | 6,580 (85.0%) | 105 (1.6%) |
| 45 to 54 Years | 5,883 (85.0%) | 124 (2.1%) |
| 55 to 59 Years | 3,186 (77.6%) | 67 (2.1%) |
| 60 to 64 Years | 2,574 (61.4%) | 103 (4.0%) |
| 65 to 74 Years | 1,860 (26.2%) | 71 (3.8%) |
| 75 Years and over | 184 (5.2%) | 3 (1.6%) |
| Total | 30,236 (64.5%) | 968 (3.2%) |
Employment Status by Educational Attainment in La Plata County
According to labor force statistics for La Plata County, 80.5% of individuals (23,942) out of the total population between 25 and 64 years of age (29,742) are in the labor force, with 2.4% or 575 of them being unemployed. The group with the highest labor force participation rate are those with the educational attainment of bachelor's degree or higher, with 84.7% or 11,629 individuals in the labor force. Within the labor force, individuals with less than high school education have the highest percentage of unemployment, with 5.6% or 46 of them being unemployed.
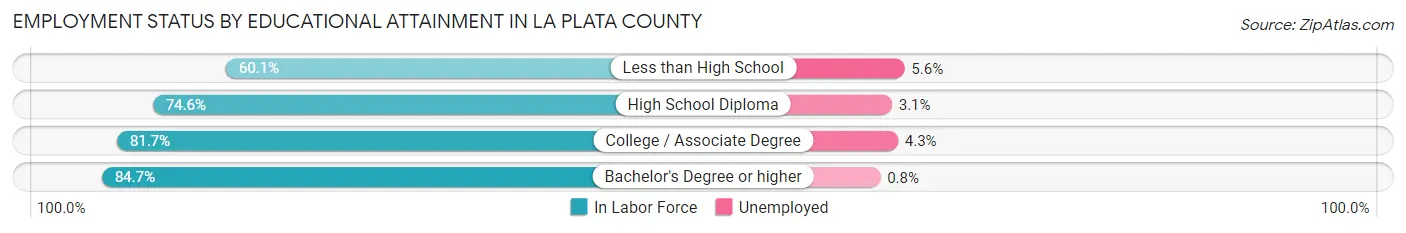
| Educational Attainment | In Labor Force | Unemployed |
| Less than High School | 815 (60.1%) | 76 (5.6%) |
| High School Diploma | 4,801 (74.6%) | 200 (3.1%) |
| College / Associate Degree | 6,716 (81.7%) | 353 (4.3%) |
| Bachelor's Degree or higher | 11,629 (84.7%) | 110 (0.8%) |
| Total | 23,942 (80.5%) | 714 (2.4%) |
Employment Occupations by Sex in La Plata County
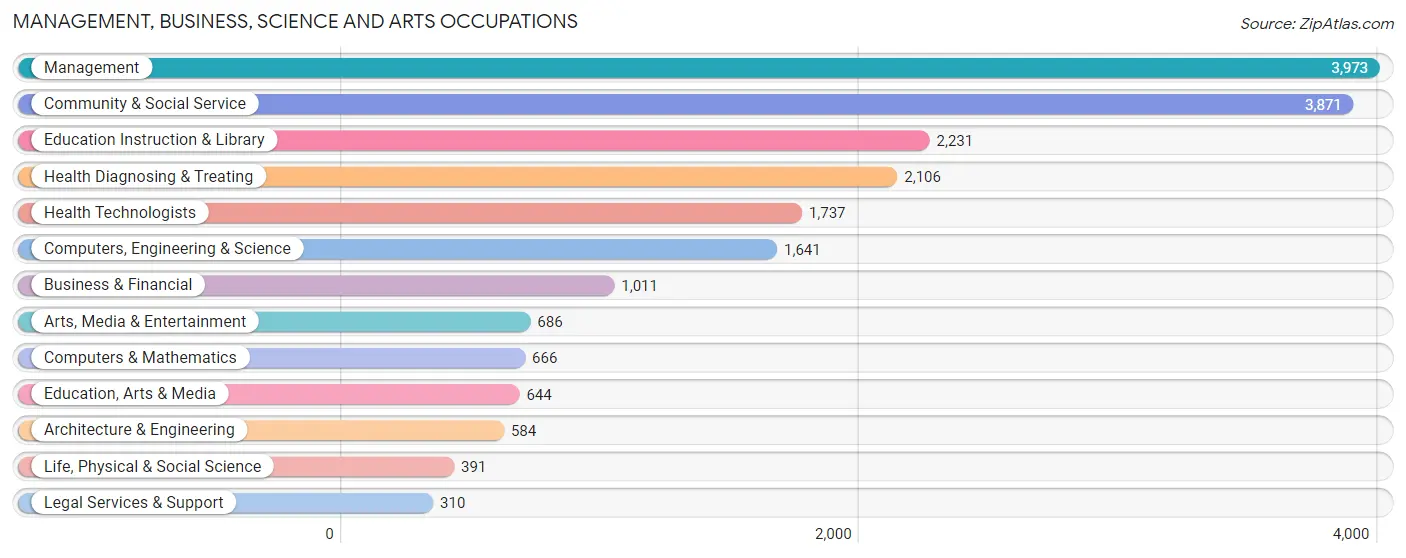
Management, Business, Science and Arts Occupations
The most common Management, Business, Science and Arts occupations in La Plata County are Management (3,973 | 13.6%), Community & Social Service (3,871 | 13.2%), Education Instruction & Library (2,231 | 7.6%), Health Diagnosing & Treating (2,106 | 7.2%), and Health Technologists (1,737 | 5.9%).
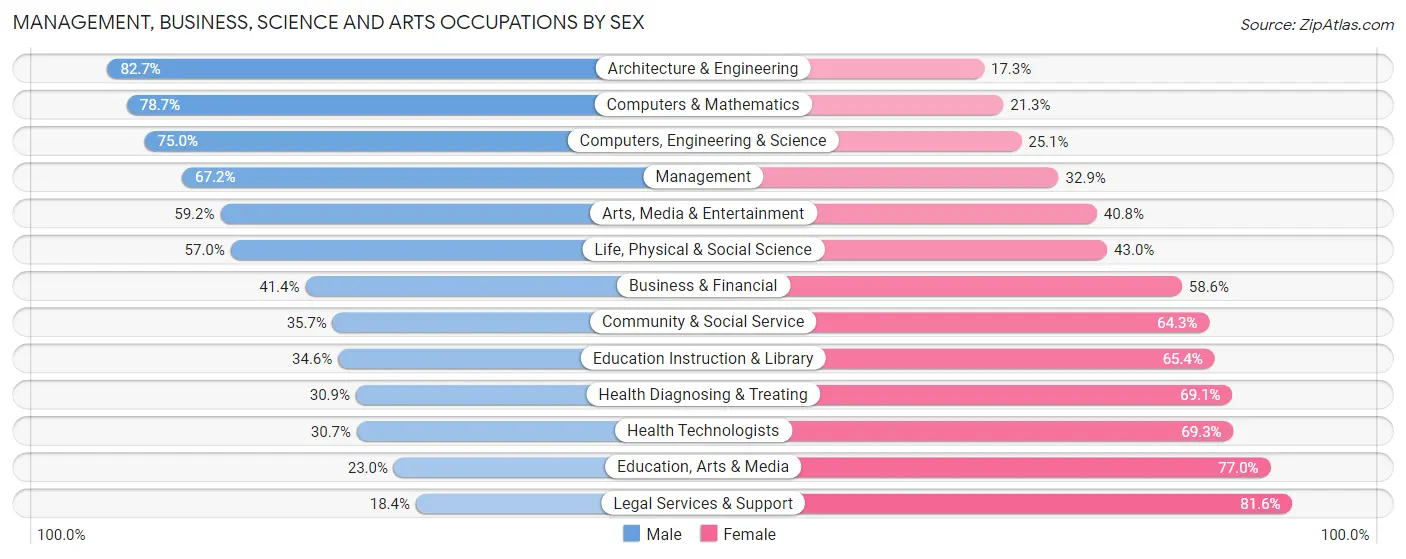
Management, Business, Science and Arts Occupations by Sex
Within the Management, Business, Science and Arts occupations in La Plata County, the most male-oriented occupations are Architecture & Engineering (82.7%), Computers & Mathematics (78.7%), and Computers, Engineering & Science (75.0%), while the most female-oriented occupations are Legal Services & Support (81.6%), Education, Arts & Media (77.0%), and Health Technologists (69.3%).
| Occupation | Male | Female |
| Management | 2,668 (67.1%) | 1,305 (32.9%) |
| Business & Financial | 419 (41.4%) | 592 (58.6%) |
| Computers, Engineering & Science | 1,230 (75.0%) | 411 (25.1%) |
| Computers & Mathematics | 524 (78.7%) | 142 (21.3%) |
| Architecture & Engineering | 483 (82.7%) | 101 (17.3%) |
| Life, Physical & Social Science | 223 (57.0%) | 168 (43.0%) |
| Community & Social Service | 1,383 (35.7%) | 2,488 (64.3%) |
| Education, Arts & Media | 148 (23.0%) | 496 (77.0%) |
| Legal Services & Support | 57 (18.4%) | 253 (81.6%) |
| Education Instruction & Library | 772 (34.6%) | 1,459 (65.4%) |
| Arts, Media & Entertainment | 406 (59.2%) | 280 (40.8%) |
| Health Diagnosing & Treating | 651 (30.9%) | 1,455 (69.1%) |
| Health Technologists | 533 (30.7%) | 1,204 (69.3%) |
| Total (Category) | 6,351 (50.4%) | 6,251 (49.6%) |
| Total (Overall) | 15,615 (53.4%) | 13,620 (46.6%) |
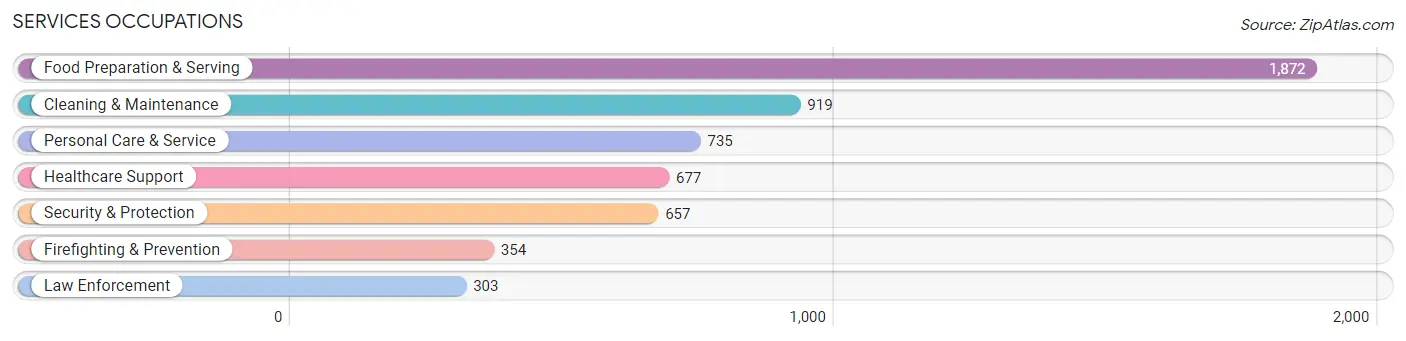
Services Occupations
The most common Services occupations in La Plata County are Food Preparation & Serving (1,872 | 6.4%), Cleaning & Maintenance (919 | 3.1%), Personal Care & Service (735 | 2.5%), Healthcare Support (677 | 2.3%), and Security & Protection (657 | 2.2%).
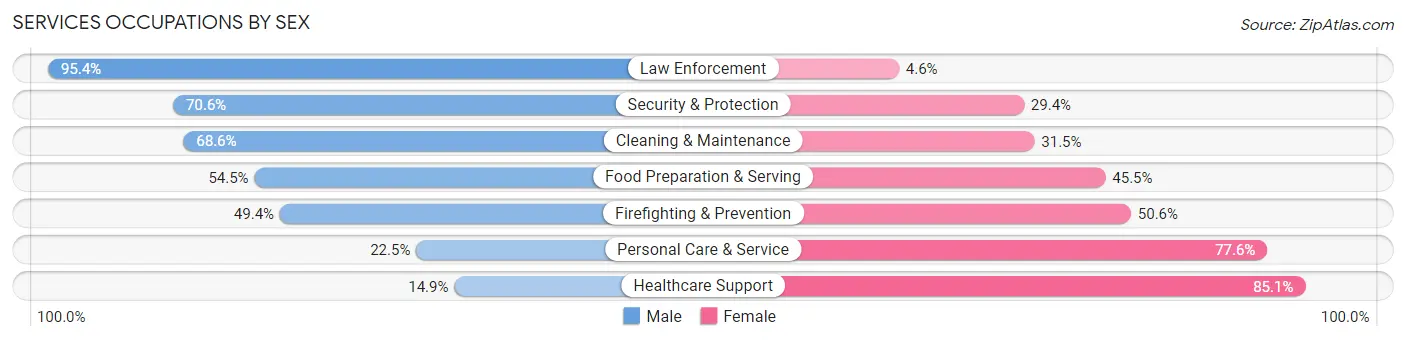
Services Occupations by Sex
Within the Services occupations in La Plata County, the most male-oriented occupations are Law Enforcement (95.4%), Security & Protection (70.6%), and Cleaning & Maintenance (68.5%), while the most female-oriented occupations are Healthcare Support (85.1%), Personal Care & Service (77.5%), and Firefighting & Prevention (50.6%).
| Occupation | Male | Female |
| Healthcare Support | 101 (14.9%) | 576 (85.1%) |
| Security & Protection | 464 (70.6%) | 193 (29.4%) |
| Firefighting & Prevention | 175 (49.4%) | 179 (50.6%) |
| Law Enforcement | 289 (95.4%) | 14 (4.6%) |
| Food Preparation & Serving | 1,020 (54.5%) | 852 (45.5%) |
| Cleaning & Maintenance | 630 (68.5%) | 289 (31.5%) |
| Personal Care & Service | 165 (22.5%) | 570 (77.5%) |
| Total (Category) | 2,380 (49.0%) | 2,480 (51.0%) |
| Total (Overall) | 15,615 (53.4%) | 13,620 (46.6%) |
Sales and Office Occupations
The most common Sales and Office occupations in La Plata County are Sales & Related (3,666 | 12.5%), and Office & Administration (2,980 | 10.2%).
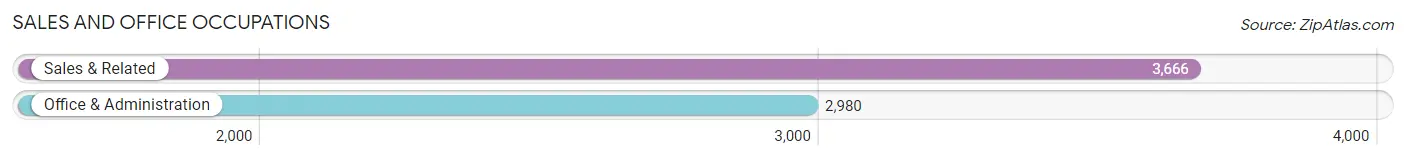
Sales and Office Occupations by Sex

| Occupation | Male | Female |
| Sales & Related | 1,692 (46.2%) | 1,974 (53.8%) |
| Office & Administration | 662 (22.2%) | 2,318 (77.8%) |
| Total (Category) | 2,354 (35.4%) | 4,292 (64.6%) |
| Total (Overall) | 15,615 (53.4%) | 13,620 (46.6%) |
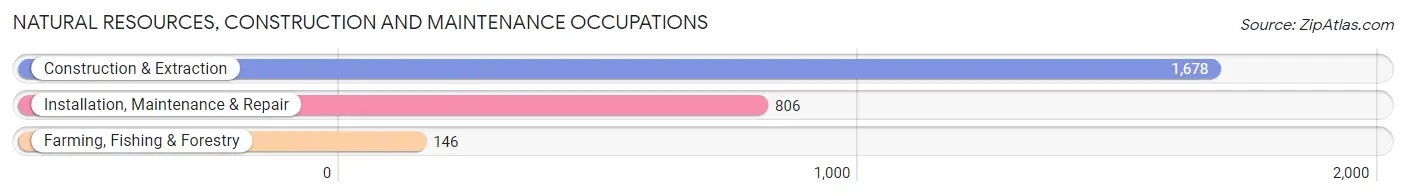
Natural Resources, Construction and Maintenance Occupations
The most common Natural Resources, Construction and Maintenance occupations in La Plata County are Construction & Extraction (1,678 | 5.7%), Installation, Maintenance & Repair (806 | 2.8%), and Farming, Fishing & Forestry (146 | 0.5%).
Natural Resources, Construction and Maintenance Occupations by Sex
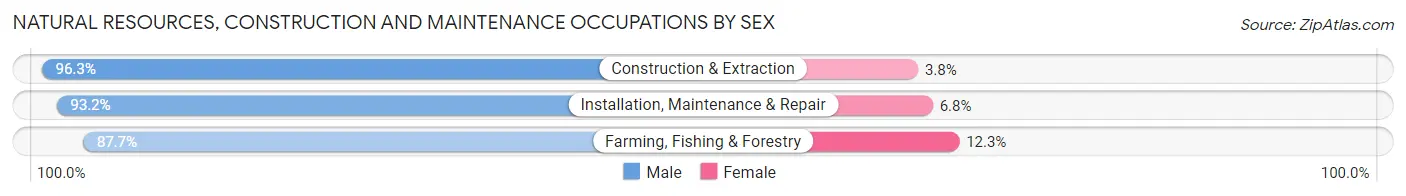
| Occupation | Male | Female |
| Farming, Fishing & Forestry | 128 (87.7%) | 18 (12.3%) |
| Construction & Extraction | 1,615 (96.3%) | 63 (3.7%) |
| Installation, Maintenance & Repair | 751 (93.2%) | 55 (6.8%) |
| Total (Category) | 2,494 (94.8%) | 136 (5.2%) |
| Total (Overall) | 15,615 (53.4%) | 13,620 (46.6%) |
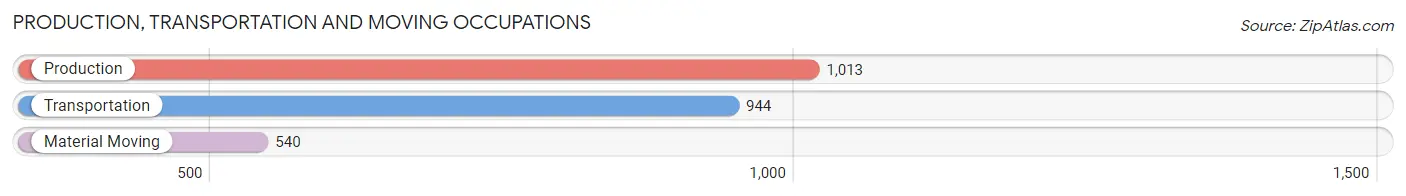
Production, Transportation and Moving Occupations
The most common Production, Transportation and Moving occupations in La Plata County are Production (1,013 | 3.5%), Transportation (944 | 3.2%), and Material Moving (540 | 1.8%).
Production, Transportation and Moving Occupations by Sex
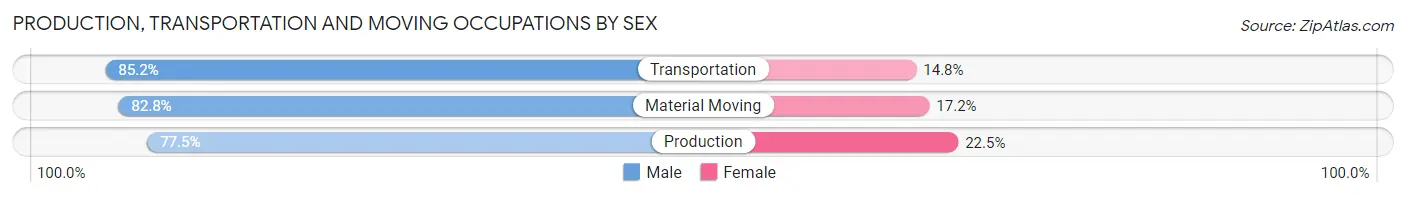
| Occupation | Male | Female |
| Production | 785 (77.5%) | 228 (22.5%) |
| Transportation | 804 (85.2%) | 140 (14.8%) |
| Material Moving | 447 (82.8%) | 93 (17.2%) |
| Total (Category) | 2,036 (81.5%) | 461 (18.5%) |
| Total (Overall) | 15,615 (53.4%) | 13,620 (46.6%) |
Employment Industries by Sex in La Plata County
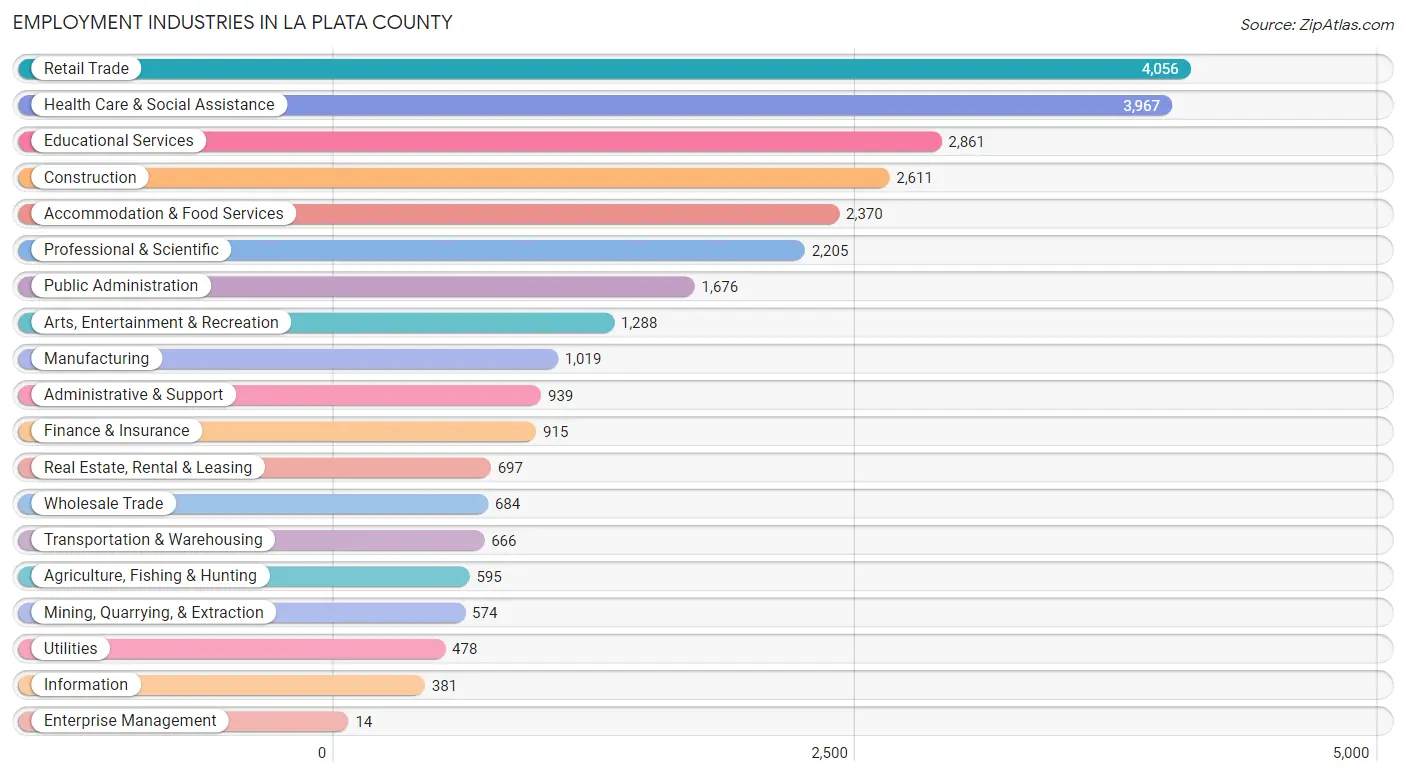
Employment Industries in La Plata County
The major employment industries in La Plata County include Retail Trade (4,056 | 13.9%), Health Care & Social Assistance (3,967 | 13.6%), Educational Services (2,861 | 9.8%), Construction (2,611 | 8.9%), and Accommodation & Food Services (2,370 | 8.1%).
Employment Industries by Sex in La Plata County
The La Plata County industries that see more men than women are Construction (94.6%), Wholesale Trade (82.9%), and Mining, Quarrying, & Extraction (82.4%), whereas the industries that tend to have a higher number of women are Health Care & Social Assistance (75.5%), Finance & Insurance (65.1%), and Real Estate, Rental & Leasing (61.1%).
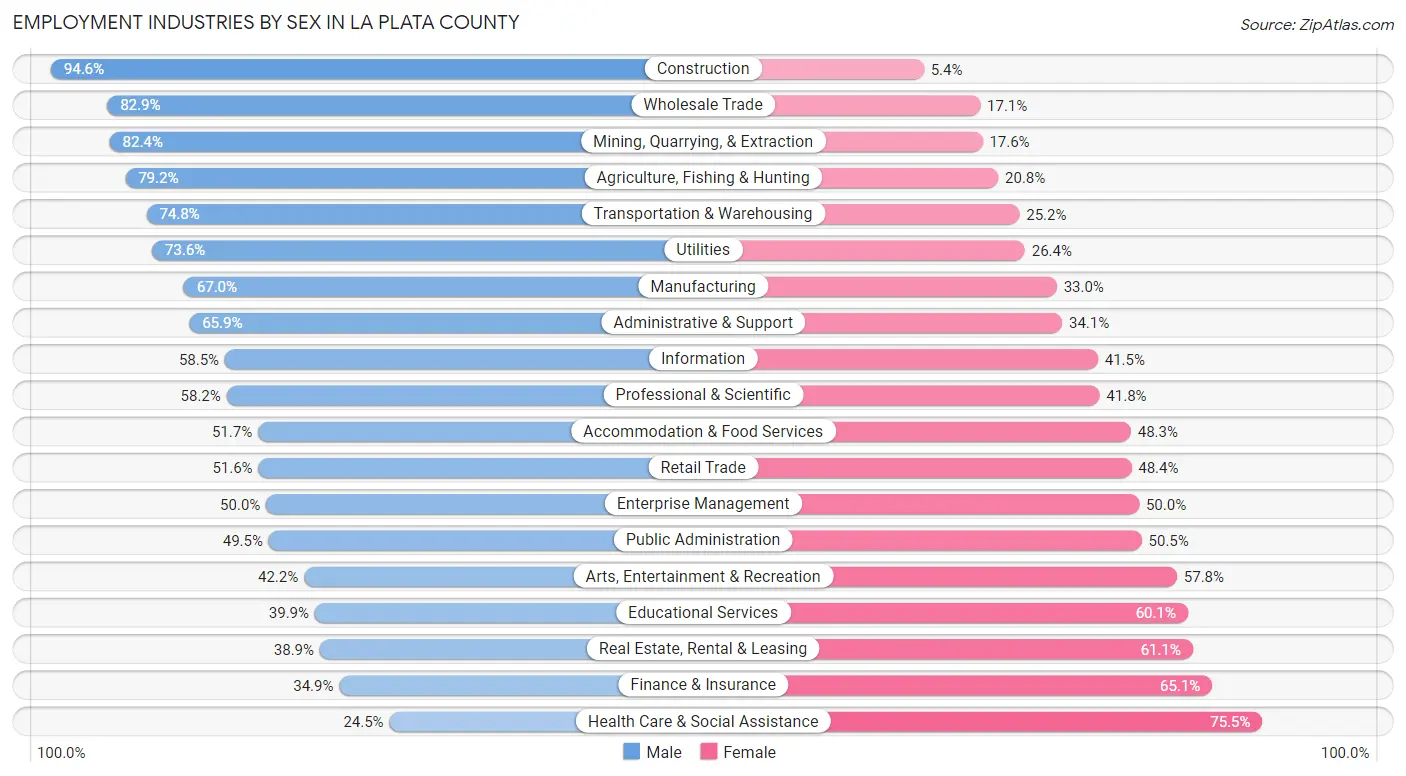
| Industry | Male | Female |
| Agriculture, Fishing & Hunting | 471 (79.2%) | 124 (20.8%) |
| Mining, Quarrying, & Extraction | 473 (82.4%) | 101 (17.6%) |
| Construction | 2,469 (94.6%) | 142 (5.4%) |
| Manufacturing | 683 (67.0%) | 336 (33.0%) |
| Wholesale Trade | 567 (82.9%) | 117 (17.1%) |
| Retail Trade | 2,093 (51.6%) | 1,963 (48.4%) |
| Transportation & Warehousing | 498 (74.8%) | 168 (25.2%) |
| Utilities | 352 (73.6%) | 126 (26.4%) |
| Information | 223 (58.5%) | 158 (41.5%) |
| Finance & Insurance | 319 (34.9%) | 596 (65.1%) |
| Real Estate, Rental & Leasing | 271 (38.9%) | 426 (61.1%) |
| Professional & Scientific | 1,283 (58.2%) | 922 (41.8%) |
| Enterprise Management | 7 (50.0%) | 7 (50.0%) |
| Administrative & Support | 619 (65.9%) | 320 (34.1%) |
| Educational Services | 1,142 (39.9%) | 1,719 (60.1%) |
| Health Care & Social Assistance | 971 (24.5%) | 2,996 (75.5%) |
| Arts, Entertainment & Recreation | 543 (42.2%) | 745 (57.8%) |
| Accommodation & Food Services | 1,225 (51.7%) | 1,145 (48.3%) |
| Public Administration | 829 (49.5%) | 847 (50.5%) |
| Total | 15,615 (53.4%) | 13,620 (46.6%) |
Education in La Plata County
School Enrollment in La Plata County
The most common levels of schooling among the 12,469 students in La Plata County are college / undergraduate (3,411 | 27.4%), high school (2,663 | 21.4%), and middle school (2,203 | 17.7%).
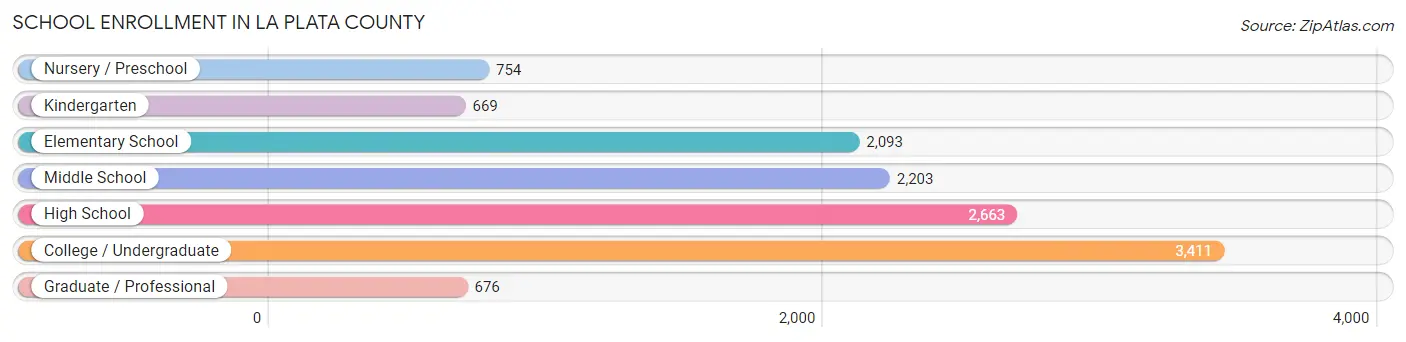
| School Level | # Students | % Students |
| Nursery / Preschool | 754 | 6.0% |
| Kindergarten | 669 | 5.4% |
| Elementary School | 2,093 | 16.8% |
| Middle School | 2,203 | 17.7% |
| High School | 2,663 | 21.4% |
| College / Undergraduate | 3,411 | 27.4% |
| Graduate / Professional | 676 | 5.4% |
| Total | 12,469 | 100.0% |
School Enrollment by Age by Funding Source in La Plata County
Out of a total of 12,469 students who are enrolled in schools in La Plata County, 1,758 (14.1%) attend a private institution, while the remaining 10,711 (85.9%) are enrolled in public schools. The age group of 3 to 4 year olds has the highest likelihood of being enrolled in private schools, with 256 (38.7% in the age bracket) enrolled. Conversely, the age group of 20 to 24 year olds has the lowest likelihood of being enrolled in a private school, with 1,583 (96.3% in the age bracket) attending a public institution.
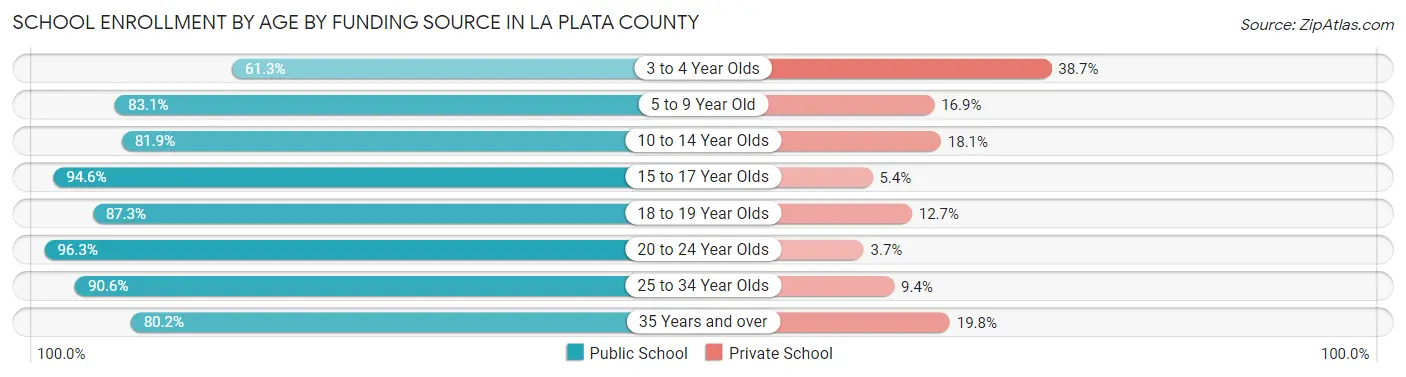
| Age Bracket | Public School | Private School |
| 3 to 4 Year Olds | 406 (61.3%) | 256 (38.7%) |
| 5 to 9 Year Old | 2,070 (83.1%) | 420 (16.9%) |
| 10 to 14 Year Olds | 2,457 (81.9%) | 543 (18.1%) |
| 15 to 17 Year Olds | 1,714 (94.6%) | 97 (5.4%) |
| 18 to 19 Year Olds | 1,273 (87.3%) | 185 (12.7%) |
| 20 to 24 Year Olds | 1,583 (96.3%) | 61 (3.7%) |
| 25 to 34 Year Olds | 713 (90.6%) | 74 (9.4%) |
| 35 Years and over | 495 (80.2%) | 122 (19.8%) |
| Total | 10,711 (85.9%) | 1,758 (14.1%) |
Educational Attainment by Field of Study in La Plata County
Business (2,958 | 14.2%), education (2,767 | 13.3%), social sciences (2,235 | 10.7%), bio, nature & agricultural (1,957 | 9.4%), and science & technology (1,925 | 9.2%) are the most common fields of study among 20,888 individuals in La Plata County who have obtained a bachelor's degree or higher.
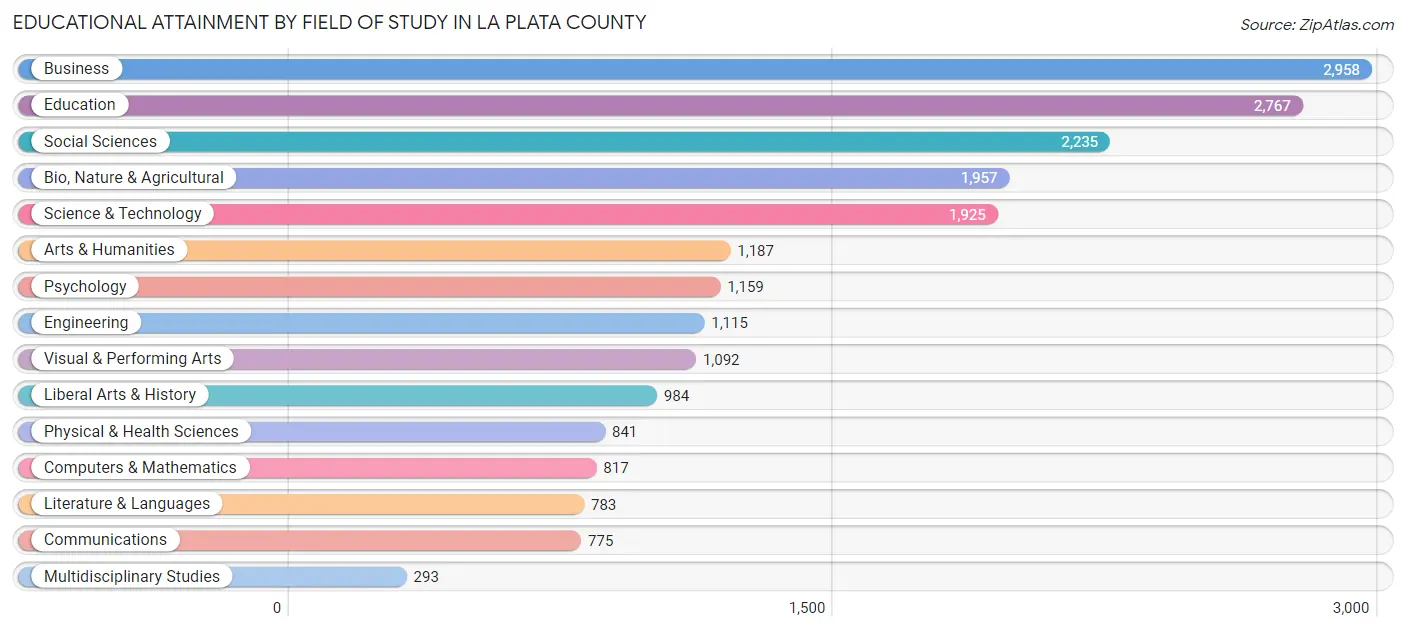
| Field of Study | # Graduates | % Graduates |
| Computers & Mathematics | 817 | 3.9% |
| Bio, Nature & Agricultural | 1,957 | 9.4% |
| Physical & Health Sciences | 841 | 4.0% |
| Psychology | 1,159 | 5.6% |
| Social Sciences | 2,235 | 10.7% |
| Engineering | 1,115 | 5.3% |
| Multidisciplinary Studies | 293 | 1.4% |
| Science & Technology | 1,925 | 9.2% |
| Business | 2,958 | 14.2% |
| Education | 2,767 | 13.3% |
| Literature & Languages | 783 | 3.7% |
| Liberal Arts & History | 984 | 4.7% |
| Visual & Performing Arts | 1,092 | 5.2% |
| Communications | 775 | 3.7% |
| Arts & Humanities | 1,187 | 5.7% |
| Total | 20,888 | 100.0% |
Transportation & Commute in La Plata County
Vehicle Availability by Sex in La Plata County
The most prevalent vehicle ownership categories in La Plata County are males with 2 vehicles (5,930, accounting for 39.1%) and females with 2 vehicles (5,291, making up 45.8%).
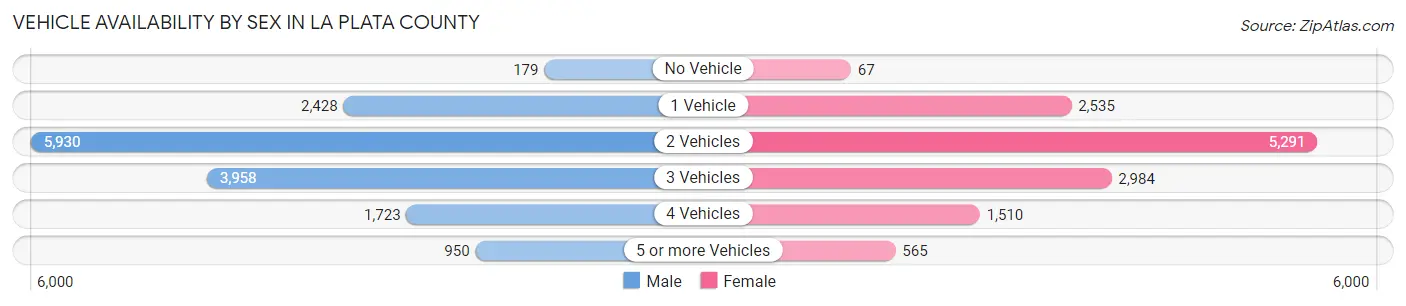
| Vehicles Available | Male | Female |
| No Vehicle | 179 (1.2%) | 67 (0.5%) |
| 1 Vehicle | 2,428 (16.0%) | 2,535 (19.6%) |
| 2 Vehicles | 5,930 (39.1%) | 5,291 (40.8%) |
| 3 Vehicles | 3,958 (26.1%) | 2,984 (23.0%) |
| 4 Vehicles | 1,723 (11.4%) | 1,510 (11.7%) |
| 5 or more Vehicles | 950 (6.3%) | 565 (4.4%) |
| Total | 15,168 (100.0%) | 12,952 (100.0%) |
Commute Time in La Plata County
The most frequently occuring commute durations in La Plata County are 10 to 14 minutes (4,127 commuters, 17.0%), 15 to 19 minutes (3,983 commuters, 16.4%), and 20 to 24 minutes (3,603 commuters, 14.9%).
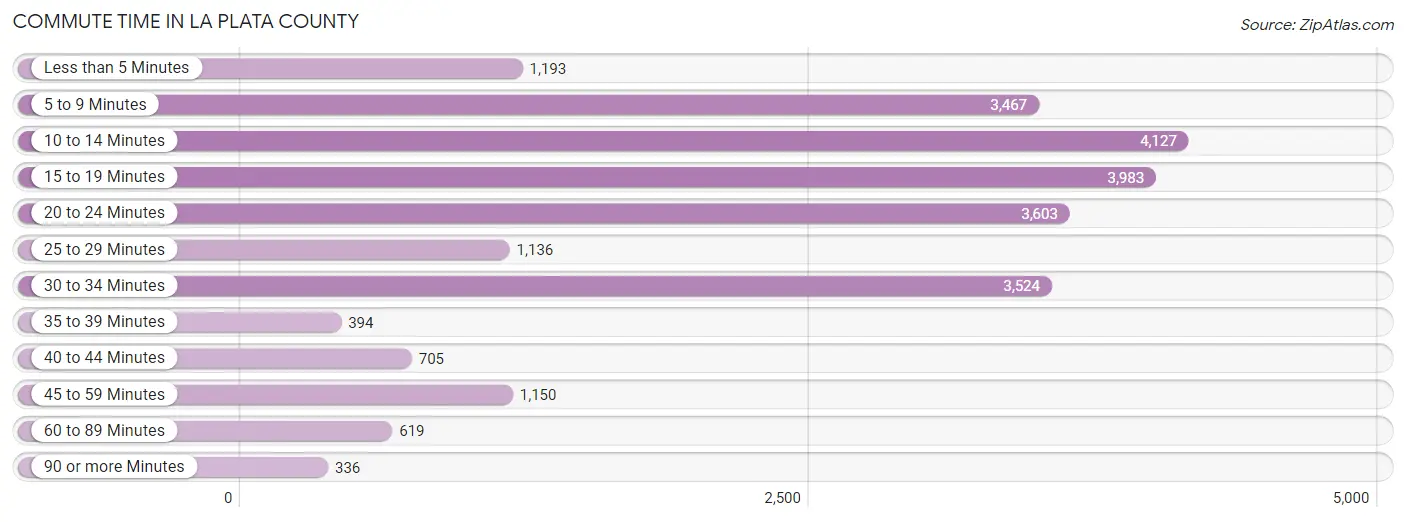
| Commute Time | # Commuters | % Commuters |
| Less than 5 Minutes | 1,193 | 4.9% |
| 5 to 9 Minutes | 3,467 | 14.3% |
| 10 to 14 Minutes | 4,127 | 17.0% |
| 15 to 19 Minutes | 3,983 | 16.4% |
| 20 to 24 Minutes | 3,603 | 14.9% |
| 25 to 29 Minutes | 1,136 | 4.7% |
| 30 to 34 Minutes | 3,524 | 14.5% |
| 35 to 39 Minutes | 394 | 1.6% |
| 40 to 44 Minutes | 705 | 2.9% |
| 45 to 59 Minutes | 1,150 | 4.7% |
| 60 to 89 Minutes | 619 | 2.5% |
| 90 or more Minutes | 336 | 1.4% |
Commute Time by Sex in La Plata County
The most common commute times in La Plata County are 30 to 34 minutes (2,284 commuters, 17.5%) for males and 10 to 14 minutes (2,181 commuters, 19.5%) for females.
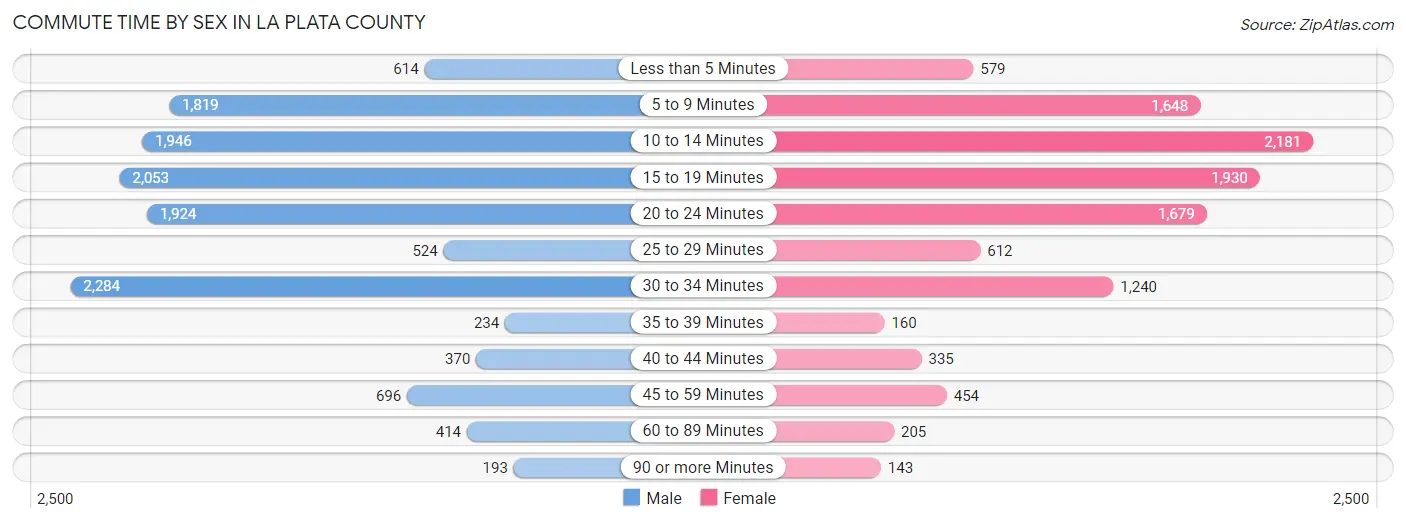
| Commute Time | Male | Female |
| Less than 5 Minutes | 614 (4.7%) | 579 (5.2%) |
| 5 to 9 Minutes | 1,819 (13.9%) | 1,648 (14.8%) |
| 10 to 14 Minutes | 1,946 (14.9%) | 2,181 (19.5%) |
| 15 to 19 Minutes | 2,053 (15.7%) | 1,930 (17.3%) |
| 20 to 24 Minutes | 1,924 (14.7%) | 1,679 (15.0%) |
| 25 to 29 Minutes | 524 (4.0%) | 612 (5.5%) |
| 30 to 34 Minutes | 2,284 (17.5%) | 1,240 (11.1%) |
| 35 to 39 Minutes | 234 (1.8%) | 160 (1.4%) |
| 40 to 44 Minutes | 370 (2.8%) | 335 (3.0%) |
| 45 to 59 Minutes | 696 (5.3%) | 454 (4.1%) |
| 60 to 89 Minutes | 414 (3.2%) | 205 (1.8%) |
| 90 or more Minutes | 193 (1.5%) | 143 (1.3%) |
Time of Departure to Work by Sex in La Plata County
The most frequent times of departure to work in La Plata County are 7:30 AM to 7:59 AM (2,217, 17.0%) for males and 7:30 AM to 7:59 AM (2,115, 18.9%) for females.
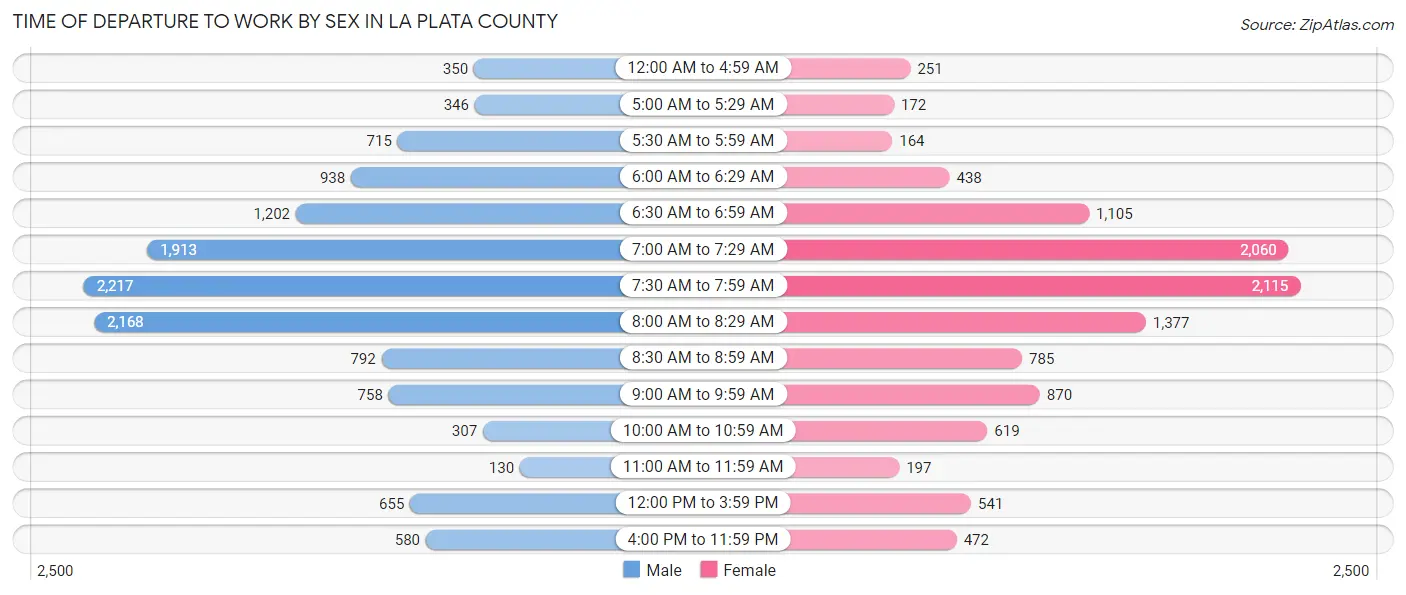
| Time of Departure | Male | Female |
| 12:00 AM to 4:59 AM | 350 (2.7%) | 251 (2.2%) |
| 5:00 AM to 5:29 AM | 346 (2.6%) | 172 (1.5%) |
| 5:30 AM to 5:59 AM | 715 (5.5%) | 164 (1.5%) |
| 6:00 AM to 6:29 AM | 938 (7.2%) | 438 (3.9%) |
| 6:30 AM to 6:59 AM | 1,202 (9.2%) | 1,105 (9.9%) |
| 7:00 AM to 7:29 AM | 1,913 (14.6%) | 2,060 (18.4%) |
| 7:30 AM to 7:59 AM | 2,217 (17.0%) | 2,115 (18.9%) |
| 8:00 AM to 8:29 AM | 2,168 (16.6%) | 1,377 (12.3%) |
| 8:30 AM to 8:59 AM | 792 (6.1%) | 785 (7.0%) |
| 9:00 AM to 9:59 AM | 758 (5.8%) | 870 (7.8%) |
| 10:00 AM to 10:59 AM | 307 (2.4%) | 619 (5.5%) |
| 11:00 AM to 11:59 AM | 130 (1.0%) | 197 (1.8%) |
| 12:00 PM to 3:59 PM | 655 (5.0%) | 541 (4.9%) |
| 4:00 PM to 11:59 PM | 580 (4.4%) | 472 (4.2%) |
| Total | 13,071 (100.0%) | 11,166 (100.0%) |
Housing Occupancy in La Plata County
Occupancy by Ownership in La Plata County
Of the total 22,691 dwellings in La Plata County, owner-occupied units account for 16,036 (70.7%), while renter-occupied units make up 6,655 (29.3%).
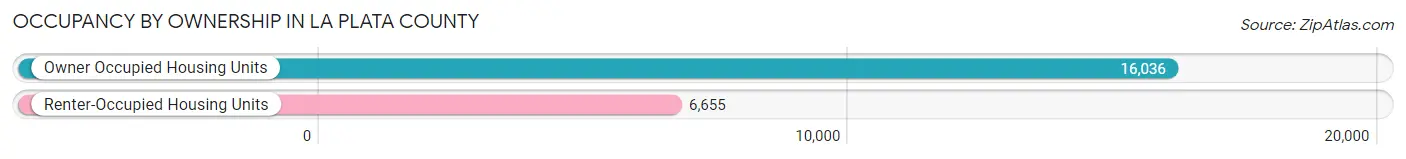
| Occupancy | # Housing Units | % Housing Units |
| Owner Occupied Housing Units | 16,036 | 70.7% |
| Renter-Occupied Housing Units | 6,655 | 29.3% |
| Total Occupied Housing Units | 22,691 | 100.0% |
Occupancy by Household Size in La Plata County
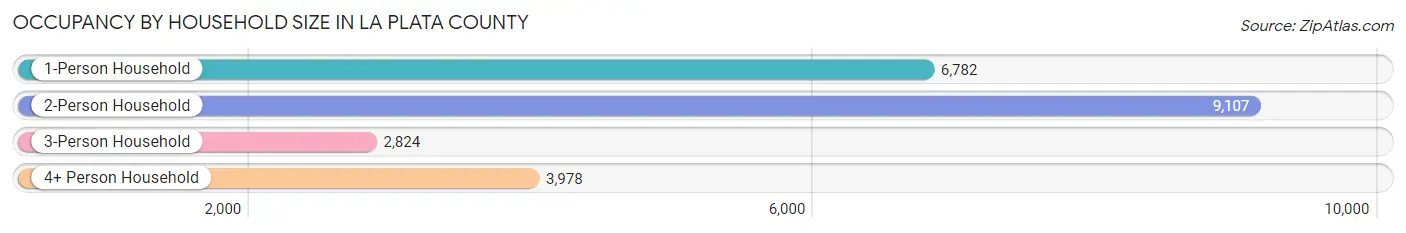
| Household Size | # Housing Units | % Housing Units |
| 1-Person Household | 6,782 | 29.9% |
| 2-Person Household | 9,107 | 40.1% |
| 3-Person Household | 2,824 | 12.4% |
| 4+ Person Household | 3,978 | 17.5% |
| Total Housing Units | 22,691 | 100.0% |
Occupancy by Ownership by Household Size in La Plata County
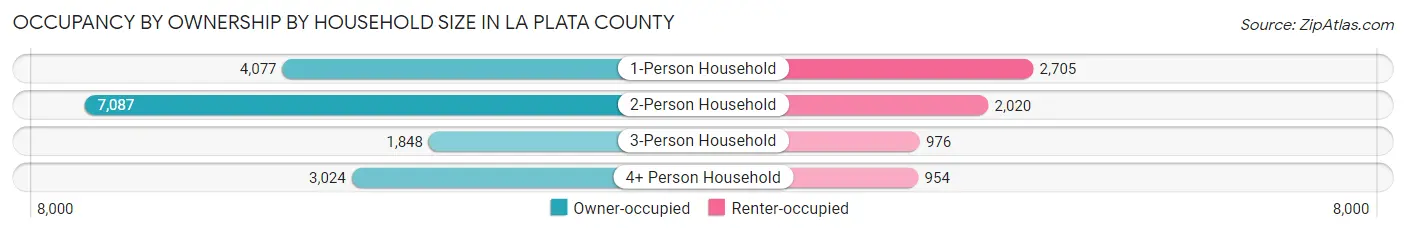
| Household Size | Owner-occupied | Renter-occupied |
| 1-Person Household | 4,077 (60.1%) | 2,705 (39.9%) |
| 2-Person Household | 7,087 (77.8%) | 2,020 (22.2%) |
| 3-Person Household | 1,848 (65.4%) | 976 (34.6%) |
| 4+ Person Household | 3,024 (76.0%) | 954 (24.0%) |
| Total Housing Units | 16,036 (70.7%) | 6,655 (29.3%) |
Occupancy by Educational Attainment in La Plata County
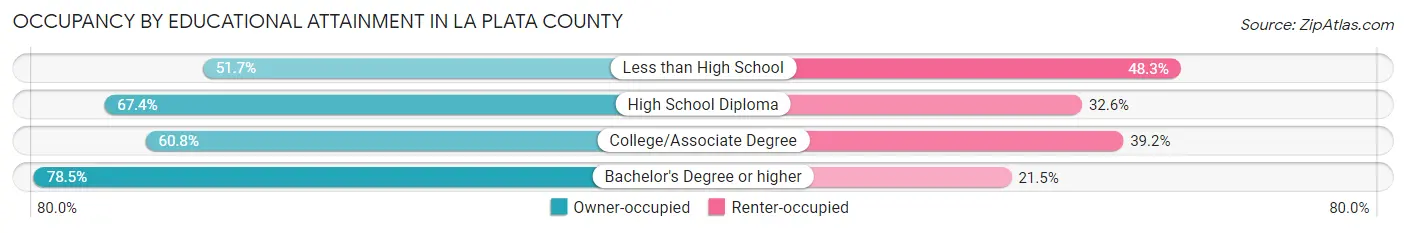
| Household Size | Owner-occupied | Renter-occupied |
| Less than High School | 327 (51.7%) | 305 (48.3%) |
| High School Diploma | 2,836 (67.4%) | 1,374 (32.6%) |
| College/Associate Degree | 3,927 (60.8%) | 2,531 (39.2%) |
| Bachelor's Degree or higher | 8,946 (78.5%) | 2,445 (21.5%) |
Occupancy by Age of Householder in La Plata County
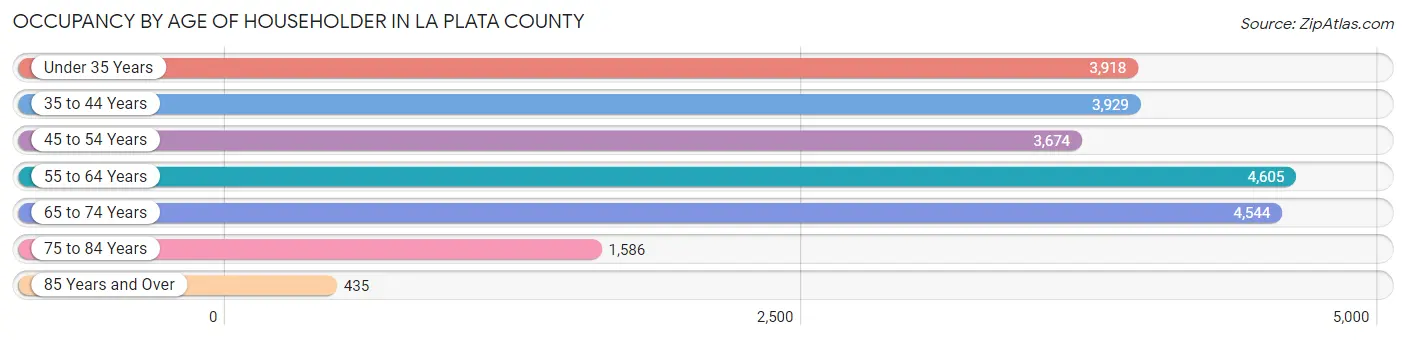
| Age Bracket | # Households | % Households |
| Under 35 Years | 3,918 | 17.3% |
| 35 to 44 Years | 3,929 | 17.3% |
| 45 to 54 Years | 3,674 | 16.2% |
| 55 to 64 Years | 4,605 | 20.3% |
| 65 to 74 Years | 4,544 | 20.0% |
| 75 to 84 Years | 1,586 | 7.0% |
| 85 Years and Over | 435 | 1.9% |
| Total | 22,691 | 100.0% |
Housing Finances in La Plata County
Median Income by Occupancy in La Plata County
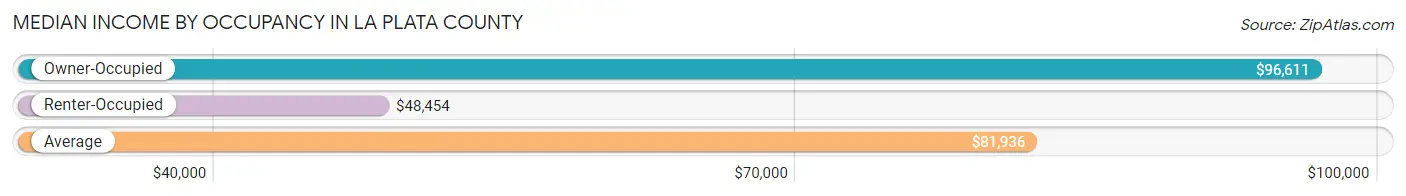
| Occupancy Type | # Households | Median Income |
| Owner-Occupied | 16,036 (70.7%) | $96,611 |
| Renter-Occupied | 6,655 (29.3%) | $48,454 |
| Average | 22,691 (100.0%) | $81,936 |
Occupancy by Householder Income Bracket in La Plata County
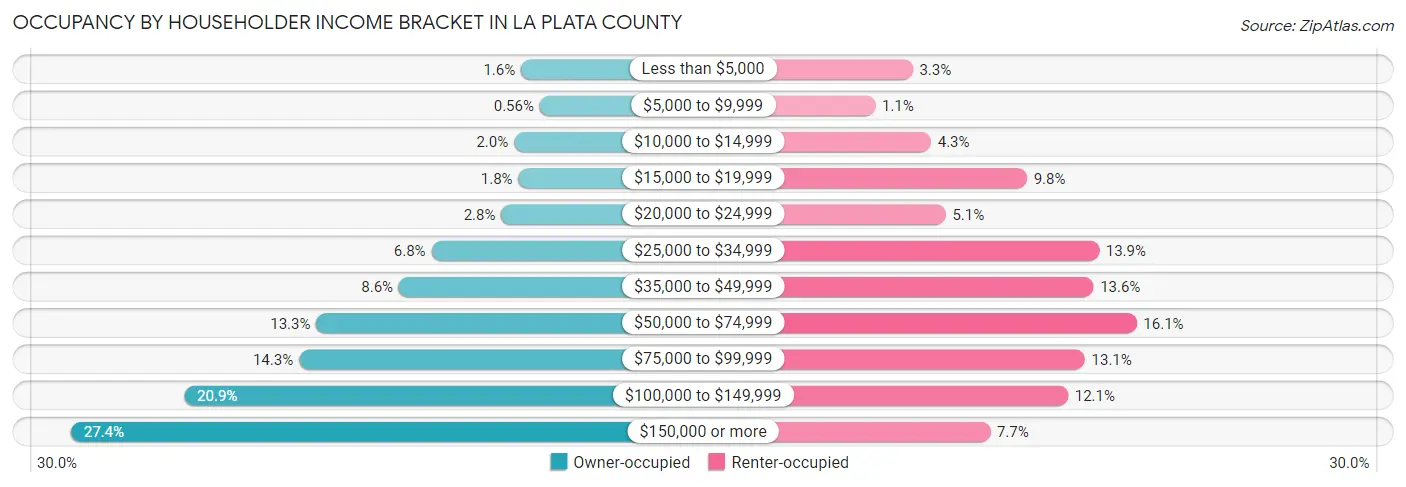
| Income Bracket | Owner-occupied | Renter-occupied |
| Less than $5,000 | 261 (1.6%) | 216 (3.3%) |
| $5,000 to $9,999 | 89 (0.6%) | 74 (1.1%) |
| $10,000 to $14,999 | 326 (2.0%) | 286 (4.3%) |
| $15,000 to $19,999 | 285 (1.8%) | 651 (9.8%) |
| $20,000 to $24,999 | 443 (2.8%) | 342 (5.1%) |
| $25,000 to $34,999 | 1,082 (6.8%) | 925 (13.9%) |
| $35,000 to $49,999 | 1,380 (8.6%) | 904 (13.6%) |
| $50,000 to $74,999 | 2,137 (13.3%) | 1,068 (16.1%) |
| $75,000 to $99,999 | 2,297 (14.3%) | 871 (13.1%) |
| $100,000 to $149,999 | 3,349 (20.9%) | 807 (12.1%) |
| $150,000 or more | 4,387 (27.4%) | 511 (7.7%) |
| Total | 16,036 (100.0%) | 6,655 (100.0%) |
Monthly Housing Cost Tiers in La Plata County
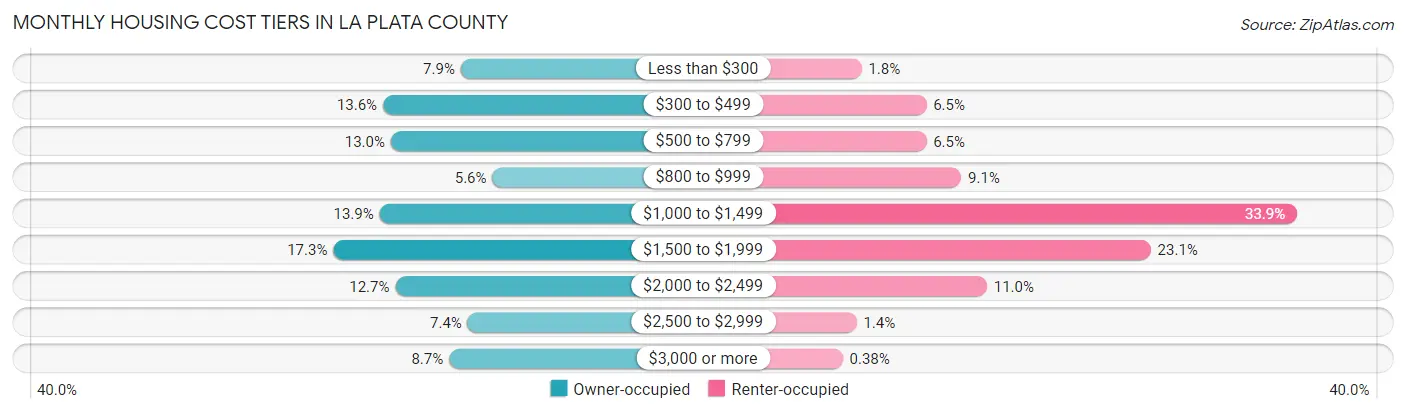
| Monthly Cost | Owner-occupied | Renter-occupied |
| Less than $300 | 1,263 (7.9%) | 118 (1.8%) |
| $300 to $499 | 2,182 (13.6%) | 435 (6.5%) |
| $500 to $799 | 2,090 (13.0%) | 435 (6.5%) |
| $800 to $999 | 890 (5.6%) | 606 (9.1%) |
| $1,000 to $1,499 | 2,222 (13.9%) | 2,253 (33.9%) |
| $1,500 to $1,999 | 2,769 (17.3%) | 1,535 (23.1%) |
| $2,000 to $2,499 | 2,036 (12.7%) | 732 (11.0%) |
| $2,500 to $2,999 | 1,182 (7.4%) | 93 (1.4%) |
| $3,000 or more | 1,402 (8.7%) | 25 (0.4%) |
| Total | 16,036 (100.0%) | 6,655 (100.0%) |
Physical Housing Characteristics in La Plata County
Housing Structures in La Plata County
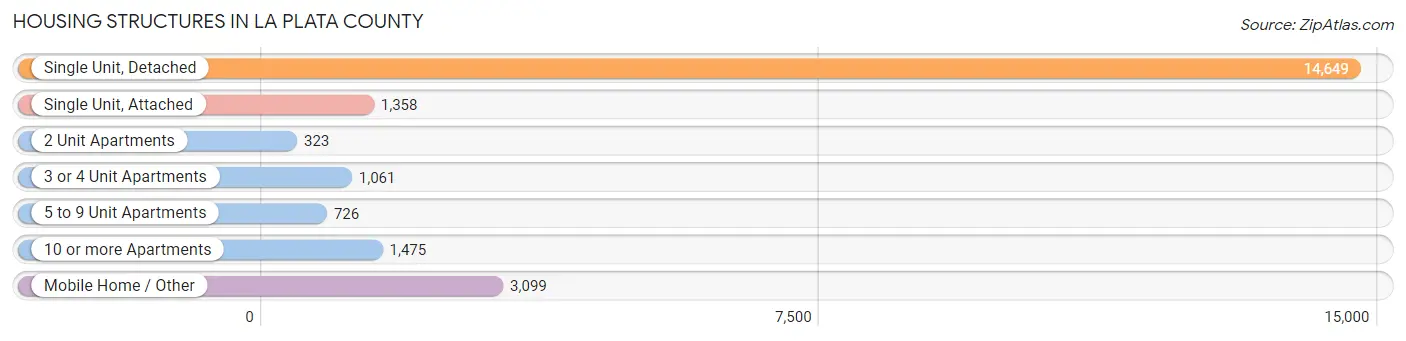
| Structure Type | # Housing Units | % Housing Units |
| Single Unit, Detached | 14,649 | 64.6% |
| Single Unit, Attached | 1,358 | 6.0% |
| 2 Unit Apartments | 323 | 1.4% |
| 3 or 4 Unit Apartments | 1,061 | 4.7% |
| 5 to 9 Unit Apartments | 726 | 3.2% |
| 10 or more Apartments | 1,475 | 6.5% |
| Mobile Home / Other | 3,099 | 13.7% |
| Total | 22,691 | 100.0% |
Housing Structures by Occupancy in La Plata County
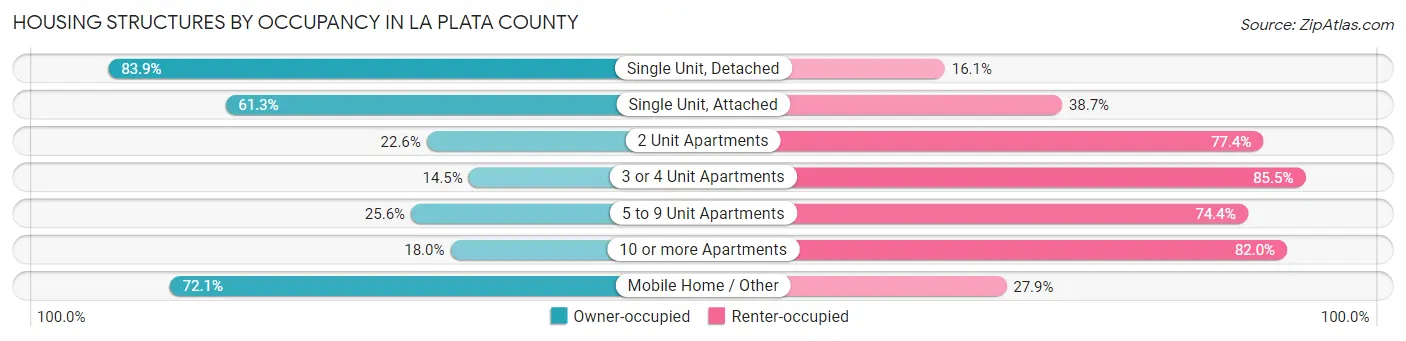
| Structure Type | Owner-occupied | Renter-occupied |
| Single Unit, Detached | 12,291 (83.9%) | 2,358 (16.1%) |
| Single Unit, Attached | 833 (61.3%) | 525 (38.7%) |
| 2 Unit Apartments | 73 (22.6%) | 250 (77.4%) |
| 3 or 4 Unit Apartments | 154 (14.5%) | 907 (85.5%) |
| 5 to 9 Unit Apartments | 186 (25.6%) | 540 (74.4%) |
| 10 or more Apartments | 266 (18.0%) | 1,209 (82.0%) |
| Mobile Home / Other | 2,233 (72.1%) | 866 (27.9%) |
| Total | 16,036 (70.7%) | 6,655 (29.3%) |
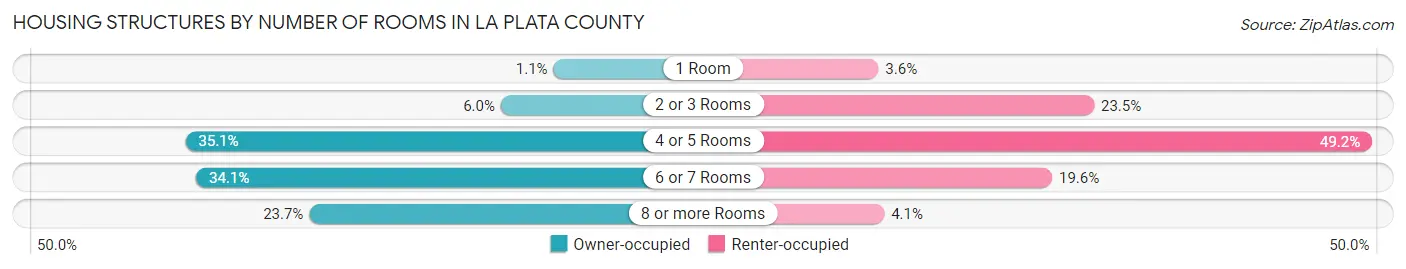
Housing Structures by Number of Rooms in La Plata County
| Number of Rooms | Owner-occupied | Renter-occupied |
| 1 Room | 175 (1.1%) | 237 (3.6%) |
| 2 or 3 Rooms | 955 (6.0%) | 1,564 (23.5%) |
| 4 or 5 Rooms | 5,633 (35.1%) | 3,275 (49.2%) |
| 6 or 7 Rooms | 5,475 (34.1%) | 1,306 (19.6%) |
| 8 or more Rooms | 3,798 (23.7%) | 273 (4.1%) |
| Total | 16,036 (100.0%) | 6,655 (100.0%) |
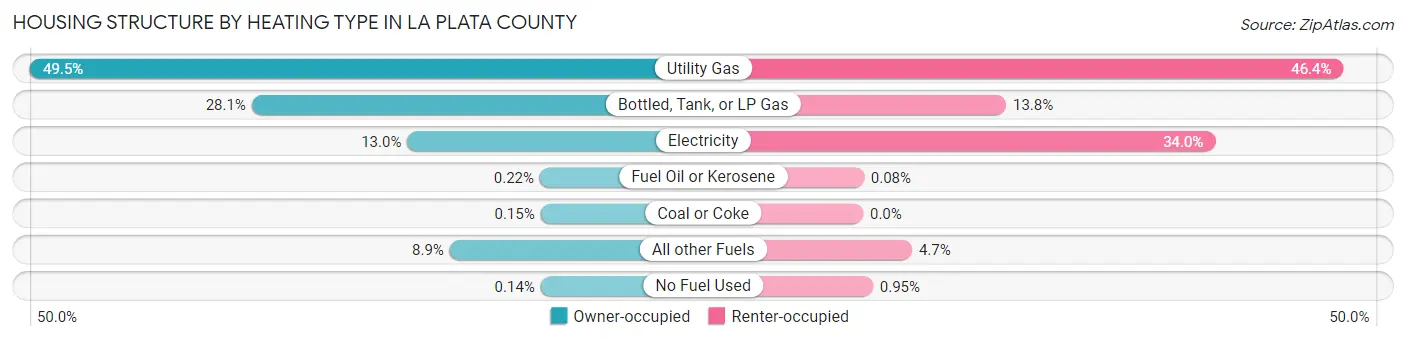
Housing Structure by Heating Type in La Plata County
| Heating Type | Owner-occupied | Renter-occupied |
| Utility Gas | 7,934 (49.5%) | 3,088 (46.4%) |
| Bottled, Tank, or LP Gas | 4,499 (28.1%) | 920 (13.8%) |
| Electricity | 2,090 (13.0%) | 2,264 (34.0%) |
| Fuel Oil or Kerosene | 35 (0.2%) | 5 (0.1%) |
| Coal or Coke | 24 (0.2%) | 0 (0.0%) |
| All other Fuels | 1,432 (8.9%) | 315 (4.7%) |
| No Fuel Used | 22 (0.1%) | 63 (0.9%) |
| Total | 16,036 (100.0%) | 6,655 (100.0%) |
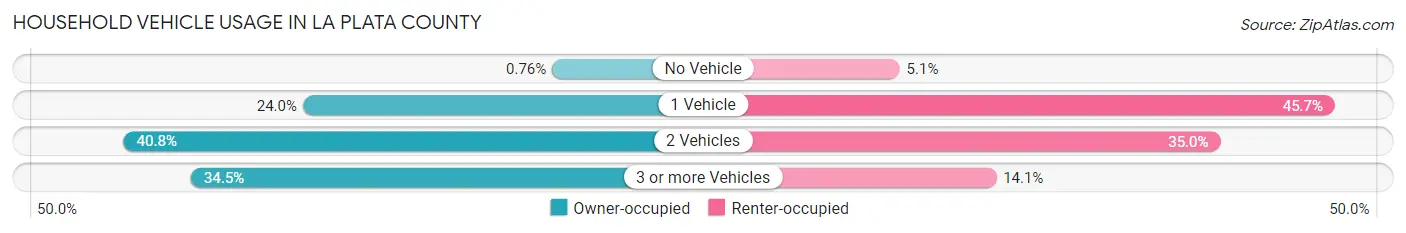
Household Vehicle Usage in La Plata County
| Vehicles per Household | Owner-occupied | Renter-occupied |
| No Vehicle | 122 (0.8%) | 340 (5.1%) |
| 1 Vehicle | 3,853 (24.0%) | 3,043 (45.7%) |
| 2 Vehicles | 6,534 (40.7%) | 2,332 (35.0%) |
| 3 or more Vehicles | 5,527 (34.5%) | 940 (14.1%) |
| Total | 16,036 (100.0%) | 6,655 (100.0%) |
Real Estate & Mortgages in La Plata County
Real Estate and Mortgage Overview in La Plata County
| Characteristic | Without Mortgage | With Mortgage |
| Housing Units | 6,427 | 9,609 |
| Median Property Value | $460,400 | $522,100 |
| Median Household Income | $69,474 | $3,153 |
| Monthly Housing Costs | $481 | $1,402 |
| Real Estate Taxes | $1,209 | $144 |
Property Value by Mortgage Status in La Plata County
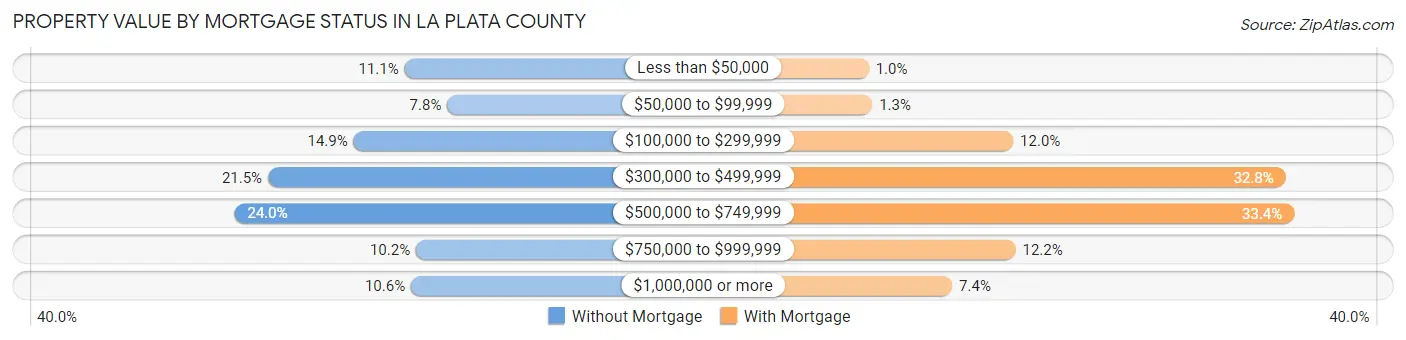
| Property Value | Without Mortgage | With Mortgage |
| Less than $50,000 | 710 (11.1%) | 96 (1.0%) |
| $50,000 to $99,999 | 501 (7.8%) | 122 (1.3%) |
| $100,000 to $299,999 | 960 (14.9%) | 1,154 (12.0%) |
| $300,000 to $499,999 | 1,379 (21.5%) | 3,149 (32.8%) |
| $500,000 to $749,999 | 1,544 (24.0%) | 3,210 (33.4%) |
| $750,000 to $999,999 | 654 (10.2%) | 1,171 (12.2%) |
| $1,000,000 or more | 679 (10.6%) | 707 (7.4%) |
| Total | 6,427 (100.0%) | 9,609 (100.0%) |
Household Income by Mortgage Status in La Plata County
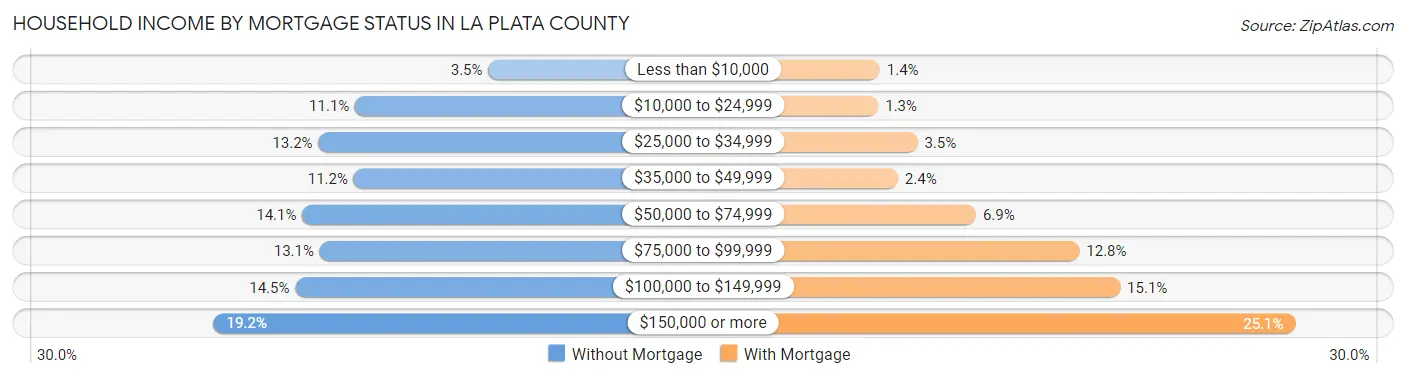
| Household Income | Without Mortgage | With Mortgage |
| Less than $10,000 | 225 (3.5%) | 134 (1.4%) |
| $10,000 to $24,999 | 714 (11.1%) | 125 (1.3%) |
| $25,000 to $34,999 | 849 (13.2%) | 340 (3.5%) |
| $35,000 to $49,999 | 719 (11.2%) | 233 (2.4%) |
| $50,000 to $74,999 | 908 (14.1%) | 661 (6.9%) |
| $75,000 to $99,999 | 844 (13.1%) | 1,229 (12.8%) |
| $100,000 to $149,999 | 934 (14.5%) | 1,453 (15.1%) |
| $150,000 or more | 1,234 (19.2%) | 2,415 (25.1%) |
| Total | 6,427 (100.0%) | 9,609 (100.0%) |
Property Value to Household Income Ratio in La Plata County
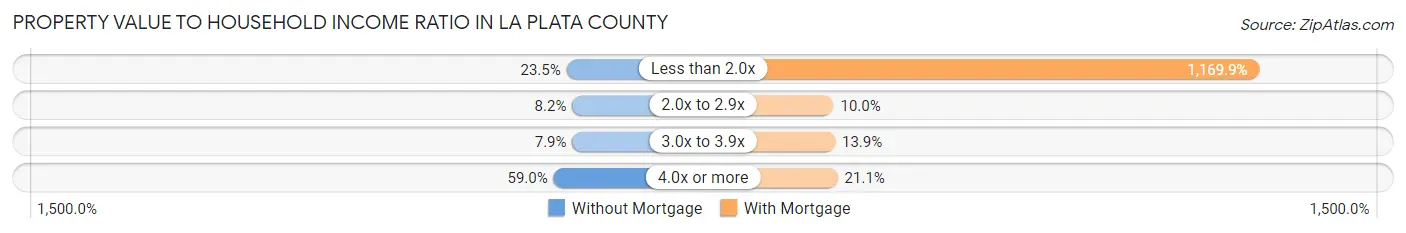
| Value-to-Income Ratio | Without Mortgage | With Mortgage |
| Less than 2.0x | 1,513 (23.5%) | 112,420 (1,169.9%) |
| 2.0x to 2.9x | 526 (8.2%) | 958 (10.0%) |
| 3.0x to 3.9x | 505 (7.9%) | 1,333 (13.9%) |
| 4.0x or more | 3,792 (59.0%) | 2,024 (21.1%) |
| Total | 6,427 (100.0%) | 9,609 (100.0%) |
Real Estate Taxes by Mortgage Status in La Plata County
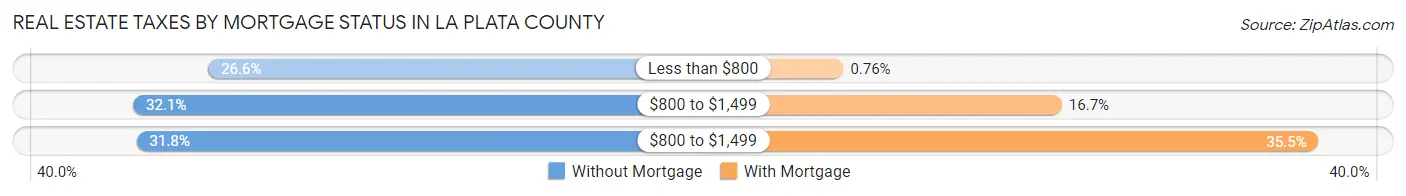
| Property Taxes | Without Mortgage | With Mortgage |
| Less than $800 | 1,709 (26.6%) | 73 (0.8%) |
| $800 to $1,499 | 2,061 (32.1%) | 1,607 (16.7%) |
| $800 to $1,499 | 2,045 (31.8%) | 3,408 (35.5%) |
| Total | 6,427 (100.0%) | 9,609 (100.0%) |
Health & Disability in La Plata County
Health Insurance Coverage by Age in La Plata County
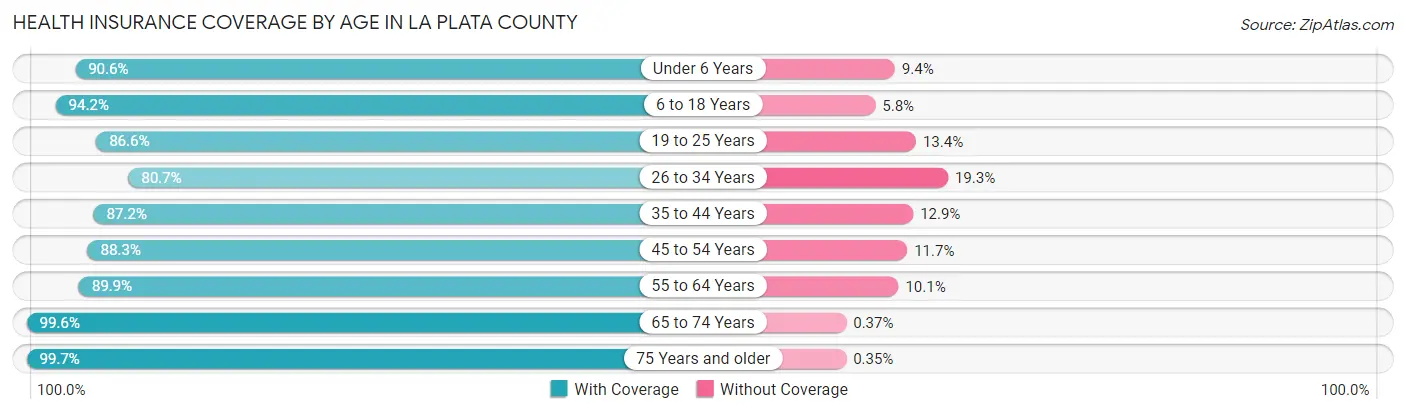
| Age Bracket | With Coverage | Without Coverage |
| Under 6 Years | 2,982 (90.6%) | 311 (9.4%) |
| 6 to 18 Years | 7,418 (94.2%) | 456 (5.8%) |
| 19 to 25 Years | 4,297 (86.6%) | 663 (13.4%) |
| 26 to 34 Years | 4,977 (80.7%) | 1,193 (19.3%) |
| 35 to 44 Years | 6,631 (87.2%) | 978 (12.9%) |
| 45 to 54 Years | 6,083 (88.3%) | 809 (11.7%) |
| 55 to 64 Years | 7,427 (89.9%) | 835 (10.1%) |
| 65 to 74 Years | 7,036 (99.6%) | 26 (0.4%) |
| 75 Years and older | 3,446 (99.7%) | 12 (0.4%) |
| Total | 50,297 (90.5%) | 5,283 (9.5%) |
Health Insurance Coverage by Citizenship Status in La Plata County
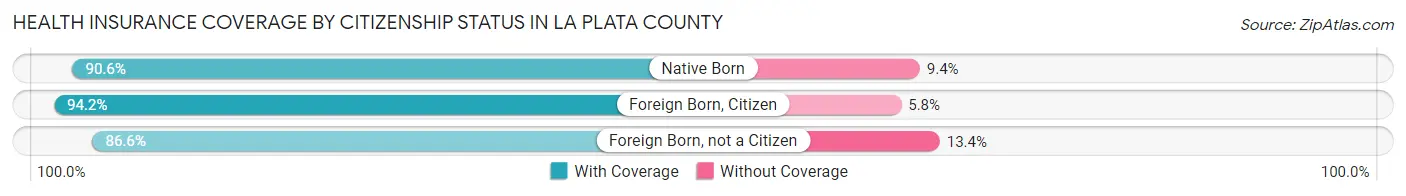
| Citizenship Status | With Coverage | Without Coverage |
| Native Born | 2,982 (90.6%) | 311 (9.4%) |
| Foreign Born, Citizen | 7,418 (94.2%) | 456 (5.8%) |
| Foreign Born, not a Citizen | 4,297 (86.6%) | 663 (13.4%) |
Health Insurance Coverage by Household Income in La Plata County
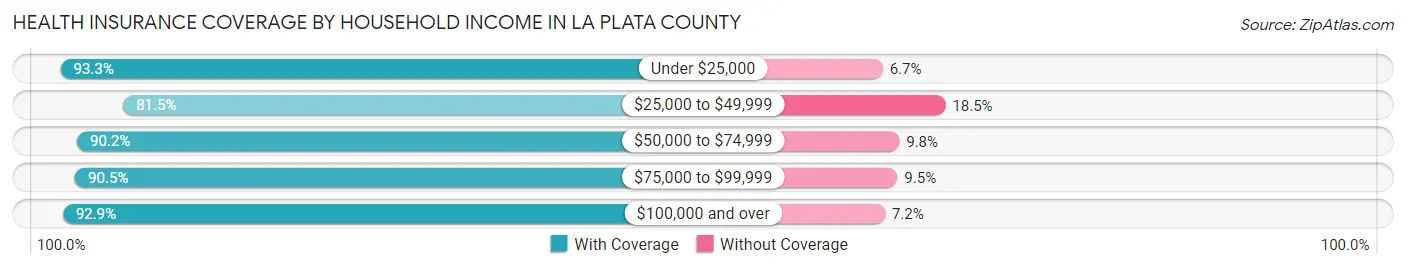
| Household Income | With Coverage | Without Coverage |
| Under $25,000 | 4,725 (93.3%) | 341 (6.7%) |
| $25,000 to $49,999 | 6,799 (81.5%) | 1,541 (18.5%) |
| $50,000 to $74,999 | 6,403 (90.2%) | 698 (9.8%) |
| $75,000 to $99,999 | 7,087 (90.5%) | 742 (9.5%) |
| $100,000 and over | 23,955 (92.8%) | 1,846 (7.1%) |
Public vs Private Health Insurance Coverage by Age in La Plata County
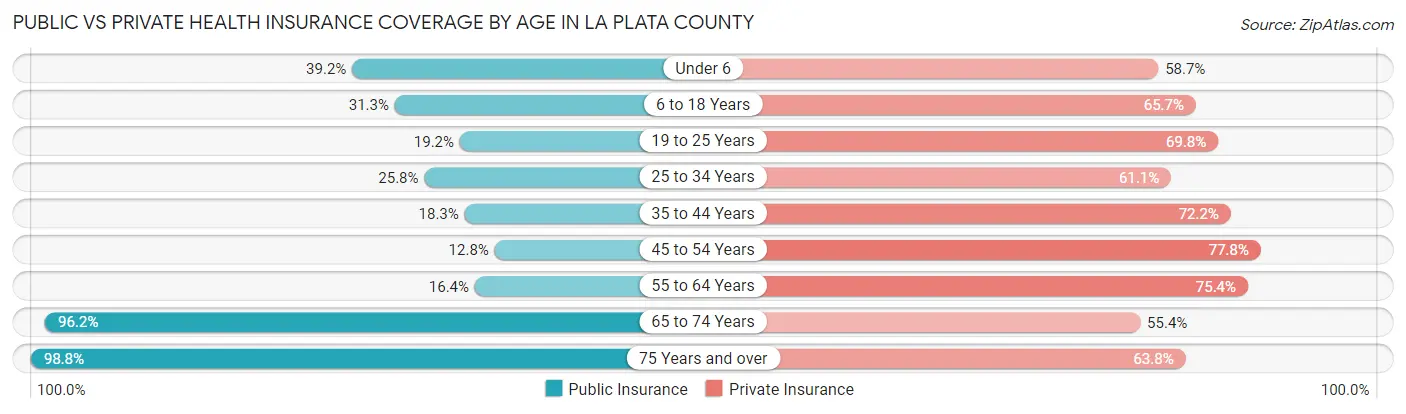
| Age Bracket | Public Insurance | Private Insurance |
| Under 6 | 1,291 (39.2%) | 1,934 (58.7%) |
| 6 to 18 Years | 2,464 (31.3%) | 5,173 (65.7%) |
| 19 to 25 Years | 953 (19.2%) | 3,464 (69.8%) |
| 25 to 34 Years | 1,592 (25.8%) | 3,771 (61.1%) |
| 35 to 44 Years | 1,395 (18.3%) | 5,492 (72.2%) |
| 45 to 54 Years | 879 (12.8%) | 5,359 (77.8%) |
| 55 to 64 Years | 1,357 (16.4%) | 6,226 (75.4%) |
| 65 to 74 Years | 6,793 (96.2%) | 3,911 (55.4%) |
| 75 Years and over | 3,418 (98.8%) | 2,206 (63.8%) |
| Total | 20,142 (36.2%) | 37,536 (67.5%) |
Disability Status by Sex by Age in La Plata County
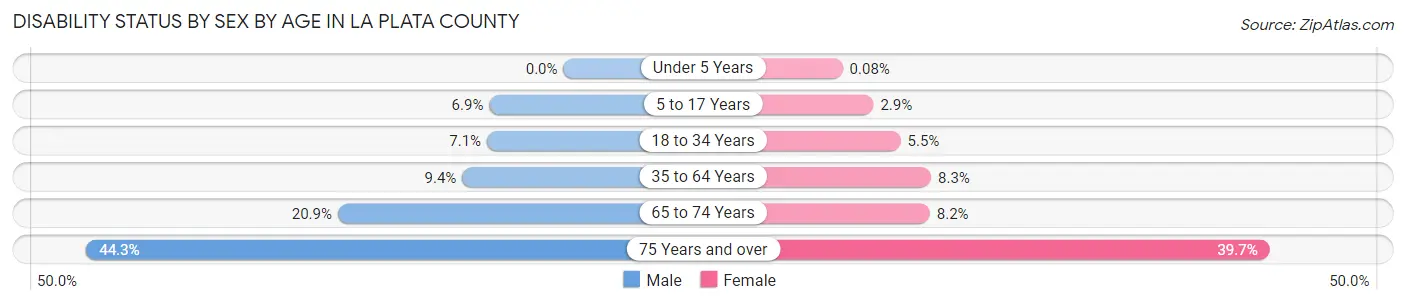
| Age Bracket | Male | Female |
| Under 5 Years | 0 (0.0%) | 1 (0.1%) |
| 5 to 17 Years | 273 (6.9%) | 110 (2.9%) |
| 18 to 34 Years | 437 (7.1%) | 324 (5.5%) |
| 35 to 64 Years | 1,082 (9.4%) | 932 (8.3%) |
| 65 to 74 Years | 750 (20.9%) | 284 (8.2%) |
| 75 Years and over | 719 (44.3%) | 728 (39.7%) |
Disability Class by Sex by Age in La Plata County
Disability Class: Hearing Difficulty
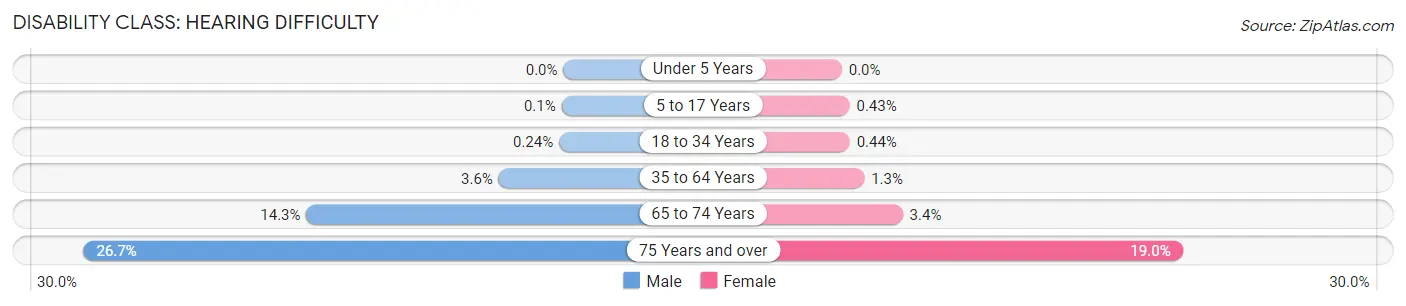
| Age Bracket | Male | Female |
| Under 5 Years | 0 (0.0%) | 0 (0.0%) |
| 5 to 17 Years | 4 (0.1%) | 16 (0.4%) |
| 18 to 34 Years | 15 (0.2%) | 26 (0.4%) |
| 35 to 64 Years | 415 (3.6%) | 141 (1.3%) |
| 65 to 74 Years | 513 (14.3%) | 118 (3.4%) |
| 75 Years and over | 434 (26.7%) | 348 (19.0%) |
Disability Class: Vision Difficulty
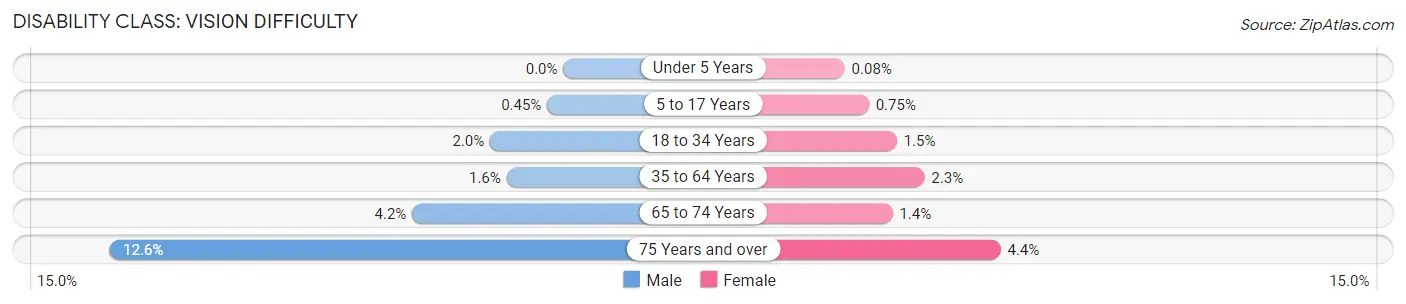
| Age Bracket | Male | Female |
| Under 5 Years | 0 (0.0%) | 1 (0.1%) |
| 5 to 17 Years | 18 (0.4%) | 28 (0.7%) |
| 18 to 34 Years | 126 (2.0%) | 91 (1.5%) |
| 35 to 64 Years | 182 (1.6%) | 259 (2.3%) |
| 65 to 74 Years | 151 (4.2%) | 49 (1.4%) |
| 75 Years and over | 205 (12.6%) | 81 (4.4%) |
Disability Class: Cognitive Difficulty
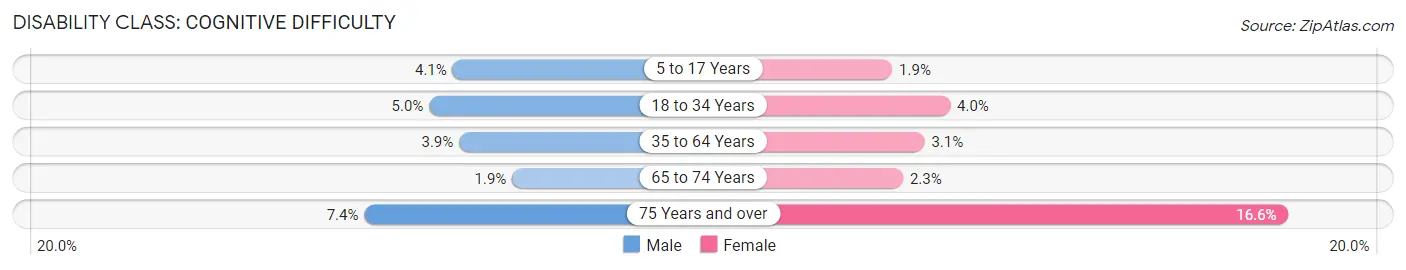
| Age Bracket | Male | Female |
| 5 to 17 Years | 163 (4.1%) | 70 (1.9%) |
| 18 to 34 Years | 307 (5.0%) | 239 (4.0%) |
| 35 to 64 Years | 446 (3.9%) | 345 (3.1%) |
| 65 to 74 Years | 68 (1.9%) | 79 (2.3%) |
| 75 Years and over | 120 (7.4%) | 304 (16.6%) |
Disability Class: Ambulatory Difficulty
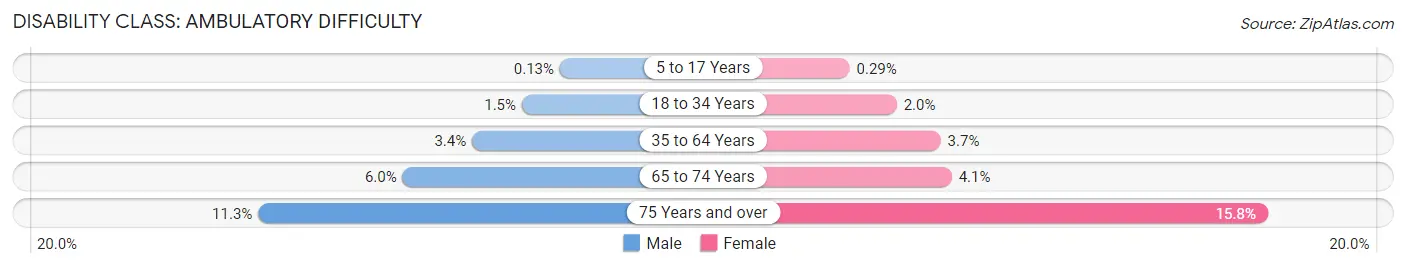
| Age Bracket | Male | Female |
| 5 to 17 Years | 5 (0.1%) | 11 (0.3%) |
| 18 to 34 Years | 95 (1.5%) | 121 (2.0%) |
| 35 to 64 Years | 391 (3.4%) | 412 (3.7%) |
| 65 to 74 Years | 214 (6.0%) | 142 (4.1%) |
| 75 Years and over | 184 (11.3%) | 290 (15.8%) |
Disability Class: Self-Care Difficulty

| Age Bracket | Male | Female |
| 5 to 17 Years | 114 (2.9%) | 41 (1.1%) |
| 18 to 34 Years | 84 (1.4%) | 80 (1.3%) |
| 35 to 64 Years | 132 (1.1%) | 110 (1.0%) |
| 65 to 74 Years | 78 (2.2%) | 13 (0.4%) |
| 75 Years and over | 79 (4.9%) | 150 (8.2%) |
Technology Access in La Plata County
Computing Device Access in La Plata County
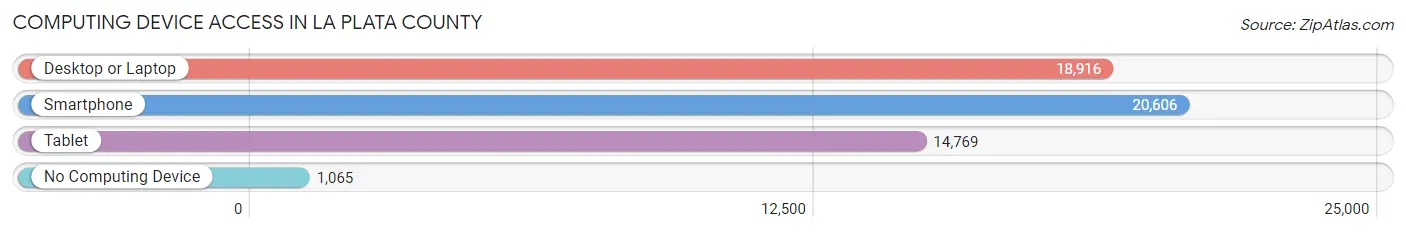
| Device Type | # Households | % Households |
| Desktop or Laptop | 18,916 | 83.4% |
| Smartphone | 20,606 | 90.8% |
| Tablet | 14,769 | 65.1% |
| No Computing Device | 1,065 | 4.7% |
| Total | 22,691 | 100.0% |
Internet Access in La Plata County
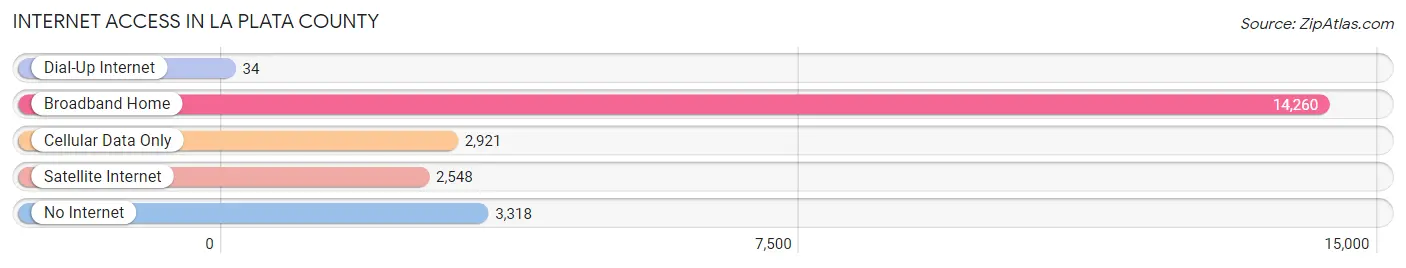
| Internet Type | # Households | % Households |
| Dial-Up Internet | 34 | 0.2% |
| Broadband Home | 14,260 | 62.8% |
| Cellular Data Only | 2,921 | 12.9% |
| Satellite Internet | 2,548 | 11.2% |
| No Internet | 3,318 | 14.6% |
| Total | 22,691 | 100.0% |
La Plata County Summary
La Plata County is located in the southwestern corner of Colorado, and is bordered by Montezuma County to the north, Archuleta County to the east, New Mexico to the south, and Arizona to the west. The county seat is Durango, and the county is named after the La Plata River, which flows through the county. La Plata County covers an area of 2,737 square miles, and is home to an estimated population of 54,818 people, as of 2019.
History
The area that is now La Plata County was originally inhabited by the Ute and Navajo tribes. The first Europeans to explore the area were Spanish explorers, who arrived in the late 1700s. The area was part of the New Mexico Territory until 1861, when it became part of the Colorado Territory. La Plata County was officially established in 1874, and was named after the La Plata River.
The county was initially populated by miners and ranchers, who were attracted to the area by the gold and silver deposits in the San Juan Mountains. The county seat of Durango was founded in 1880, and the Denver & Rio Grande Railroad arrived in 1881, connecting the area to the rest of the state.
The county experienced a population boom in the late 19th and early 20th centuries, as the mining and ranching industries flourished. The area also became a popular tourist destination, as visitors flocked to the area to take advantage of the scenic beauty and outdoor recreation opportunities.
Geography
La Plata County is located in the southwestern corner of Colorado, and is bordered by Montezuma County to the north, Archuleta County to the east, New Mexico to the south, and Arizona to the west. The county covers an area of 2,737 square miles, and is home to an estimated population of 54,818 people, as of 2019.
The county is located in the San Juan Mountains, and is home to several mountain peaks, including Mount Hesperus, the highest point in the county at 13,232 feet. The county is also home to the La Plata River, which flows through the county and is a popular destination for fishing and rafting.
The county is home to several state and national parks, including Mesa Verde National Park, which is home to the ancient ruins of the Ancestral Puebloans. The county is also home to the San Juan National Forest, which covers an area of 1.8 million acres and is home to a variety of wildlife, including elk, deer, and black bear.
Economy
The economy of La Plata County is largely driven by tourism, as the area is a popular destination for outdoor recreation. The county is home to several ski resorts, including Purgatory Resort and Wolf Creek Ski Area, which attract visitors from around the world. The county is also home to several national and state parks, which attract visitors who come to take advantage of the scenic beauty and outdoor recreation opportunities.
The county is also home to several mining and energy companies, including Freeport-McMoRan, which operates several copper and molybdenum mines in the area. The county is also home to several agricultural operations, including cattle ranches and fruit orchards.
Demographics
As of 2019, La Plata County had an estimated population of 54,818 people. The population is largely white (86.2%), with smaller percentages of Hispanic (7.7%), Native American (2.2%), African American (1.2%), and Asian (0.7%) residents. The median household income in the county is $60,845, and the median home value is $323,400. The unemployment rate in the county is 3.7%.
Conclusion
La Plata County is located in the southwestern corner of Colorado, and is bordered by Montezuma County to the north, Archuleta County to the east, New Mexico to the south, and Arizona to the west. The county was established in 1874, and is named after the La Plata River, which flows through the county. The county covers an area of 2,737 square miles, and is home to an estimated population of 54,818 people, as of 2019. The economy of La Plata County is largely driven by tourism, as the area is a popular destination for outdoor recreation. The population is largely white, with smaller percentages of Hispanic, Native American, African American, and Asian residents.
Common Questions
What is the Total Population of La Plata County?
Total Population of La Plata County is 55,983.
What is the Total Male Population of La Plata County?
Total Male Population of La Plata County is 28,379.
What is the Total Female Population of La Plata County?
Total Female Population of La Plata County is 27,604.
What is the Ratio of Males per 100 Females in La Plata County?
There are 102.81 Males per 100 Females in La Plata County.
What is the Ratio of Females per 100 Males in La Plata County?
There are 97.27 Females per 100 Males in La Plata County.
What is the Median Population Age in La Plata County?
Median Population Age in La Plata County is 41.8 Years.
What is the Average Family Size in La Plata County
Average Family Size in La Plata County is 2.9 People.
What is the Average Household Size in La Plata County
Average Household Size in La Plata County is 2.4 People.
What is Per Capita Income in La Plata County?
Per Capita income in La Plata County is $44,614.
What is the Median Family Income in La Plata County?
Median Family Income in La Plata County is $104,101.
What is the Median Household income in La Plata County?
Median Household Income in La Plata County is $81,936.
What is Income or Wage Gap in La Plata County?
Income or Wage Gap in La Plata County is 27.0%.
Women in La Plata County earn 73.0 cents for every dollar earned by a man.
What is Family Income Deficit in La Plata County?
Family Income Deficit in La Plata County is $10,079.
Families that are below poverty line in La Plata County earn $10,079 less on average than the poverty threshold level.
What is Inequality or Gini Index in La Plata County?
Inequality or Gini Index in La Plata County is 0.44.
How Large is the Labor Force in La Plata County?
There are 30,236 People in the Labor Forcein in La Plata County.
What is the Percentage of People in the Labor Force in La Plata County?
64.5% of People are in the Labor Force in La Plata County.
What is the Unemployment Rate in La Plata County?
Unemployment Rate in La Plata County is 3.2%.