Jefferson County, CO
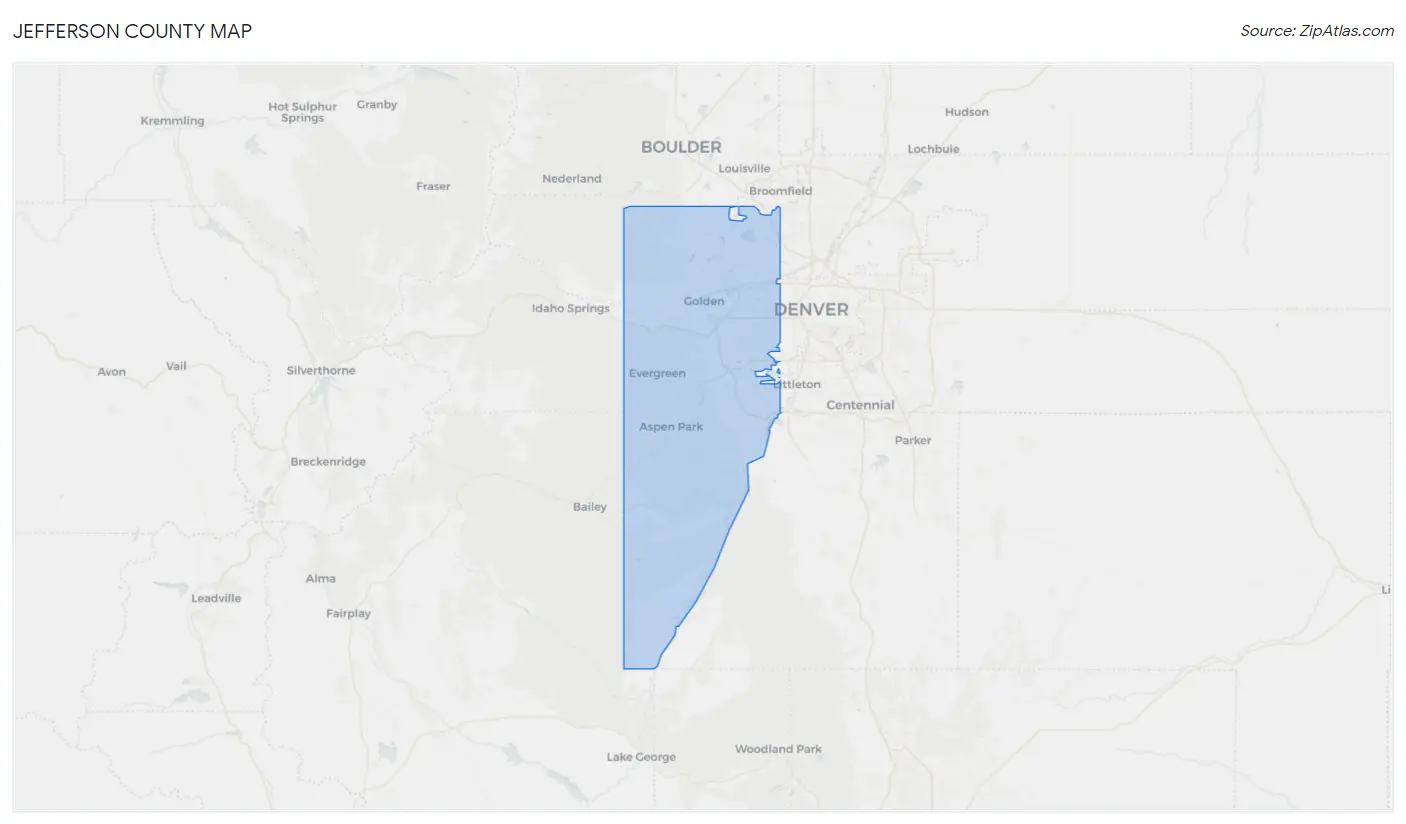
Jefferson County Map
Jefferson County Overview
580,519
TOTAL POPULATION
292,303
MALE POPULATION
288,216
FEMALE POPULATION
101.42
MALES / 100 FEMALES
98.60
FEMALES / 100 MALES
40.2
MEDIAN AGE
2.9
AVG FAMILY SIZE
2.4
AVG HOUSEHOLD SIZE
$54,571
PER CAPITA INCOME
$127,276
AVG FAMILY INCOME
$103,167
AVG HOUSEHOLD INCOME
27.6%
WAGE / INCOME GAP [ % ]
72.4¢/ $1
WAGE / INCOME GAP [ $ ]
$10,617
FAMILY INCOME DEFICIT
0.43
INEQUALITY / GINI INDEX
335,516
LABOR FORCE [ PEOPLE ]
69.4%
PERCENT IN LABOR FORCE
3.9%
UNEMPLOYMENT RATE
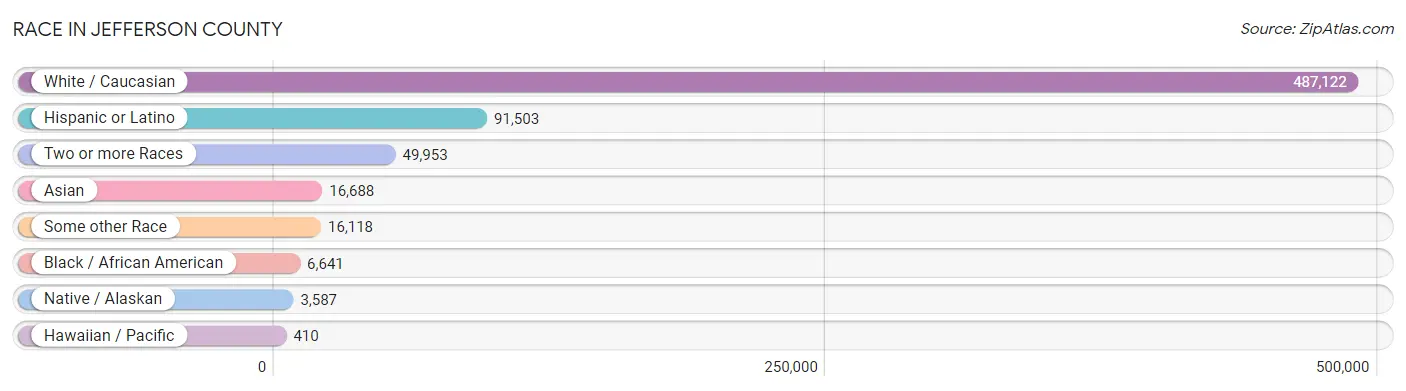
Race in Jefferson County
The most populous races in Jefferson County are White / Caucasian (487,122 | 83.9%), Hispanic or Latino (91,503 | 15.8%), and Two or more Races (49,953 | 8.6%).
| Race | # Population | % Population |
| Asian | 16,688 | 2.9% |
| Black / African American | 6,641 | 1.1% |
| Hawaiian / Pacific | 410 | 0.1% |
| Hispanic or Latino | 91,503 | 15.8% |
| Native / Alaskan | 3,587 | 0.6% |
| White / Caucasian | 487,122 | 83.9% |
| Two or more Races | 49,953 | 8.6% |
| Some other Race | 16,118 | 2.8% |
| Total | 580,519 | 100.0% |
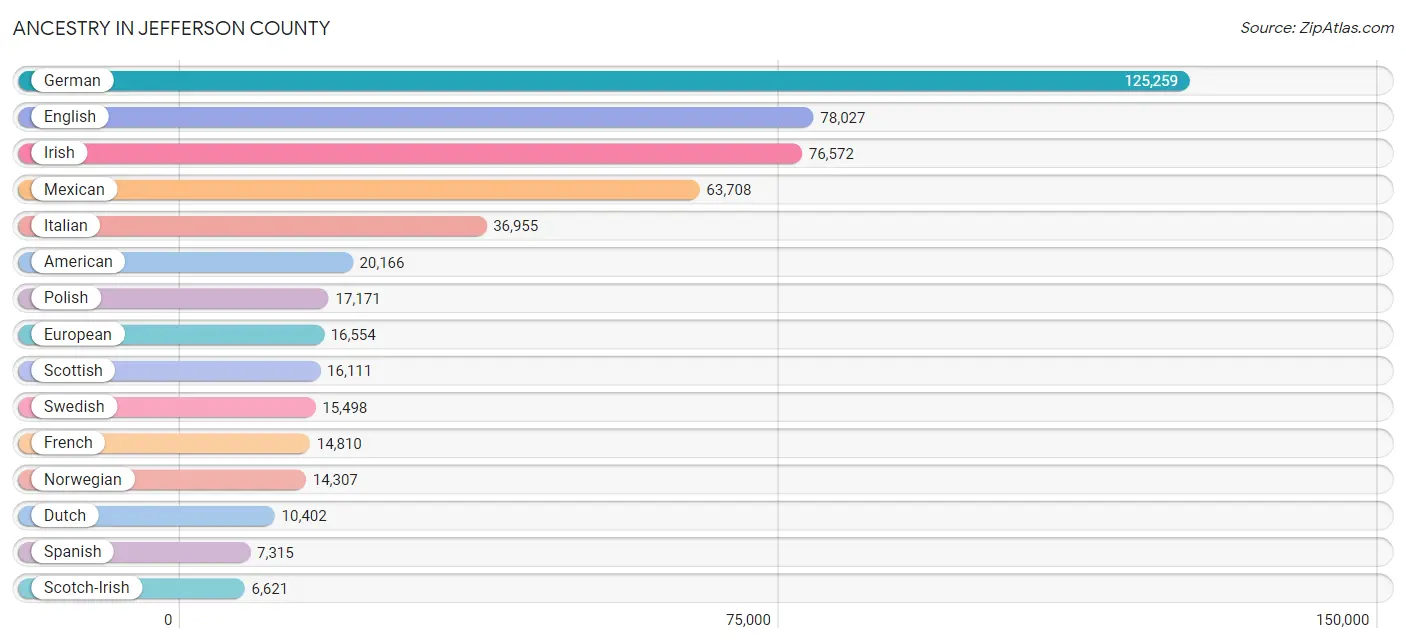
Ancestry in Jefferson County
The most populous ancestries reported in Jefferson County are German (125,259 | 21.6%), English (78,027 | 13.4%), Irish (76,572 | 13.2%), Mexican (63,708 | 11.0%), and Italian (36,955 | 6.4%), together accounting for 65.5% of all Jefferson County residents.
| Ancestry | # Population | % Population |
| Afghan | 227 | 0.0% |
| African | 931 | 0.2% |
| Alaskan Athabascan | 41 | 0.0% |
| Albanian | 13 | 0.0% |
| Aleut | 48 | 0.0% |
| Alsatian | 25 | 0.0% |
| American | 20,166 | 3.5% |
| Apache | 1,096 | 0.2% |
| Arab | 2,382 | 0.4% |
| Arapaho | 24 | 0.0% |
| Argentinean | 174 | 0.0% |
| Armenian | 436 | 0.1% |
| Assyrian / Chaldean / Syriac | 57 | 0.0% |
| Australian | 356 | 0.1% |
| Austrian | 2,135 | 0.4% |
| Bangladeshi | 464 | 0.1% |
| Barbadian | 114 | 0.0% |
| Basque | 195 | 0.0% |
| Belgian | 714 | 0.1% |
| Bhutanese | 3,048 | 0.5% |
| Blackfeet | 250 | 0.0% |
| Bolivian | 60 | 0.0% |
| Brazilian | 419 | 0.1% |
| British | 4,411 | 0.8% |
| Bulgarian | 126 | 0.0% |
| Burmese | 2,613 | 0.4% |
| Cajun | 186 | 0.0% |
| Cambodian | 169 | 0.0% |
| Canadian | 1,216 | 0.2% |
| Celtic | 106 | 0.0% |
| Central American | 2,636 | 0.4% |
| Central American Indian | 429 | 0.1% |
| Cherokee | 1,404 | 0.2% |
| Cheyenne | 100 | 0.0% |
| Chickasaw | 73 | 0.0% |
| Chilean | 538 | 0.1% |
| Chinese | 26 | 0.0% |
| Chippewa | 140 | 0.0% |
| Choctaw | 512 | 0.1% |
| Colombian | 556 | 0.1% |
| Comanche | 60 | 0.0% |
| Costa Rican | 644 | 0.1% |
| Cree | 66 | 0.0% |
| Creek | 96 | 0.0% |
| Croatian | 948 | 0.2% |
| Crow | 33 | 0.0% |
| Cuban | 1,058 | 0.2% |
| Czech | 4,921 | 0.9% |
| Czechoslovakian | 527 | 0.1% |
| Danish | 5,243 | 0.9% |
| Delaware | 25 | 0.0% |
| Dominican | 330 | 0.1% |
| Dutch | 10,402 | 1.8% |
| Eastern European | 2,195 | 0.4% |
| Ecuadorian | 467 | 0.1% |
| Egyptian | 157 | 0.0% |
| English | 78,027 | 13.4% |
| Estonian | 180 | 0.0% |
| Ethiopian | 104 | 0.0% |
| European | 16,554 | 2.9% |
| Filipino | 414 | 0.1% |
| Finnish | 1,463 | 0.3% |
| French | 14,810 | 2.5% |
| French American Indian | 61 | 0.0% |
| French Canadian | 2,459 | 0.4% |
| German | 125,259 | 21.6% |
| German Russian | 74 | 0.0% |
| Ghanaian | 401 | 0.1% |
| Greek | 2,151 | 0.4% |
| Guamanian / Chamorro | 167 | 0.0% |
| Guatemalan | 763 | 0.1% |
| Haitian | 33 | 0.0% |
| Hmong | 16 | 0.0% |
| Honduran | 250 | 0.0% |
| Hopi | 269 | 0.1% |
| Houma | 10 | 0.0% |
| Hungarian | 2,020 | 0.4% |
| Icelander | 205 | 0.0% |
| Indian (Asian) | 4,852 | 0.8% |
| Indonesian | 34 | 0.0% |
| Iranian | 574 | 0.1% |
| Iraqi | 12 | 0.0% |
| Irish | 76,572 | 13.2% |
| Iroquois | 69 | 0.0% |
| Israeli | 74 | 0.0% |
| Italian | 36,955 | 6.4% |
| Jamaican | 59 | 0.0% |
| Japanese | 286 | 0.1% |
| Jordanian | 256 | 0.0% |
| Kenyan | 50 | 0.0% |
| Korean | 2,991 | 0.5% |
| Laotian | 238 | 0.0% |
| Latvian | 230 | 0.0% |
| Lebanese | 692 | 0.1% |
| Lithuanian | 1,277 | 0.2% |
| Lumbee | 19 | 0.0% |
| Luxembourger | 53 | 0.0% |
| Macedonian | 84 | 0.0% |
| Malaysian | 250 | 0.0% |
| Maltese | 33 | 0.0% |
| Menominee | 25 | 0.0% |
| Mexican | 63,708 | 11.0% |
| Mexican American Indian | 653 | 0.1% |
| Mongolian | 3 | 0.0% |
| Moroccan | 95 | 0.0% |
| Native Hawaiian | 760 | 0.1% |
| Navajo | 1,163 | 0.2% |
| New Zealander | 140 | 0.0% |
| Nicaraguan | 345 | 0.1% |
| Nigerian | 266 | 0.1% |
| Northern European | 2,025 | 0.4% |
| Norwegian | 14,307 | 2.5% |
| Okinawan | 10 | 0.0% |
| Osage | 110 | 0.0% |
| Pakistani | 463 | 0.1% |
| Palestinian | 307 | 0.1% |
| Panamanian | 209 | 0.0% |
| Paraguayan | 102 | 0.0% |
| Pennsylvania German | 227 | 0.0% |
| Peruvian | 873 | 0.2% |
| Polish | 17,171 | 3.0% |
| Portuguese | 1,824 | 0.3% |
| Potawatomi | 29 | 0.0% |
| Pueblo | 402 | 0.1% |
| Puerto Rican | 2,393 | 0.4% |
| Romanian | 1,030 | 0.2% |
| Russian | 5,780 | 1.0% |
| Salvadoran | 413 | 0.1% |
| Samoan | 185 | 0.0% |
| Scandinavian | 3,861 | 0.7% |
| Scotch-Irish | 6,621 | 1.1% |
| Scottish | 16,111 | 2.8% |
| Serbian | 537 | 0.1% |
| Shoshone | 22 | 0.0% |
| Sierra Leonean | 10 | 0.0% |
| Sioux | 735 | 0.1% |
| Slavic | 522 | 0.1% |
| Slovak | 808 | 0.1% |
| Slovene | 716 | 0.1% |
| South African | 167 | 0.0% |
| South American | 3,505 | 0.6% |
| South American Indian | 61 | 0.0% |
| Spaniard | 5,527 | 0.9% |
| Spanish | 7,315 | 1.3% |
| Spanish American | 310 | 0.1% |
| Spanish American Indian | 31 | 0.0% |
| Sri Lankan | 4,678 | 0.8% |
| Subsaharan African | 2,258 | 0.4% |
| Sudanese | 14 | 0.0% |
| Swedish | 15,498 | 2.7% |
| Swiss | 2,448 | 0.4% |
| Syrian | 251 | 0.0% |
| Thai | 2,543 | 0.4% |
| Tlingit-Haida | 23 | 0.0% |
| Turkish | 281 | 0.1% |
| U.S. Virgin Islander | 14 | 0.0% |
| Ukrainian | 2,034 | 0.4% |
| Uruguayan | 16 | 0.0% |
| Ute | 63 | 0.0% |
| Venezuelan | 653 | 0.1% |
| Welsh | 5,808 | 1.0% |
| West Indian | 88 | 0.0% |
| Yugoslavian | 443 | 0.1% |
| Yuman | 15 | 0.0% |
| Yup'ik | 7 | 0.0% | View All 165 Rows |
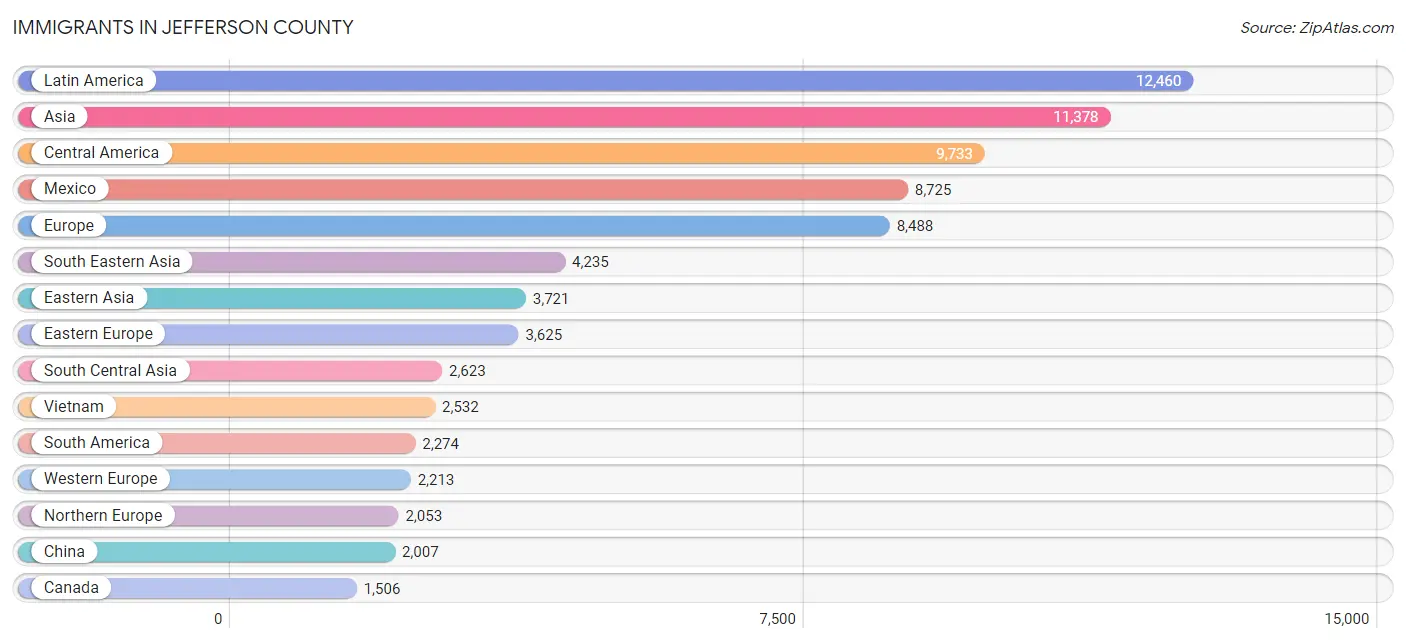
Immigrants in Jefferson County
The most numerous immigrant groups reported in Jefferson County came from Latin America (12,460 | 2.1%), Asia (11,378 | 2.0%), Central America (9,733 | 1.7%), Mexico (8,725 | 1.5%), and Europe (8,488 | 1.5%), together accounting for 8.7% of all Jefferson County residents.
| Immigration Origin | # Population | % Population |
| Afghanistan | 150 | 0.0% |
| Africa | 1,383 | 0.2% |
| Albania | 8 | 0.0% |
| Argentina | 167 | 0.0% |
| Armenia | 41 | 0.0% |
| Asia | 11,378 | 2.0% |
| Australia | 305 | 0.1% |
| Austria | 104 | 0.0% |
| Belarus | 191 | 0.0% |
| Belgium | 44 | 0.0% |
| Bolivia | 61 | 0.0% |
| Bosnia and Herzegovina | 136 | 0.0% |
| Brazil | 478 | 0.1% |
| Bulgaria | 55 | 0.0% |
| Cambodia | 74 | 0.0% |
| Canada | 1,506 | 0.3% |
| Caribbean | 453 | 0.1% |
| Central America | 9,733 | 1.7% |
| Chile | 246 | 0.0% |
| China | 2,007 | 0.4% |
| Colombia | 347 | 0.1% |
| Congo | 118 | 0.0% |
| Costa Rica | 95 | 0.0% |
| Croatia | 86 | 0.0% |
| Cuba | 196 | 0.0% |
| Czechoslovakia | 229 | 0.0% |
| Denmark | 84 | 0.0% |
| Dominican Republic | 173 | 0.0% |
| Eastern Africa | 376 | 0.1% |
| Eastern Asia | 3,721 | 0.6% |
| Eastern Europe | 3,625 | 0.6% |
| Ecuador | 150 | 0.0% |
| Egypt | 73 | 0.0% |
| El Salvador | 139 | 0.0% |
| England | 885 | 0.2% |
| Ethiopia | 108 | 0.0% |
| Europe | 8,488 | 1.5% |
| Fiji | 7 | 0.0% |
| France | 348 | 0.1% |
| Germany | 1,304 | 0.2% |
| Ghana | 235 | 0.0% |
| Greece | 32 | 0.0% |
| Guatemala | 422 | 0.1% |
| Guyana | 45 | 0.0% |
| Haiti | 14 | 0.0% |
| Honduras | 147 | 0.0% |
| Hong Kong | 94 | 0.0% |
| Hungary | 139 | 0.0% |
| India | 1,407 | 0.2% |
| Indonesia | 289 | 0.1% |
| Iran | 310 | 0.1% |
| Iraq | 27 | 0.0% |
| Ireland | 146 | 0.0% |
| Israel | 138 | 0.0% |
| Italy | 316 | 0.1% |
| Jamaica | 28 | 0.0% |
| Japan | 490 | 0.1% |
| Jordan | 286 | 0.1% |
| Kazakhstan | 27 | 0.0% |
| Kenya | 46 | 0.0% |
| Korea | 1,145 | 0.2% |
| Kuwait | 16 | 0.0% |
| Laos | 128 | 0.0% |
| Latin America | 12,460 | 2.1% |
| Latvia | 45 | 0.0% |
| Lebanon | 36 | 0.0% |
| Lithuania | 97 | 0.0% |
| Malaysia | 15 | 0.0% |
| Mexico | 8,725 | 1.5% |
| Micronesia | 3 | 0.0% |
| Middle Africa | 118 | 0.0% |
| Moldova | 38 | 0.0% |
| Morocco | 42 | 0.0% |
| Nepal | 455 | 0.1% |
| Netherlands | 261 | 0.0% |
| Nicaragua | 146 | 0.0% |
| Nigeria | 32 | 0.0% |
| Northern Africa | 200 | 0.0% |
| Northern Europe | 2,053 | 0.4% |
| Norway | 59 | 0.0% |
| Oceania | 526 | 0.1% |
| Pakistan | 72 | 0.0% |
| Panama | 59 | 0.0% |
| Peru | 378 | 0.1% |
| Philippines | 768 | 0.1% |
| Poland | 777 | 0.1% |
| Portugal | 23 | 0.0% |
| Romania | 403 | 0.1% |
| Russia | 751 | 0.1% |
| Saudi Arabia | 34 | 0.0% |
| Scotland | 44 | 0.0% |
| Serbia | 5 | 0.0% |
| Singapore | 25 | 0.0% |
| South Africa | 394 | 0.1% |
| South America | 2,274 | 0.4% |
| South Central Asia | 2,623 | 0.4% |
| South Eastern Asia | 4,235 | 0.7% |
| Southern Europe | 547 | 0.1% |
| Spain | 176 | 0.0% |
| Sri Lanka | 10 | 0.0% |
| Sweden | 126 | 0.0% |
| Switzerland | 152 | 0.0% |
| Syria | 106 | 0.0% |
| Taiwan | 245 | 0.0% |
| Thailand | 382 | 0.1% |
| Turkey | 103 | 0.0% |
| Uganda | 167 | 0.0% |
| Ukraine | 426 | 0.1% |
| Uzbekistan | 92 | 0.0% |
| Venezuela | 313 | 0.1% |
| Vietnam | 2,532 | 0.4% |
| Western Africa | 289 | 0.1% |
| Western Asia | 795 | 0.1% |
| Western Europe | 2,213 | 0.4% |
| Zimbabwe | 10 | 0.0% | View All 115 Rows |
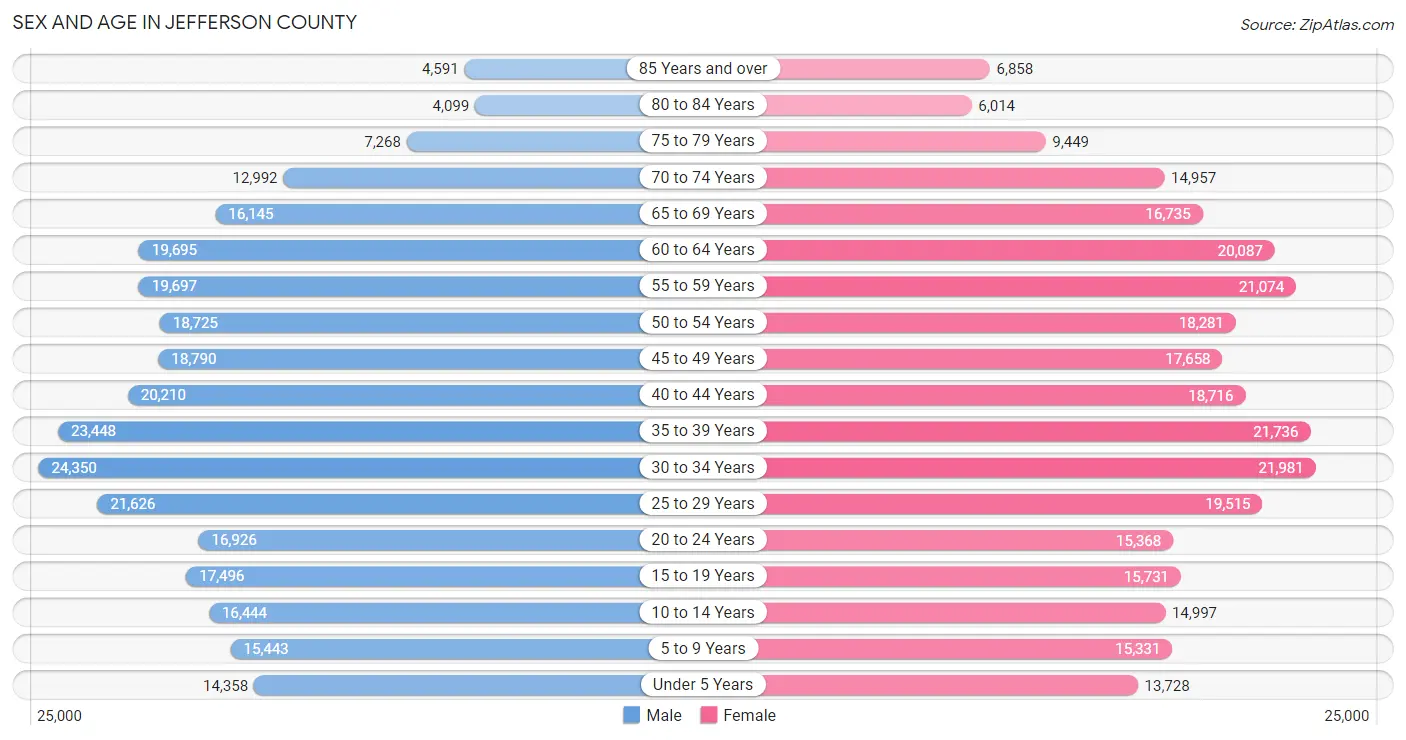
Sex and Age in Jefferson County
Sex and Age in Jefferson County
The most populous age groups in Jefferson County are 30 to 34 Years (24,350 | 8.3%) for men and 30 to 34 Years (21,981 | 7.6%) for women.
| Age Bracket | Male | Female |
| Under 5 Years | 14,358 (4.9%) | 13,728 (4.8%) |
| 5 to 9 Years | 15,443 (5.3%) | 15,331 (5.3%) |
| 10 to 14 Years | 16,444 (5.6%) | 14,997 (5.2%) |
| 15 to 19 Years | 17,496 (6.0%) | 15,731 (5.5%) |
| 20 to 24 Years | 16,926 (5.8%) | 15,368 (5.3%) |
| 25 to 29 Years | 21,626 (7.4%) | 19,515 (6.8%) |
| 30 to 34 Years | 24,350 (8.3%) | 21,981 (7.6%) |
| 35 to 39 Years | 23,448 (8.0%) | 21,736 (7.5%) |
| 40 to 44 Years | 20,210 (6.9%) | 18,716 (6.5%) |
| 45 to 49 Years | 18,790 (6.4%) | 17,658 (6.1%) |
| 50 to 54 Years | 18,725 (6.4%) | 18,281 (6.3%) |
| 55 to 59 Years | 19,697 (6.7%) | 21,074 (7.3%) |
| 60 to 64 Years | 19,695 (6.7%) | 20,087 (7.0%) |
| 65 to 69 Years | 16,145 (5.5%) | 16,735 (5.8%) |
| 70 to 74 Years | 12,992 (4.4%) | 14,957 (5.2%) |
| 75 to 79 Years | 7,268 (2.5%) | 9,449 (3.3%) |
| 80 to 84 Years | 4,099 (1.4%) | 6,014 (2.1%) |
| 85 Years and over | 4,591 (1.6%) | 6,858 (2.4%) |
| Total | 292,303 (100.0%) | 288,216 (100.0%) |
Families and Households in Jefferson County
Median Family Size in Jefferson County
The median family size in Jefferson County is 2.94 persons per family, with married-couple families (120,938 | 80.0%) accounting for the largest median family size of 2.95 persons per family. On the other hand, single male/father families (11,111 | 7.3%) represent the smallest median family size with 2.75 persons per family.
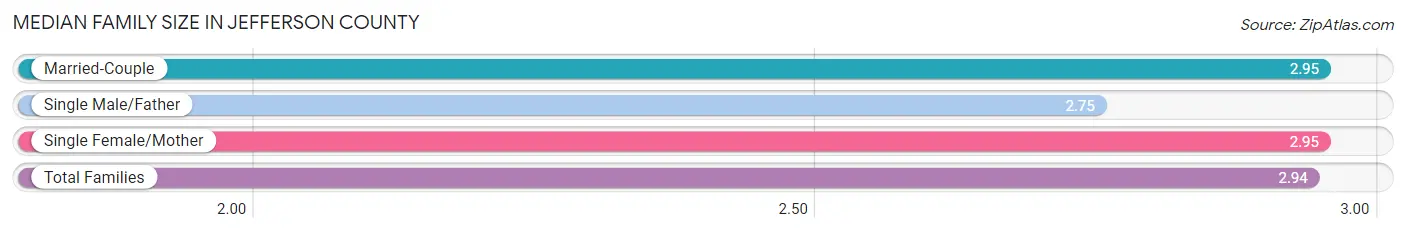
| Family Type | # Families | Family Size |
| Married-Couple | 120,938 (80.0%) | 2.95 |
| Single Male/Father | 11,111 (7.3%) | 2.75 |
| Single Female/Mother | 19,167 (12.7%) | 2.95 |
| Total Families | 151,216 (100.0%) | 2.94 |
Median Household Size in Jefferson County
The median household size in Jefferson County is 2.40 persons per household, with single female/mother households (19,167 | 8.0%) accounting for the largest median household size of 3.17 persons per household. non-family households (87,156 | 36.6%) represent the smallest median household size with 1.34 persons per household.
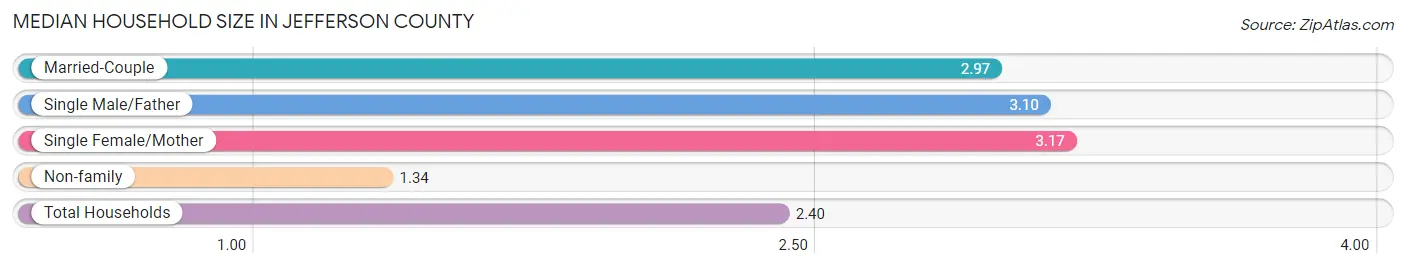
| Household Type | # Households | Household Size |
| Married-Couple | 120,938 (50.7%) | 2.97 |
| Single Male/Father | 11,111 (4.7%) | 3.10 |
| Single Female/Mother | 19,167 (8.0%) | 3.17 |
| Non-family | 87,156 (36.6%) | 1.34 |
| Total Households | 238,372 (100.0%) | 2.40 |
Household Size by Marriage Status in Jefferson County
Out of a total of 238,372 households in Jefferson County, 151,216 (63.4%) are family households, while 87,156 (36.6%) are nonfamily households. The most numerous type of family households are 2-person households, comprising 72,606, and the most common type of nonfamily households are 1-person households, comprising 65,468.
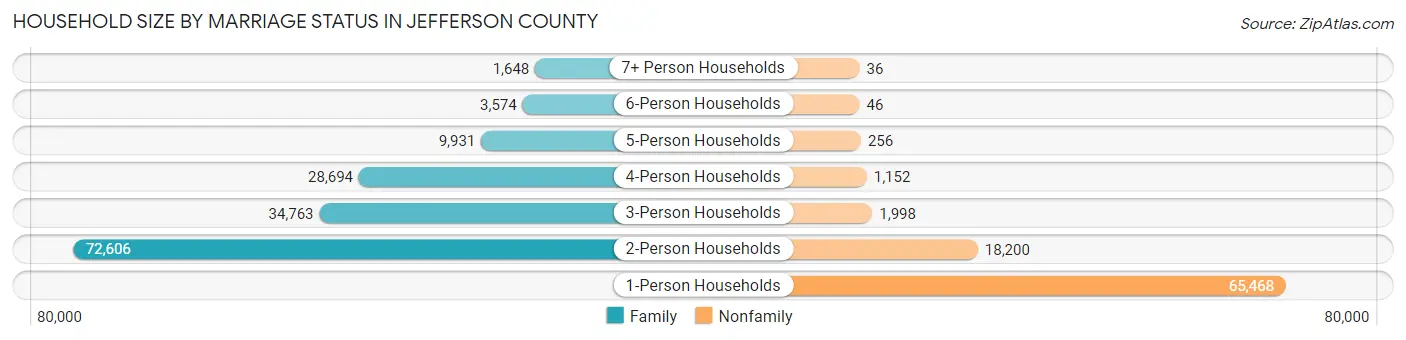
| Household Size | Family Households | Nonfamily Households |
| 1-Person Households | - | 65,468 (27.5%) |
| 2-Person Households | 72,606 (30.5%) | 18,200 (7.6%) |
| 3-Person Households | 34,763 (14.6%) | 1,998 (0.8%) |
| 4-Person Households | 28,694 (12.0%) | 1,152 (0.5%) |
| 5-Person Households | 9,931 (4.2%) | 256 (0.1%) |
| 6-Person Households | 3,574 (1.5%) | 46 (0.0%) |
| 7+ Person Households | 1,648 (0.7%) | 36 (0.0%) |
| Total | 151,216 (63.4%) | 87,156 (36.6%) |
Female Fertility in Jefferson County
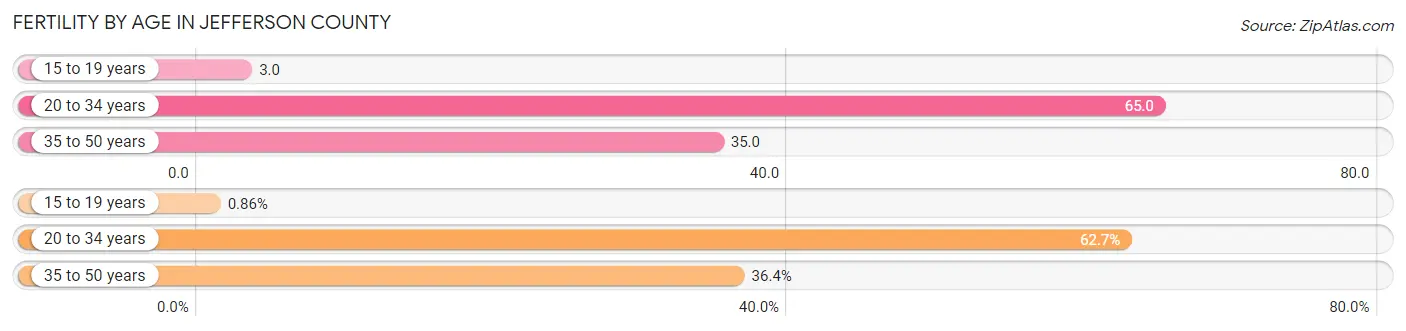
Fertility by Age in Jefferson County
Average fertility rate in Jefferson County is 44.0 births per 1,000 women. Women in the age bracket of 20 to 34 years have the highest fertility rate with 65.0 births per 1,000 women. Women in the age bracket of 20 to 34 years acount for 62.7% of all women with births.
| Age Bracket | Women with Births | Births / 1,000 Women |
| 15 to 19 years | 51 (0.9%) | 3.0 |
| 20 to 34 years | 3,716 (62.7%) | 65.0 |
| 35 to 50 years | 2,158 (36.4%) | 35.0 |
| Total | 5,925 (100.0%) | 44.0 |
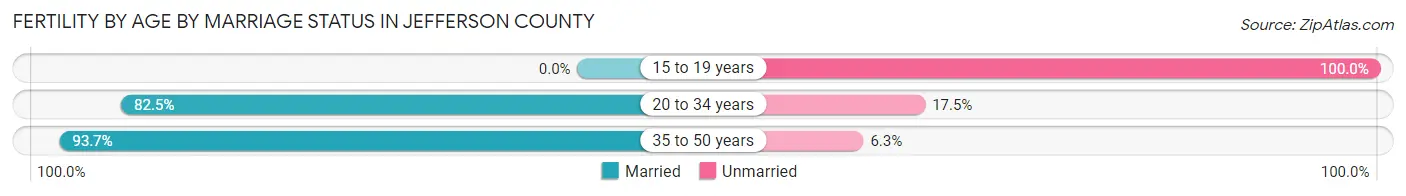
Fertility by Age by Marriage Status in Jefferson County
85.9% of women with births (5,925) in Jefferson County are married. The highest percentage of unmarried women with births falls into 15 to 19 years age bracket with 100.0% of them unmarried at the time of birth, while the lowest percentage of unmarried women with births belong to 35 to 50 years age bracket with 6.3% of them unmarried.
| Age Bracket | Married | Unmarried |
| 15 to 19 years | 0 (0.0%) | 51 (100.0%) |
| 20 to 34 years | 3,066 (82.5%) | 650 (17.5%) |
| 35 to 50 years | 2,022 (93.7%) | 136 (6.3%) |
| Total | 5,090 (85.9%) | 835 (14.1%) |
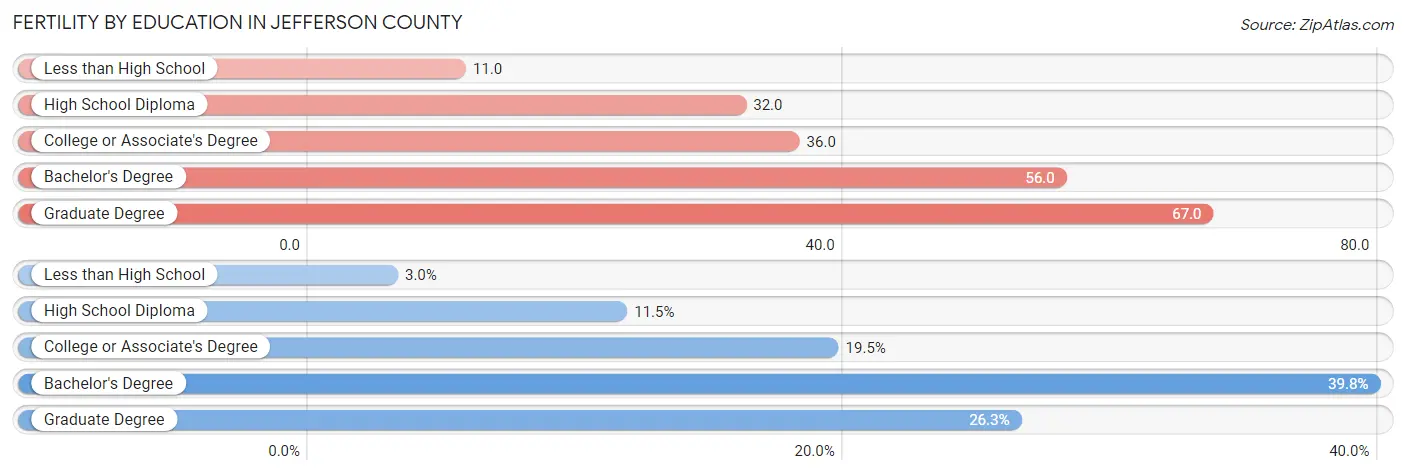
Fertility by Education in Jefferson County
Average fertility rate in Jefferson County is 44.0 births per 1,000 women. Women with the education attainment of graduate degree have the highest fertility rate of 67.0 births per 1,000 women, while women with the education attainment of less than high school have the lowest fertility at 11.0 births per 1,000 women. Women with the education attainment of bachelor's degree represent 39.8% of all women with births.
| Educational Attainment | Women with Births | Births / 1,000 Women |
| Less than High School | 175 (2.9%) | 11.0 |
| High School Diploma | 684 (11.5%) | 32.0 |
| College or Associate's Degree | 1,153 (19.5%) | 36.0 |
| Bachelor's Degree | 2,355 (39.8%) | 56.0 |
| Graduate Degree | 1,558 (26.3%) | 67.0 |
| Total | 5,925 (100.0%) | 44.0 |
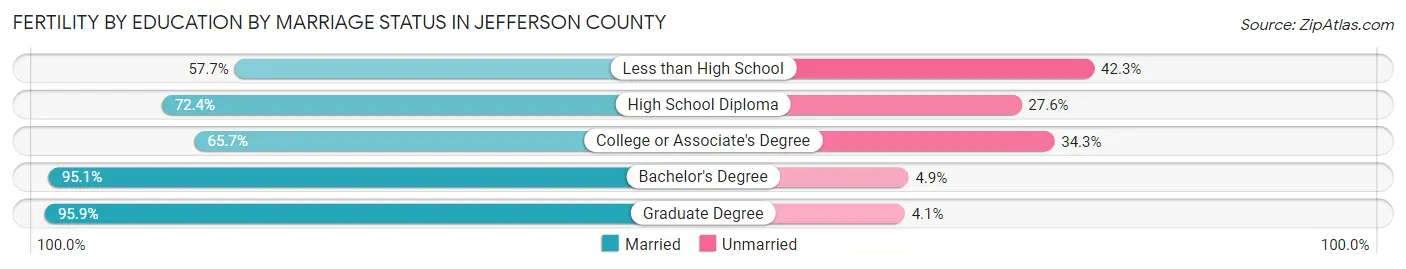
Fertility by Education by Marriage Status in Jefferson County
14.1% of women with births in Jefferson County are unmarried. Women with the educational attainment of graduate degree are most likely to be married with 95.9% of them married at childbirth, while women with the educational attainment of less than high school are least likely to be married with 42.3% of them unmarried at childbirth.
| Educational Attainment | Married | Unmarried |
| Less than High School | 101 (57.7%) | 74 (42.3%) |
| High School Diploma | 495 (72.4%) | 189 (27.6%) |
| College or Associate's Degree | 758 (65.7%) | 395 (34.3%) |
| Bachelor's Degree | 2,240 (95.1%) | 115 (4.9%) |
| Graduate Degree | 1,494 (95.9%) | 64 (4.1%) |
| Total | 5,090 (85.9%) | 835 (14.1%) |
Income in Jefferson County
Income Overview in Jefferson County
Per Capita Income in Jefferson County is $54,571, while median incomes of families and households are $127,276 and $103,167 respectively.
| Characteristic | Number | Measure |
| Per Capita Income | 580,519 | $54,571 |
| Median Family Income | 151,216 | $127,276 |
| Mean Family Income | 151,216 | $155,748 |
| Median Household Income | 238,372 | $103,167 |
| Mean Household Income | 238,372 | $130,332 |
| Income Deficit | 151,216 | $10,617 |
| Wage / Income Gap (%) | 580,519 | 27.59% |
| Wage / Income Gap ($) | 580,519 | 72.41¢ per $1 |
| Gini / Inequality Index | 580,519 | 0.43 |
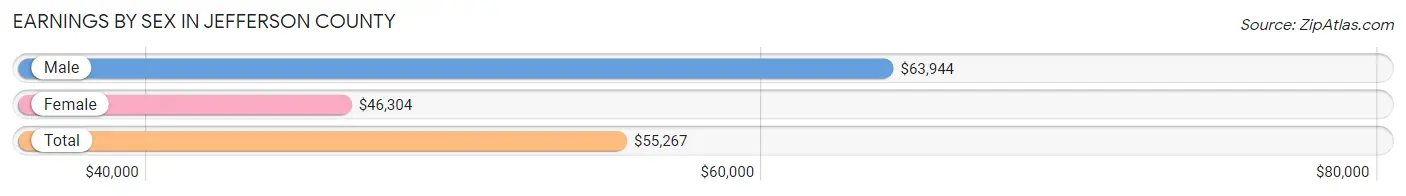
Earnings by Sex in Jefferson County
Average Earnings in Jefferson County are $55,267, $63,944 for men and $46,304 for women, a difference of 27.6%.
| Sex | Number | Average Earnings |
| Male | 185,660 (53.1%) | $63,944 |
| Female | 163,732 (46.9%) | $46,304 |
| Total | 349,392 (100.0%) | $55,267 |
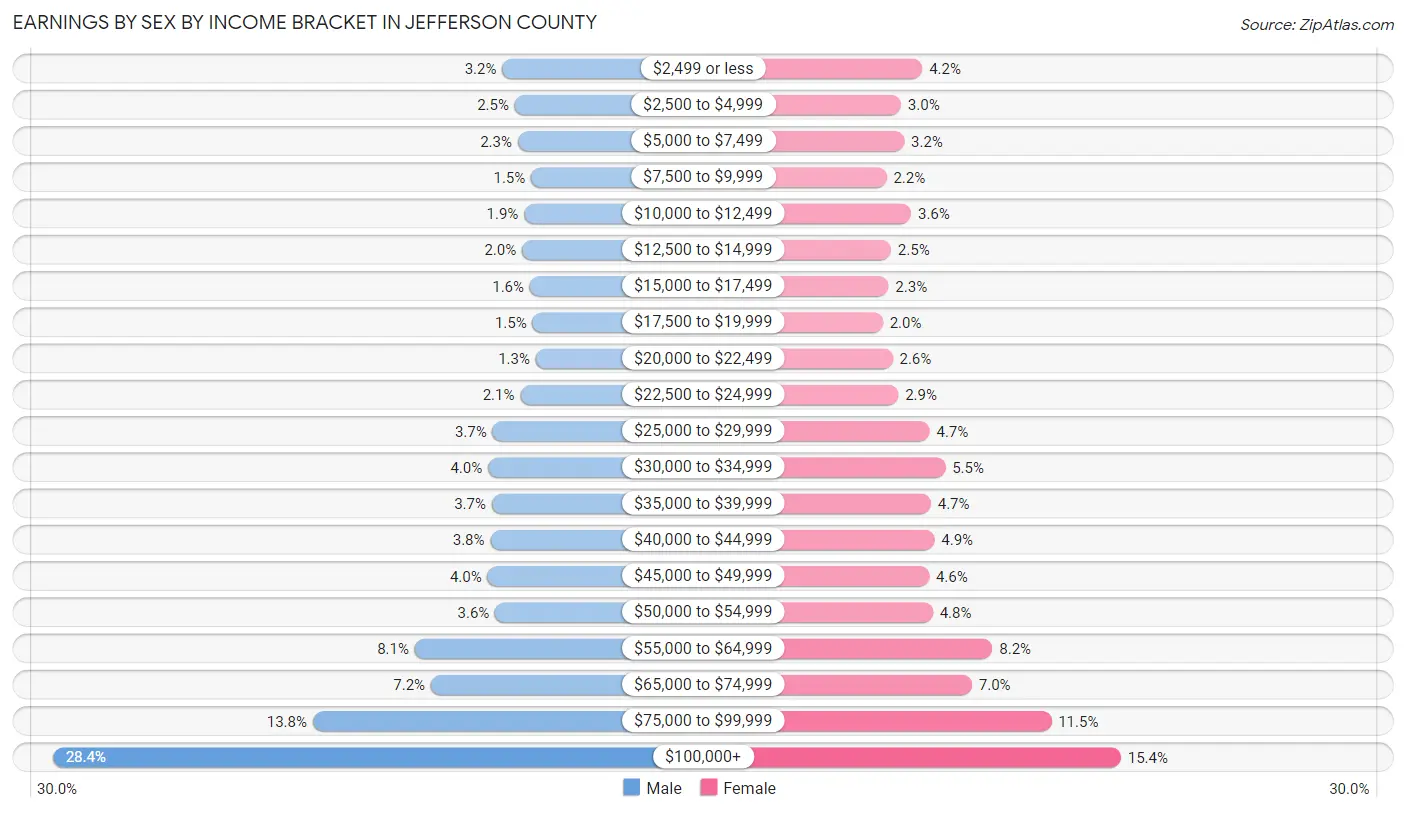
Earnings by Sex by Income Bracket in Jefferson County
The most common earnings brackets in Jefferson County are $100,000+ for men (52,762 | 28.4%) and $100,000+ for women (25,208 | 15.4%).
| Income | Male | Female |
| $2,499 or less | 5,841 (3.2%) | 6,938 (4.2%) |
| $2,500 to $4,999 | 4,556 (2.5%) | 4,972 (3.0%) |
| $5,000 to $7,499 | 4,239 (2.3%) | 5,277 (3.2%) |
| $7,500 to $9,999 | 2,832 (1.5%) | 3,645 (2.2%) |
| $10,000 to $12,499 | 3,558 (1.9%) | 5,908 (3.6%) |
| $12,500 to $14,999 | 3,784 (2.0%) | 4,059 (2.5%) |
| $15,000 to $17,499 | 2,964 (1.6%) | 3,830 (2.3%) |
| $17,500 to $19,999 | 2,696 (1.5%) | 3,308 (2.0%) |
| $20,000 to $22,499 | 2,354 (1.3%) | 4,212 (2.6%) |
| $22,500 to $24,999 | 3,981 (2.1%) | 4,739 (2.9%) |
| $25,000 to $29,999 | 6,870 (3.7%) | 7,607 (4.6%) |
| $30,000 to $34,999 | 7,325 (4.0%) | 9,062 (5.5%) |
| $35,000 to $39,999 | 6,939 (3.7%) | 7,727 (4.7%) |
| $40,000 to $44,999 | 7,092 (3.8%) | 8,058 (4.9%) |
| $45,000 to $49,999 | 7,389 (4.0%) | 7,571 (4.6%) |
| $50,000 to $54,999 | 6,588 (3.5%) | 7,901 (4.8%) |
| $55,000 to $64,999 | 14,981 (8.1%) | 13,388 (8.2%) |
| $65,000 to $74,999 | 13,290 (7.2%) | 11,505 (7.0%) |
| $75,000 to $99,999 | 25,619 (13.8%) | 18,817 (11.5%) |
| $100,000+ | 52,762 (28.4%) | 25,208 (15.4%) |
| Total | 185,660 (100.0%) | 163,732 (100.0%) |
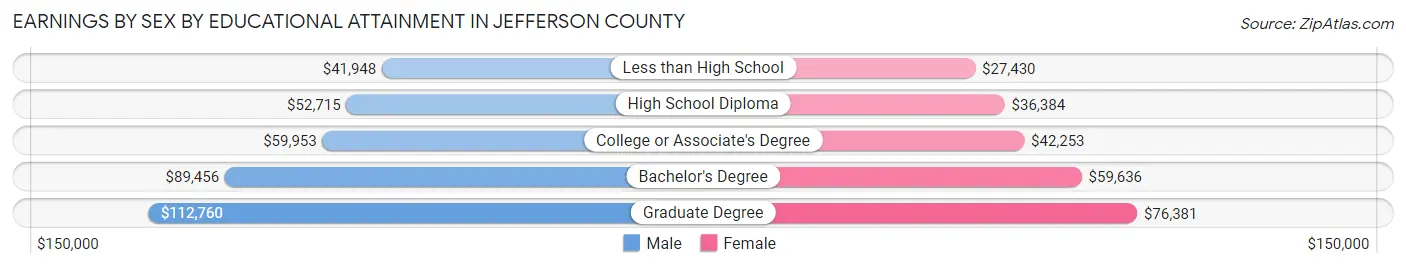
Earnings by Sex by Educational Attainment in Jefferson County
Average earnings in Jefferson County are $71,686 for men and $52,569 for women, a difference of 26.7%. Men with an educational attainment of graduate degree enjoy the highest average annual earnings of $112,760, while those with less than high school education earn the least with $41,948. Women with an educational attainment of graduate degree earn the most with the average annual earnings of $76,381, while those with less than high school education have the smallest earnings of $27,430.
| Educational Attainment | Male Income | Female Income |
| Less than High School | $41,948 | $27,430 |
| High School Diploma | $52,715 | $36,384 |
| College or Associate's Degree | $59,953 | $42,253 |
| Bachelor's Degree | $89,456 | $59,636 |
| Graduate Degree | $112,760 | $76,381 |
| Total | $71,686 | $52,569 |
Family Income in Jefferson County
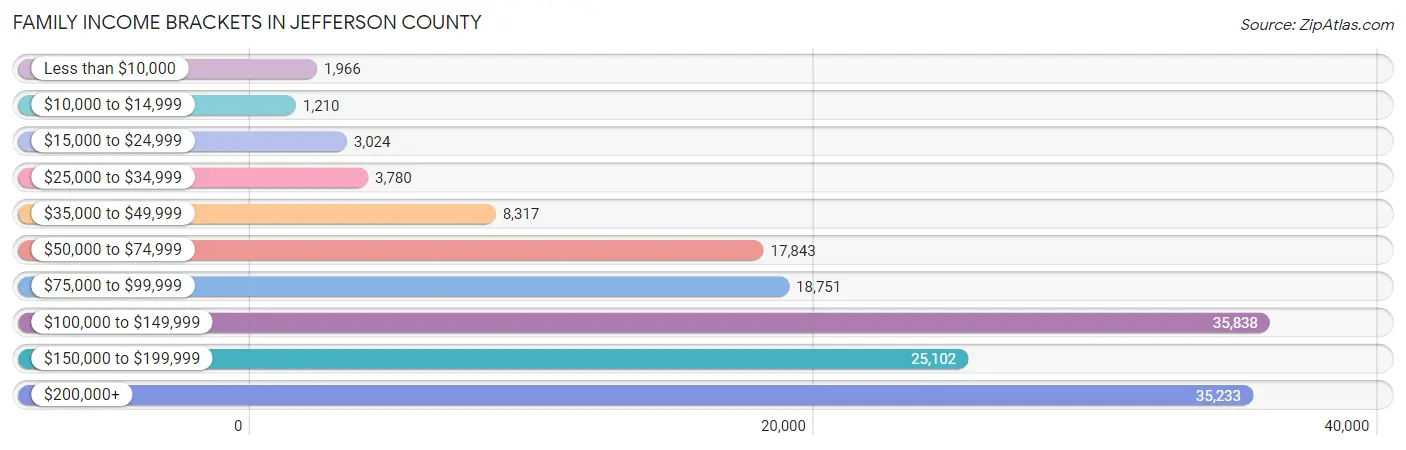
Family Income Brackets in Jefferson County
According to the Jefferson County family income data, there are 35,838 families falling into the $100,000 to $149,999 income range, which is the most common income bracket and makes up 23.7% of all families. Conversely, the $10,000 to $14,999 income bracket is the least frequent group with only 1,210 families (0.8%) belonging to this category.
| Income Bracket | # Families | % Families |
| Less than $10,000 | 1,966 | 1.3% |
| $10,000 to $14,999 | 1,210 | 0.8% |
| $15,000 to $24,999 | 3,024 | 2.0% |
| $25,000 to $34,999 | 3,780 | 2.5% |
| $35,000 to $49,999 | 8,317 | 5.5% |
| $50,000 to $74,999 | 17,843 | 11.8% |
| $75,000 to $99,999 | 18,751 | 12.4% |
| $100,000 to $149,999 | 35,838 | 23.7% |
| $150,000 to $199,999 | 25,102 | 16.6% |
| $200,000+ | 35,233 | 23.3% |
Family Income by Famaliy Size in Jefferson County
4-person families (26,943 | 17.8%) account for the highest median family income in Jefferson County with $158,555 per family, while 2-person families (76,761 | 50.8%) have the highest median income of $57,094 per family member.
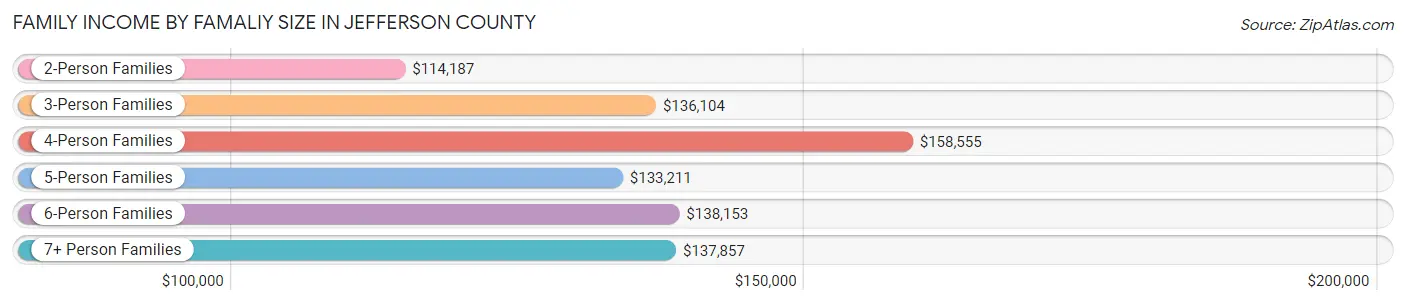
| Income Bracket | # Families | Median Income |
| 2-Person Families | 76,761 (50.8%) | $114,187 |
| 3-Person Families | 33,966 (22.5%) | $136,104 |
| 4-Person Families | 26,943 (17.8%) | $158,555 |
| 5-Person Families | 8,830 (5.8%) | $133,211 |
| 6-Person Families | 3,302 (2.2%) | $138,153 |
| 7+ Person Families | 1,414 (0.9%) | $137,857 |
| Total | 151,216 (100.0%) | $127,276 |
Family Income by Number of Earners in Jefferson County
The median family income in Jefferson County is $127,276, with families comprising 3+ earners (17,487) having the highest median family income of $174,767, while families with no earners (18,907) have the lowest median family income of $75,442, accounting for 11.6% and 12.5% of families, respectively.
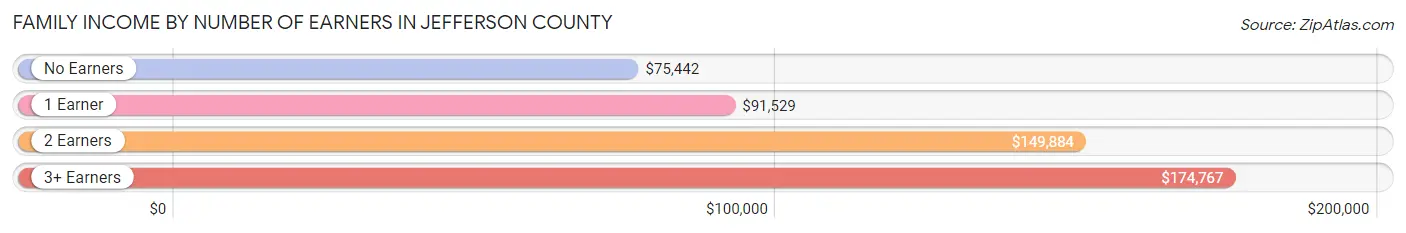
| Number of Earners | # Families | Median Income |
| No Earners | 18,907 (12.5%) | $75,442 |
| 1 Earner | 41,471 (27.4%) | $91,529 |
| 2 Earners | 73,351 (48.5%) | $149,884 |
| 3+ Earners | 17,487 (11.6%) | $174,767 |
| Total | 151,216 (100.0%) | $127,276 |
Household Income in Jefferson County
Household Income Brackets in Jefferson County
With 50,535 households falling in the category, the $100,000 to $149,999 income range is the most frequent in Jefferson County, accounting for 21.2% of all households. In contrast, only 4,052 households (1.7%) fall into the $10,000 to $14,999 income bracket, making it the least populous group.
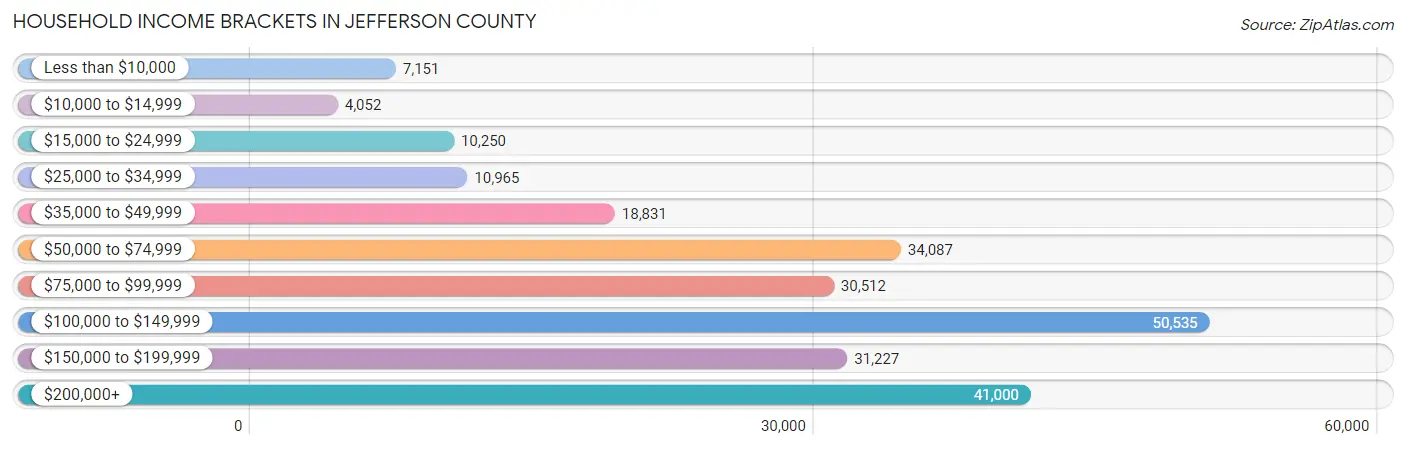
| Income Bracket | # Households | % Households |
| Less than $10,000 | 7,151 | 3.0% |
| $10,000 to $14,999 | 4,052 | 1.7% |
| $15,000 to $24,999 | 10,250 | 4.3% |
| $25,000 to $34,999 | 10,965 | 4.6% |
| $35,000 to $49,999 | 18,831 | 7.9% |
| $50,000 to $74,999 | 34,087 | 14.3% |
| $75,000 to $99,999 | 30,512 | 12.8% |
| $100,000 to $149,999 | 50,535 | 21.2% |
| $150,000 to $199,999 | 31,227 | 13.1% |
| $200,000+ | 41,000 | 17.2% |
Household Income by Householder Age in Jefferson County
The median household income in Jefferson County is $103,167, with the highest median household income of $122,504 found in the 45 to 64 years age bracket for the primary householder. A total of 87,007 households (36.5%) fall into this category. Meanwhile, the 15 to 24 years age bracket for the primary householder has the lowest median household income of $57,832, with 7,056 households (3.0%) in this group.
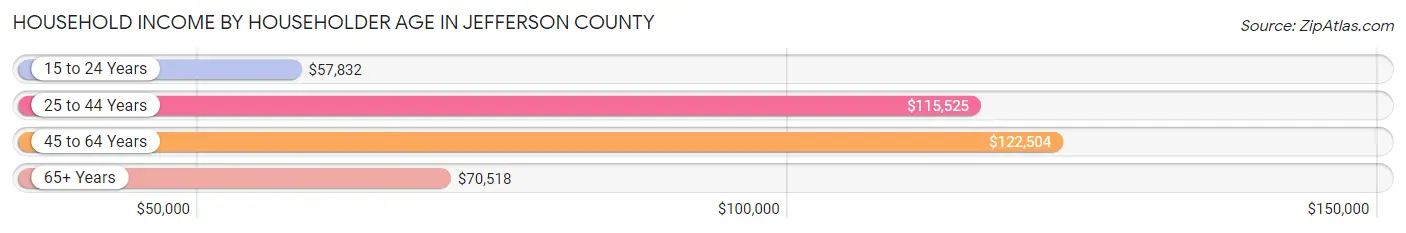
| Income Bracket | # Households | Median Income |
| 15 to 24 Years | 7,056 (3.0%) | $57,832 |
| 25 to 44 Years | 81,898 (34.4%) | $115,525 |
| 45 to 64 Years | 87,007 (36.5%) | $122,504 |
| 65+ Years | 62,411 (26.2%) | $70,518 |
| Total | 238,372 (100.0%) | $103,167 |
Poverty in Jefferson County
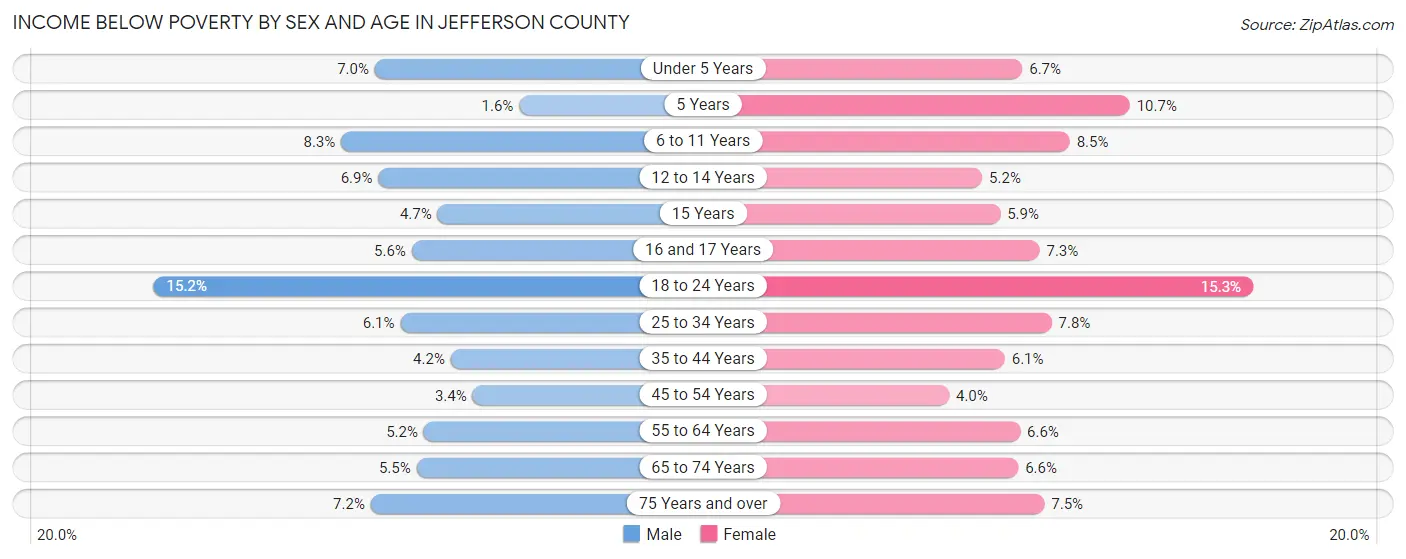
Income Below Poverty by Sex and Age in Jefferson County
With 6.2% poverty level for males and 7.2% for females among the residents of Jefferson County, 18 to 24 year old males and 18 to 24 year old females are the most vulnerable to poverty, with 3,415 males (15.2%) and 3,156 females (15.3%) in their respective age groups living below the poverty level.
| Age Bracket | Male | Female |
| Under 5 Years | 996 (7.0%) | 911 (6.7%) |
| 5 Years | 54 (1.6%) | 349 (10.7%) |
| 6 to 11 Years | 1,546 (8.3%) | 1,460 (8.5%) |
| 12 to 14 Years | 656 (6.9%) | 491 (5.2%) |
| 15 Years | 167 (4.7%) | 185 (5.9%) |
| 16 and 17 Years | 379 (5.6%) | 484 (7.3%) |
| 18 to 24 Years | 3,415 (15.2%) | 3,156 (15.3%) |
| 25 to 34 Years | 2,747 (6.0%) | 3,223 (7.8%) |
| 35 to 44 Years | 1,783 (4.2%) | 2,443 (6.0%) |
| 45 to 54 Years | 1,249 (3.4%) | 1,427 (4.0%) |
| 55 to 64 Years | 2,011 (5.2%) | 2,714 (6.6%) |
| 65 to 74 Years | 1,575 (5.4%) | 2,049 (6.6%) |
| 75 Years and over | 1,109 (7.1%) | 1,615 (7.5%) |
| Total | 17,687 (6.2%) | 20,507 (7.2%) |
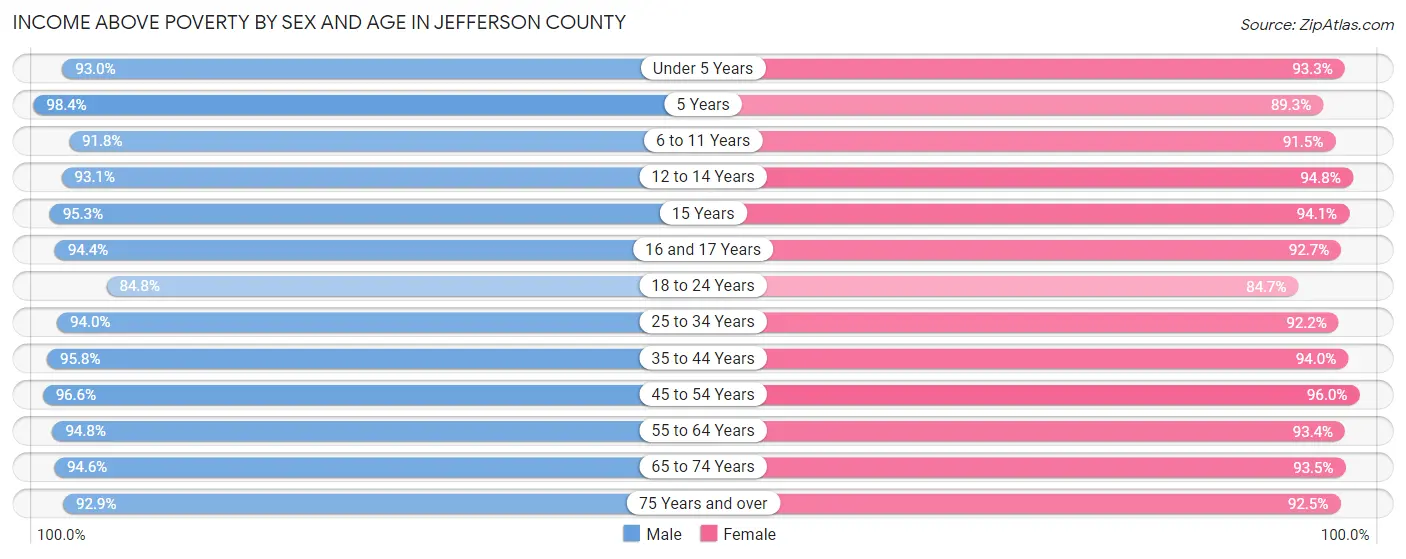
Income Above Poverty by Sex and Age in Jefferson County
According to the poverty statistics in Jefferson County, males aged 5 years and females aged 45 to 54 years are the age groups that are most secure financially, with 98.4% of males and 96.0% of females in these age groups living above the poverty line.
| Age Bracket | Male | Female |
| Under 5 Years | 13,240 (93.0%) | 12,682 (93.3%) |
| 5 Years | 3,233 (98.4%) | 2,916 (89.3%) |
| 6 to 11 Years | 17,190 (91.7%) | 15,794 (91.5%) |
| 12 to 14 Years | 8,891 (93.1%) | 8,927 (94.8%) |
| 15 Years | 3,410 (95.3%) | 2,963 (94.1%) |
| 16 and 17 Years | 6,355 (94.4%) | 6,109 (92.7%) |
| 18 to 24 Years | 19,031 (84.8%) | 17,529 (84.7%) |
| 25 to 34 Years | 42,639 (94.0%) | 38,161 (92.2%) |
| 35 to 44 Years | 40,873 (95.8%) | 37,970 (94.0%) |
| 45 to 54 Years | 35,812 (96.6%) | 34,449 (96.0%) |
| 55 to 64 Years | 36,846 (94.8%) | 38,266 (93.4%) |
| 65 to 74 Years | 27,298 (94.6%) | 29,212 (93.4%) |
| 75 Years and over | 14,402 (92.8%) | 19,849 (92.5%) |
| Total | 269,220 (93.8%) | 264,827 (92.8%) |
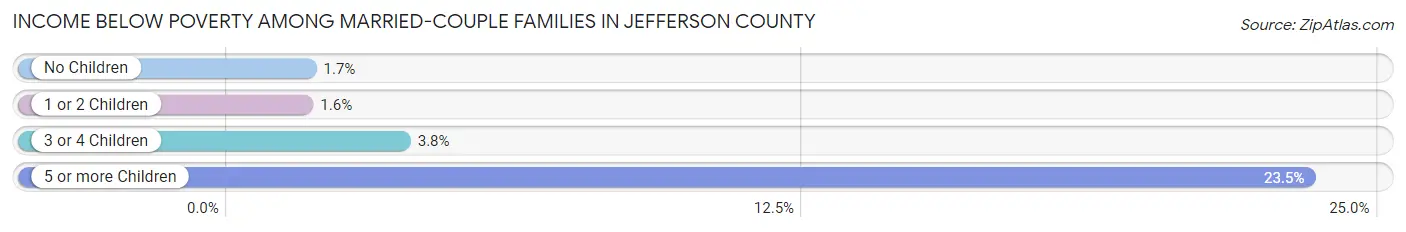
Income Below Poverty Among Married-Couple Families in Jefferson County
The poverty statistics for married-couple families in Jefferson County show that 1.9% or 2,306 of the total 120,938 families live below the poverty line. Families with 5 or more children have the highest poverty rate of 23.5%, comprising of 122 families. On the other hand, families with 1 or 2 children have the lowest poverty rate of 1.6%, which includes 644 families.
| Children | Above Poverty | Below Poverty |
| No Children | 72,685 (98.3%) | 1,266 (1.7%) |
| 1 or 2 Children | 38,544 (98.4%) | 644 (1.6%) |
| 3 or 4 Children | 7,005 (96.2%) | 274 (3.8%) |
| 5 or more Children | 398 (76.5%) | 122 (23.5%) |
| Total | 118,632 (98.1%) | 2,306 (1.9%) |
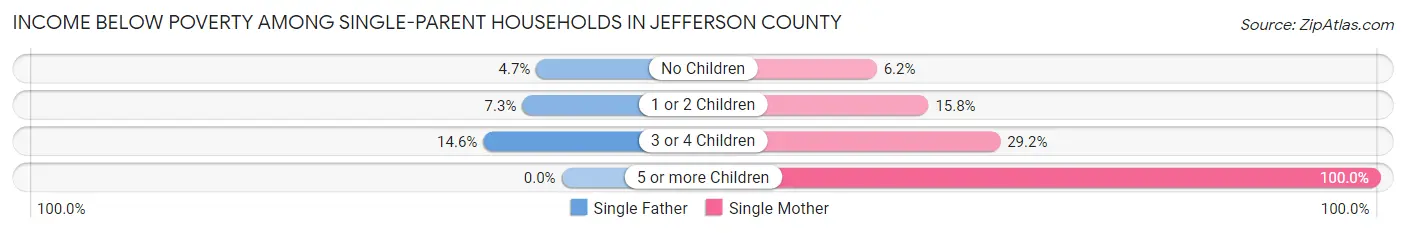
Income Below Poverty Among Single-Parent Households in Jefferson County
According to the poverty data in Jefferson County, 6.5% or 725 single-father households and 13.1% or 2,513 single-mother households are living below the poverty line. Among single-father households, those with 3 or 4 children have the highest poverty rate, with 88 households (14.6%) experiencing poverty. Likewise, among single-mother households, those with 5 or more children have the highest poverty rate, with 157 households (100.0%) falling below the poverty line.
| Children | Single Father | Single Mother |
| No Children | 227 (4.7%) | 527 (6.1%) |
| 1 or 2 Children | 410 (7.3%) | 1,433 (15.8%) |
| 3 or 4 Children | 88 (14.6%) | 396 (29.2%) |
| 5 or more Children | 0 (0.0%) | 157 (100.0%) |
| Total | 725 (6.5%) | 2,513 (13.1%) |
Income Below Poverty Among Married-Couple vs Single-Parent Households in Jefferson County
The poverty data for Jefferson County shows that 2,306 of the married-couple family households (1.9%) and 3,238 of the single-parent households (10.7%) are living below the poverty level. Within the married-couple family households, those with 5 or more children have the highest poverty rate, with 122 households (23.5%) falling below the poverty line. Among the single-parent households, those with 5 or more children have the highest poverty rate, with 157 household (66.0%) living below poverty.
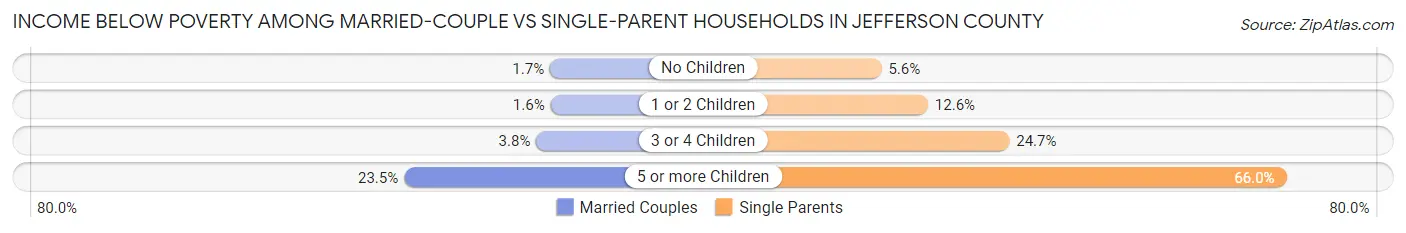
| Children | Married-Couple Families | Single-Parent Households |
| No Children | 1,266 (1.7%) | 754 (5.6%) |
| 1 or 2 Children | 644 (1.6%) | 1,843 (12.6%) |
| 3 or 4 Children | 274 (3.8%) | 484 (24.7%) |
| 5 or more Children | 122 (23.5%) | 157 (66.0%) |
| Total | 2,306 (1.9%) | 3,238 (10.7%) |
Employment Characteristics in Jefferson County
Employment by Class of Employer in Jefferson County
Among the 317,312 employed individuals in Jefferson County, private company employees (214,360 | 67.5%), not-for-profit organizations (24,988 | 7.9%), and local government employees (21,333 | 6.7%) make up the most common classes of employment.
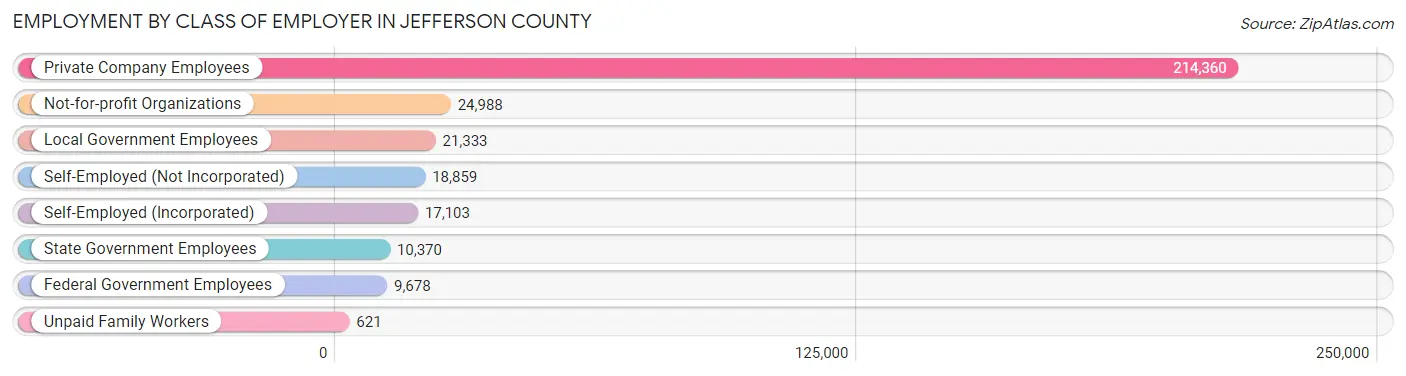
| Employer Class | # Employees | % Employees |
| Private Company Employees | 214,360 | 67.5% |
| Self-Employed (Incorporated) | 17,103 | 5.4% |
| Self-Employed (Not Incorporated) | 18,859 | 5.9% |
| Not-for-profit Organizations | 24,988 | 7.9% |
| Local Government Employees | 21,333 | 6.7% |
| State Government Employees | 10,370 | 3.3% |
| Federal Government Employees | 9,678 | 3.0% |
| Unpaid Family Workers | 621 | 0.2% |
| Total | 317,312 | 100.0% |
Employment Status by Age in Jefferson County
According to the labor force statistics for Jefferson County, out of the total population over 16 years of age (483,453), 69.4% or 335,516 individuals are in the labor force, with 3.9% or 13,085 of them unemployed. The age group with the highest labor force participation rate is 25 to 29 years, with 90.3% or 37,150 individuals in the labor force. Within the labor force, the 16 to 19 years age range has the highest percentage of unemployed individuals, with 12.5% or 1,502 of them being unemployed.
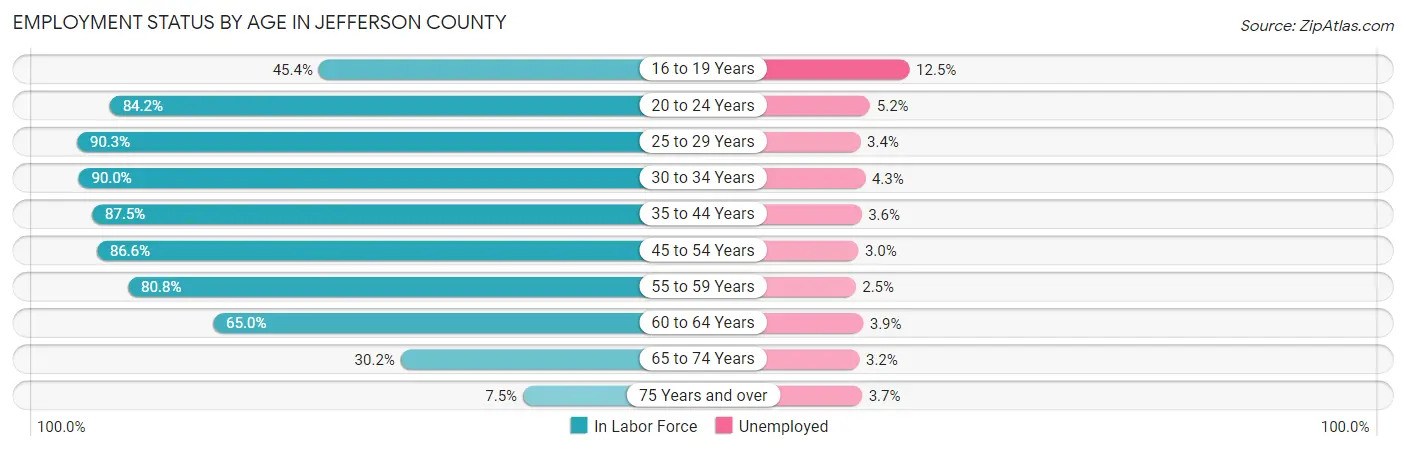
| Age Bracket | In Labor Force | Unemployed |
| 16 to 19 Years | 12,014 (45.4%) | 1,502 (12.5%) |
| 20 to 24 Years | 27,192 (84.2%) | 1,414 (5.2%) |
| 25 to 29 Years | 37,150 (90.3%) | 1,263 (3.4%) |
| 30 to 34 Years | 41,698 (90.0%) | 1,793 (4.3%) |
| 35 to 44 Years | 73,596 (87.5%) | 2,649 (3.6%) |
| 45 to 54 Years | 63,611 (86.6%) | 1,908 (3.0%) |
| 55 to 59 Years | 32,943 (80.8%) | 824 (2.5%) |
| 60 to 64 Years | 25,858 (65.0%) | 1,008 (3.9%) |
| 65 to 74 Years | 18,370 (30.2%) | 588 (3.2%) |
| 75 Years and over | 2,871 (7.5%) | 106 (3.7%) |
| Total | 335,516 (69.4%) | 13,085 (3.9%) |
Employment Status by Educational Attainment in Jefferson County
According to labor force statistics for Jefferson County, 84.4% of individuals (274,797) out of the total population between 25 and 64 years of age (325,589) are in the labor force, with 3.4% or 9,343 of them being unemployed. The group with the highest labor force participation rate are those with the educational attainment of bachelor's degree or higher, with 89.0% or 148,187 individuals in the labor force. Within the labor force, individuals with less than high school education have the highest percentage of unemployment, with 6.3% or 639 of them being unemployed.
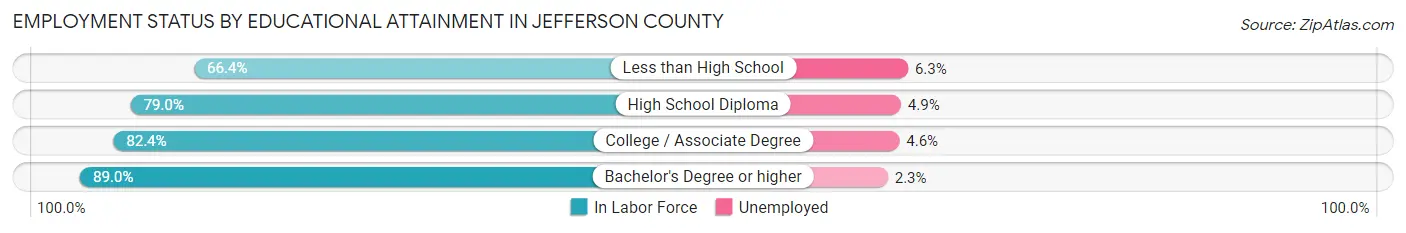
| Educational Attainment | In Labor Force | Unemployed |
| Less than High School | 10,139 (66.4%) | 962 (6.3%) |
| High School Diploma | 46,398 (79.0%) | 2,878 (4.9%) |
| College / Associate Degree | 70,111 (82.4%) | 3,914 (4.6%) |
| Bachelor's Degree or higher | 148,187 (89.0%) | 3,830 (2.3%) |
| Total | 274,797 (84.4%) | 11,070 (3.4%) |
Employment Occupations by Sex in Jefferson County
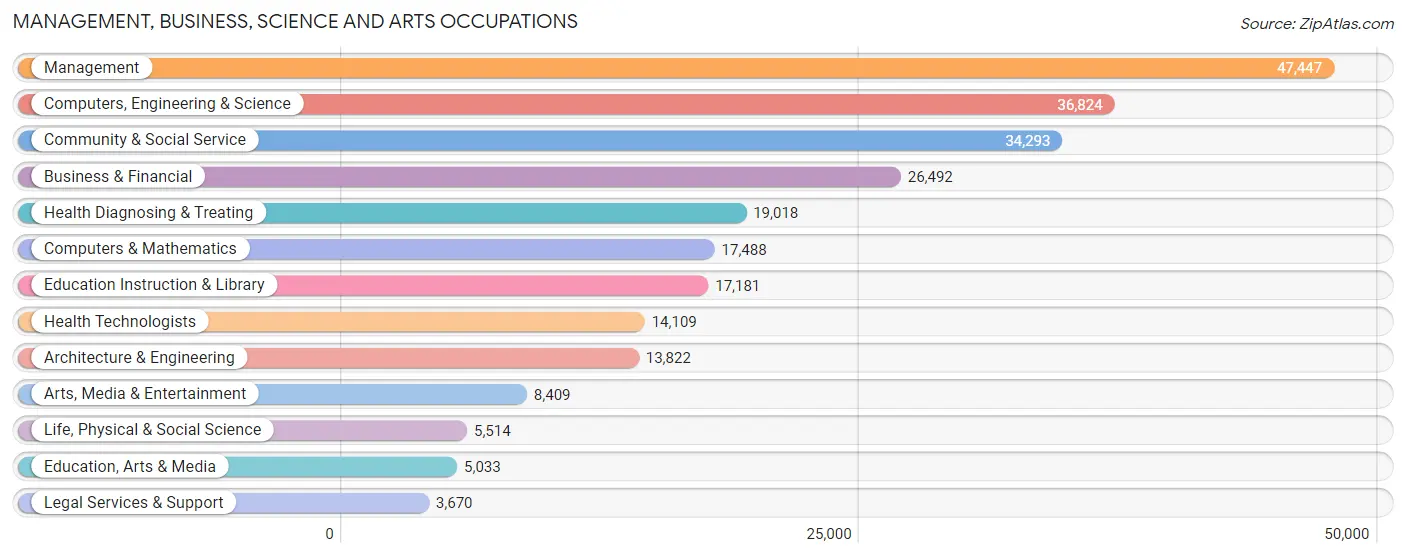
Management, Business, Science and Arts Occupations
The most common Management, Business, Science and Arts occupations in Jefferson County are Management (47,447 | 14.7%), Computers, Engineering & Science (36,824 | 11.4%), Community & Social Service (34,293 | 10.6%), Business & Financial (26,492 | 8.2%), and Health Diagnosing & Treating (19,018 | 5.9%).
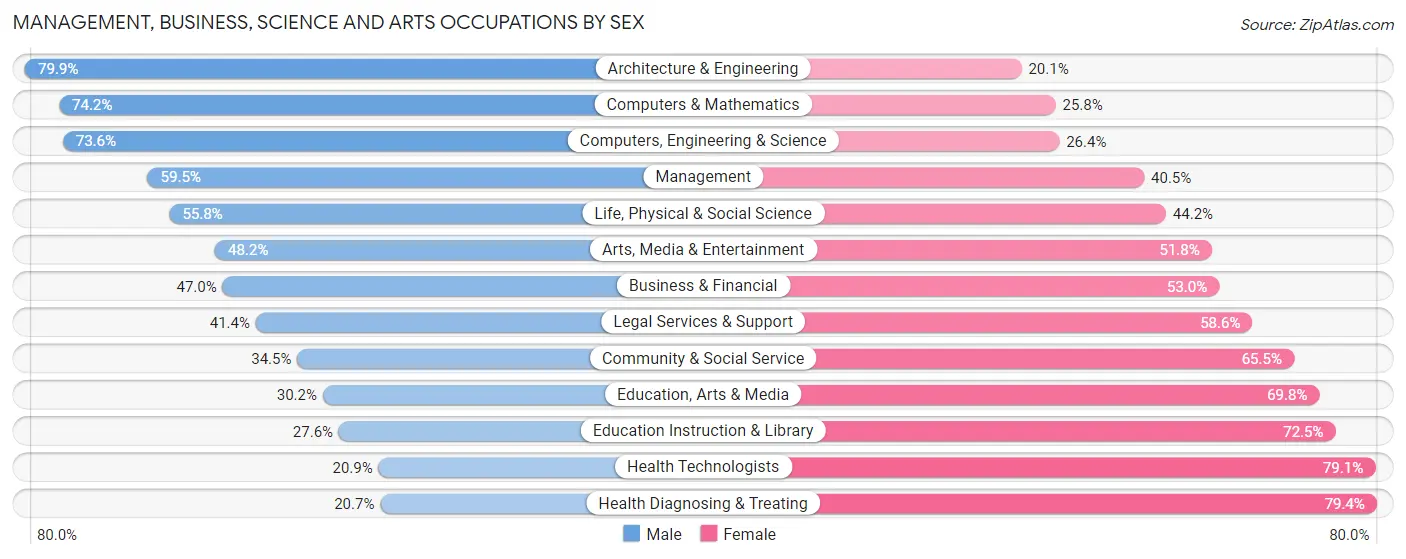
Management, Business, Science and Arts Occupations by Sex
Within the Management, Business, Science and Arts occupations in Jefferson County, the most male-oriented occupations are Architecture & Engineering (79.9%), Computers & Mathematics (74.2%), and Computers, Engineering & Science (73.6%), while the most female-oriented occupations are Health Diagnosing & Treating (79.3%), Health Technologists (79.1%), and Education Instruction & Library (72.5%).
| Occupation | Male | Female |
| Management | 28,211 (59.5%) | 19,236 (40.5%) |
| Business & Financial | 12,440 (47.0%) | 14,052 (53.0%) |
| Computers, Engineering & Science | 27,108 (73.6%) | 9,716 (26.4%) |
| Computers & Mathematics | 12,983 (74.2%) | 4,505 (25.8%) |
| Architecture & Engineering | 11,047 (79.9%) | 2,775 (20.1%) |
| Life, Physical & Social Science | 3,078 (55.8%) | 2,436 (44.2%) |
| Community & Social Service | 11,829 (34.5%) | 22,464 (65.5%) |
| Education, Arts & Media | 1,522 (30.2%) | 3,511 (69.8%) |
| Legal Services & Support | 1,520 (41.4%) | 2,150 (58.6%) |
| Education Instruction & Library | 4,733 (27.6%) | 12,448 (72.5%) |
| Arts, Media & Entertainment | 4,054 (48.2%) | 4,355 (51.8%) |
| Health Diagnosing & Treating | 3,927 (20.6%) | 15,091 (79.3%) |
| Health Technologists | 2,953 (20.9%) | 11,156 (79.1%) |
| Total (Category) | 83,515 (50.9%) | 80,559 (49.1%) |
| Total (Overall) | 171,015 (53.1%) | 151,020 (46.9%) |
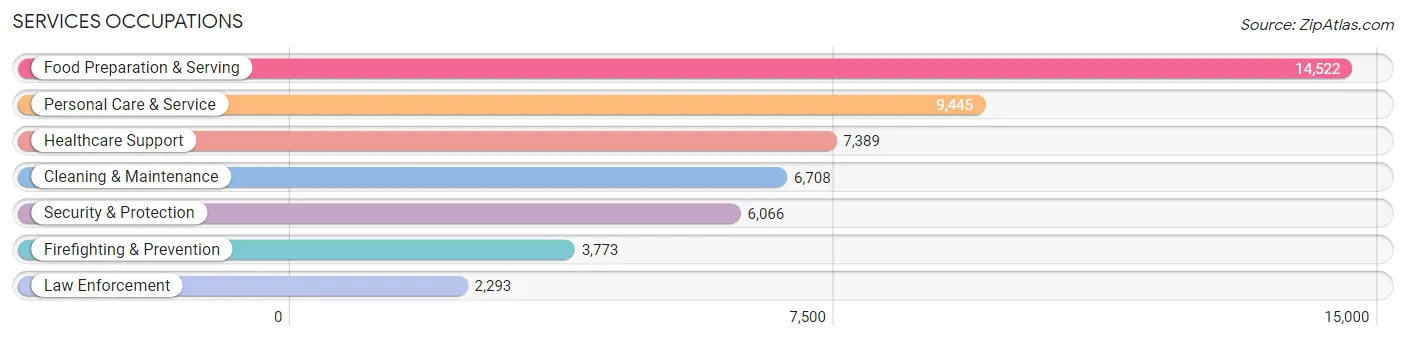
Services Occupations
The most common Services occupations in Jefferson County are Food Preparation & Serving (14,522 | 4.5%), Personal Care & Service (9,445 | 2.9%), Healthcare Support (7,389 | 2.3%), Cleaning & Maintenance (6,708 | 2.1%), and Security & Protection (6,066 | 1.9%).
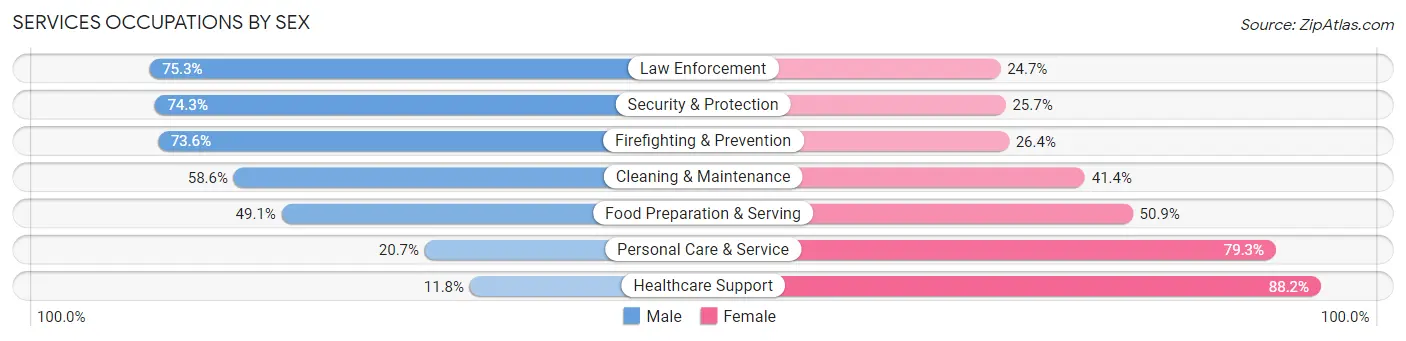
Services Occupations by Sex
Within the Services occupations in Jefferson County, the most male-oriented occupations are Law Enforcement (75.3%), Security & Protection (74.3%), and Firefighting & Prevention (73.6%), while the most female-oriented occupations are Healthcare Support (88.2%), Personal Care & Service (79.3%), and Food Preparation & Serving (50.9%).
| Occupation | Male | Female |
| Healthcare Support | 874 (11.8%) | 6,515 (88.2%) |
| Security & Protection | 4,505 (74.3%) | 1,561 (25.7%) |
| Firefighting & Prevention | 2,778 (73.6%) | 995 (26.4%) |
| Law Enforcement | 1,727 (75.3%) | 566 (24.7%) |
| Food Preparation & Serving | 7,131 (49.1%) | 7,391 (50.9%) |
| Cleaning & Maintenance | 3,929 (58.6%) | 2,779 (41.4%) |
| Personal Care & Service | 1,959 (20.7%) | 7,486 (79.3%) |
| Total (Category) | 18,398 (41.7%) | 25,732 (58.3%) |
| Total (Overall) | 171,015 (53.1%) | 151,020 (46.9%) |
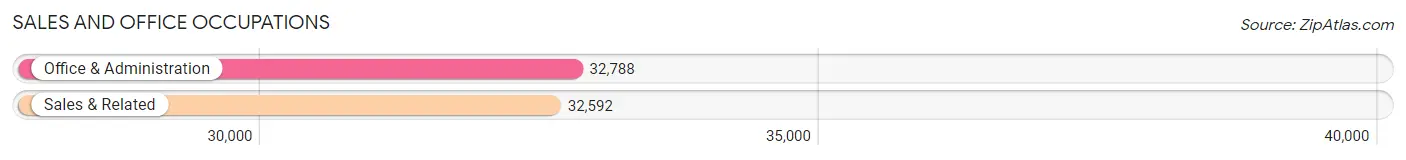
Sales and Office Occupations
The most common Sales and Office occupations in Jefferson County are Office & Administration (32,788 | 10.2%), and Sales & Related (32,592 | 10.1%).
Sales and Office Occupations by Sex
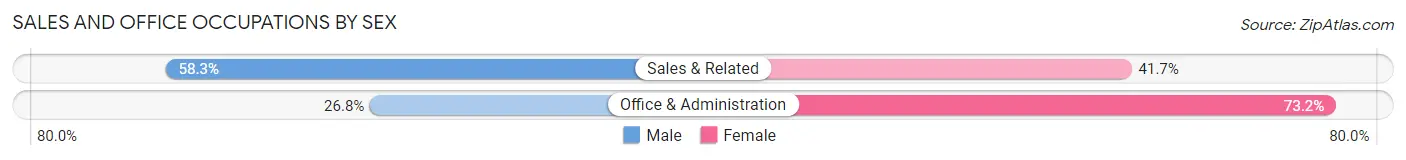
| Occupation | Male | Female |
| Sales & Related | 19,002 (58.3%) | 13,590 (41.7%) |
| Office & Administration | 8,800 (26.8%) | 23,988 (73.2%) |
| Total (Category) | 27,802 (42.5%) | 37,578 (57.5%) |
| Total (Overall) | 171,015 (53.1%) | 151,020 (46.9%) |
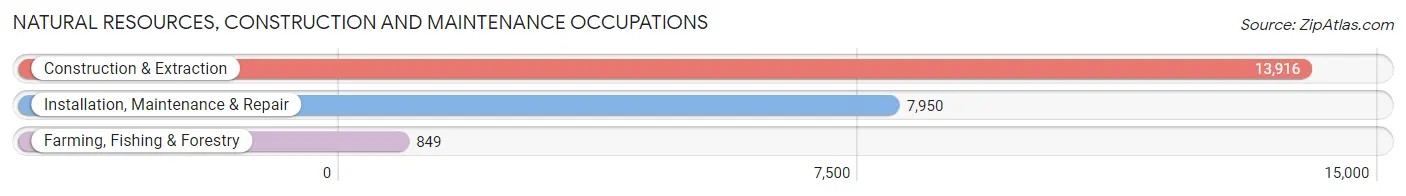
Natural Resources, Construction and Maintenance Occupations
The most common Natural Resources, Construction and Maintenance occupations in Jefferson County are Construction & Extraction (13,916 | 4.3%), Installation, Maintenance & Repair (7,950 | 2.5%), and Farming, Fishing & Forestry (849 | 0.3%).
Natural Resources, Construction and Maintenance Occupations by Sex
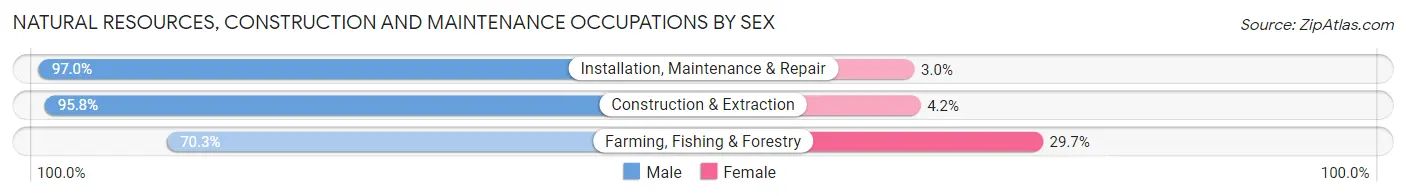
| Occupation | Male | Female |
| Farming, Fishing & Forestry | 597 (70.3%) | 252 (29.7%) |
| Construction & Extraction | 13,329 (95.8%) | 587 (4.2%) |
| Installation, Maintenance & Repair | 7,715 (97.0%) | 235 (3.0%) |
| Total (Category) | 21,641 (95.3%) | 1,074 (4.7%) |
| Total (Overall) | 171,015 (53.1%) | 151,020 (46.9%) |
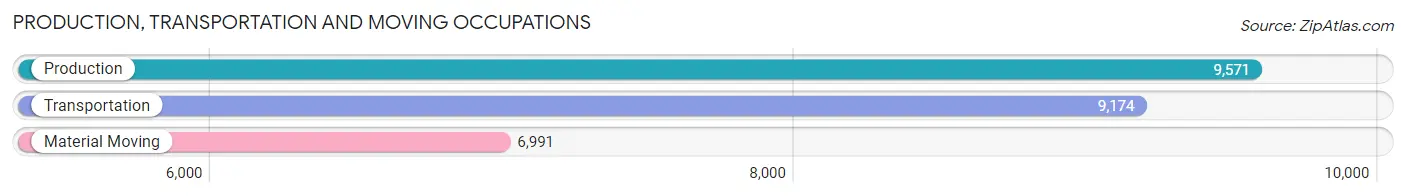
Production, Transportation and Moving Occupations
The most common Production, Transportation and Moving occupations in Jefferson County are Production (9,571 | 3.0%), Transportation (9,174 | 2.9%), and Material Moving (6,991 | 2.2%).
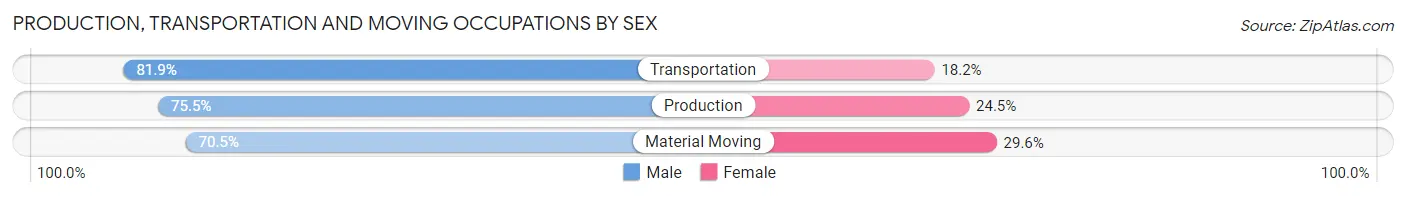
Production, Transportation and Moving Occupations by Sex
| Occupation | Male | Female |
| Production | 7,225 (75.5%) | 2,346 (24.5%) |
| Transportation | 7,509 (81.9%) | 1,665 (18.1%) |
| Material Moving | 4,925 (70.5%) | 2,066 (29.5%) |
| Total (Category) | 19,659 (76.4%) | 6,077 (23.6%) |
| Total (Overall) | 171,015 (53.1%) | 151,020 (46.9%) |
Employment Industries by Sex in Jefferson County
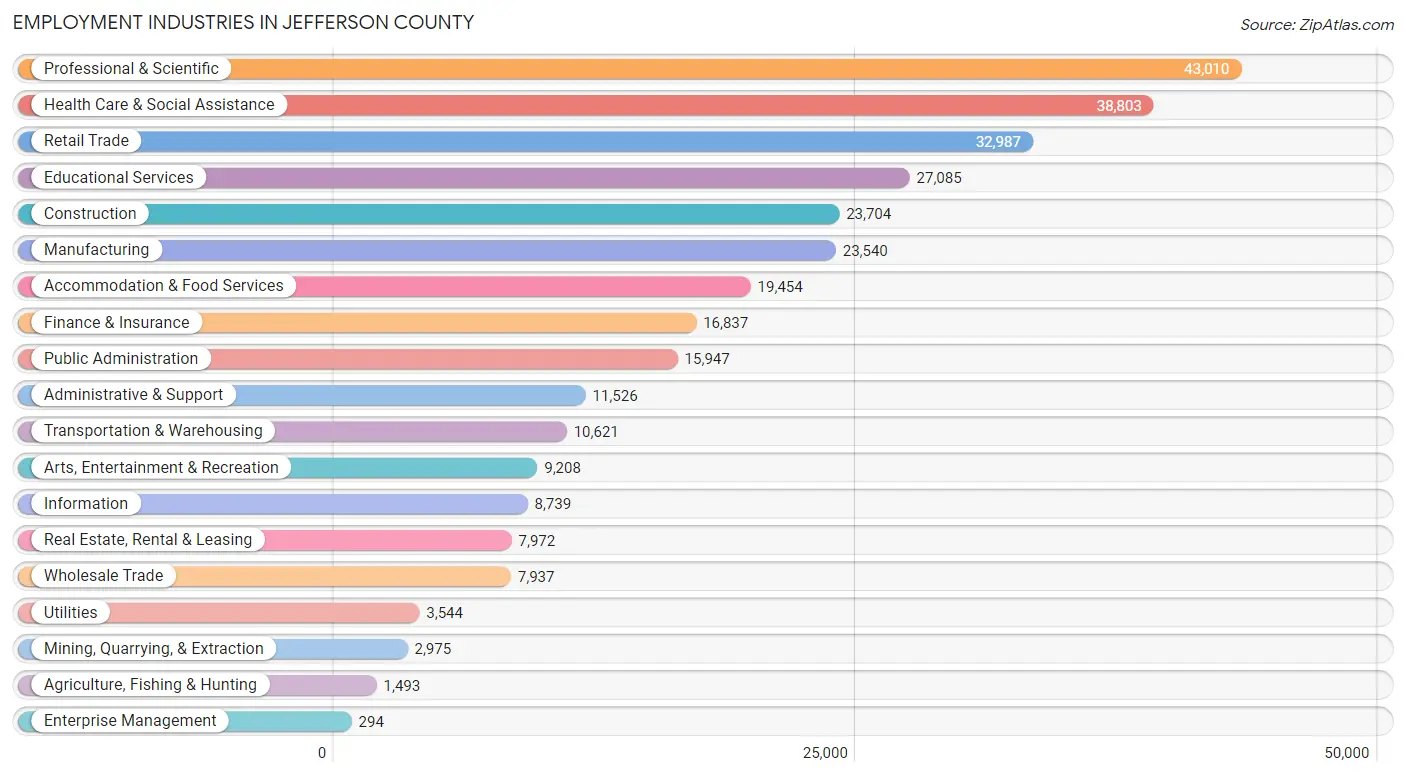
Employment Industries in Jefferson County
The major employment industries in Jefferson County include Professional & Scientific (43,010 | 13.4%), Health Care & Social Assistance (38,803 | 12.0%), Retail Trade (32,987 | 10.2%), Educational Services (27,085 | 8.4%), and Construction (23,704 | 7.4%).
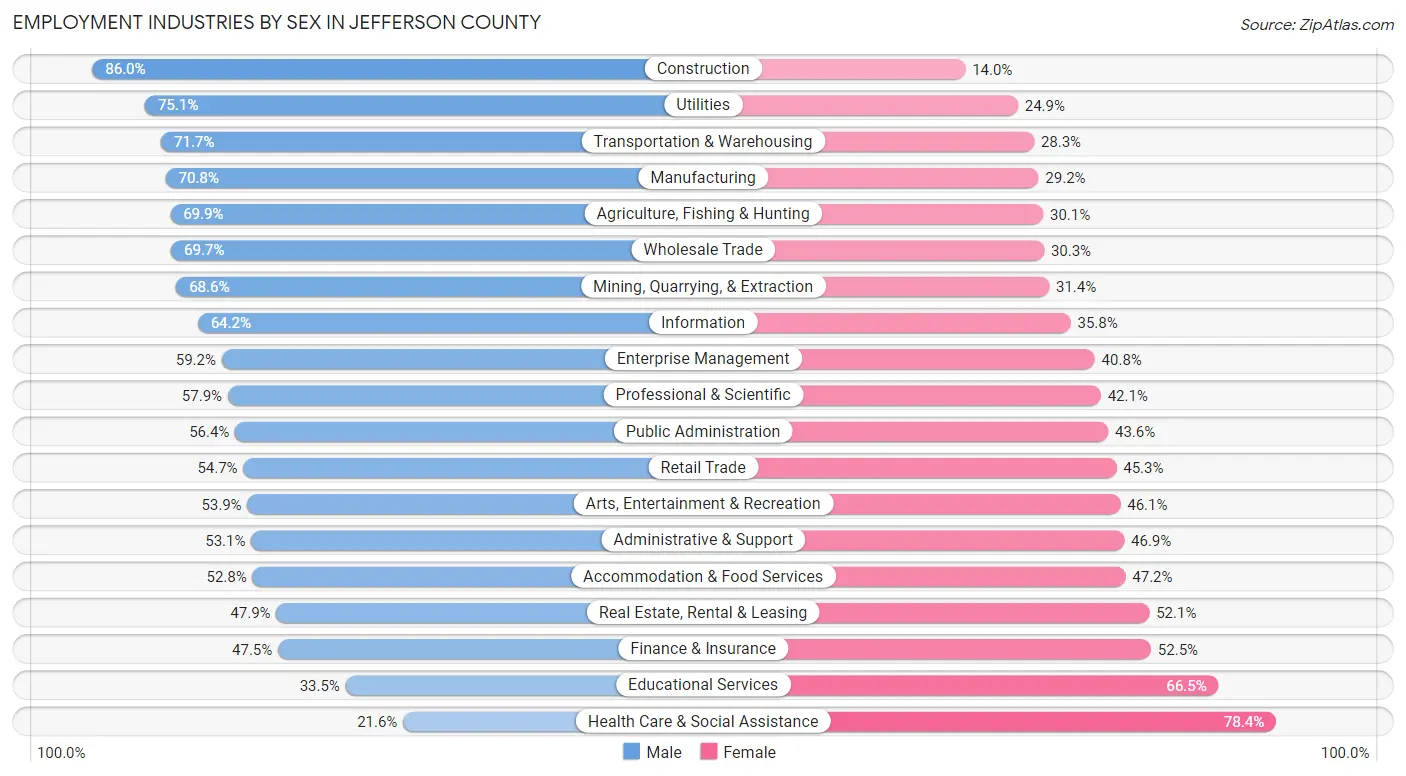
Employment Industries by Sex in Jefferson County
The Jefferson County industries that see more men than women are Construction (86.0%), Utilities (75.1%), and Transportation & Warehousing (71.7%), whereas the industries that tend to have a higher number of women are Health Care & Social Assistance (78.4%), Educational Services (66.5%), and Finance & Insurance (52.5%).
| Industry | Male | Female |
| Agriculture, Fishing & Hunting | 1,043 (69.9%) | 450 (30.1%) |
| Mining, Quarrying, & Extraction | 2,041 (68.6%) | 934 (31.4%) |
| Construction | 20,379 (86.0%) | 3,325 (14.0%) |
| Manufacturing | 16,671 (70.8%) | 6,869 (29.2%) |
| Wholesale Trade | 5,530 (69.7%) | 2,407 (30.3%) |
| Retail Trade | 18,045 (54.7%) | 14,942 (45.3%) |
| Transportation & Warehousing | 7,620 (71.7%) | 3,001 (28.3%) |
| Utilities | 2,661 (75.1%) | 883 (24.9%) |
| Information | 5,607 (64.2%) | 3,132 (35.8%) |
| Finance & Insurance | 8,003 (47.5%) | 8,834 (52.5%) |
| Real Estate, Rental & Leasing | 3,817 (47.9%) | 4,155 (52.1%) |
| Professional & Scientific | 24,913 (57.9%) | 18,097 (42.1%) |
| Enterprise Management | 174 (59.2%) | 120 (40.8%) |
| Administrative & Support | 6,118 (53.1%) | 5,408 (46.9%) |
| Educational Services | 9,083 (33.5%) | 18,002 (66.5%) |
| Health Care & Social Assistance | 8,396 (21.6%) | 30,407 (78.4%) |
| Arts, Entertainment & Recreation | 4,960 (53.9%) | 4,248 (46.1%) |
| Accommodation & Food Services | 10,276 (52.8%) | 9,178 (47.2%) |
| Public Administration | 8,996 (56.4%) | 6,951 (43.6%) |
| Total | 171,015 (53.1%) | 151,020 (46.9%) |
Education in Jefferson County
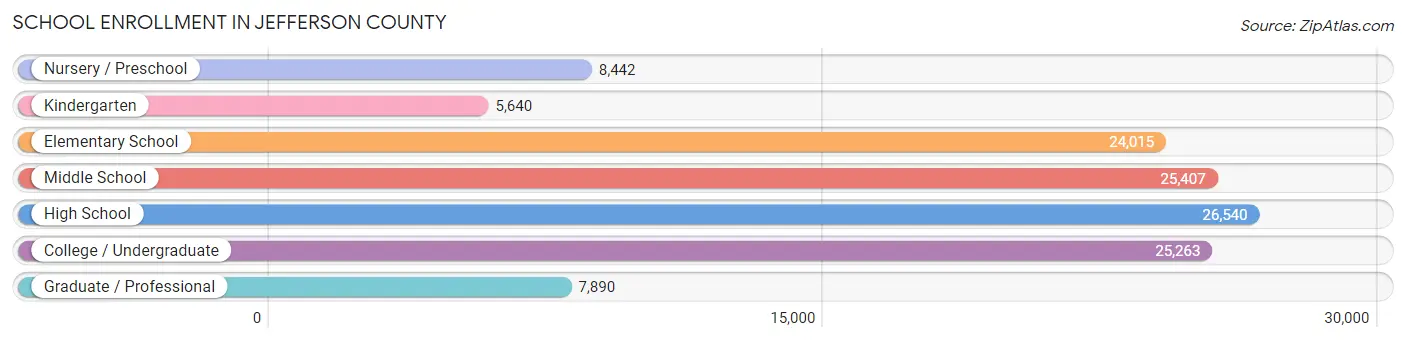
School Enrollment in Jefferson County
The most common levels of schooling among the 123,197 students in Jefferson County are high school (26,540 | 21.5%), middle school (25,407 | 20.6%), and college / undergraduate (25,263 | 20.5%).
| School Level | # Students | % Students |
| Nursery / Preschool | 8,442 | 6.9% |
| Kindergarten | 5,640 | 4.6% |
| Elementary School | 24,015 | 19.5% |
| Middle School | 25,407 | 20.6% |
| High School | 26,540 | 21.5% |
| College / Undergraduate | 25,263 | 20.5% |
| Graduate / Professional | 7,890 | 6.4% |
| Total | 123,197 | 100.0% |
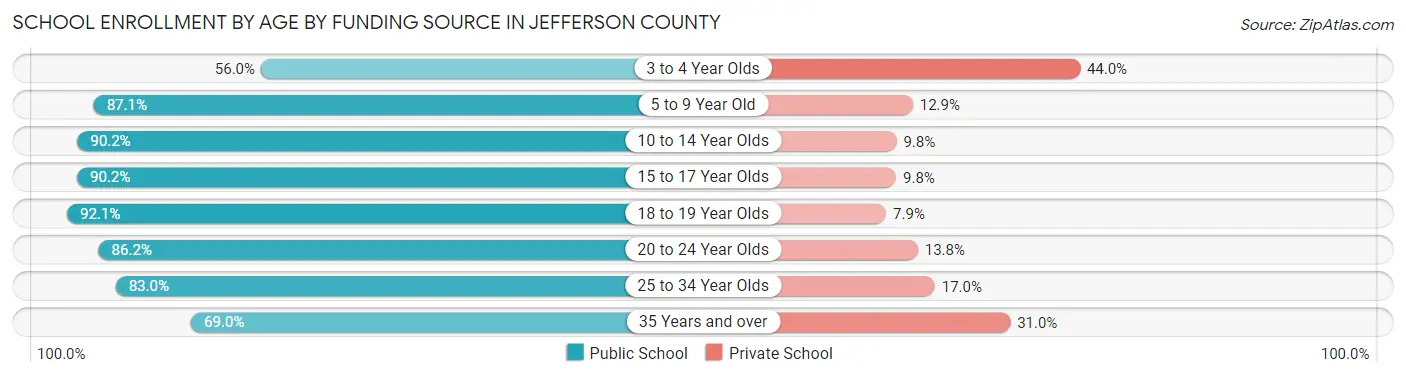
School Enrollment by Age by Funding Source in Jefferson County
Out of a total of 123,197 students who are enrolled in schools in Jefferson County, 17,494 (14.2%) attend a private institution, while the remaining 105,703 (85.8%) are enrolled in public schools. The age group of 3 to 4 year olds has the highest likelihood of being enrolled in private schools, with 2,713 (44.0% in the age bracket) enrolled. Conversely, the age group of 18 to 19 year olds has the lowest likelihood of being enrolled in a private school, with 8,054 (92.1% in the age bracket) attending a public institution.
| Age Bracket | Public School | Private School |
| 3 to 4 Year Olds | 3,452 (56.0%) | 2,713 (44.0%) |
| 5 to 9 Year Old | 25,731 (87.1%) | 3,803 (12.9%) |
| 10 to 14 Year Olds | 27,820 (90.2%) | 3,036 (9.8%) |
| 15 to 17 Year Olds | 17,760 (90.2%) | 1,924 (9.8%) |
| 18 to 19 Year Olds | 8,054 (92.1%) | 692 (7.9%) |
| 20 to 24 Year Olds | 10,051 (86.2%) | 1,609 (13.8%) |
| 25 to 34 Year Olds | 8,068 (83.0%) | 1,650 (17.0%) |
| 35 Years and over | 4,714 (69.0%) | 2,120 (31.0%) |
| Total | 105,703 (85.8%) | 17,494 (14.2%) |
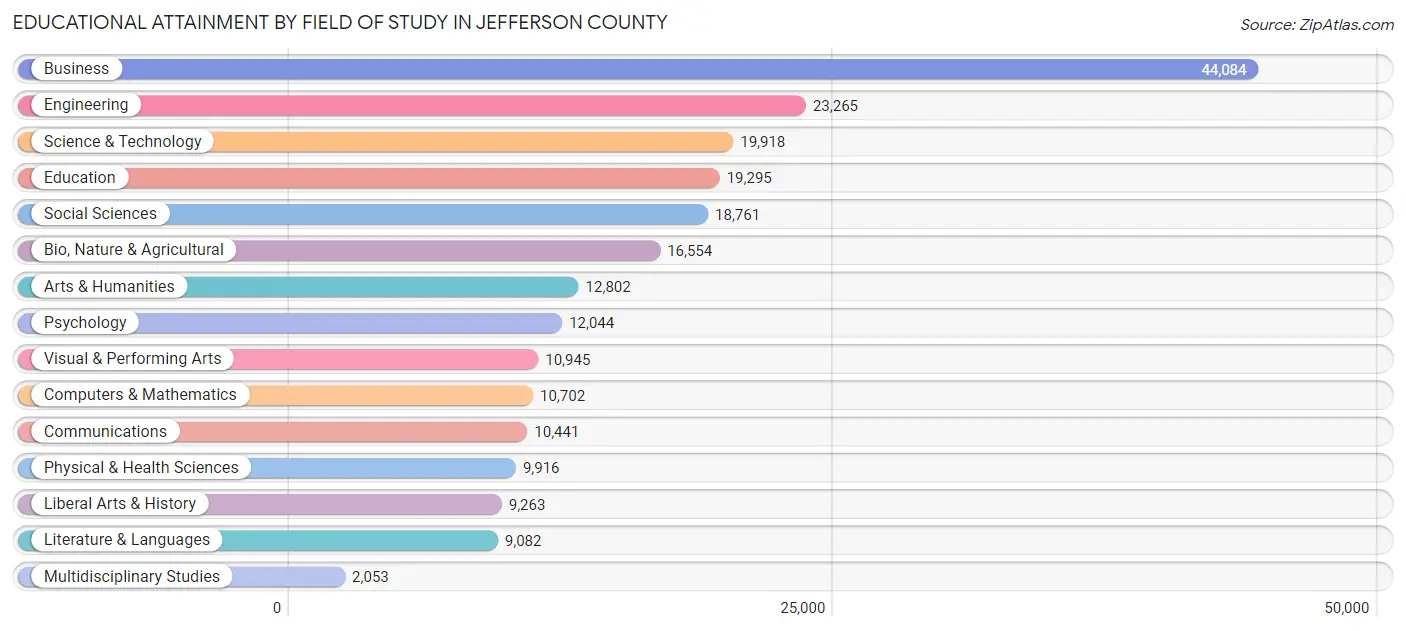
Educational Attainment by Field of Study in Jefferson County
Business (44,084 | 19.2%), engineering (23,265 | 10.2%), science & technology (19,918 | 8.7%), education (19,295 | 8.4%), and social sciences (18,761 | 8.2%) are the most common fields of study among 229,125 individuals in Jefferson County who have obtained a bachelor's degree or higher.
| Field of Study | # Graduates | % Graduates |
| Computers & Mathematics | 10,702 | 4.7% |
| Bio, Nature & Agricultural | 16,554 | 7.2% |
| Physical & Health Sciences | 9,916 | 4.3% |
| Psychology | 12,044 | 5.3% |
| Social Sciences | 18,761 | 8.2% |
| Engineering | 23,265 | 10.2% |
| Multidisciplinary Studies | 2,053 | 0.9% |
| Science & Technology | 19,918 | 8.7% |
| Business | 44,084 | 19.2% |
| Education | 19,295 | 8.4% |
| Literature & Languages | 9,082 | 4.0% |
| Liberal Arts & History | 9,263 | 4.0% |
| Visual & Performing Arts | 10,945 | 4.8% |
| Communications | 10,441 | 4.6% |
| Arts & Humanities | 12,802 | 5.6% |
| Total | 229,125 | 100.0% |
Transportation & Commute in Jefferson County
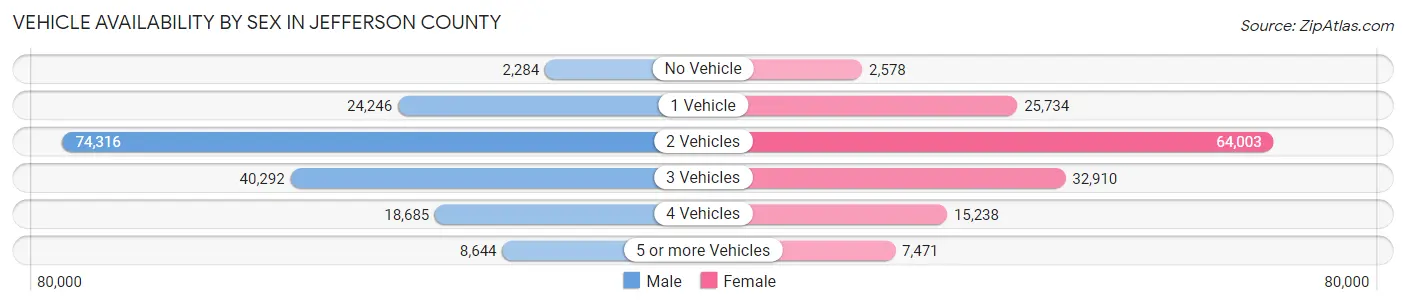
Vehicle Availability by Sex in Jefferson County
The most prevalent vehicle ownership categories in Jefferson County are males with 2 vehicles (74,316, accounting for 44.1%) and females with 2 vehicles (64,003, making up 50.2%).
| Vehicles Available | Male | Female |
| No Vehicle | 2,284 (1.4%) | 2,578 (1.7%) |
| 1 Vehicle | 24,246 (14.4%) | 25,734 (17.4%) |
| 2 Vehicles | 74,316 (44.1%) | 64,003 (43.3%) |
| 3 Vehicles | 40,292 (23.9%) | 32,910 (22.3%) |
| 4 Vehicles | 18,685 (11.1%) | 15,238 (10.3%) |
| 5 or more Vehicles | 8,644 (5.1%) | 7,471 (5.1%) |
| Total | 168,467 (100.0%) | 147,934 (100.0%) |
Commute Time in Jefferson County
The most frequently occuring commute durations in Jefferson County are 30 to 34 minutes (42,558 commuters, 16.6%), 20 to 24 minutes (38,885 commuters, 15.2%), and 15 to 19 minutes (38,117 commuters, 14.9%).
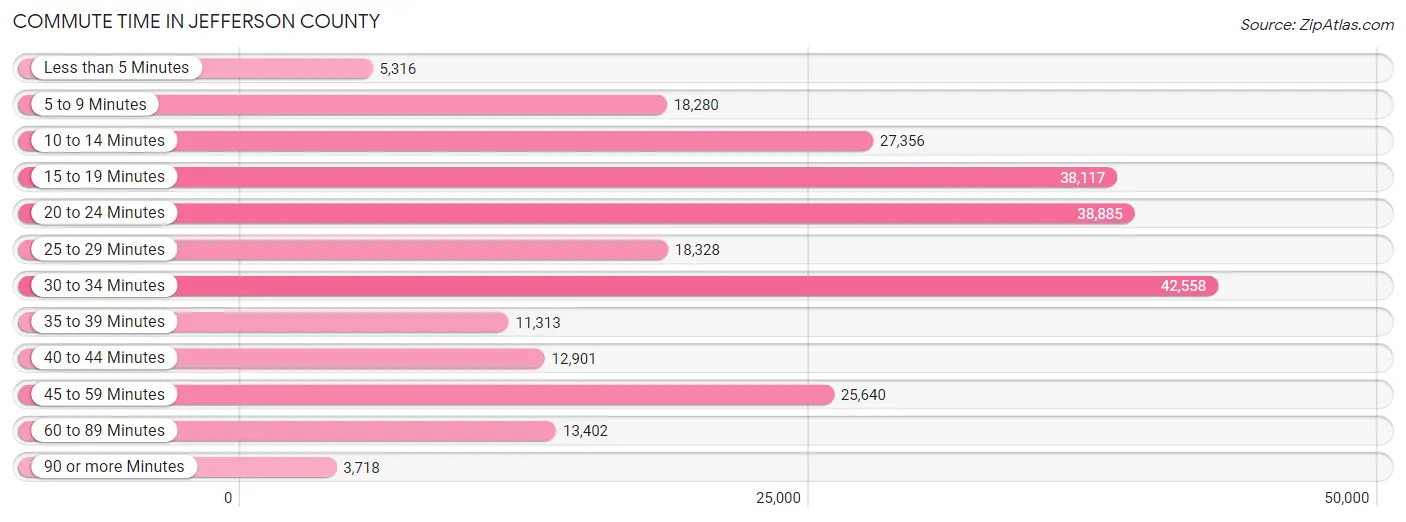
| Commute Time | # Commuters | % Commuters |
| Less than 5 Minutes | 5,316 | 2.1% |
| 5 to 9 Minutes | 18,280 | 7.1% |
| 10 to 14 Minutes | 27,356 | 10.7% |
| 15 to 19 Minutes | 38,117 | 14.9% |
| 20 to 24 Minutes | 38,885 | 15.2% |
| 25 to 29 Minutes | 18,328 | 7.2% |
| 30 to 34 Minutes | 42,558 | 16.6% |
| 35 to 39 Minutes | 11,313 | 4.4% |
| 40 to 44 Minutes | 12,901 | 5.0% |
| 45 to 59 Minutes | 25,640 | 10.0% |
| 60 to 89 Minutes | 13,402 | 5.2% |
| 90 or more Minutes | 3,718 | 1.5% |
Commute Time by Sex in Jefferson County
The most common commute times in Jefferson County are 30 to 34 minutes (23,667 commuters, 17.1%) for males and 30 to 34 minutes (18,891 commuters, 16.1%) for females.
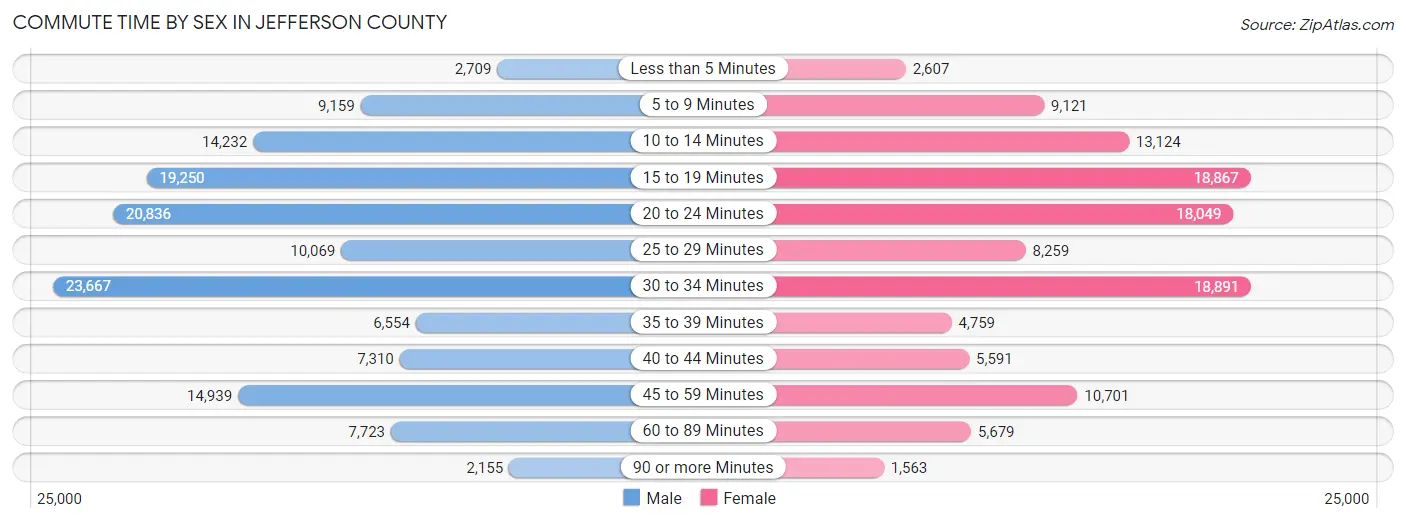
| Commute Time | Male | Female |
| Less than 5 Minutes | 2,709 (1.9%) | 2,607 (2.2%) |
| 5 to 9 Minutes | 9,159 (6.6%) | 9,121 (7.8%) |
| 10 to 14 Minutes | 14,232 (10.3%) | 13,124 (11.2%) |
| 15 to 19 Minutes | 19,250 (13.9%) | 18,867 (16.1%) |
| 20 to 24 Minutes | 20,836 (15.0%) | 18,049 (15.4%) |
| 25 to 29 Minutes | 10,069 (7.3%) | 8,259 (7.0%) |
| 30 to 34 Minutes | 23,667 (17.1%) | 18,891 (16.1%) |
| 35 to 39 Minutes | 6,554 (4.7%) | 4,759 (4.1%) |
| 40 to 44 Minutes | 7,310 (5.3%) | 5,591 (4.8%) |
| 45 to 59 Minutes | 14,939 (10.8%) | 10,701 (9.1%) |
| 60 to 89 Minutes | 7,723 (5.6%) | 5,679 (4.9%) |
| 90 or more Minutes | 2,155 (1.5%) | 1,563 (1.3%) |
Time of Departure to Work by Sex in Jefferson County
The most frequent times of departure to work in Jefferson County are 7:00 AM to 7:29 AM (20,151, 14.5%) for males and 7:00 AM to 7:29 AM (19,215, 16.4%) for females.
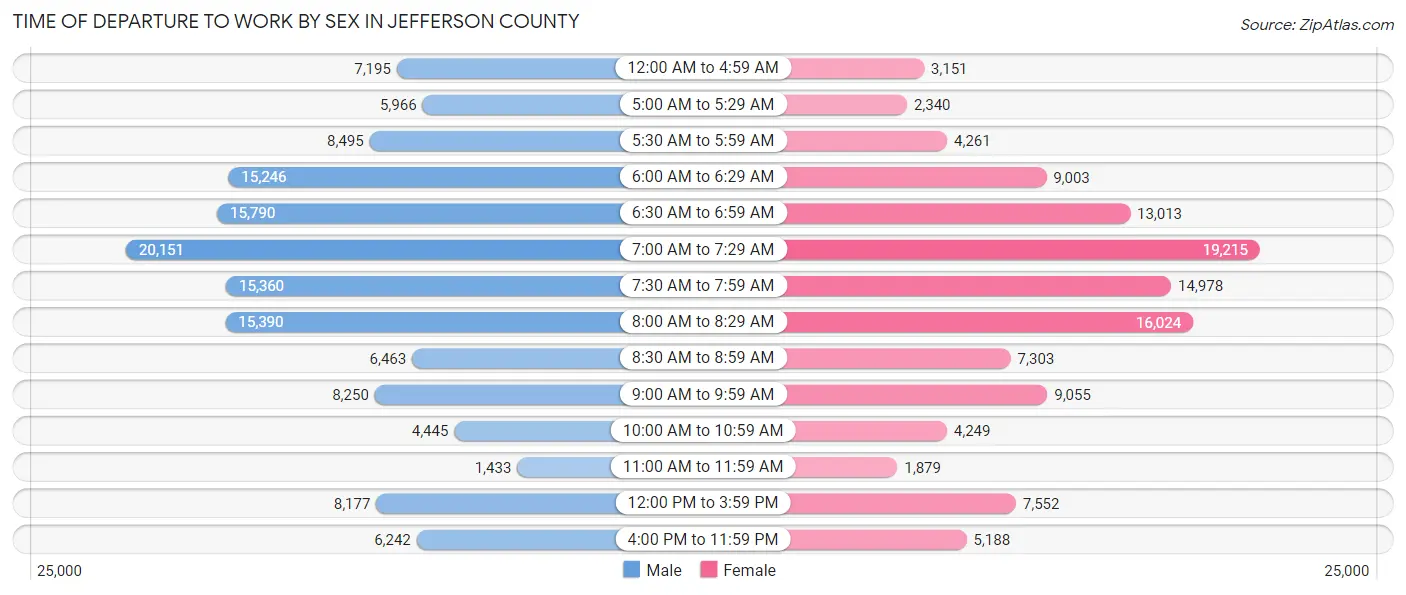
| Time of Departure | Male | Female |
| 12:00 AM to 4:59 AM | 7,195 (5.2%) | 3,151 (2.7%) |
| 5:00 AM to 5:29 AM | 5,966 (4.3%) | 2,340 (2.0%) |
| 5:30 AM to 5:59 AM | 8,495 (6.1%) | 4,261 (3.6%) |
| 6:00 AM to 6:29 AM | 15,246 (11.0%) | 9,003 (7.7%) |
| 6:30 AM to 6:59 AM | 15,790 (11.4%) | 13,013 (11.1%) |
| 7:00 AM to 7:29 AM | 20,151 (14.5%) | 19,215 (16.4%) |
| 7:30 AM to 7:59 AM | 15,360 (11.1%) | 14,978 (12.8%) |
| 8:00 AM to 8:29 AM | 15,390 (11.1%) | 16,024 (13.7%) |
| 8:30 AM to 8:59 AM | 6,463 (4.7%) | 7,303 (6.2%) |
| 9:00 AM to 9:59 AM | 8,250 (5.9%) | 9,055 (7.7%) |
| 10:00 AM to 10:59 AM | 4,445 (3.2%) | 4,249 (3.6%) |
| 11:00 AM to 11:59 AM | 1,433 (1.0%) | 1,879 (1.6%) |
| 12:00 PM to 3:59 PM | 8,177 (5.9%) | 7,552 (6.4%) |
| 4:00 PM to 11:59 PM | 6,242 (4.5%) | 5,188 (4.4%) |
| Total | 138,603 (100.0%) | 117,211 (100.0%) |
Housing Occupancy in Jefferson County
Occupancy by Ownership in Jefferson County
Of the total 238,372 dwellings in Jefferson County, owner-occupied units account for 168,238 (70.6%), while renter-occupied units make up 70,134 (29.4%).
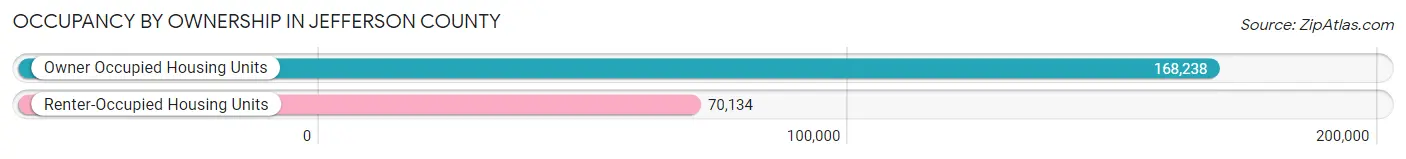
| Occupancy | # Housing Units | % Housing Units |
| Owner Occupied Housing Units | 168,238 | 70.6% |
| Renter-Occupied Housing Units | 70,134 | 29.4% |
| Total Occupied Housing Units | 238,372 | 100.0% |
Occupancy by Household Size in Jefferson County
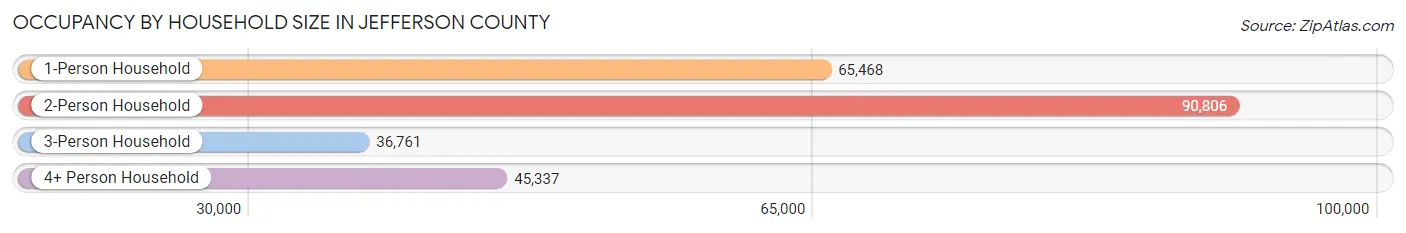
| Household Size | # Housing Units | % Housing Units |
| 1-Person Household | 65,468 | 27.5% |
| 2-Person Household | 90,806 | 38.1% |
| 3-Person Household | 36,761 | 15.4% |
| 4+ Person Household | 45,337 | 19.0% |
| Total Housing Units | 238,372 | 100.0% |
Occupancy by Ownership by Household Size in Jefferson County
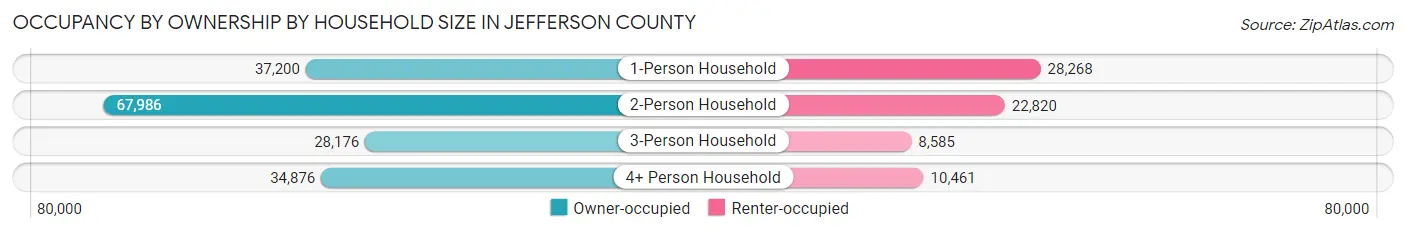
| Household Size | Owner-occupied | Renter-occupied |
| 1-Person Household | 37,200 (56.8%) | 28,268 (43.2%) |
| 2-Person Household | 67,986 (74.9%) | 22,820 (25.1%) |
| 3-Person Household | 28,176 (76.6%) | 8,585 (23.4%) |
| 4+ Person Household | 34,876 (76.9%) | 10,461 (23.1%) |
| Total Housing Units | 168,238 (70.6%) | 70,134 (29.4%) |
Occupancy by Educational Attainment in Jefferson County
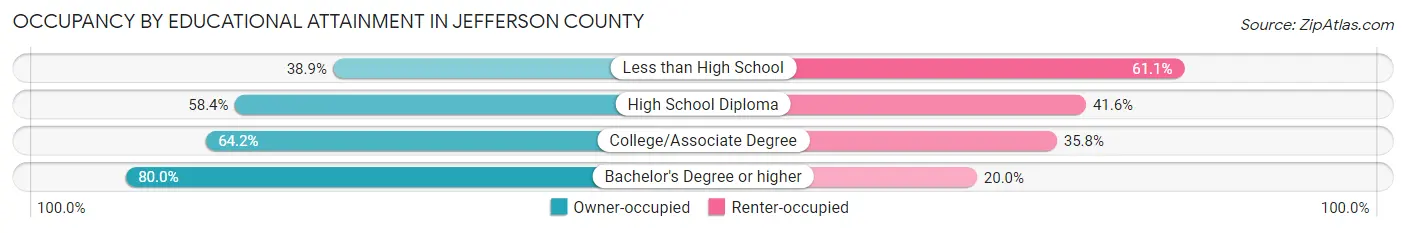
| Household Size | Owner-occupied | Renter-occupied |
| Less than High School | 3,463 (38.9%) | 5,438 (61.1%) |
| High School Diploma | 23,287 (58.4%) | 16,584 (41.6%) |
| College/Associate Degree | 41,583 (64.2%) | 23,201 (35.8%) |
| Bachelor's Degree or higher | 99,905 (80.0%) | 24,911 (20.0%) |
Occupancy by Age of Householder in Jefferson County
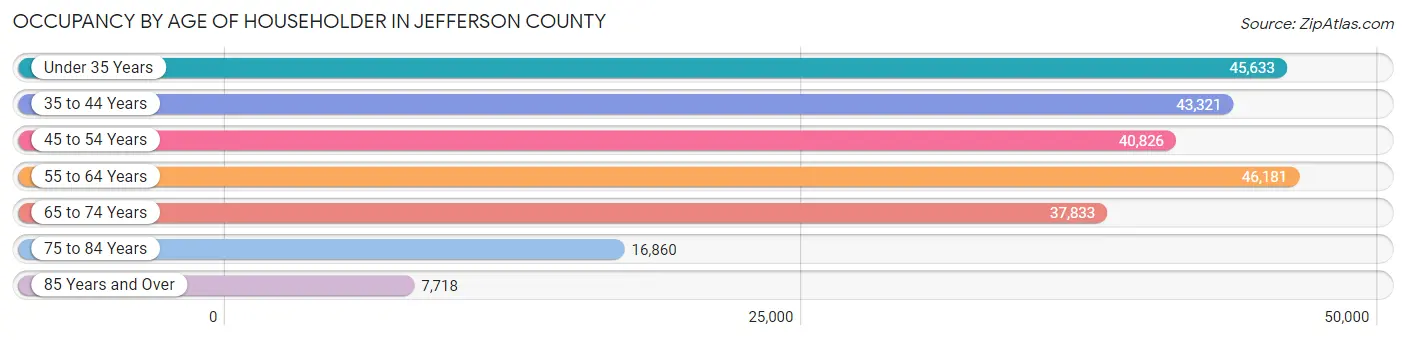
| Age Bracket | # Households | % Households |
| Under 35 Years | 45,633 | 19.1% |
| 35 to 44 Years | 43,321 | 18.2% |
| 45 to 54 Years | 40,826 | 17.1% |
| 55 to 64 Years | 46,181 | 19.4% |
| 65 to 74 Years | 37,833 | 15.9% |
| 75 to 84 Years | 16,860 | 7.1% |
| 85 Years and Over | 7,718 | 3.2% |
| Total | 238,372 | 100.0% |
Housing Finances in Jefferson County
Median Income by Occupancy in Jefferson County
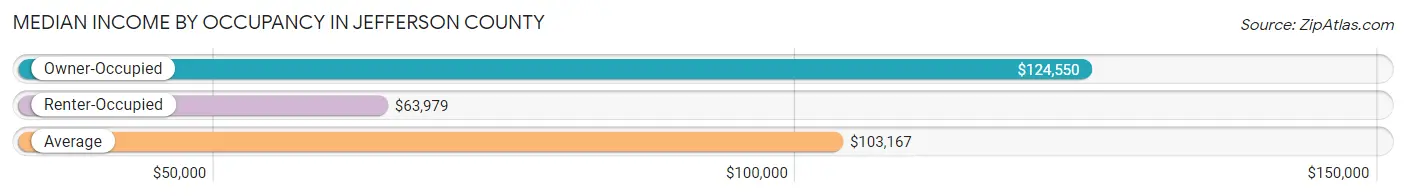
| Occupancy Type | # Households | Median Income |
| Owner-Occupied | 168,238 (70.6%) | $124,550 |
| Renter-Occupied | 70,134 (29.4%) | $63,979 |
| Average | 238,372 (100.0%) | $103,167 |
Occupancy by Householder Income Bracket in Jefferson County
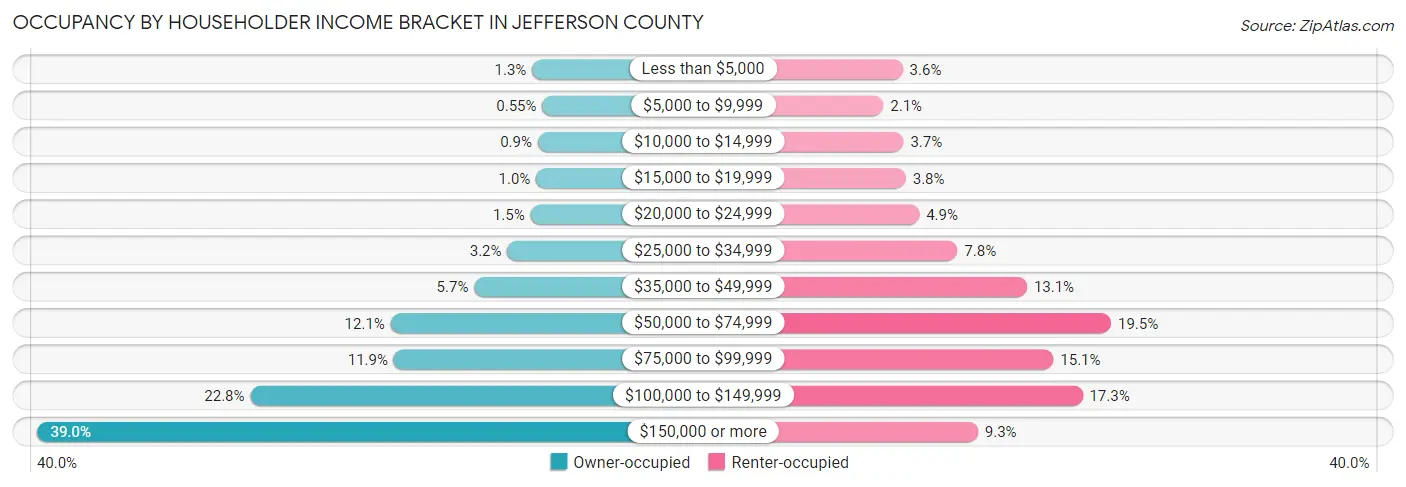
| Income Bracket | Owner-occupied | Renter-occupied |
| Less than $5,000 | 2,230 (1.3%) | 2,520 (3.6%) |
| $5,000 to $9,999 | 930 (0.5%) | 1,485 (2.1%) |
| $10,000 to $14,999 | 1,517 (0.9%) | 2,557 (3.6%) |
| $15,000 to $19,999 | 1,711 (1.0%) | 2,687 (3.8%) |
| $20,000 to $24,999 | 2,443 (1.5%) | 3,400 (4.9%) |
| $25,000 to $34,999 | 5,409 (3.2%) | 5,440 (7.8%) |
| $35,000 to $49,999 | 9,652 (5.7%) | 9,163 (13.1%) |
| $50,000 to $74,999 | 20,381 (12.1%) | 13,654 (19.5%) |
| $75,000 to $99,999 | 19,965 (11.9%) | 10,568 (15.1%) |
| $100,000 to $149,999 | 38,365 (22.8%) | 12,124 (17.3%) |
| $150,000 or more | 65,635 (39.0%) | 6,536 (9.3%) |
| Total | 168,238 (100.0%) | 70,134 (100.0%) |
Monthly Housing Cost Tiers in Jefferson County
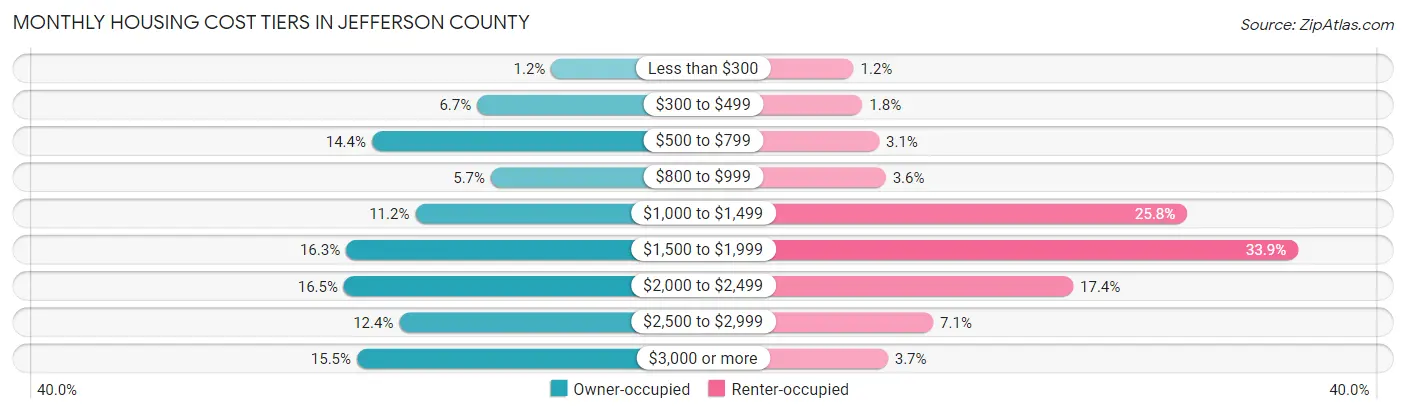
| Monthly Cost | Owner-occupied | Renter-occupied |
| Less than $300 | 2,053 (1.2%) | 832 (1.2%) |
| $300 to $499 | 11,243 (6.7%) | 1,289 (1.8%) |
| $500 to $799 | 24,281 (14.4%) | 2,150 (3.1%) |
| $800 to $999 | 9,530 (5.7%) | 2,497 (3.6%) |
| $1,000 to $1,499 | 18,897 (11.2%) | 18,060 (25.8%) |
| $1,500 to $1,999 | 27,473 (16.3%) | 23,786 (33.9%) |
| $2,000 to $2,499 | 27,745 (16.5%) | 12,173 (17.4%) |
| $2,500 to $2,999 | 20,884 (12.4%) | 4,942 (7.0%) |
| $3,000 or more | 26,132 (15.5%) | 2,601 (3.7%) |
| Total | 168,238 (100.0%) | 70,134 (100.0%) |
Physical Housing Characteristics in Jefferson County
Housing Structures in Jefferson County
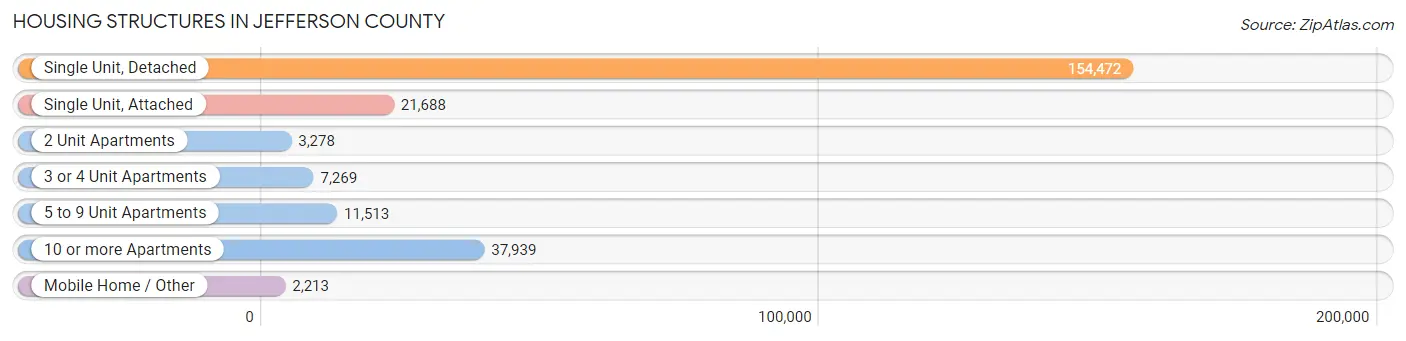
| Structure Type | # Housing Units | % Housing Units |
| Single Unit, Detached | 154,472 | 64.8% |
| Single Unit, Attached | 21,688 | 9.1% |
| 2 Unit Apartments | 3,278 | 1.4% |
| 3 or 4 Unit Apartments | 7,269 | 3.0% |
| 5 to 9 Unit Apartments | 11,513 | 4.8% |
| 10 or more Apartments | 37,939 | 15.9% |
| Mobile Home / Other | 2,213 | 0.9% |
| Total | 238,372 | 100.0% |
Housing Structures by Occupancy in Jefferson County
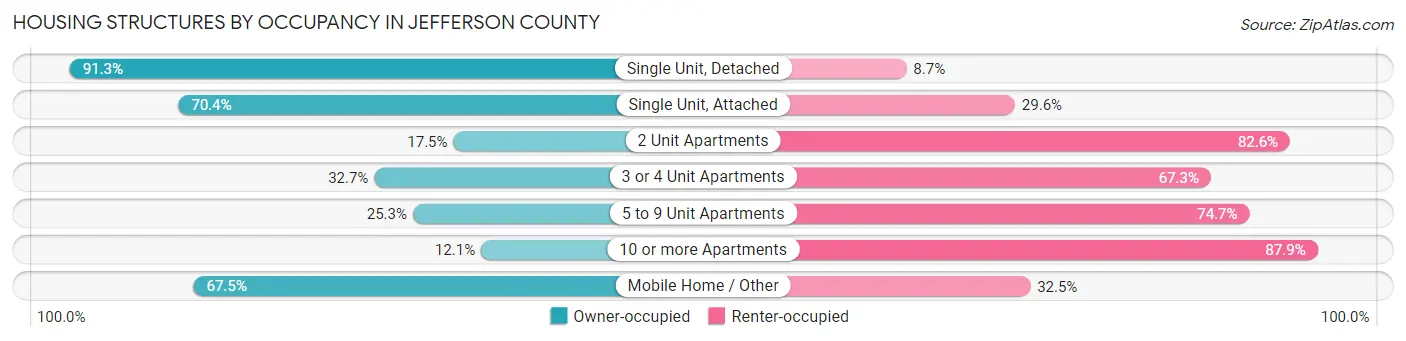
| Structure Type | Owner-occupied | Renter-occupied |
| Single Unit, Detached | 141,019 (91.3%) | 13,453 (8.7%) |
| Single Unit, Attached | 15,269 (70.4%) | 6,419 (29.6%) |
| 2 Unit Apartments | 572 (17.4%) | 2,706 (82.6%) |
| 3 or 4 Unit Apartments | 2,376 (32.7%) | 4,893 (67.3%) |
| 5 to 9 Unit Apartments | 2,908 (25.3%) | 8,605 (74.7%) |
| 10 or more Apartments | 4,601 (12.1%) | 33,338 (87.9%) |
| Mobile Home / Other | 1,493 (67.5%) | 720 (32.5%) |
| Total | 168,238 (70.6%) | 70,134 (29.4%) |
Housing Structures by Number of Rooms in Jefferson County
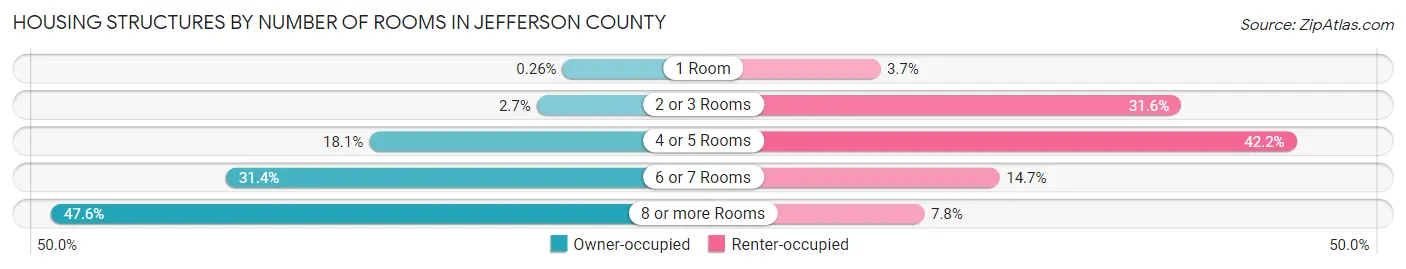
| Number of Rooms | Owner-occupied | Renter-occupied |
| 1 Room | 443 (0.3%) | 2,597 (3.7%) |
| 2 or 3 Rooms | 4,465 (2.6%) | 22,130 (31.6%) |
| 4 or 5 Rooms | 30,523 (18.1%) | 29,610 (42.2%) |
| 6 or 7 Rooms | 52,800 (31.4%) | 10,341 (14.7%) |
| 8 or more Rooms | 80,007 (47.6%) | 5,456 (7.8%) |
| Total | 168,238 (100.0%) | 70,134 (100.0%) |
Housing Structure by Heating Type in Jefferson County
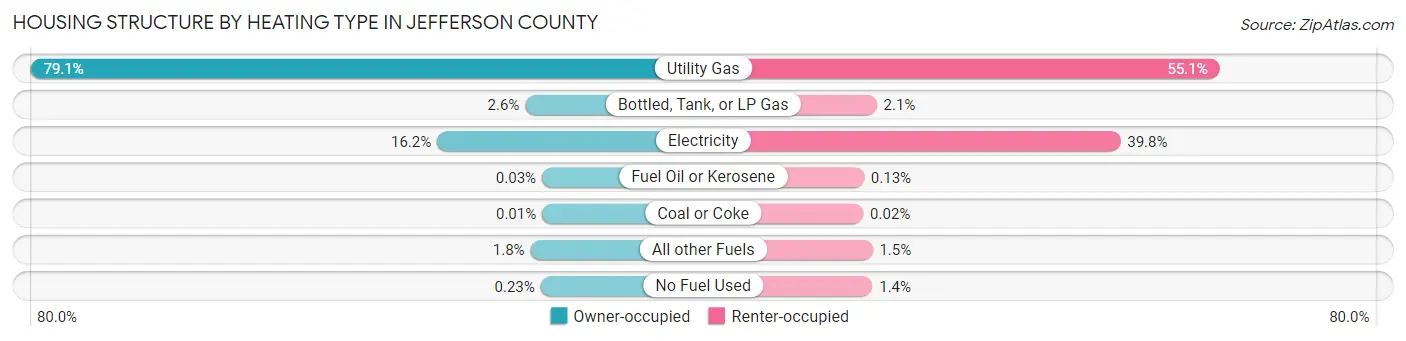
| Heating Type | Owner-occupied | Renter-occupied |
| Utility Gas | 133,054 (79.1%) | 38,644 (55.1%) |
| Bottled, Tank, or LP Gas | 4,397 (2.6%) | 1,470 (2.1%) |
| Electricity | 27,325 (16.2%) | 27,891 (39.8%) |
| Fuel Oil or Kerosene | 43 (0.0%) | 89 (0.1%) |
| Coal or Coke | 14 (0.0%) | 15 (0.0%) |
| All other Fuels | 3,026 (1.8%) | 1,021 (1.5%) |
| No Fuel Used | 379 (0.2%) | 1,004 (1.4%) |
| Total | 168,238 (100.0%) | 70,134 (100.0%) |
Household Vehicle Usage in Jefferson County
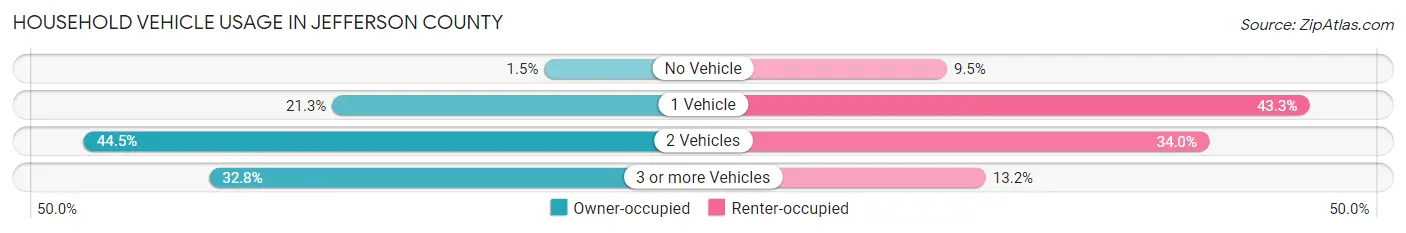
| Vehicles per Household | Owner-occupied | Renter-occupied |
| No Vehicle | 2,512 (1.5%) | 6,684 (9.5%) |
| 1 Vehicle | 35,824 (21.3%) | 30,394 (43.3%) |
| 2 Vehicles | 74,803 (44.5%) | 23,823 (34.0%) |
| 3 or more Vehicles | 55,099 (32.8%) | 9,233 (13.2%) |
| Total | 168,238 (100.0%) | 70,134 (100.0%) |
Real Estate & Mortgages in Jefferson County
Real Estate and Mortgage Overview in Jefferson County
| Characteristic | Without Mortgage | With Mortgage |
| Housing Units | 47,961 | 120,277 |
| Median Property Value | $538,300 | $563,000 |
| Median Household Income | $88,000 | $52,919 |
| Monthly Housing Costs | $635 | $26,007 |
| Real Estate Taxes | $2,699 | $1,860 |
Property Value by Mortgage Status in Jefferson County
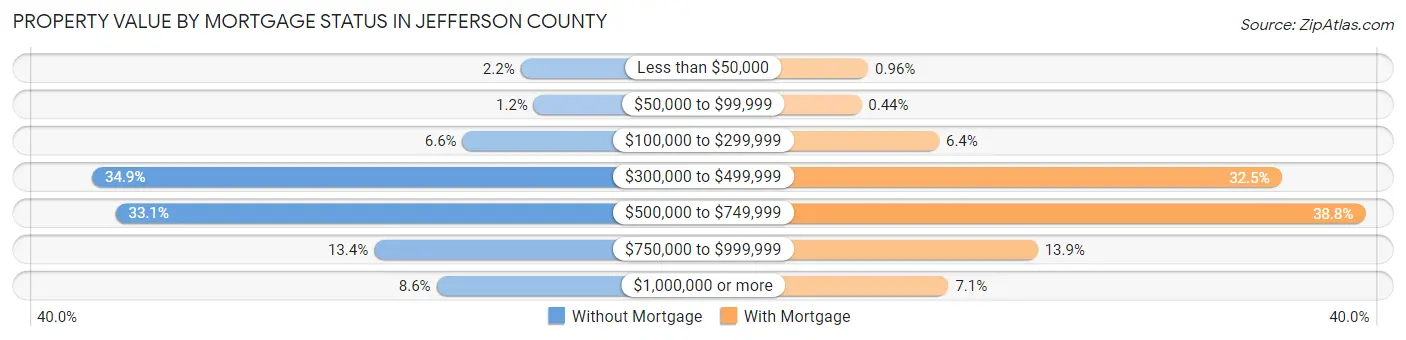
| Property Value | Without Mortgage | With Mortgage |
| Less than $50,000 | 1,066 (2.2%) | 1,156 (1.0%) |
| $50,000 to $99,999 | 579 (1.2%) | 527 (0.4%) |
| $100,000 to $299,999 | 3,184 (6.6%) | 7,651 (6.4%) |
| $300,000 to $499,999 | 16,720 (34.9%) | 39,033 (32.5%) |
| $500,000 to $749,999 | 15,861 (33.1%) | 46,699 (38.8%) |
| $750,000 to $999,999 | 6,416 (13.4%) | 16,699 (13.9%) |
| $1,000,000 or more | 4,135 (8.6%) | 8,512 (7.1%) |
| Total | 47,961 (100.0%) | 120,277 (100.0%) |
Household Income by Mortgage Status in Jefferson County
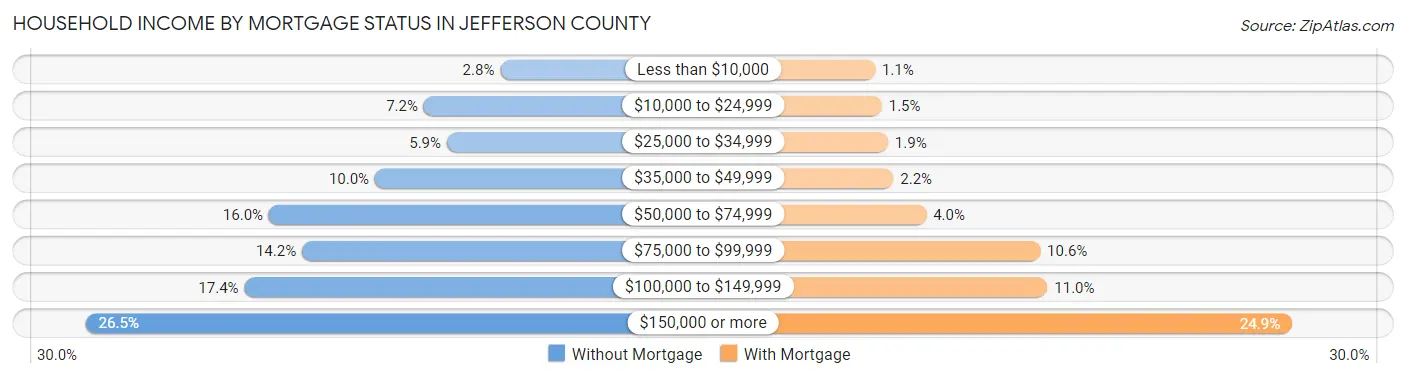
| Household Income | Without Mortgage | With Mortgage |
| Less than $10,000 | 1,354 (2.8%) | 1,336 (1.1%) |
| $10,000 to $24,999 | 3,450 (7.2%) | 1,806 (1.5%) |
| $25,000 to $34,999 | 2,813 (5.9%) | 2,221 (1.8%) |
| $35,000 to $49,999 | 4,787 (10.0%) | 2,596 (2.2%) |
| $50,000 to $74,999 | 7,691 (16.0%) | 4,865 (4.0%) |
| $75,000 to $99,999 | 6,787 (14.1%) | 12,690 (10.5%) |
| $100,000 to $149,999 | 8,363 (17.4%) | 13,178 (11.0%) |
| $150,000 or more | 12,716 (26.5%) | 30,002 (24.9%) |
| Total | 47,961 (100.0%) | 120,277 (100.0%) |
Property Value to Household Income Ratio in Jefferson County
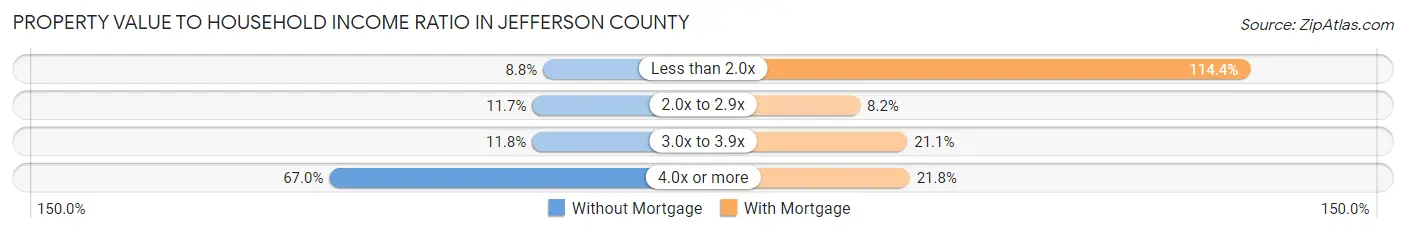
| Value-to-Income Ratio | Without Mortgage | With Mortgage |
| Less than 2.0x | 4,206 (8.8%) | 137,638 (114.4%) |
| 2.0x to 2.9x | 5,606 (11.7%) | 9,898 (8.2%) |
| 3.0x to 3.9x | 5,641 (11.8%) | 25,337 (21.1%) |
| 4.0x or more | 32,140 (67.0%) | 26,157 (21.7%) |
| Total | 47,961 (100.0%) | 120,277 (100.0%) |
Real Estate Taxes by Mortgage Status in Jefferson County
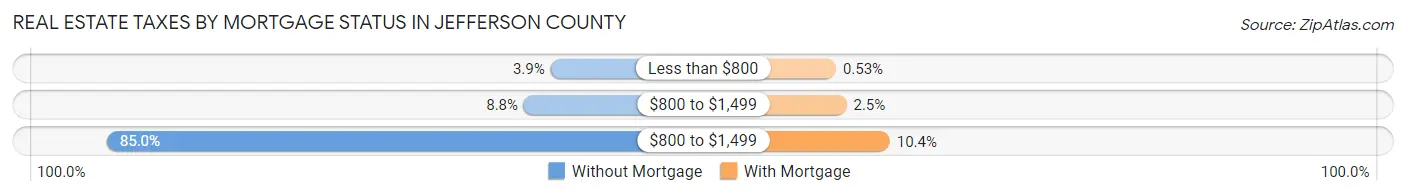
| Property Taxes | Without Mortgage | With Mortgage |
| Less than $800 | 1,887 (3.9%) | 637 (0.5%) |
| $800 to $1,499 | 4,224 (8.8%) | 2,961 (2.5%) |
| $800 to $1,499 | 40,752 (85.0%) | 12,461 (10.4%) |
| Total | 47,961 (100.0%) | 120,277 (100.0%) |
Health & Disability in Jefferson County
Health Insurance Coverage by Age in Jefferson County
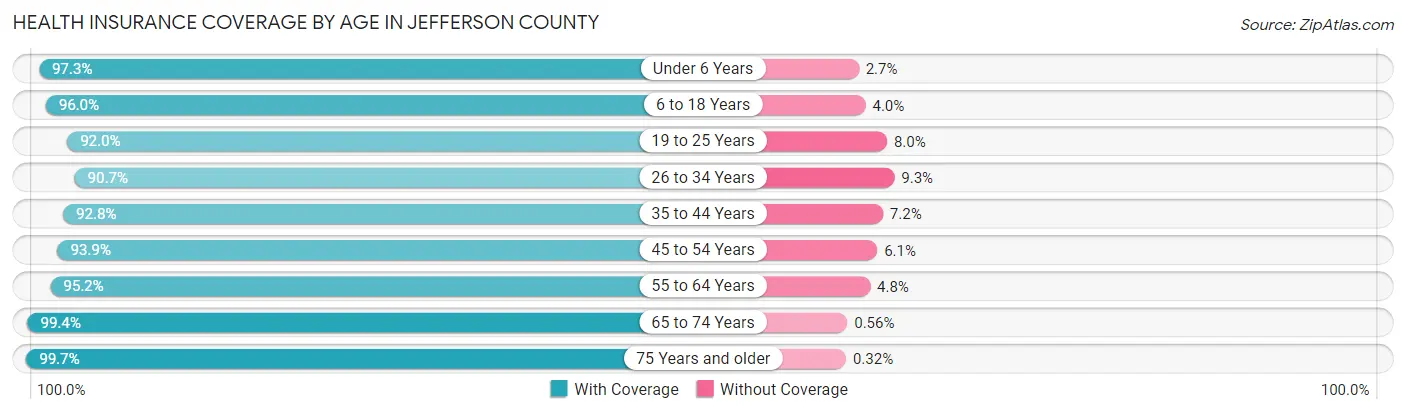
| Age Bracket | With Coverage | Without Coverage |
| Under 6 Years | 33,738 (97.3%) | 933 (2.7%) |
| 6 to 18 Years | 78,927 (96.0%) | 3,255 (4.0%) |
| 19 to 25 Years | 42,354 (92.0%) | 3,662 (8.0%) |
| 26 to 34 Years | 71,644 (90.7%) | 7,371 (9.3%) |
| 35 to 44 Years | 77,013 (92.8%) | 5,979 (7.2%) |
| 45 to 54 Years | 68,406 (93.9%) | 4,477 (6.1%) |
| 55 to 64 Years | 75,998 (95.2%) | 3,839 (4.8%) |
| 65 to 74 Years | 59,795 (99.4%) | 339 (0.6%) |
| 75 Years and older | 36,858 (99.7%) | 117 (0.3%) |
| Total | 544,733 (94.8%) | 29,972 (5.2%) |
Health Insurance Coverage by Citizenship Status in Jefferson County
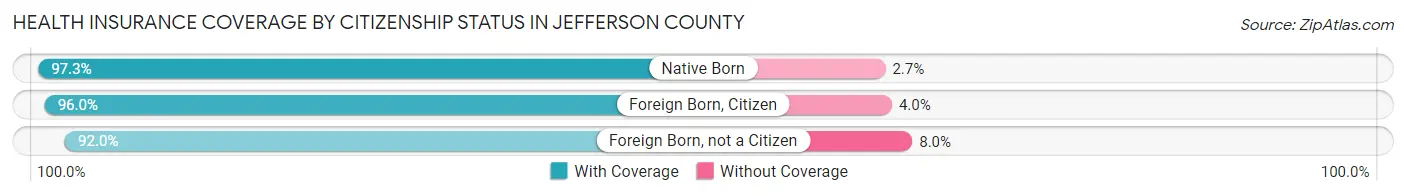
| Citizenship Status | With Coverage | Without Coverage |
| Native Born | 33,738 (97.3%) | 933 (2.7%) |
| Foreign Born, Citizen | 78,927 (96.0%) | 3,255 (4.0%) |
| Foreign Born, not a Citizen | 42,354 (92.0%) | 3,662 (8.0%) |
Health Insurance Coverage by Household Income in Jefferson County
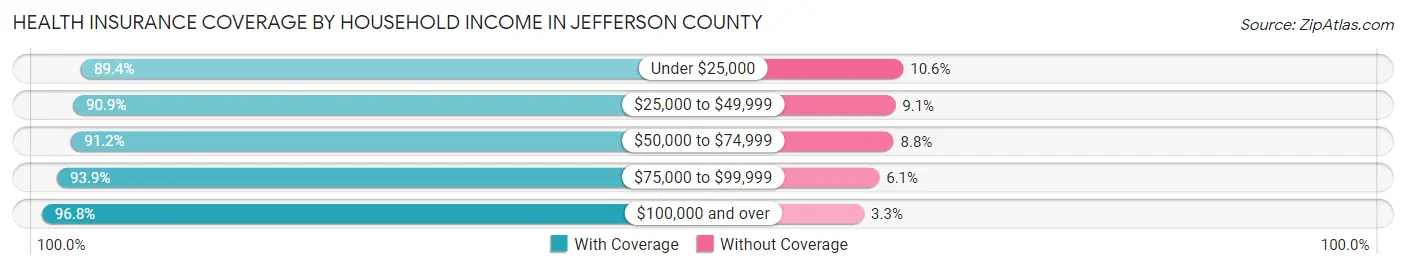
| Household Income | With Coverage | Without Coverage |
| Under $25,000 | 29,628 (89.4%) | 3,507 (10.6%) |
| $25,000 to $49,999 | 48,100 (90.9%) | 4,812 (9.1%) |
| $50,000 to $74,999 | 62,983 (91.2%) | 6,053 (8.8%) |
| $75,000 to $99,999 | 65,711 (93.9%) | 4,259 (6.1%) |
| $100,000 and over | 335,329 (96.8%) | 11,249 (3.3%) |
Public vs Private Health Insurance Coverage by Age in Jefferson County
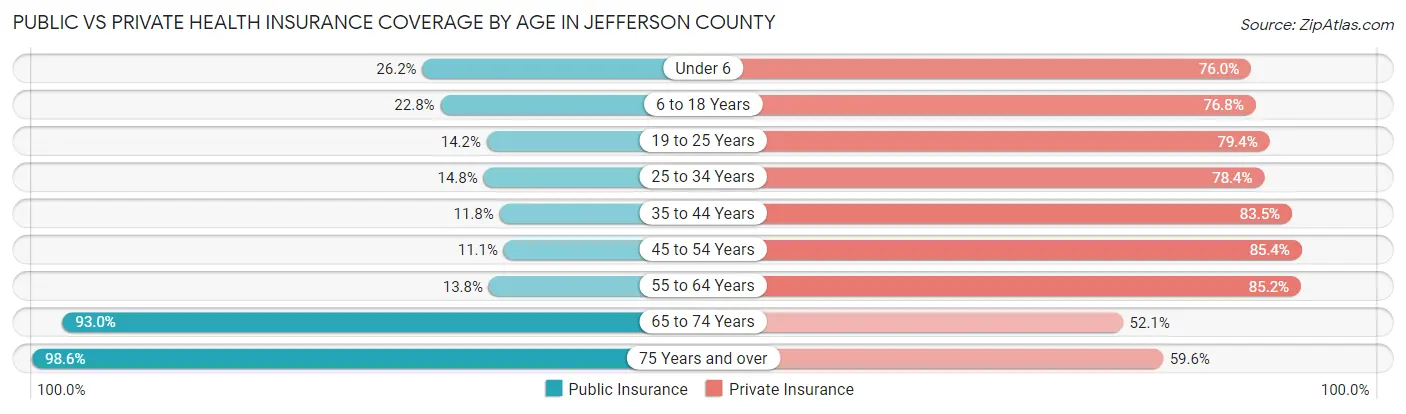
| Age Bracket | Public Insurance | Private Insurance |
| Under 6 | 9,070 (26.2%) | 26,338 (76.0%) |
| 6 to 18 Years | 18,756 (22.8%) | 63,101 (76.8%) |
| 19 to 25 Years | 6,539 (14.2%) | 36,533 (79.4%) |
| 25 to 34 Years | 11,709 (14.8%) | 61,967 (78.4%) |
| 35 to 44 Years | 9,823 (11.8%) | 69,331 (83.5%) |
| 45 to 54 Years | 8,054 (11.1%) | 62,214 (85.4%) |
| 55 to 64 Years | 11,046 (13.8%) | 68,029 (85.2%) |
| 65 to 74 Years | 55,914 (93.0%) | 31,342 (52.1%) |
| 75 Years and over | 36,461 (98.6%) | 22,024 (59.6%) |
| Total | 167,372 (29.1%) | 440,879 (76.7%) |
Disability Status by Sex by Age in Jefferson County
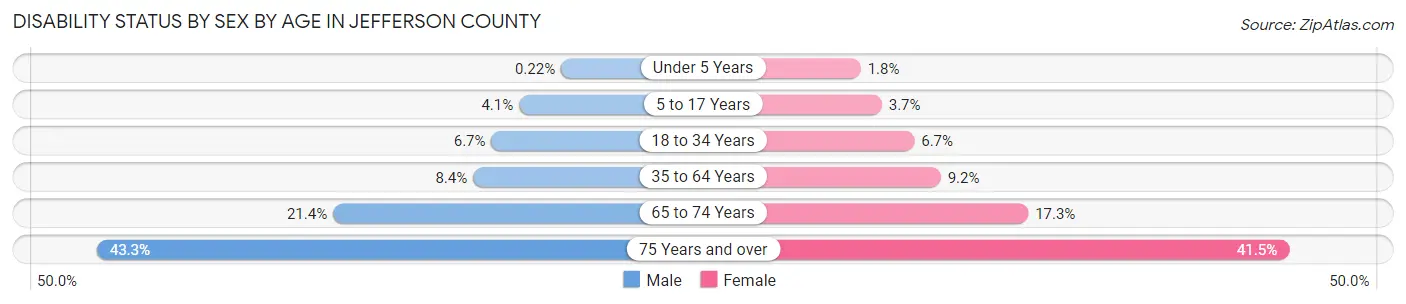
| Age Bracket | Male | Female |
| Under 5 Years | 32 (0.2%) | 242 (1.8%) |
| 5 to 17 Years | 1,732 (4.1%) | 1,486 (3.7%) |
| 18 to 34 Years | 4,606 (6.7%) | 4,212 (6.7%) |
| 35 to 64 Years | 9,930 (8.4%) | 10,761 (9.2%) |
| 65 to 74 Years | 6,174 (21.4%) | 5,407 (17.3%) |
| 75 Years and over | 6,716 (43.3%) | 8,907 (41.5%) |
Disability Class by Sex by Age in Jefferson County
Disability Class: Hearing Difficulty
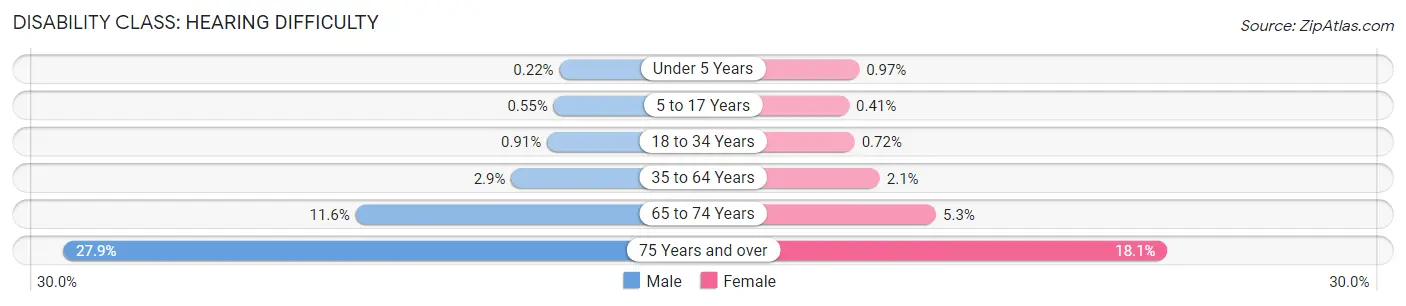
| Age Bracket | Male | Female |
| Under 5 Years | 32 (0.2%) | 133 (1.0%) |
| 5 to 17 Years | 233 (0.5%) | 163 (0.4%) |
| 18 to 34 Years | 630 (0.9%) | 450 (0.7%) |
| 35 to 64 Years | 3,435 (2.9%) | 2,491 (2.1%) |
| 65 to 74 Years | 3,341 (11.6%) | 1,642 (5.2%) |
| 75 Years and over | 4,320 (27.9%) | 3,891 (18.1%) |
Disability Class: Vision Difficulty
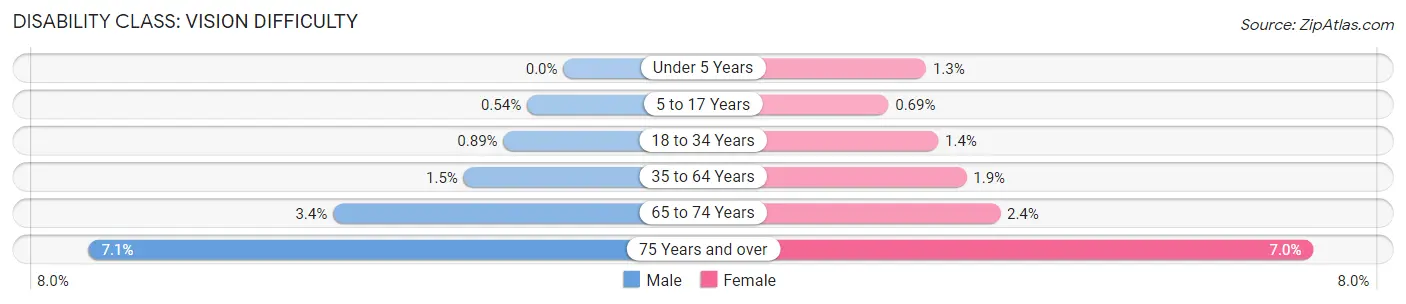
| Age Bracket | Male | Female |
| Under 5 Years | 0 (0.0%) | 171 (1.3%) |
| 5 to 17 Years | 229 (0.5%) | 278 (0.7%) |
| 18 to 34 Years | 615 (0.9%) | 893 (1.4%) |
| 35 to 64 Years | 1,748 (1.5%) | 2,166 (1.8%) |
| 65 to 74 Years | 987 (3.4%) | 736 (2.4%) |
| 75 Years and over | 1,094 (7.0%) | 1,502 (7.0%) |
Disability Class: Cognitive Difficulty
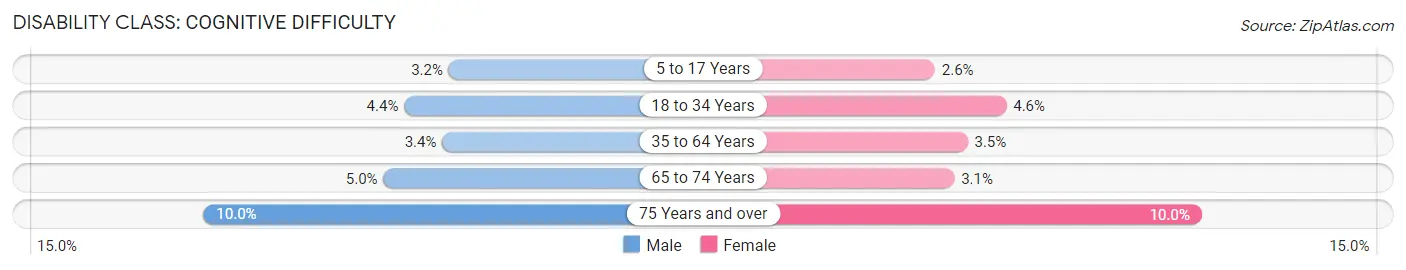
| Age Bracket | Male | Female |
| 5 to 17 Years | 1,345 (3.2%) | 1,038 (2.6%) |
| 18 to 34 Years | 3,054 (4.4%) | 2,866 (4.6%) |
| 35 to 64 Years | 3,996 (3.4%) | 4,106 (3.5%) |
| 65 to 74 Years | 1,446 (5.0%) | 978 (3.1%) |
| 75 Years and over | 1,554 (10.0%) | 2,150 (10.0%) |
Disability Class: Ambulatory Difficulty
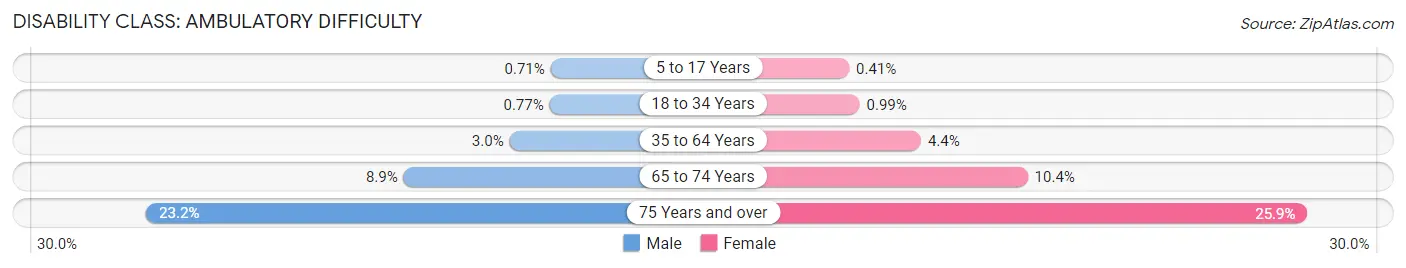
| Age Bracket | Male | Female |
| 5 to 17 Years | 301 (0.7%) | 163 (0.4%) |
| 18 to 34 Years | 532 (0.8%) | 621 (1.0%) |
| 35 to 64 Years | 3,548 (3.0%) | 5,175 (4.4%) |
| 65 to 74 Years | 2,569 (8.9%) | 3,234 (10.3%) |
| 75 Years and over | 3,603 (23.2%) | 5,563 (25.9%) |
Disability Class: Self-Care Difficulty
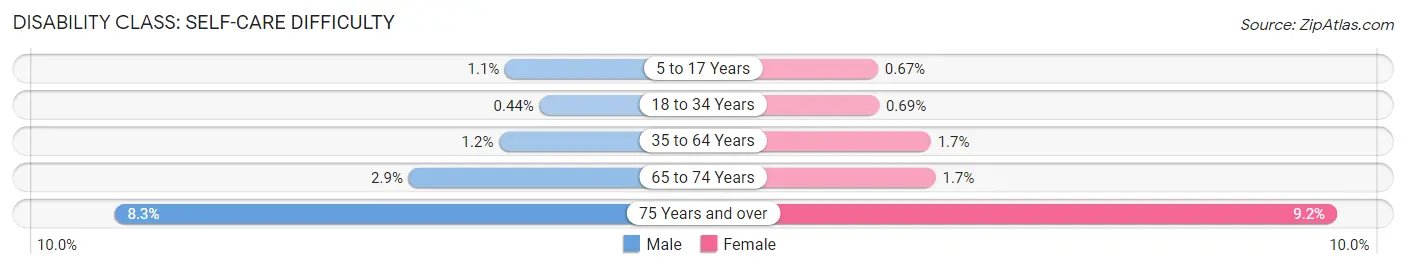
| Age Bracket | Male | Female |
| 5 to 17 Years | 455 (1.1%) | 270 (0.7%) |
| 18 to 34 Years | 304 (0.4%) | 430 (0.7%) |
| 35 to 64 Years | 1,405 (1.2%) | 1,937 (1.7%) |
| 65 to 74 Years | 830 (2.9%) | 543 (1.7%) |
| 75 Years and over | 1,292 (8.3%) | 1,972 (9.2%) |
Technology Access in Jefferson County
Computing Device Access in Jefferson County
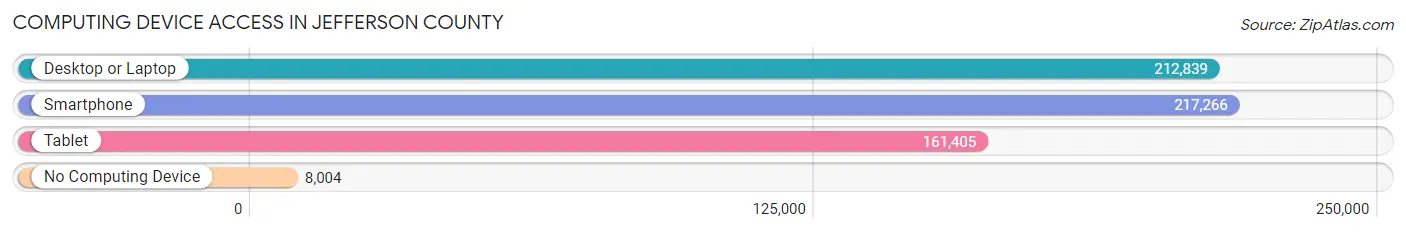
| Device Type | # Households | % Households |
| Desktop or Laptop | 212,839 | 89.3% |
| Smartphone | 217,266 | 91.1% |
| Tablet | 161,405 | 67.7% |
| No Computing Device | 8,004 | 3.4% |
| Total | 238,372 | 100.0% |
Internet Access in Jefferson County
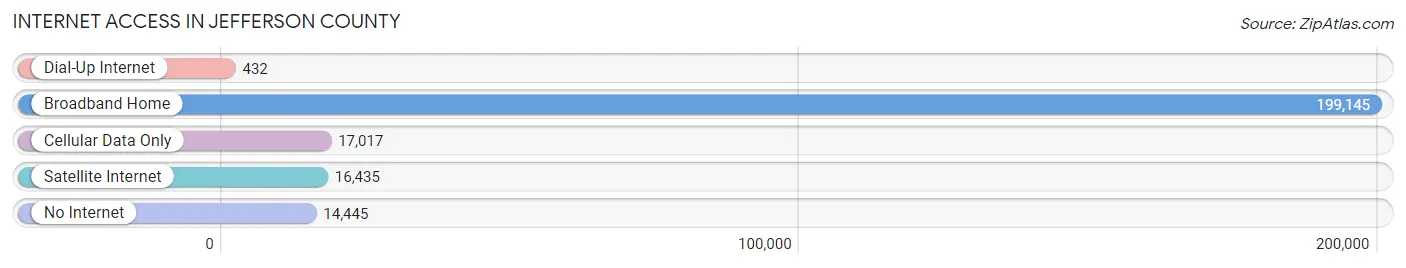
| Internet Type | # Households | % Households |
| Dial-Up Internet | 432 | 0.2% |
| Broadband Home | 199,145 | 83.5% |
| Cellular Data Only | 17,017 | 7.1% |
| Satellite Internet | 16,435 | 6.9% |
| No Internet | 14,445 | 6.1% |
| Total | 238,372 | 100.0% |
Jefferson County Summary
Jefferson County, Colorado is located in the north-central part of the state and is the fourth most populous county in the state. It is bordered by Clear Creek County to the north, Gilpin County to the east, Denver County to the south, and Boulder County to the west. The county seat is Golden, and the largest city is Lakewood.
History
Jefferson County was established in 1861 as one of the original 17 counties of the Colorado Territory. It was named after Thomas Jefferson, the third president of the United States. The county was originally part of Arapahoe County, but was split off in 1874.
The county was largely rural until the 1950s, when the population began to grow rapidly due to the growth of Denver and the surrounding suburbs. The population of Jefferson County has grown steadily since then, and it is now one of the most populous counties in the state.
Geography
Jefferson County covers an area of 807 square miles, making it the fifth largest county in Colorado. The county is located in the foothills of the Rocky Mountains, and is home to several mountain peaks, including Mount Evans, which is the highest peak in the county at 14,265 feet.
The county is divided into two distinct regions: the Front Range and the High Plains. The Front Range is located in the western part of the county and is characterized by rolling hills and valleys. The High Plains are located in the eastern part of the county and are characterized by flat plains and prairies.
The county is home to several rivers and streams, including the South Platte River, Clear Creek, and Bear Creek. The county also contains several reservoirs, including Chatfield Reservoir, Bear Creek Reservoir, and Standley Lake.
Economy
Jefferson County has a diverse economy, with a mix of industries including manufacturing, technology, healthcare, and tourism. The county is home to several major employers, including Lockheed Martin, Ball Aerospace, and the University of Colorado Denver.
The county is also home to several major shopping centers, including the Colorado Mills Mall, Southwest Plaza, and the Belmar Shopping Center.
Demographics
As of the 2010 census, Jefferson County had a population of 534,543, making it the fourth most populous county in Colorado. The population is estimated to have grown to 576,569 as of 2019.
The county is racially and ethnically diverse, with the largest racial group being White (77.2%), followed by Hispanic or Latino (14.2%), Black or African American (4.2%), and Asian (2.7%). The median household income in the county is $71,845, and the median home value is $360,000.
The county is home to several major cities, including Golden, Lakewood, Arvada, and Wheat Ridge. The county also contains several smaller towns, including Evergreen, Morrison, and Conifer.
Common Questions
What is the Total Population of Jefferson County?
Total Population of Jefferson County is 580,519.
What is the Total Male Population of Jefferson County?
Total Male Population of Jefferson County is 292,303.
What is the Total Female Population of Jefferson County?
Total Female Population of Jefferson County is 288,216.
What is the Ratio of Males per 100 Females in Jefferson County?
There are 101.42 Males per 100 Females in Jefferson County.
What is the Ratio of Females per 100 Males in Jefferson County?
There are 98.60 Females per 100 Males in Jefferson County.
What is the Median Population Age in Jefferson County?
Median Population Age in Jefferson County is 40.2 Years.
What is the Average Family Size in Jefferson County
Average Family Size in Jefferson County is 2.9 People.
What is the Average Household Size in Jefferson County
Average Household Size in Jefferson County is 2.4 People.
What is Per Capita Income in Jefferson County?
Per Capita income in Jefferson County is $54,571.
What is the Median Family Income in Jefferson County?
Median Family Income in Jefferson County is $127,276.
What is the Median Household income in Jefferson County?
Median Household Income in Jefferson County is $103,167.
What is Income or Wage Gap in Jefferson County?
Income or Wage Gap in Jefferson County is 27.6%.
Women in Jefferson County earn 72.4 cents for every dollar earned by a man.
What is Family Income Deficit in Jefferson County?
Family Income Deficit in Jefferson County is $10,617.
Families that are below poverty line in Jefferson County earn $10,617 less on average than the poverty threshold level.
What is Inequality or Gini Index in Jefferson County?
Inequality or Gini Index in Jefferson County is 0.43.
How Large is the Labor Force in Jefferson County?
There are 335,516 People in the Labor Forcein in Jefferson County.
What is the Percentage of People in the Labor Force in Jefferson County?
69.4% of People are in the Labor Force in Jefferson County.
What is the Unemployment Rate in Jefferson County?
Unemployment Rate in Jefferson County is 3.9%.