Garfield County, CO
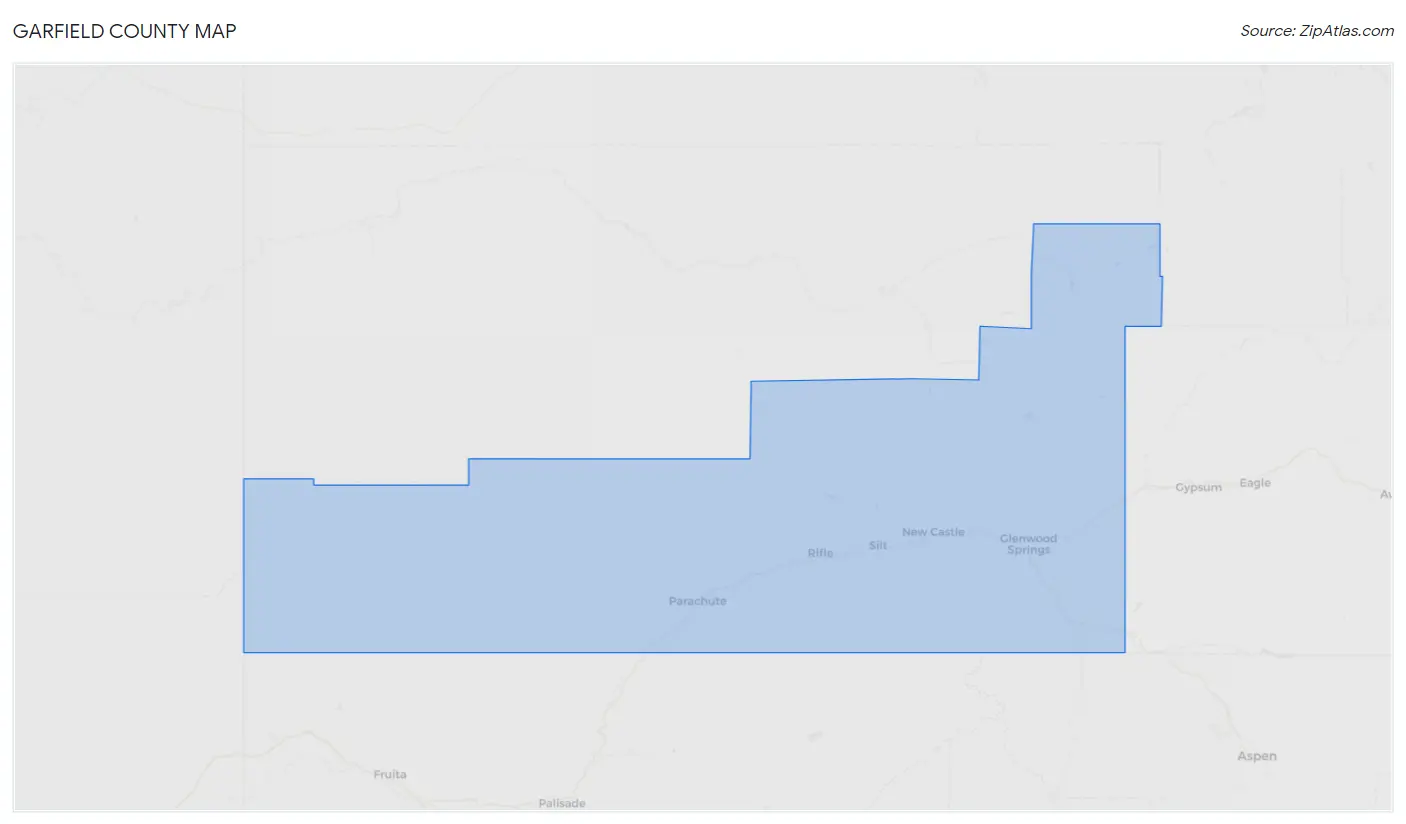
Garfield County Map
Garfield County Overview
61,683
TOTAL POPULATION
31,693
MALE POPULATION
29,990
FEMALE POPULATION
105.68
MALES / 100 FEMALES
94.63
FEMALES / 100 MALES
37.2
MEDIAN AGE
3.2
AVG FAMILY SIZE
2.7
AVG HOUSEHOLD SIZE
$39,024
PER CAPITA INCOME
$96,416
AVG FAMILY INCOME
$82,772
AVG HOUSEHOLD INCOME
26.8%
WAGE / INCOME GAP [ % ]
73.2¢/ $1
WAGE / INCOME GAP [ $ ]
$11,416
FAMILY INCOME DEFICIT
0.42
INEQUALITY / GINI INDEX
35,165
LABOR FORCE [ PEOPLE ]
73.0%
PERCENT IN LABOR FORCE
3.2%
UNEMPLOYMENT RATE
Garfield County Area Codes
Race in Garfield County
The most populous races in Garfield County are White / Caucasian (47,221 | 76.5%), Hispanic or Latino (18,223 | 29.5%), and Two or more Races (6,944 | 11.3%).
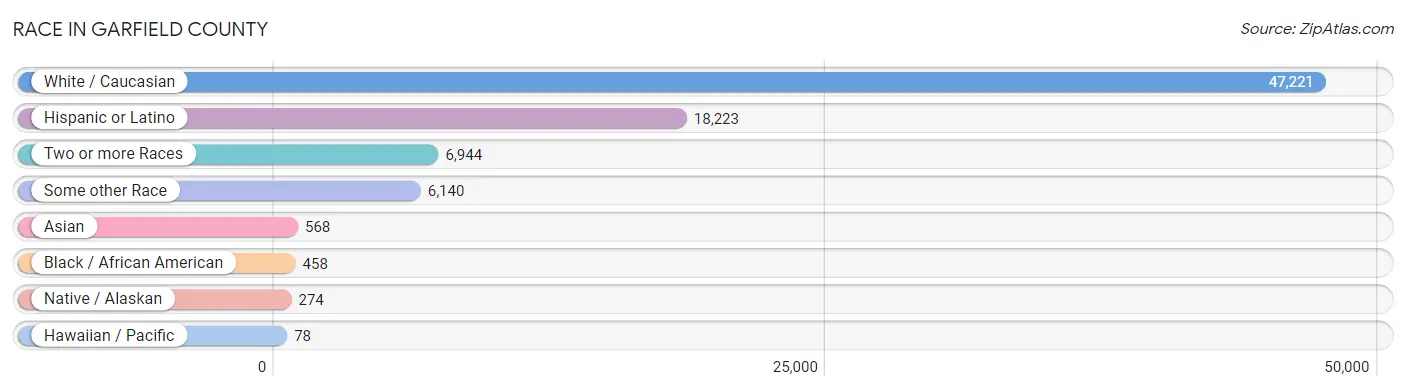
| Race | # Population | % Population |
| Asian | 568 | 0.9% |
| Black / African American | 458 | 0.7% |
| Hawaiian / Pacific | 78 | 0.1% |
| Hispanic or Latino | 18,223 | 29.5% |
| Native / Alaskan | 274 | 0.4% |
| White / Caucasian | 47,221 | 76.5% |
| Two or more Races | 6,944 | 11.3% |
| Some other Race | 6,140 | 10.0% |
| Total | 61,683 | 100.0% |
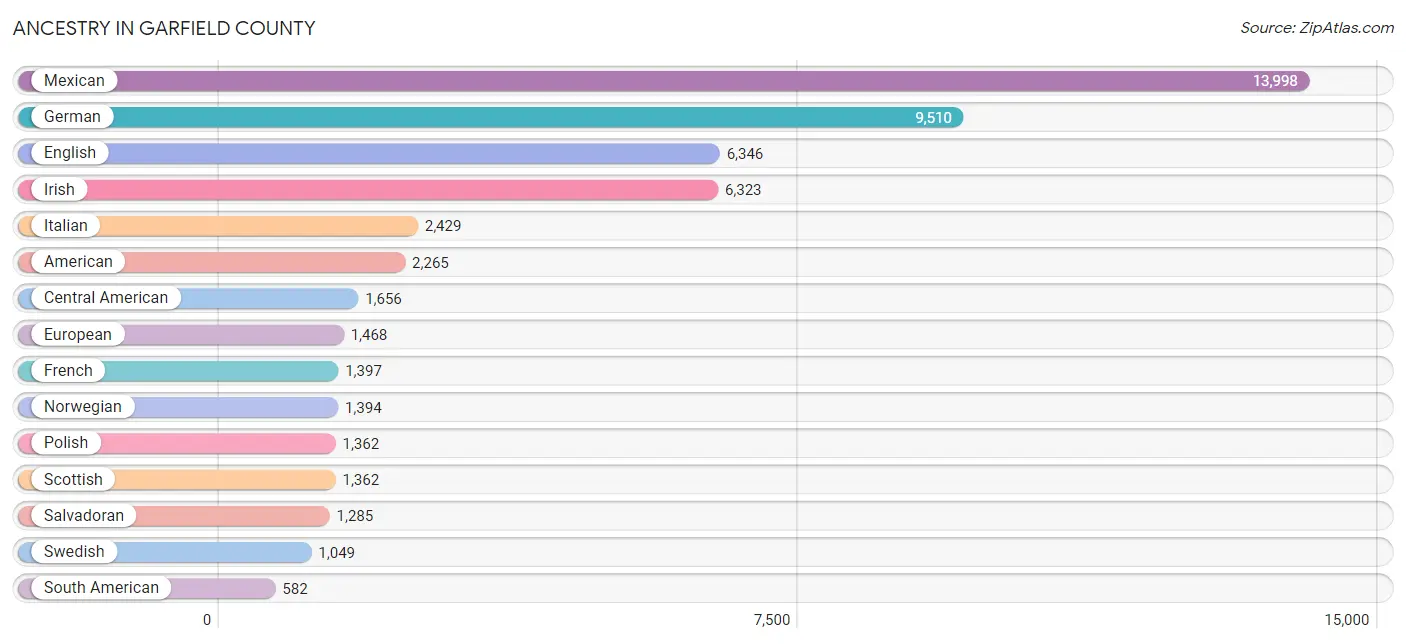
Ancestry in Garfield County
The most populous ancestries reported in Garfield County are Mexican (13,998 | 22.7%), German (9,510 | 15.4%), English (6,346 | 10.3%), Irish (6,323 | 10.2%), and Italian (2,429 | 3.9%), together accounting for 62.6% of all Garfield County residents.
| Ancestry | # Population | % Population |
| Afghan | 30 | 0.1% |
| African | 50 | 0.1% |
| American | 2,265 | 3.7% |
| Apache | 36 | 0.1% |
| Arab | 160 | 0.3% |
| Argentinean | 206 | 0.3% |
| Armenian | 39 | 0.1% |
| Australian | 15 | 0.0% |
| Austrian | 177 | 0.3% |
| Basque | 65 | 0.1% |
| Belgian | 21 | 0.0% |
| Belizean | 62 | 0.1% |
| Bhutanese | 50 | 0.1% |
| Brazilian | 109 | 0.2% |
| British | 570 | 0.9% |
| Burmese | 66 | 0.1% |
| Canadian | 83 | 0.1% |
| Central American | 1,656 | 2.7% |
| Central American Indian | 17 | 0.0% |
| Cherokee | 169 | 0.3% |
| Chilean | 8 | 0.0% |
| Chippewa | 12 | 0.0% |
| Colombian | 132 | 0.2% |
| Comanche | 50 | 0.1% |
| Creek | 7 | 0.0% |
| Croatian | 23 | 0.0% |
| Cuban | 58 | 0.1% |
| Czech | 271 | 0.4% |
| Czechoslovakian | 50 | 0.1% |
| Danish | 204 | 0.3% |
| Delaware | 13 | 0.0% |
| Dominican | 76 | 0.1% |
| Dutch | 470 | 0.8% |
| Eastern European | 267 | 0.4% |
| Ecuadorian | 42 | 0.1% |
| English | 6,346 | 10.3% |
| European | 1,468 | 2.4% |
| Finnish | 349 | 0.6% |
| French | 1,397 | 2.3% |
| French Canadian | 335 | 0.5% |
| German | 9,510 | 15.4% |
| Greek | 235 | 0.4% |
| Guamanian / Chamorro | 93 | 0.2% |
| Guatemalan | 255 | 0.4% |
| Honduran | 109 | 0.2% |
| Hopi | 13 | 0.0% |
| Hungarian | 211 | 0.3% |
| Icelander | 15 | 0.0% |
| Indian (Asian) | 321 | 0.5% |
| Inupiat | 76 | 0.1% |
| Iranian | 202 | 0.3% |
| Irish | 6,323 | 10.2% |
| Iroquois | 55 | 0.1% |
| Italian | 2,429 | 3.9% |
| Jamaican | 24 | 0.0% |
| Japanese | 12 | 0.0% |
| Korean | 171 | 0.3% |
| Latvian | 39 | 0.1% |
| Lebanese | 137 | 0.2% |
| Lithuanian | 98 | 0.2% |
| Mexican | 13,998 | 22.7% |
| Mexican American Indian | 33 | 0.1% |
| Native Hawaiian | 68 | 0.1% |
| Navajo | 67 | 0.1% |
| Nicaraguan | 7 | 0.0% |
| Nigerian | 15 | 0.0% |
| Northern European | 277 | 0.4% |
| Norwegian | 1,394 | 2.3% |
| Pakistani | 155 | 0.3% |
| Pennsylvania German | 2 | 0.0% |
| Peruvian | 118 | 0.2% |
| Polish | 1,362 | 2.2% |
| Portuguese | 35 | 0.1% |
| Potawatomi | 21 | 0.0% |
| Pueblo | 24 | 0.0% |
| Puerto Rican | 485 | 0.8% |
| Romanian | 21 | 0.0% |
| Russian | 265 | 0.4% |
| Salvadoran | 1,285 | 2.1% |
| Scandinavian | 434 | 0.7% |
| Scotch-Irish | 488 | 0.8% |
| Scottish | 1,362 | 2.2% |
| Sioux | 8 | 0.0% |
| Slavic | 96 | 0.2% |
| Slovak | 156 | 0.3% |
| Slovene | 9 | 0.0% |
| South American | 582 | 0.9% |
| Spaniard | 221 | 0.4% |
| Spanish | 119 | 0.2% |
| Spanish American | 25 | 0.0% |
| Sri Lankan | 48 | 0.1% |
| Subsaharan African | 131 | 0.2% |
| Swedish | 1,049 | 1.7% |
| Swiss | 454 | 0.7% |
| Thai | 13 | 0.0% |
| Ukrainian | 72 | 0.1% |
| Uruguayan | 41 | 0.1% |
| Ute | 34 | 0.1% |
| Venezuelan | 35 | 0.1% |
| Welsh | 469 | 0.8% |
| Yugoslavian | 61 | 0.1% | View All 101 Rows |
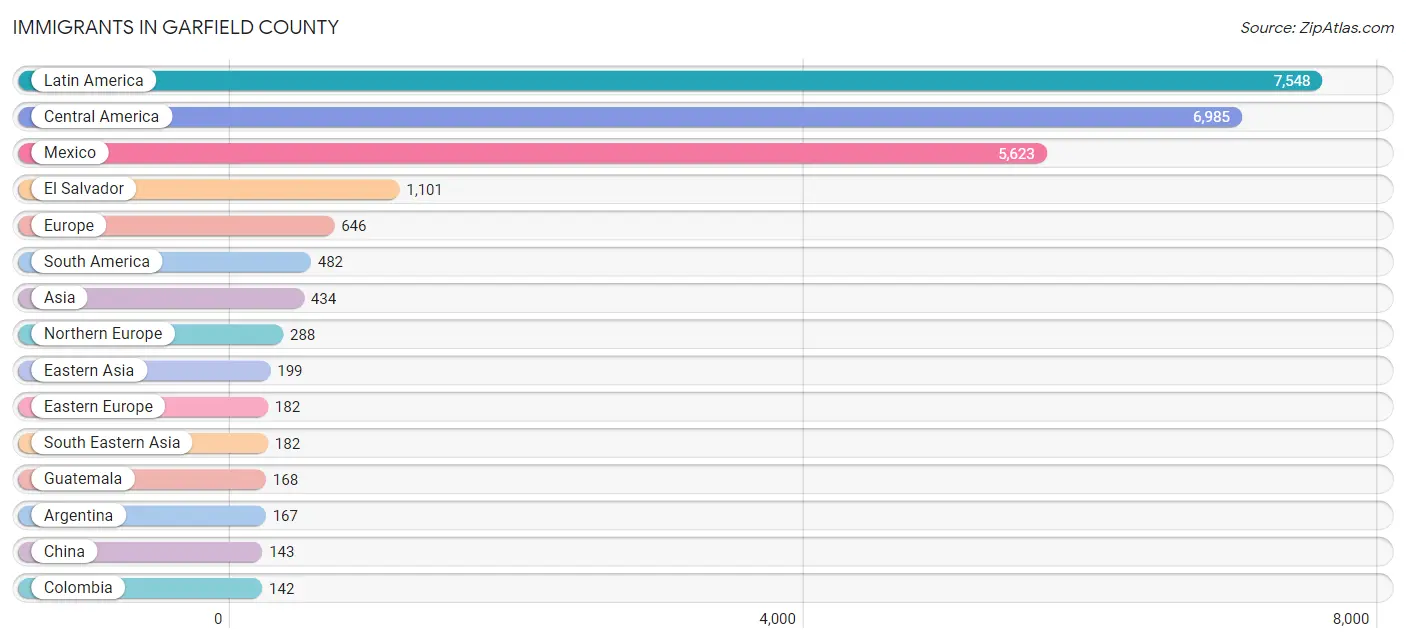
Immigrants in Garfield County
The most numerous immigrant groups reported in Garfield County came from Latin America (7,548 | 12.2%), Central America (6,985 | 11.3%), Mexico (5,623 | 9.1%), El Salvador (1,101 | 1.8%), and Europe (646 | 1.1%), together accounting for 35.5% of all Garfield County residents.
| Immigration Origin | # Population | % Population |
| Afghanistan | 12 | 0.0% |
| Africa | 87 | 0.1% |
| Argentina | 167 | 0.3% |
| Asia | 434 | 0.7% |
| Australia | 15 | 0.0% |
| Austria | 19 | 0.0% |
| Belgium | 9 | 0.0% |
| Belize | 49 | 0.1% |
| Brazil | 76 | 0.1% |
| Canada | 33 | 0.1% |
| Caribbean | 81 | 0.1% |
| Central America | 6,985 | 11.3% |
| Chile | 8 | 0.0% |
| China | 143 | 0.2% |
| Colombia | 142 | 0.2% |
| Cuba | 50 | 0.1% |
| Eastern Africa | 24 | 0.0% |
| Eastern Asia | 199 | 0.3% |
| Eastern Europe | 182 | 0.3% |
| Ecuador | 14 | 0.0% |
| El Salvador | 1,101 | 1.8% |
| England | 121 | 0.2% |
| Europe | 646 | 1.1% |
| Germany | 57 | 0.1% |
| Greece | 29 | 0.1% |
| Guatemala | 168 | 0.3% |
| Honduras | 37 | 0.1% |
| Hungary | 40 | 0.1% |
| India | 16 | 0.0% |
| Indonesia | 18 | 0.0% |
| Iran | 7 | 0.0% |
| Ireland | 25 | 0.0% |
| Italy | 8 | 0.0% |
| Jamaica | 24 | 0.0% |
| Japan | 18 | 0.0% |
| Korea | 38 | 0.1% |
| Latin America | 7,548 | 12.2% |
| Lithuania | 11 | 0.0% |
| Mexico | 5,623 | 9.1% |
| Netherlands | 13 | 0.0% |
| Nicaragua | 7 | 0.0% |
| Northern Europe | 288 | 0.5% |
| Oceania | 43 | 0.1% |
| Peru | 75 | 0.1% |
| Philippines | 52 | 0.1% |
| Poland | 100 | 0.2% |
| Portugal | 17 | 0.0% |
| Romania | 8 | 0.0% |
| Russia | 23 | 0.0% |
| Singapore | 6 | 0.0% |
| South Africa | 24 | 0.0% |
| South America | 482 | 0.8% |
| South Central Asia | 35 | 0.1% |
| South Eastern Asia | 182 | 0.3% |
| Southern Europe | 54 | 0.1% |
| Sweden | 9 | 0.0% |
| Switzerland | 24 | 0.0% |
| Thailand | 92 | 0.2% |
| Vietnam | 14 | 0.0% |
| Western Asia | 18 | 0.0% |
| Western Europe | 122 | 0.2% | View All 61 Rows |
Sex and Age in Garfield County
Sex and Age in Garfield County
The most populous age groups in Garfield County are 35 to 39 Years (2,450 | 7.7%) for men and 35 to 39 Years (2,239 | 7.5%) for women.
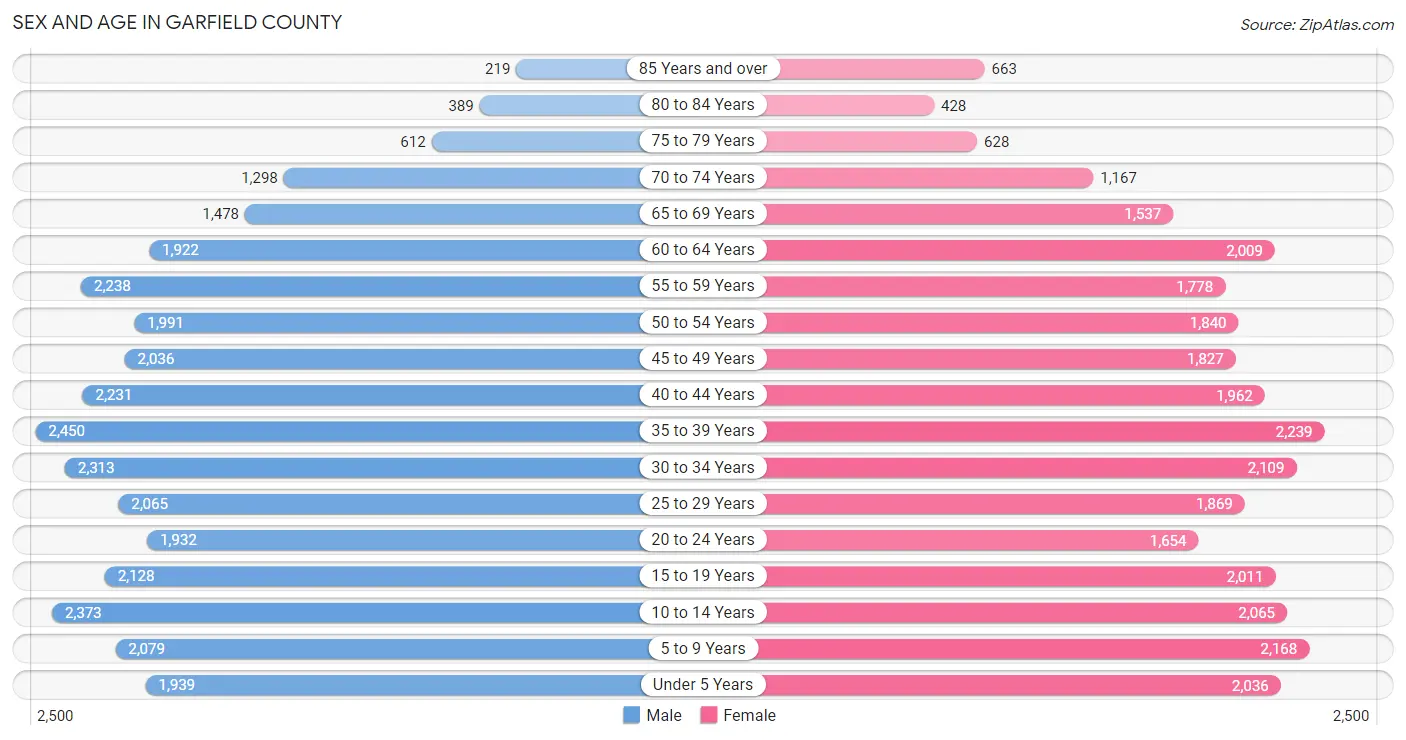
| Age Bracket | Male | Female |
| Under 5 Years | 1,939 (6.1%) | 2,036 (6.8%) |
| 5 to 9 Years | 2,079 (6.6%) | 2,168 (7.2%) |
| 10 to 14 Years | 2,373 (7.5%) | 2,065 (6.9%) |
| 15 to 19 Years | 2,128 (6.7%) | 2,011 (6.7%) |
| 20 to 24 Years | 1,932 (6.1%) | 1,654 (5.5%) |
| 25 to 29 Years | 2,065 (6.5%) | 1,869 (6.2%) |
| 30 to 34 Years | 2,313 (7.3%) | 2,109 (7.0%) |
| 35 to 39 Years | 2,450 (7.7%) | 2,239 (7.5%) |
| 40 to 44 Years | 2,231 (7.0%) | 1,962 (6.5%) |
| 45 to 49 Years | 2,036 (6.4%) | 1,827 (6.1%) |
| 50 to 54 Years | 1,991 (6.3%) | 1,840 (6.1%) |
| 55 to 59 Years | 2,238 (7.1%) | 1,778 (5.9%) |
| 60 to 64 Years | 1,922 (6.1%) | 2,009 (6.7%) |
| 65 to 69 Years | 1,478 (4.7%) | 1,537 (5.1%) |
| 70 to 74 Years | 1,298 (4.1%) | 1,167 (3.9%) |
| 75 to 79 Years | 612 (1.9%) | 628 (2.1%) |
| 80 to 84 Years | 389 (1.2%) | 428 (1.4%) |
| 85 Years and over | 219 (0.7%) | 663 (2.2%) |
| Total | 31,693 (100.0%) | 29,990 (100.0%) |
Families and Households in Garfield County
Median Family Size in Garfield County
The median family size in Garfield County is 3.20 persons per family, with single female/mother families (2,055 | 13.3%) accounting for the largest median family size of 3.38 persons per family. On the other hand, single male/father families (986 | 6.4%) represent the smallest median family size with 2.70 persons per family.
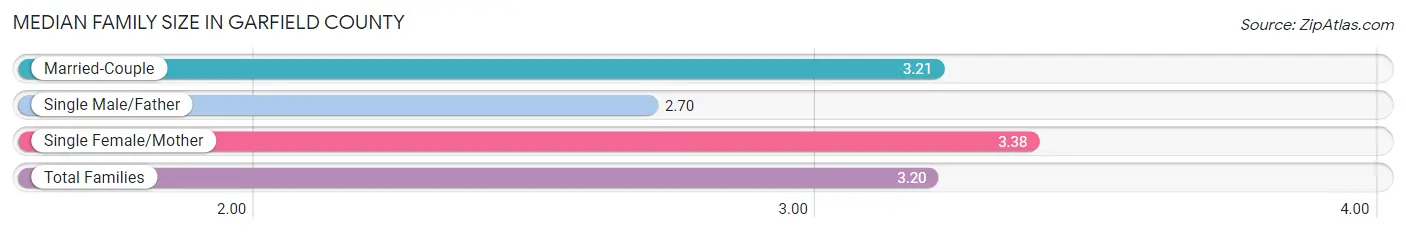
| Family Type | # Families | Family Size |
| Married-Couple | 12,360 (80.2%) | 3.21 |
| Single Male/Father | 986 (6.4%) | 2.70 |
| Single Female/Mother | 2,055 (13.3%) | 3.38 |
| Total Families | 15,401 (100.0%) | 3.20 |
Median Household Size in Garfield County
The median household size in Garfield County is 2.71 persons per household, with single female/mother households (2,055 | 9.2%) accounting for the largest median household size of 3.56 persons per household. non-family households (6,989 | 31.2%) represent the smallest median household size with 1.42 persons per household.
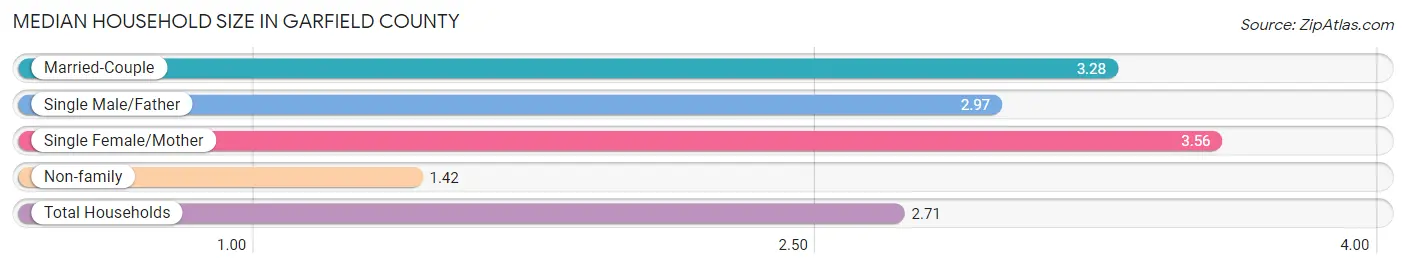
| Household Type | # Households | Household Size |
| Married-Couple | 12,360 (55.2%) | 3.28 |
| Single Male/Father | 986 (4.4%) | 2.97 |
| Single Female/Mother | 2,055 (9.2%) | 3.56 |
| Non-family | 6,989 (31.2%) | 1.42 |
| Total Households | 22,390 (100.0%) | 2.71 |
Household Size by Marriage Status in Garfield County
Out of a total of 22,390 households in Garfield County, 15,401 (68.8%) are family households, while 6,989 (31.2%) are nonfamily households. The most numerous type of family households are 2-person households, comprising 6,552, and the most common type of nonfamily households are 1-person households, comprising 5,372.
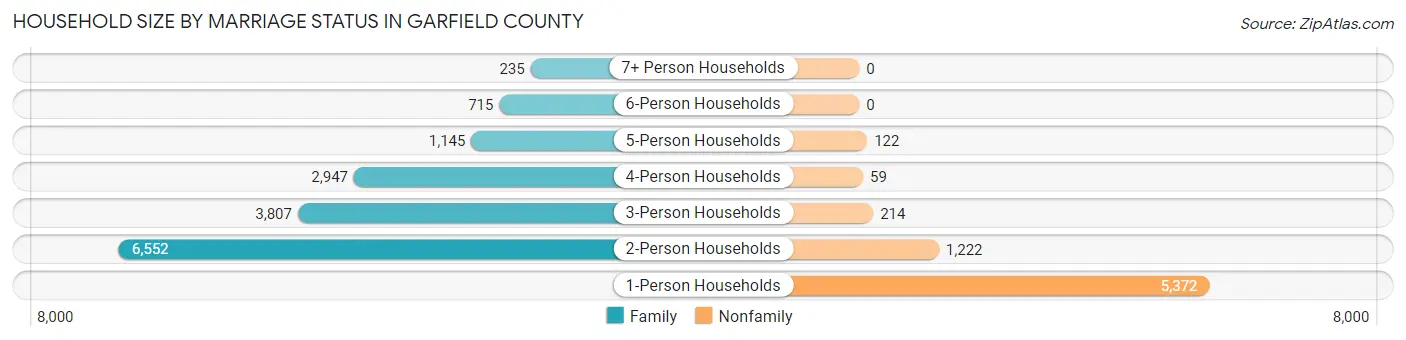
| Household Size | Family Households | Nonfamily Households |
| 1-Person Households | - | 5,372 (24.0%) |
| 2-Person Households | 6,552 (29.3%) | 1,222 (5.5%) |
| 3-Person Households | 3,807 (17.0%) | 214 (1.0%) |
| 4-Person Households | 2,947 (13.2%) | 59 (0.3%) |
| 5-Person Households | 1,145 (5.1%) | 122 (0.5%) |
| 6-Person Households | 715 (3.2%) | 0 (0.0%) |
| 7+ Person Households | 235 (1.1%) | 0 (0.0%) |
| Total | 15,401 (68.8%) | 6,989 (31.2%) |
Female Fertility in Garfield County
Fertility by Age in Garfield County
Average fertility rate in Garfield County is 46.0 births per 1,000 women. Women in the age bracket of 20 to 34 years have the highest fertility rate with 85.0 births per 1,000 women. Women in the age bracket of 20 to 34 years acount for 74.2% of all women with births.
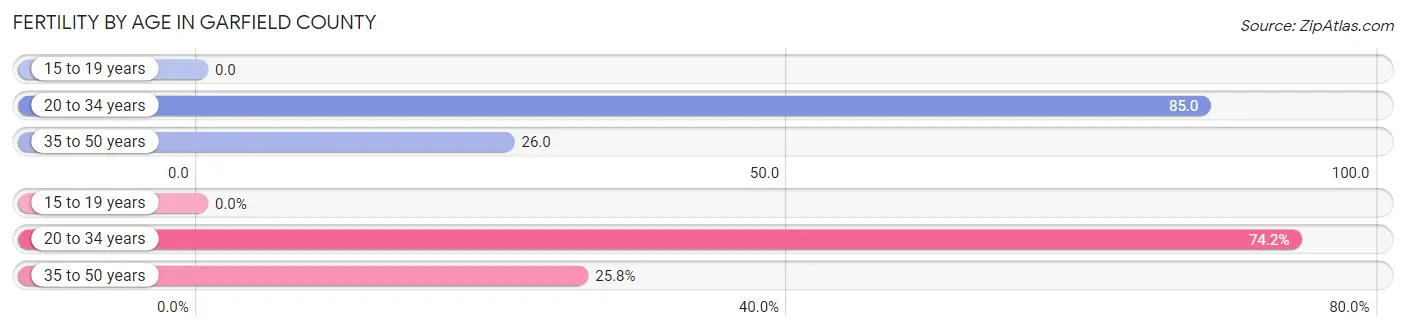
| Age Bracket | Women with Births | Births / 1,000 Women |
| 15 to 19 years | 0 (0.0%) | 0.0 |
| 20 to 34 years | 480 (74.2%) | 85.0 |
| 35 to 50 years | 167 (25.8%) | 26.0 |
| Total | 647 (100.0%) | 46.0 |
Fertility by Age by Marriage Status in Garfield County
94.0% of women with births (647) in Garfield County are married. The highest percentage of unmarried women with births falls into 35 to 50 years age bracket with 7.8% of them unmarried at the time of birth, while the lowest percentage of unmarried women with births belong to 20 to 34 years age bracket with 5.4% of them unmarried.
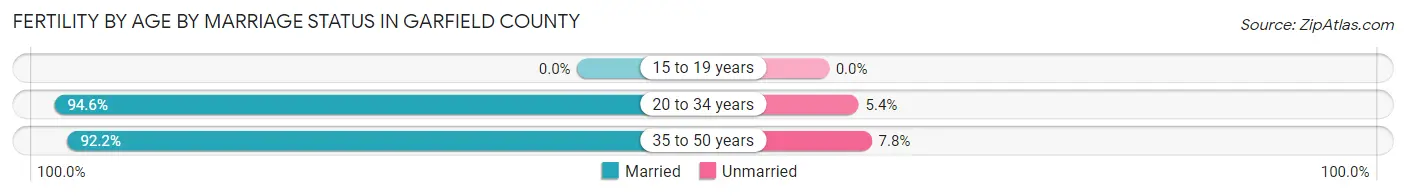
| Age Bracket | Married | Unmarried |
| 15 to 19 years | 0 (0.0%) | 0 (0.0%) |
| 20 to 34 years | 454 (94.6%) | 26 (5.4%) |
| 35 to 50 years | 154 (92.2%) | 13 (7.8%) |
| Total | 608 (94.0%) | 39 (6.0%) |
Fertility by Education in Garfield County
Average fertility rate in Garfield County is 46.0 births per 1,000 women. Women with the education attainment of graduate degree have the highest fertility rate of 86.0 births per 1,000 women, while women with the education attainment of less than high school have the lowest fertility at 14.0 births per 1,000 women. Women with the education attainment of bachelor's degree represent 38.5% of all women with births.
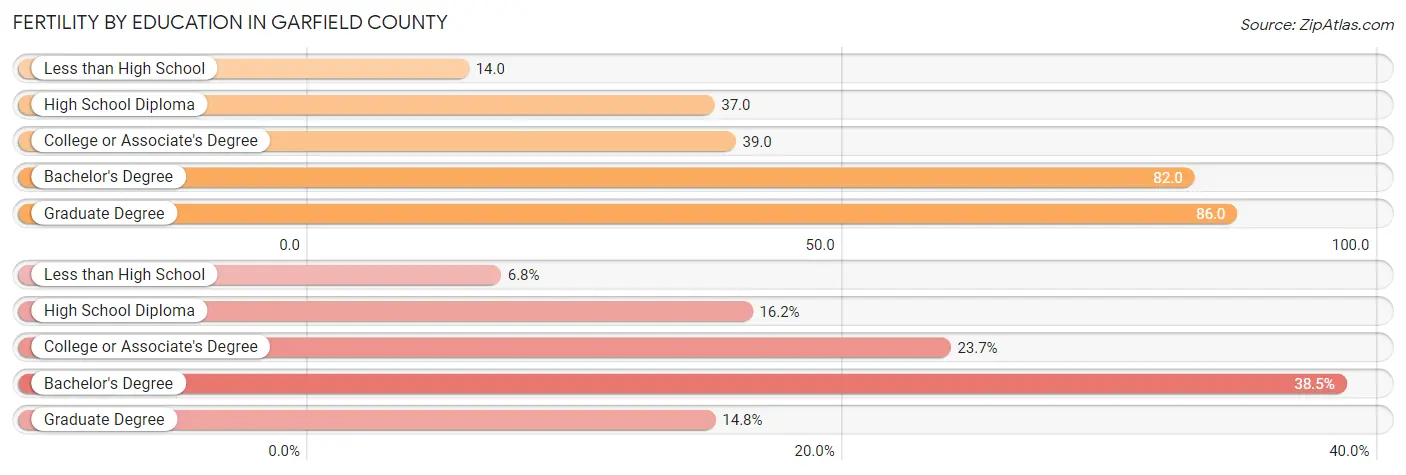
| Educational Attainment | Women with Births | Births / 1,000 Women |
| Less than High School | 44 (6.8%) | 14.0 |
| High School Diploma | 105 (16.2%) | 37.0 |
| College or Associate's Degree | 153 (23.6%) | 39.0 |
| Bachelor's Degree | 249 (38.5%) | 82.0 |
| Graduate Degree | 96 (14.8%) | 86.0 |
| Total | 647 (100.0%) | 46.0 |
Fertility by Education by Marriage Status in Garfield County
6.0% of women with births in Garfield County are unmarried. Women with the educational attainment of less than high school are most likely to be married with 100.0% of them married at childbirth, while women with the educational attainment of high school diploma are least likely to be married with 20.9% of them unmarried at childbirth.
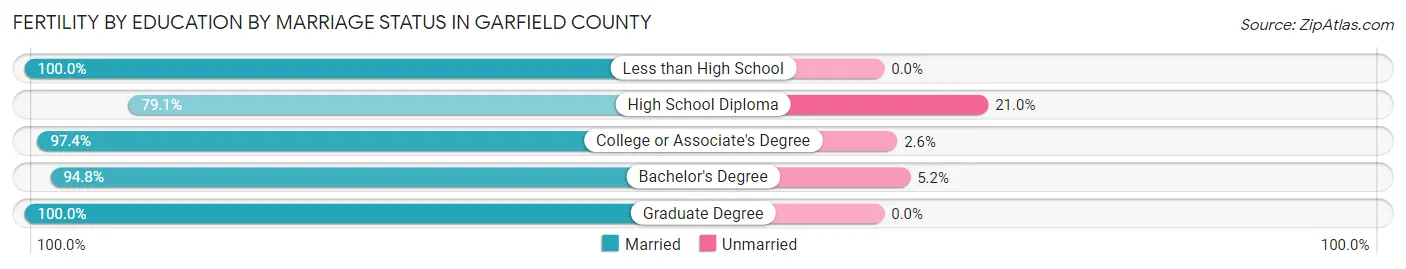
| Educational Attainment | Married | Unmarried |
| Less than High School | 44 (100.0%) | 0 (0.0%) |
| High School Diploma | 83 (79.0%) | 22 (20.9%) |
| College or Associate's Degree | 149 (97.4%) | 4 (2.6%) |
| Bachelor's Degree | 236 (94.8%) | 13 (5.2%) |
| Graduate Degree | 96 (100.0%) | 0 (0.0%) |
| Total | 608 (94.0%) | 39 (6.0%) |
Income in Garfield County
Income Overview in Garfield County
Per Capita Income in Garfield County is $39,024, while median incomes of families and households are $96,416 and $82,772 respectively.
| Characteristic | Number | Measure |
| Per Capita Income | 61,683 | $39,024 |
| Median Family Income | 15,401 | $96,416 |
| Mean Family Income | 15,401 | $116,432 |
| Median Household Income | 22,390 | $82,772 |
| Mean Household Income | 22,390 | $103,158 |
| Income Deficit | 15,401 | $11,416 |
| Wage / Income Gap (%) | 61,683 | 26.82% |
| Wage / Income Gap ($) | 61,683 | 73.18¢ per $1 |
| Gini / Inequality Index | 61,683 | 0.42 |
Earnings by Sex in Garfield County
Average Earnings in Garfield County are $41,278, $47,338 for men and $34,641 for women, a difference of 26.8%.
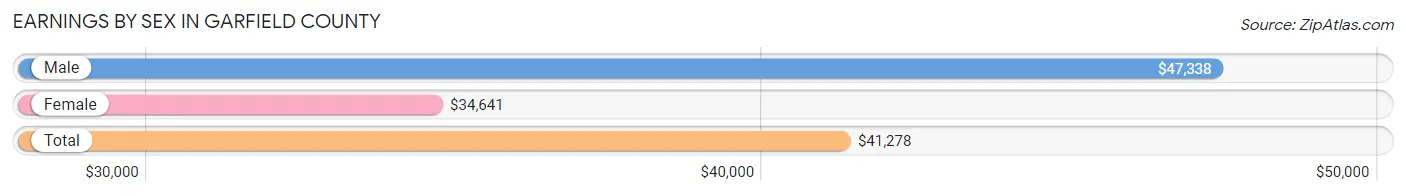
| Sex | Number | Average Earnings |
| Male | 20,676 (56.2%) | $47,338 |
| Female | 16,143 (43.8%) | $34,641 |
| Total | 36,819 (100.0%) | $41,278 |
Earnings by Sex by Income Bracket in Garfield County
The most common earnings brackets in Garfield County are $100,000+ for men (3,110 | 15.0%) and $25,000 to $29,999 for women (1,472 | 9.1%).
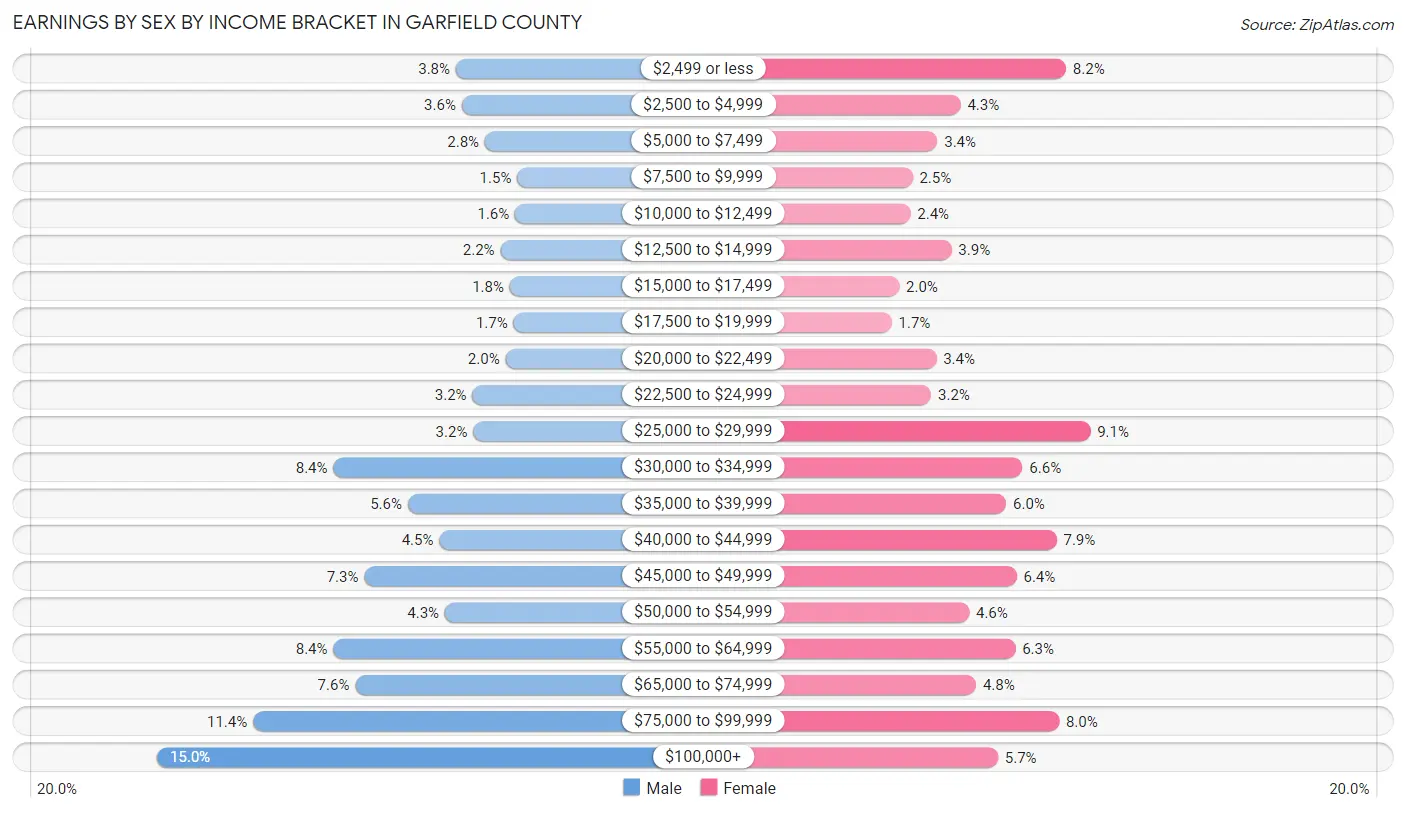
| Income | Male | Female |
| $2,499 or less | 793 (3.8%) | 1,326 (8.2%) |
| $2,500 to $4,999 | 748 (3.6%) | 688 (4.3%) |
| $5,000 to $7,499 | 569 (2.8%) | 547 (3.4%) |
| $7,500 to $9,999 | 319 (1.5%) | 397 (2.5%) |
| $10,000 to $12,499 | 334 (1.6%) | 384 (2.4%) |
| $12,500 to $14,999 | 448 (2.2%) | 632 (3.9%) |
| $15,000 to $17,499 | 377 (1.8%) | 316 (2.0%) |
| $17,500 to $19,999 | 347 (1.7%) | 271 (1.7%) |
| $20,000 to $22,499 | 410 (2.0%) | 540 (3.4%) |
| $22,500 to $24,999 | 666 (3.2%) | 510 (3.2%) |
| $25,000 to $29,999 | 660 (3.2%) | 1,472 (9.1%) |
| $30,000 to $34,999 | 1,743 (8.4%) | 1,062 (6.6%) |
| $35,000 to $39,999 | 1,166 (5.6%) | 964 (6.0%) |
| $40,000 to $44,999 | 922 (4.5%) | 1,269 (7.9%) |
| $45,000 to $49,999 | 1,503 (7.3%) | 1,026 (6.4%) |
| $50,000 to $54,999 | 878 (4.3%) | 740 (4.6%) |
| $55,000 to $64,999 | 1,744 (8.4%) | 1,019 (6.3%) |
| $65,000 to $74,999 | 1,574 (7.6%) | 782 (4.8%) |
| $75,000 to $99,999 | 2,365 (11.4%) | 1,284 (8.0%) |
| $100,000+ | 3,110 (15.0%) | 914 (5.7%) |
| Total | 20,676 (100.0%) | 16,143 (100.0%) |
Earnings by Sex by Educational Attainment in Garfield County
Average earnings in Garfield County are $53,165 for men and $38,786 for women, a difference of 27.1%. Men with an educational attainment of graduate degree enjoy the highest average annual earnings of $72,292, while those with less than high school education earn the least with $39,725. Women with an educational attainment of graduate degree earn the most with the average annual earnings of $56,637, while those with less than high school education have the smallest earnings of $25,368.
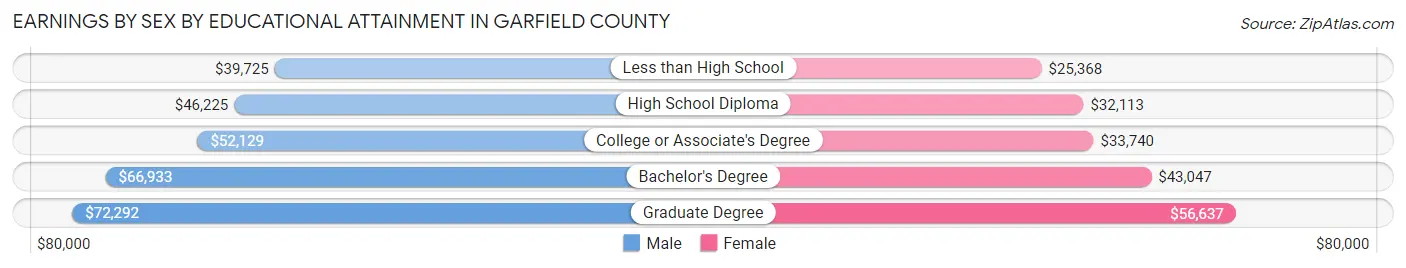
| Educational Attainment | Male Income | Female Income |
| Less than High School | $39,725 | $25,368 |
| High School Diploma | $46,225 | $32,113 |
| College or Associate's Degree | $52,129 | $33,740 |
| Bachelor's Degree | $66,933 | $43,047 |
| Graduate Degree | $72,292 | $56,637 |
| Total | $53,165 | $38,786 |
Family Income in Garfield County
Family Income Brackets in Garfield County
According to the Garfield County family income data, there are 3,804 families falling into the $100,000 to $149,999 income range, which is the most common income bracket and makes up 24.7% of all families. Conversely, the $10,000 to $14,999 income bracket is the least frequent group with only 154 families (1.0%) belonging to this category.
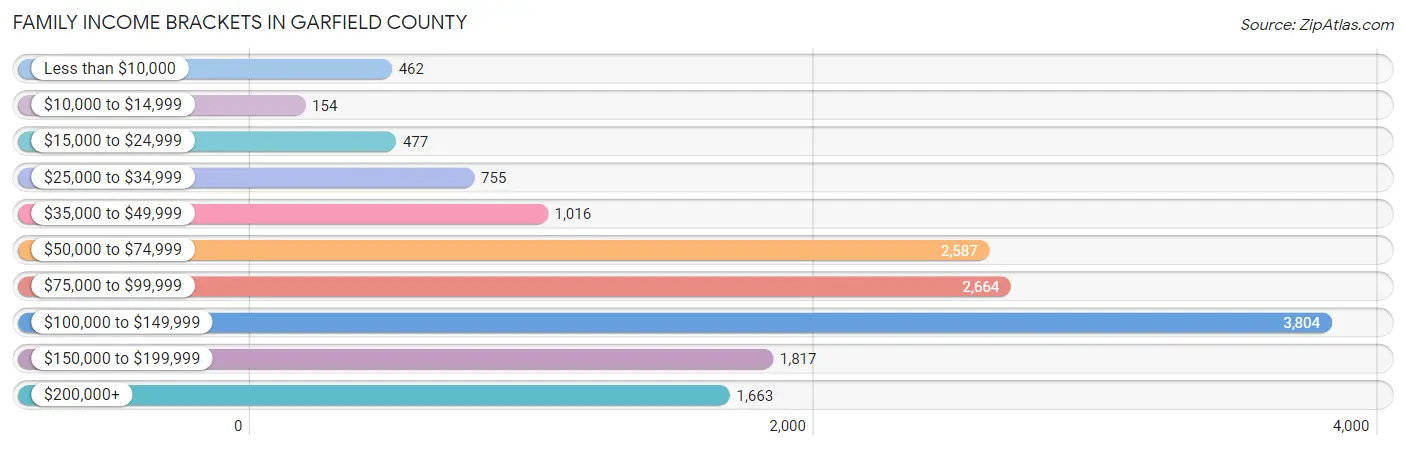
| Income Bracket | # Families | % Families |
| Less than $10,000 | 462 | 3.0% |
| $10,000 to $14,999 | 154 | 1.0% |
| $15,000 to $24,999 | 477 | 3.1% |
| $25,000 to $34,999 | 755 | 4.9% |
| $35,000 to $49,999 | 1,016 | 6.6% |
| $50,000 to $74,999 | 2,587 | 16.8% |
| $75,000 to $99,999 | 2,664 | 17.3% |
| $100,000 to $149,999 | 3,804 | 24.7% |
| $150,000 to $199,999 | 1,817 | 11.8% |
| $200,000+ | 1,663 | 10.8% |
Family Income by Famaliy Size in Garfield County
7+ person families (235 | 1.5%) account for the highest median family income in Garfield County with $119,694 per family, while 2-person families (7,048 | 45.8%) have the highest median income of $45,434 per family member.
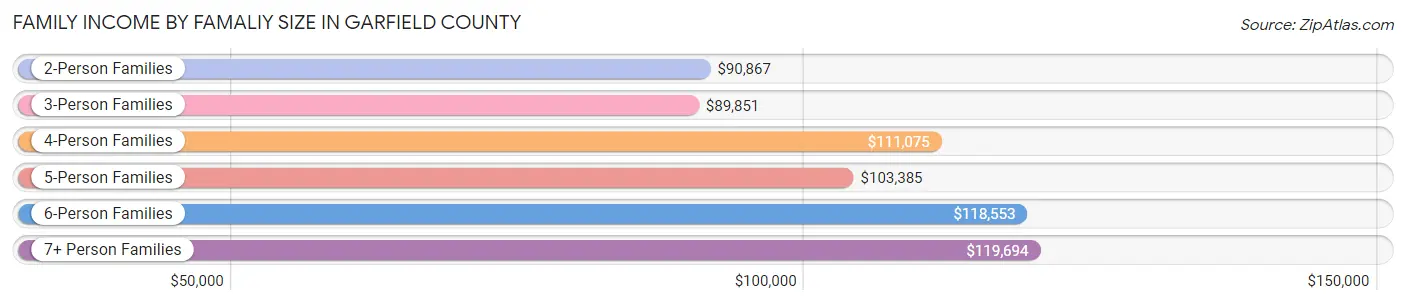
| Income Bracket | # Families | Median Income |
| 2-Person Families | 7,048 (45.8%) | $90,867 |
| 3-Person Families | 3,641 (23.6%) | $89,851 |
| 4-Person Families | 2,725 (17.7%) | $111,075 |
| 5-Person Families | 1,164 (7.6%) | $103,385 |
| 6-Person Families | 588 (3.8%) | $118,553 |
| 7+ Person Families | 235 (1.5%) | $119,694 |
| Total | 15,401 (100.0%) | $96,416 |
Family Income by Number of Earners in Garfield County
The median family income in Garfield County is $96,416, with families comprising 3+ earners (2,049) having the highest median family income of $127,440, while families with no earners (1,292) have the lowest median family income of $56,686, accounting for 13.3% and 8.4% of families, respectively.
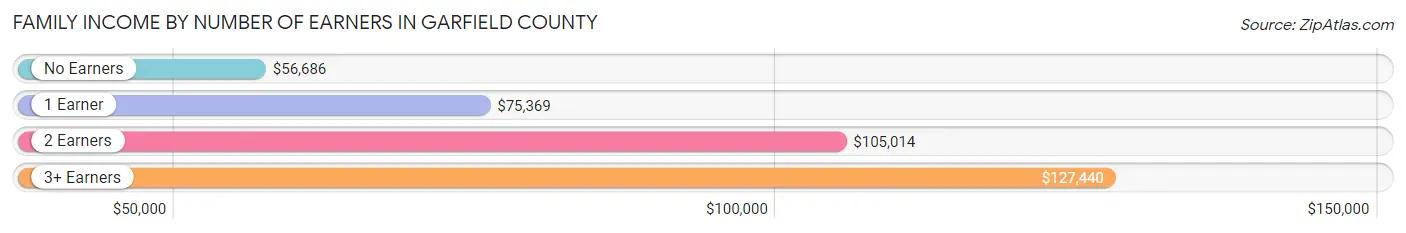
| Number of Earners | # Families | Median Income |
| No Earners | 1,292 (8.4%) | $56,686 |
| 1 Earner | 4,103 (26.6%) | $75,369 |
| 2 Earners | 7,957 (51.7%) | $105,014 |
| 3+ Earners | 2,049 (13.3%) | $127,440 |
| Total | 15,401 (100.0%) | $96,416 |
Household Income in Garfield County
Household Income Brackets in Garfield County
With 4,836 households falling in the category, the $100,000 to $149,999 income range is the most frequent in Garfield County, accounting for 21.6% of all households. In contrast, only 627 households (2.8%) fall into the $10,000 to $14,999 income bracket, making it the least populous group.
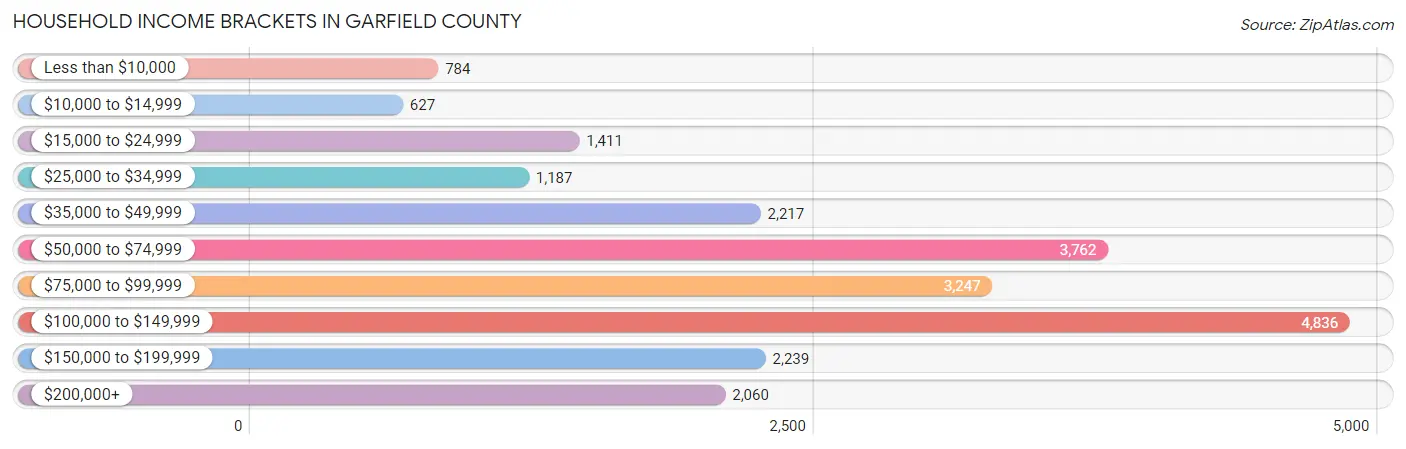
| Income Bracket | # Households | % Households |
| Less than $10,000 | 784 | 3.5% |
| $10,000 to $14,999 | 627 | 2.8% |
| $15,000 to $24,999 | 1,411 | 6.3% |
| $25,000 to $34,999 | 1,187 | 5.3% |
| $35,000 to $49,999 | 2,217 | 9.9% |
| $50,000 to $74,999 | 3,762 | 16.8% |
| $75,000 to $99,999 | 3,247 | 14.5% |
| $100,000 to $149,999 | 4,836 | 21.6% |
| $150,000 to $199,999 | 2,239 | 10.0% |
| $200,000+ | 2,060 | 9.2% |
Household Income by Householder Age in Garfield County
The median household income in Garfield County is $82,772, with the highest median household income of $90,673 found in the 45 to 64 years age bracket for the primary householder. A total of 8,499 households (38.0%) fall into this category. Meanwhile, the 15 to 24 years age bracket for the primary householder has the lowest median household income of $54,743, with 973 households (4.3%) in this group.
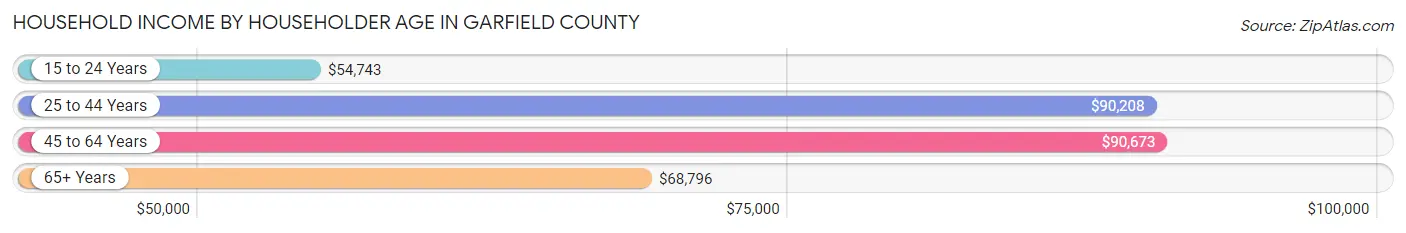
| Income Bracket | # Households | Median Income |
| 15 to 24 Years | 973 (4.3%) | $54,743 |
| 25 to 44 Years | 8,008 (35.8%) | $90,208 |
| 45 to 64 Years | 8,499 (38.0%) | $90,673 |
| 65+ Years | 4,910 (21.9%) | $68,796 |
| Total | 22,390 (100.0%) | $82,772 |
Poverty in Garfield County
Income Below Poverty by Sex and Age in Garfield County
With 7.5% poverty level for males and 8.7% for females among the residents of Garfield County, 5 year old males and 45 to 54 year old females are the most vulnerable to poverty, with 49 males (15.3%) and 543 females (14.8%) in their respective age groups living below the poverty level.
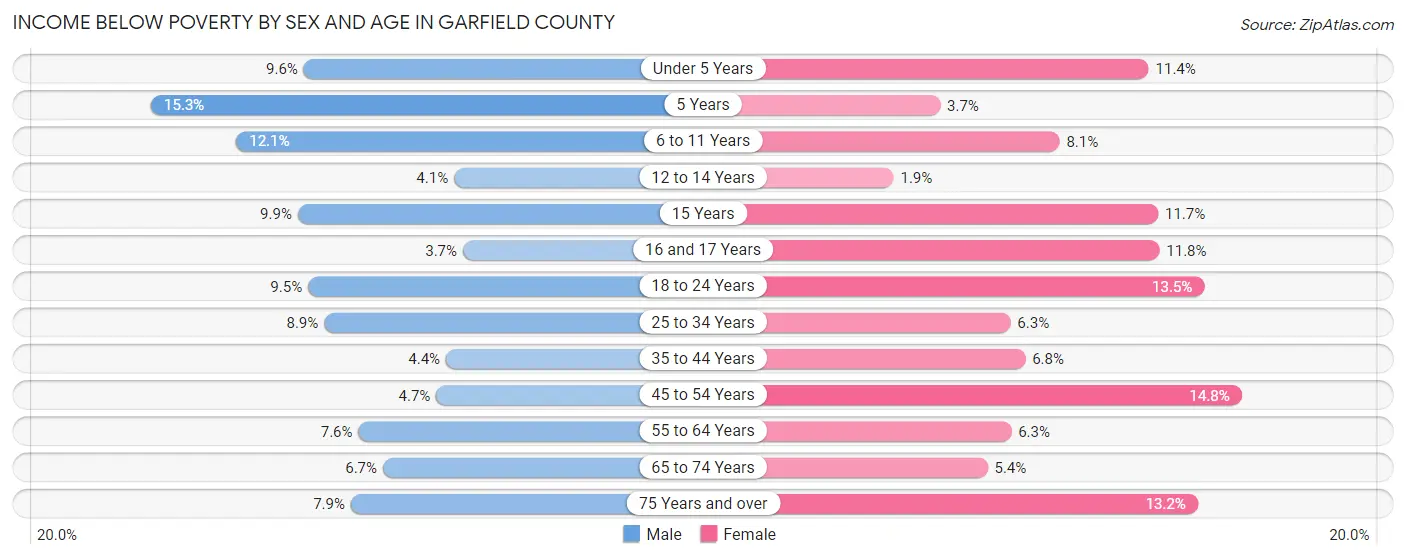
| Age Bracket | Male | Female |
| Under 5 Years | 187 (9.6%) | 232 (11.4%) |
| 5 Years | 49 (15.3%) | 23 (3.6%) |
| 6 to 11 Years | 361 (12.1%) | 194 (8.1%) |
| 12 to 14 Years | 44 (4.1%) | 23 (1.9%) |
| 15 Years | 42 (9.9%) | 50 (11.7%) |
| 16 and 17 Years | 33 (3.7%) | 94 (11.8%) |
| 18 to 24 Years | 250 (9.5%) | 310 (13.5%) |
| 25 to 34 Years | 379 (8.9%) | 247 (6.3%) |
| 35 to 44 Years | 200 (4.4%) | 284 (6.8%) |
| 45 to 54 Years | 189 (4.7%) | 543 (14.8%) |
| 55 to 64 Years | 313 (7.6%) | 238 (6.3%) |
| 65 to 74 Years | 184 (6.7%) | 146 (5.4%) |
| 75 Years and over | 93 (7.9%) | 209 (13.2%) |
| Total | 2,324 (7.5%) | 2,593 (8.7%) |
Income Above Poverty by Sex and Age in Garfield County
According to the poverty statistics in Garfield County, males aged 16 and 17 years and females aged 12 to 14 years are the age groups that are most secure financially, with 96.3% of males and 98.1% of females in these age groups living above the poverty line.
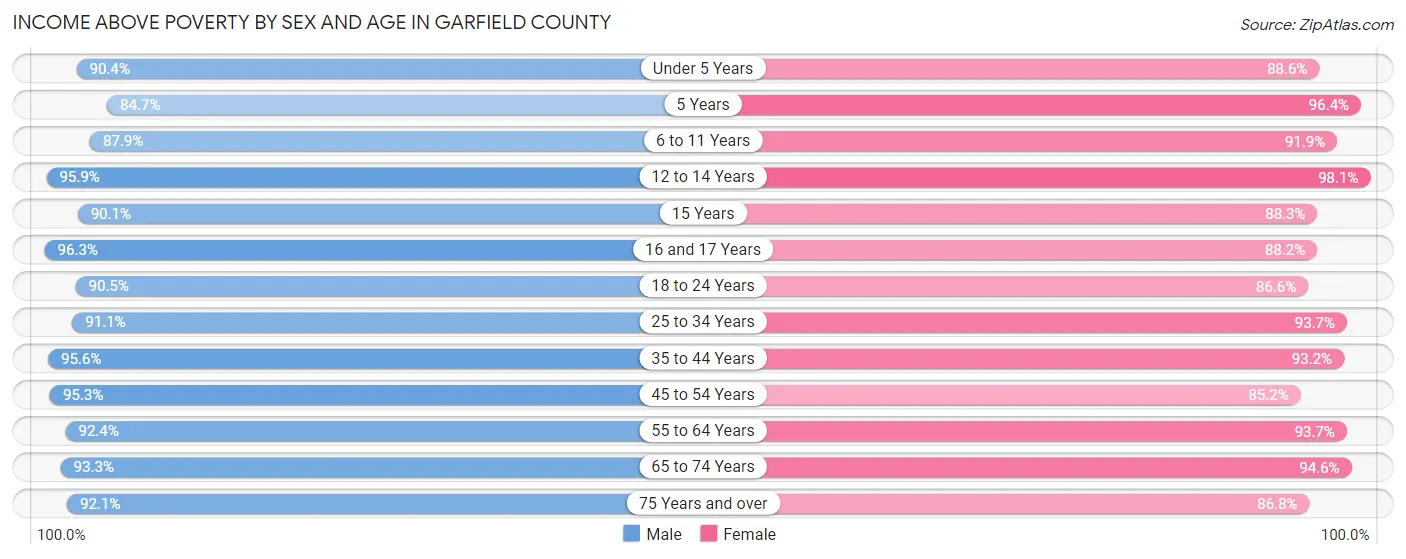
| Age Bracket | Male | Female |
| Under 5 Years | 1,752 (90.4%) | 1,804 (88.6%) |
| 5 Years | 271 (84.7%) | 607 (96.4%) |
| 6 to 11 Years | 2,613 (87.9%) | 2,207 (91.9%) |
| 12 to 14 Years | 1,041 (95.9%) | 1,177 (98.1%) |
| 15 Years | 384 (90.1%) | 376 (88.3%) |
| 16 and 17 Years | 851 (96.3%) | 703 (88.2%) |
| 18 to 24 Years | 2,386 (90.5%) | 1,994 (86.6%) |
| 25 to 34 Years | 3,890 (91.1%) | 3,697 (93.7%) |
| 35 to 44 Years | 4,384 (95.6%) | 3,884 (93.2%) |
| 45 to 54 Years | 3,811 (95.3%) | 3,117 (85.2%) |
| 55 to 64 Years | 3,802 (92.4%) | 3,546 (93.7%) |
| 65 to 74 Years | 2,563 (93.3%) | 2,551 (94.6%) |
| 75 Years and over | 1,086 (92.1%) | 1,373 (86.8%) |
| Total | 28,834 (92.5%) | 27,036 (91.2%) |
Income Below Poverty Among Married-Couple Families in Garfield County
The poverty statistics for married-couple families in Garfield County show that 3.5% or 437 of the total 12,360 families live below the poverty line. Families with 5 or more children have the highest poverty rate of 55.8%, comprising of 43 families. On the other hand, families with 1 or 2 children have the lowest poverty rate of 1.7%, which includes 80 families.
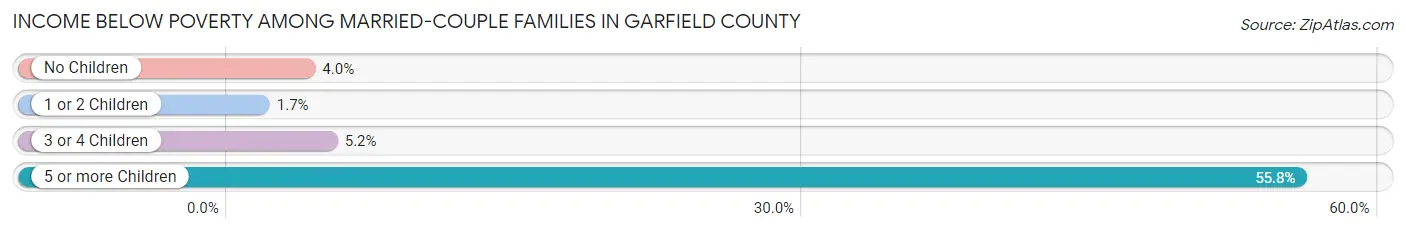
| Children | Above Poverty | Below Poverty |
| No Children | 6,062 (96.0%) | 255 (4.0%) |
| 1 or 2 Children | 4,753 (98.3%) | 80 (1.7%) |
| 3 or 4 Children | 1,074 (94.8%) | 59 (5.2%) |
| 5 or more Children | 34 (44.2%) | 43 (55.8%) |
| Total | 11,923 (96.5%) | 437 (3.5%) |
Income Below Poverty Among Single-Parent Households in Garfield County
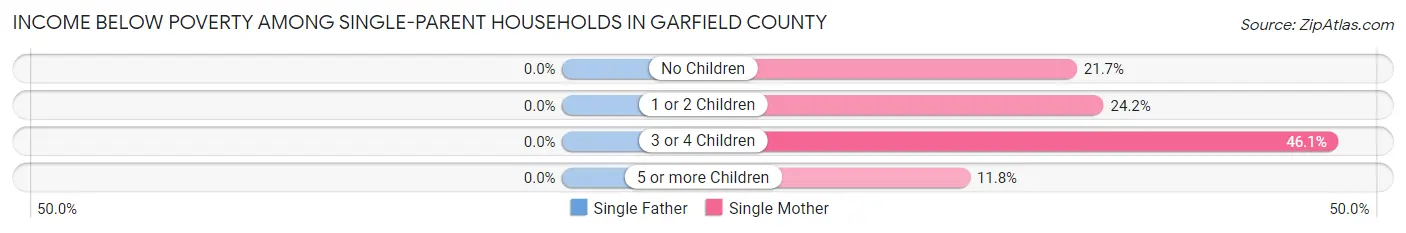
| Children | Single Father | Single Mother |
| No Children | 0 (0.0%) | 187 (21.7%) |
| 1 or 2 Children | 0 (0.0%) | 252 (24.2%) |
| 3 or 4 Children | 0 (0.0%) | 47 (46.1%) |
| 5 or more Children | 0 (0.0%) | 6 (11.8%) |
| Total | 0 (0.0%) | 492 (23.9%) |
Income Below Poverty Among Married-Couple vs Single-Parent Households in Garfield County
The poverty data for Garfield County shows that 437 of the married-couple family households (3.5%) and 492 of the single-parent households (16.2%) are living below the poverty level. Within the married-couple family households, those with 5 or more children have the highest poverty rate, with 43 households (55.8%) falling below the poverty line. Among the single-parent households, those with 3 or 4 children have the highest poverty rate, with 47 household (38.2%) living below poverty.
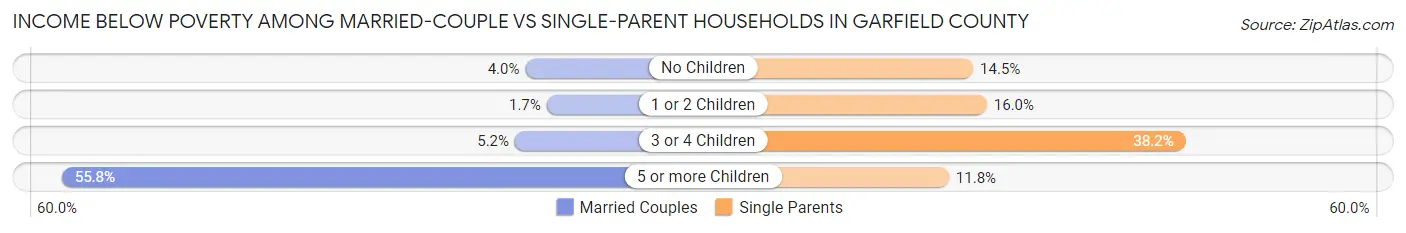
| Children | Married-Couple Families | Single-Parent Households |
| No Children | 255 (4.0%) | 187 (14.5%) |
| 1 or 2 Children | 80 (1.7%) | 252 (16.0%) |
| 3 or 4 Children | 59 (5.2%) | 47 (38.2%) |
| 5 or more Children | 43 (55.8%) | 6 (11.8%) |
| Total | 437 (3.5%) | 492 (16.2%) |
Employment Characteristics in Garfield County
Employment by Class of Employer in Garfield County
Among the 33,232 employed individuals in Garfield County, private company employees (20,731 | 62.4%), local government employees (3,175 | 9.6%), and self-employed (not incorporated) (2,782 | 8.4%) make up the most common classes of employment.
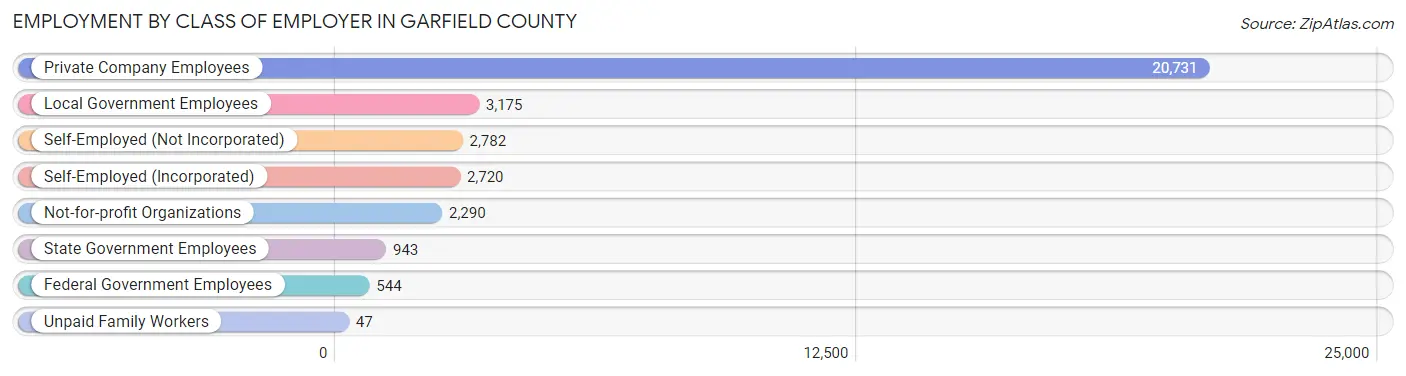
| Employer Class | # Employees | % Employees |
| Private Company Employees | 20,731 | 62.4% |
| Self-Employed (Incorporated) | 2,720 | 8.2% |
| Self-Employed (Not Incorporated) | 2,782 | 8.4% |
| Not-for-profit Organizations | 2,290 | 6.9% |
| Local Government Employees | 3,175 | 9.6% |
| State Government Employees | 943 | 2.8% |
| Federal Government Employees | 544 | 1.6% |
| Unpaid Family Workers | 47 | 0.1% |
| Total | 33,232 | 100.0% |
Employment Status by Age in Garfield County
According to the labor force statistics for Garfield County, out of the total population over 16 years of age (48,171), 73.0% or 35,165 individuals are in the labor force, with 3.2% or 1,125 of them unemployed. The age group with the highest labor force participation rate is 20 to 24 years, with 91.6% or 3,285 individuals in the labor force. Within the labor force, the 16 to 19 years age range has the highest percentage of unemployed individuals, with 17.8% or 278 of them being unemployed.
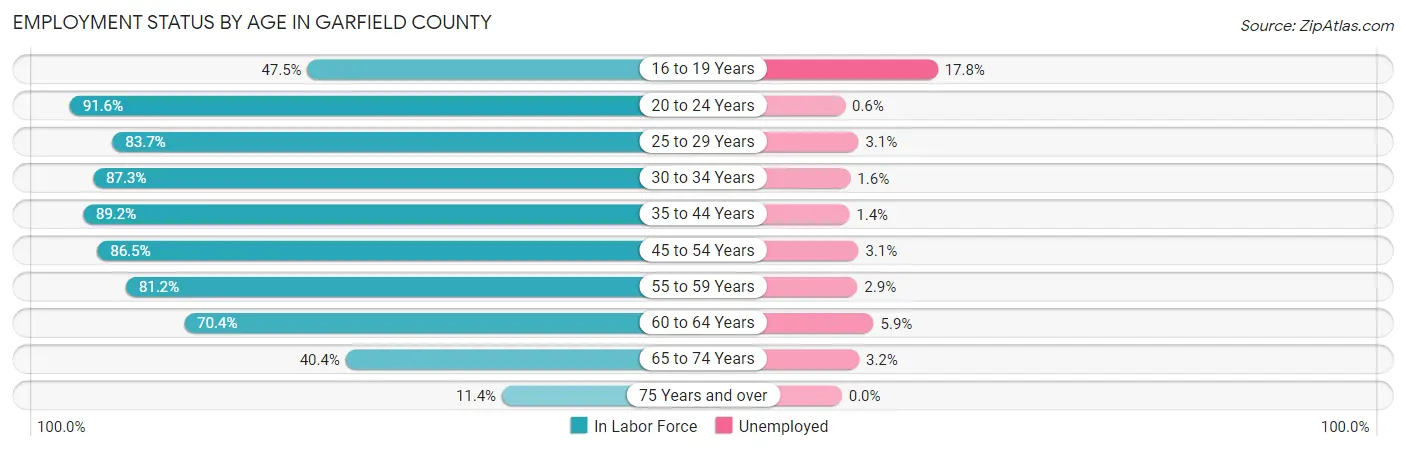
| Age Bracket | In Labor Force | Unemployed |
| 16 to 19 Years | 1,561 (47.5%) | 278 (17.8%) |
| 20 to 24 Years | 3,285 (91.6%) | 20 (0.6%) |
| 25 to 29 Years | 3,293 (83.7%) | 102 (3.1%) |
| 30 to 34 Years | 3,860 (87.3%) | 62 (1.6%) |
| 35 to 44 Years | 7,923 (89.2%) | 111 (1.4%) |
| 45 to 54 Years | 6,655 (86.5%) | 206 (3.1%) |
| 55 to 59 Years | 3,261 (81.2%) | 95 (2.9%) |
| 60 to 64 Years | 2,767 (70.4%) | 163 (5.9%) |
| 65 to 74 Years | 2,214 (40.4%) | 71 (3.2%) |
| 75 Years and over | 335 (11.4%) | 0 (0.0%) |
| Total | 35,165 (73.0%) | 1,125 (3.2%) |
Employment Status by Educational Attainment in Garfield County
According to labor force statistics for Garfield County, 84.4% of individuals (27,750) out of the total population between 25 and 64 years of age (32,879) are in the labor force, with 2.7% or 749 of them being unemployed. The group with the highest labor force participation rate are those with the educational attainment of bachelor's degree or higher, with 91.3% or 9,524 individuals in the labor force. Within the labor force, individuals with less than high school education have the highest percentage of unemployment, with 7.2% or 220 of them being unemployed.
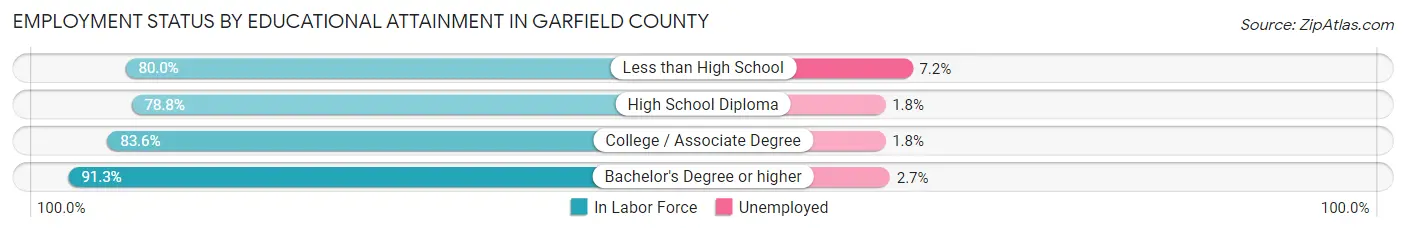
| Educational Attainment | In Labor Force | Unemployed |
| Less than High School | 3,058 (80.0%) | 275 (7.2%) |
| High School Diploma | 6,450 (78.8%) | 147 (1.8%) |
| College / Associate Degree | 8,727 (83.6%) | 188 (1.8%) |
| Bachelor's Degree or higher | 9,524 (91.3%) | 282 (2.7%) |
| Total | 27,750 (84.4%) | 888 (2.7%) |
Employment Occupations by Sex in Garfield County
Management, Business, Science and Arts Occupations
The most common Management, Business, Science and Arts occupations in Garfield County are Management (3,966 | 11.7%), Community & Social Service (3,440 | 10.1%), Education Instruction & Library (1,742 | 5.1%), Computers, Engineering & Science (1,481 | 4.3%), and Health Diagnosing & Treating (1,459 | 4.3%).
Management, Business, Science and Arts Occupations by Sex
Within the Management, Business, Science and Arts occupations in Garfield County, the most male-oriented occupations are Architecture & Engineering (82.2%), Computers, Engineering & Science (75.9%), and Computers & Mathematics (73.9%), while the most female-oriented occupations are Health Diagnosing & Treating (72.8%), Health Technologists (71.5%), and Education Instruction & Library (67.4%).
| Occupation | Male | Female |
| Management | 2,459 (62.0%) | 1,507 (38.0%) |
| Business & Financial | 551 (42.9%) | 732 (57.1%) |
| Computers, Engineering & Science | 1,124 (75.9%) | 357 (24.1%) |
| Computers & Mathematics | 385 (73.9%) | 136 (26.1%) |
| Architecture & Engineering | 617 (82.2%) | 134 (17.8%) |
| Life, Physical & Social Science | 122 (58.4%) | 87 (41.6%) |
| Community & Social Service | 1,376 (40.0%) | 2,064 (60.0%) |
| Education, Arts & Media | 330 (59.7%) | 223 (40.3%) |
| Legal Services & Support | 211 (59.6%) | 143 (40.4%) |
| Education Instruction & Library | 567 (32.6%) | 1,175 (67.4%) |
| Arts, Media & Entertainment | 268 (33.9%) | 523 (66.1%) |
| Health Diagnosing & Treating | 397 (27.2%) | 1,062 (72.8%) |
| Health Technologists | 318 (28.5%) | 797 (71.5%) |
| Total (Category) | 5,907 (50.8%) | 5,722 (49.2%) |
| Total (Overall) | 19,260 (56.6%) | 14,782 (43.4%) |
Services Occupations
The most common Services occupations in Garfield County are Cleaning & Maintenance (2,281 | 6.7%), Food Preparation & Serving (1,627 | 4.8%), Personal Care & Service (1,323 | 3.9%), Healthcare Support (866 | 2.5%), and Security & Protection (769 | 2.3%).
Services Occupations by Sex
Within the Services occupations in Garfield County, the most male-oriented occupations are Firefighting & Prevention (97.1%), Security & Protection (90.8%), and Law Enforcement (77.6%), while the most female-oriented occupations are Healthcare Support (85.7%), Food Preparation & Serving (58.3%), and Cleaning & Maintenance (58.1%).
| Occupation | Male | Female |
| Healthcare Support | 124 (14.3%) | 742 (85.7%) |
| Security & Protection | 698 (90.8%) | 71 (9.2%) |
| Firefighting & Prevention | 504 (97.1%) | 15 (2.9%) |
| Law Enforcement | 194 (77.6%) | 56 (22.4%) |
| Food Preparation & Serving | 678 (41.7%) | 949 (58.3%) |
| Cleaning & Maintenance | 955 (41.9%) | 1,326 (58.1%) |
| Personal Care & Service | 596 (45.1%) | 727 (54.9%) |
| Total (Category) | 3,051 (44.4%) | 3,815 (55.6%) |
| Total (Overall) | 19,260 (56.6%) | 14,782 (43.4%) |
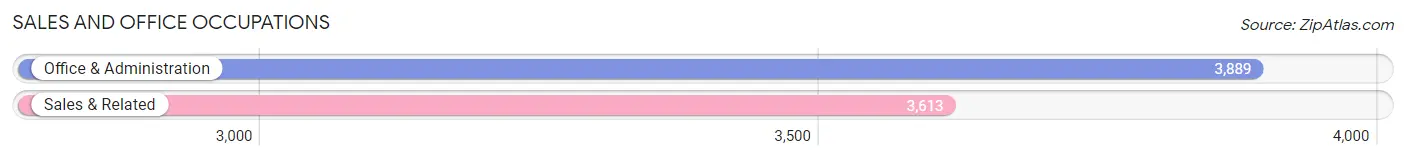
Sales and Office Occupations
The most common Sales and Office occupations in Garfield County are Office & Administration (3,889 | 11.4%), and Sales & Related (3,613 | 10.6%).
Sales and Office Occupations by Sex
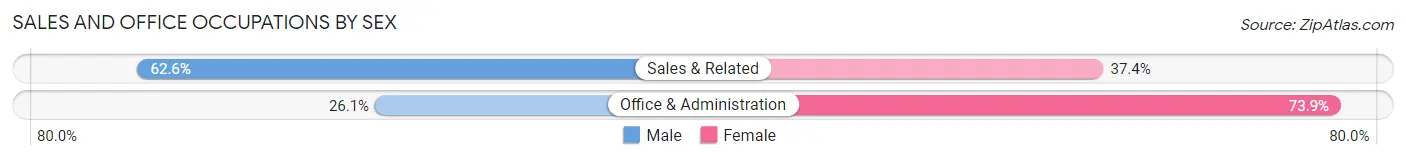
| Occupation | Male | Female |
| Sales & Related | 2,262 (62.6%) | 1,351 (37.4%) |
| Office & Administration | 1,015 (26.1%) | 2,874 (73.9%) |
| Total (Category) | 3,277 (43.7%) | 4,225 (56.3%) |
| Total (Overall) | 19,260 (56.6%) | 14,782 (43.4%) |
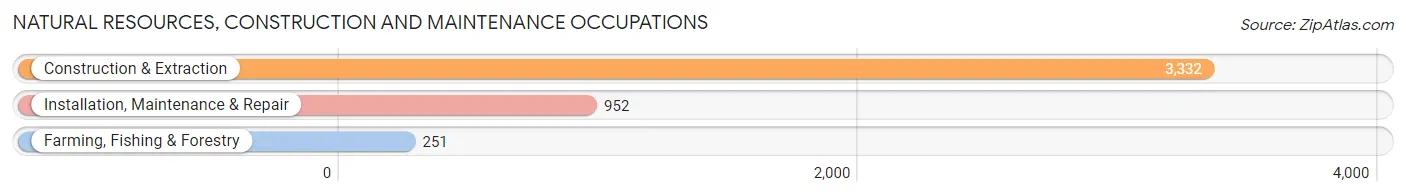
Natural Resources, Construction and Maintenance Occupations
The most common Natural Resources, Construction and Maintenance occupations in Garfield County are Construction & Extraction (3,332 | 9.8%), Installation, Maintenance & Repair (952 | 2.8%), and Farming, Fishing & Forestry (251 | 0.7%).
Natural Resources, Construction and Maintenance Occupations by Sex
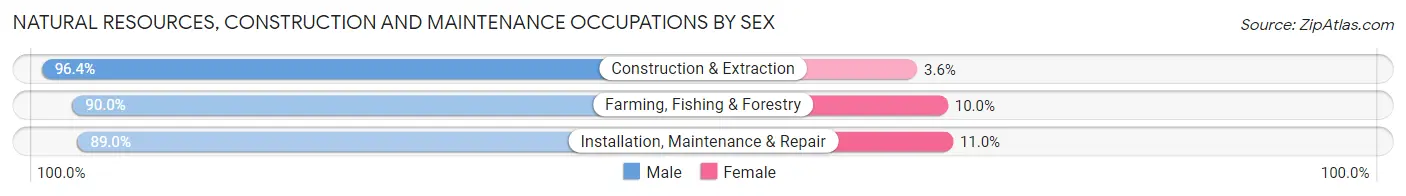
| Occupation | Male | Female |
| Farming, Fishing & Forestry | 226 (90.0%) | 25 (10.0%) |
| Construction & Extraction | 3,213 (96.4%) | 119 (3.6%) |
| Installation, Maintenance & Repair | 847 (89.0%) | 105 (11.0%) |
| Total (Category) | 4,286 (94.5%) | 249 (5.5%) |
| Total (Overall) | 19,260 (56.6%) | 14,782 (43.4%) |
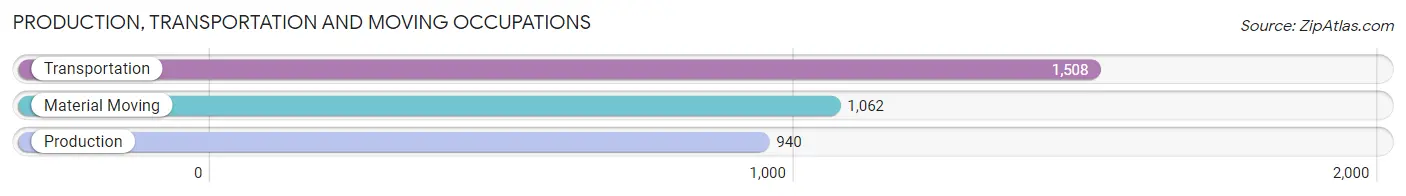
Production, Transportation and Moving Occupations
The most common Production, Transportation and Moving occupations in Garfield County are Transportation (1,508 | 4.4%), Material Moving (1,062 | 3.1%), and Production (940 | 2.8%).
Production, Transportation and Moving Occupations by Sex
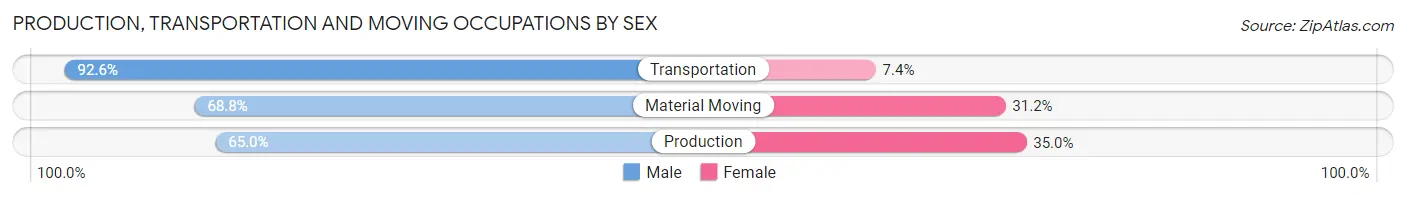
| Occupation | Male | Female |
| Production | 611 (65.0%) | 329 (35.0%) |
| Transportation | 1,397 (92.6%) | 111 (7.4%) |
| Material Moving | 731 (68.8%) | 331 (31.2%) |
| Total (Category) | 2,739 (78.0%) | 771 (22.0%) |
| Total (Overall) | 19,260 (56.6%) | 14,782 (43.4%) |
Employment Industries by Sex in Garfield County
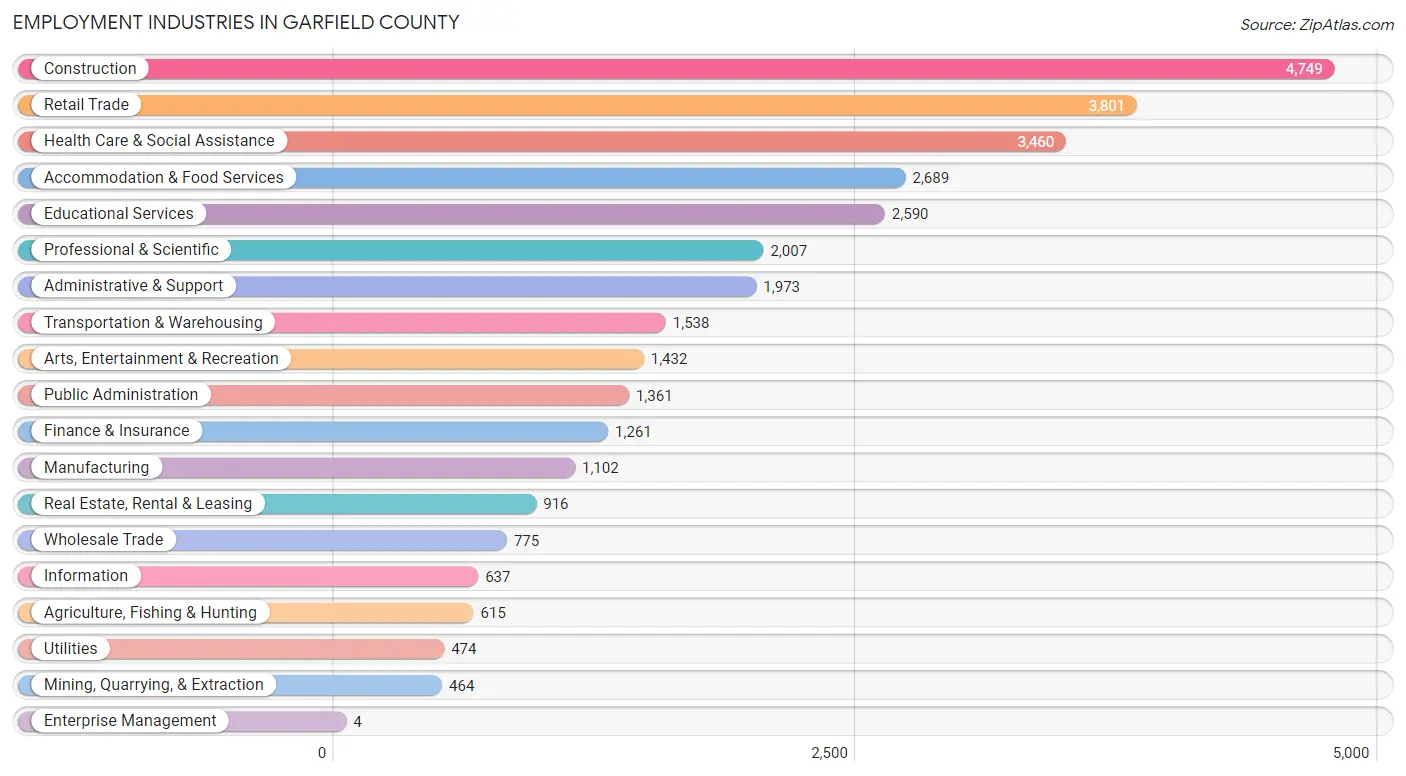
Employment Industries in Garfield County
The major employment industries in Garfield County include Construction (4,749 | 14.0%), Retail Trade (3,801 | 11.2%), Health Care & Social Assistance (3,460 | 10.2%), Accommodation & Food Services (2,689 | 7.9%), and Educational Services (2,590 | 7.6%).
Employment Industries by Sex in Garfield County
The Garfield County industries that see more men than women are Agriculture, Fishing & Hunting (90.9%), Construction (89.4%), and Transportation & Warehousing (86.2%), whereas the industries that tend to have a higher number of women are Enterprise Management (100.0%), Health Care & Social Assistance (76.7%), and Educational Services (67.5%).
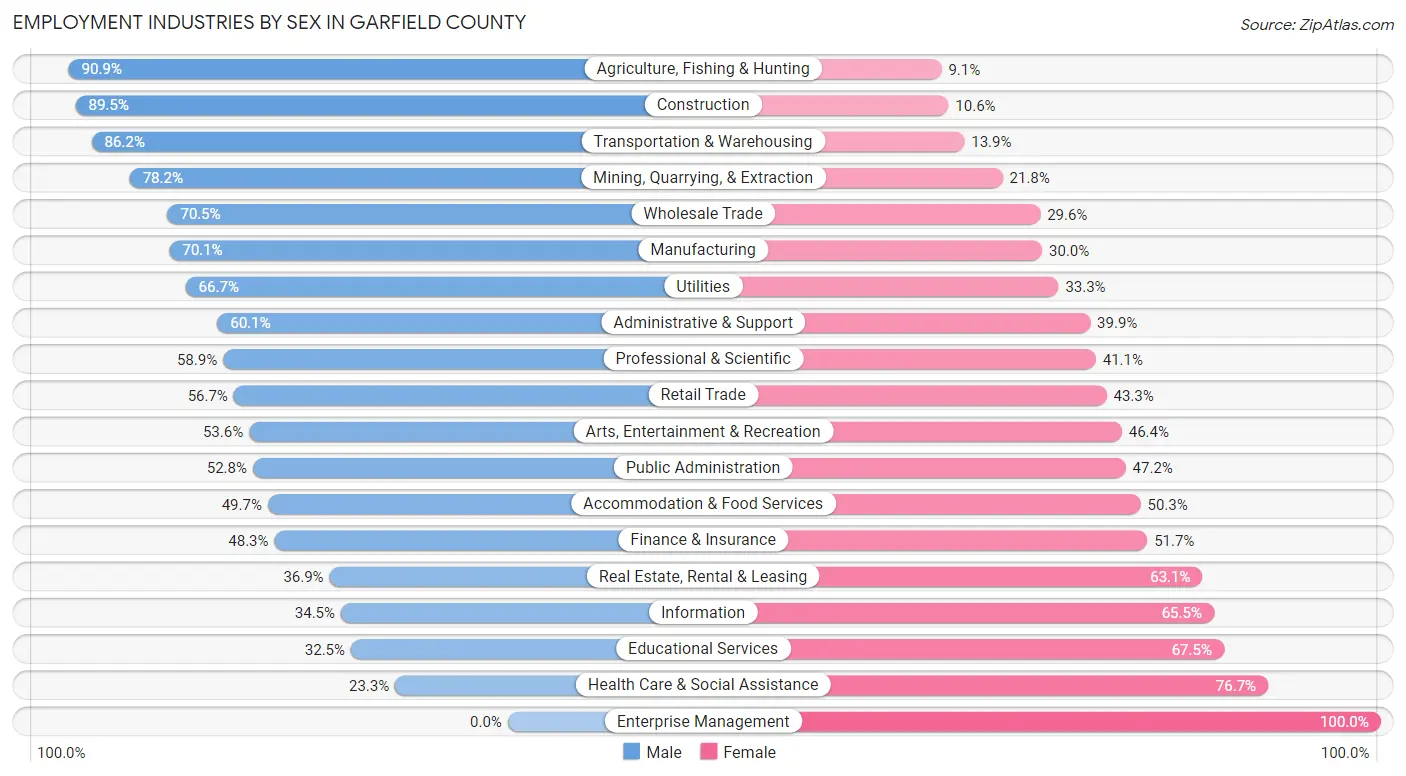
| Industry | Male | Female |
| Agriculture, Fishing & Hunting | 559 (90.9%) | 56 (9.1%) |
| Mining, Quarrying, & Extraction | 363 (78.2%) | 101 (21.8%) |
| Construction | 4,248 (89.4%) | 501 (10.5%) |
| Manufacturing | 772 (70.1%) | 330 (29.9%) |
| Wholesale Trade | 546 (70.5%) | 229 (29.5%) |
| Retail Trade | 2,156 (56.7%) | 1,645 (43.3%) |
| Transportation & Warehousing | 1,325 (86.2%) | 213 (13.9%) |
| Utilities | 316 (66.7%) | 158 (33.3%) |
| Information | 220 (34.5%) | 417 (65.5%) |
| Finance & Insurance | 609 (48.3%) | 652 (51.7%) |
| Real Estate, Rental & Leasing | 338 (36.9%) | 578 (63.1%) |
| Professional & Scientific | 1,183 (58.9%) | 824 (41.1%) |
| Enterprise Management | 0 (0.0%) | 4 (100.0%) |
| Administrative & Support | 1,186 (60.1%) | 787 (39.9%) |
| Educational Services | 841 (32.5%) | 1,749 (67.5%) |
| Health Care & Social Assistance | 807 (23.3%) | 2,653 (76.7%) |
| Arts, Entertainment & Recreation | 767 (53.6%) | 665 (46.4%) |
| Accommodation & Food Services | 1,336 (49.7%) | 1,353 (50.3%) |
| Public Administration | 718 (52.8%) | 643 (47.2%) |
| Total | 19,260 (56.6%) | 14,782 (43.4%) |
Education in Garfield County
School Enrollment in Garfield County
The most common levels of schooling among the 15,172 students in Garfield County are middle school (3,561 | 23.5%), elementary school (3,389 | 22.3%), and high school (3,288 | 21.7%).
| School Level | # Students | % Students |
| Nursery / Preschool | 1,105 | 7.3% |
| Kindergarten | 882 | 5.8% |
| Elementary School | 3,389 | 22.3% |
| Middle School | 3,561 | 23.5% |
| High School | 3,288 | 21.7% |
| College / Undergraduate | 2,263 | 14.9% |
| Graduate / Professional | 684 | 4.5% |
| Total | 15,172 | 100.0% |
School Enrollment by Age by Funding Source in Garfield County
Out of a total of 15,172 students who are enrolled in schools in Garfield County, 2,625 (17.3%) attend a private institution, while the remaining 12,547 (82.7%) are enrolled in public schools. The age group of 20 to 24 year olds has the highest likelihood of being enrolled in private schools, with 413 (54.1% in the age bracket) enrolled. Conversely, the age group of 15 to 17 year olds has the lowest likelihood of being enrolled in a private school, with 2,252 (91.2% in the age bracket) attending a public institution.
| Age Bracket | Public School | Private School |
| 3 to 4 Year Olds | 734 (75.4%) | 239 (24.6%) |
| 5 to 9 Year Old | 3,564 (90.0%) | 394 (10.0%) |
| 10 to 14 Year Olds | 3,356 (78.3%) | 928 (21.7%) |
| 15 to 17 Year Olds | 2,252 (91.2%) | 217 (8.8%) |
| 18 to 19 Year Olds | 858 (89.7%) | 98 (10.2%) |
| 20 to 24 Year Olds | 350 (45.9%) | 413 (54.1%) |
| 25 to 34 Year Olds | 820 (89.4%) | 97 (10.6%) |
| 35 Years and over | 614 (72.1%) | 238 (27.9%) |
| Total | 12,547 (82.7%) | 2,625 (17.3%) |
Educational Attainment by Field of Study in Garfield County
Business (2,664 | 17.6%), education (2,033 | 13.4%), science & technology (1,493 | 9.9%), social sciences (1,459 | 9.6%), and bio, nature & agricultural (1,192 | 7.9%) are the most common fields of study among 15,163 individuals in Garfield County who have obtained a bachelor's degree or higher.
| Field of Study | # Graduates | % Graduates |
| Computers & Mathematics | 471 | 3.1% |
| Bio, Nature & Agricultural | 1,192 | 7.9% |
| Physical & Health Sciences | 467 | 3.1% |
| Psychology | 864 | 5.7% |
| Social Sciences | 1,459 | 9.6% |
| Engineering | 1,153 | 7.6% |
| Multidisciplinary Studies | 101 | 0.7% |
| Science & Technology | 1,493 | 9.9% |
| Business | 2,664 | 17.6% |
| Education | 2,033 | 13.4% |
| Literature & Languages | 670 | 4.4% |
| Liberal Arts & History | 521 | 3.4% |
| Visual & Performing Arts | 594 | 3.9% |
| Communications | 501 | 3.3% |
| Arts & Humanities | 980 | 6.5% |
| Total | 15,163 | 100.0% |
Transportation & Commute in Garfield County
Vehicle Availability by Sex in Garfield County
The most prevalent vehicle ownership categories in Garfield County are males with 2 vehicles (7,211, accounting for 38.3%) and females with 2 vehicles (5,178, making up 50.8%).
| Vehicles Available | Male | Female |
| No Vehicle | 268 (1.4%) | 270 (1.9%) |
| 1 Vehicle | 2,118 (11.2%) | 2,183 (15.4%) |
| 2 Vehicles | 7,211 (38.3%) | 5,178 (36.5%) |
| 3 Vehicles | 4,984 (26.5%) | 3,559 (25.1%) |
| 4 Vehicles | 2,474 (13.1%) | 1,862 (13.1%) |
| 5 or more Vehicles | 1,786 (9.5%) | 1,149 (8.1%) |
| Total | 18,841 (100.0%) | 14,201 (100.0%) |
Commute Time in Garfield County
The most frequently occuring commute durations in Garfield County are 10 to 14 minutes (3,928 commuters, 13.0%), 20 to 24 minutes (3,796 commuters, 12.6%), and 15 to 19 minutes (3,757 commuters, 12.5%).
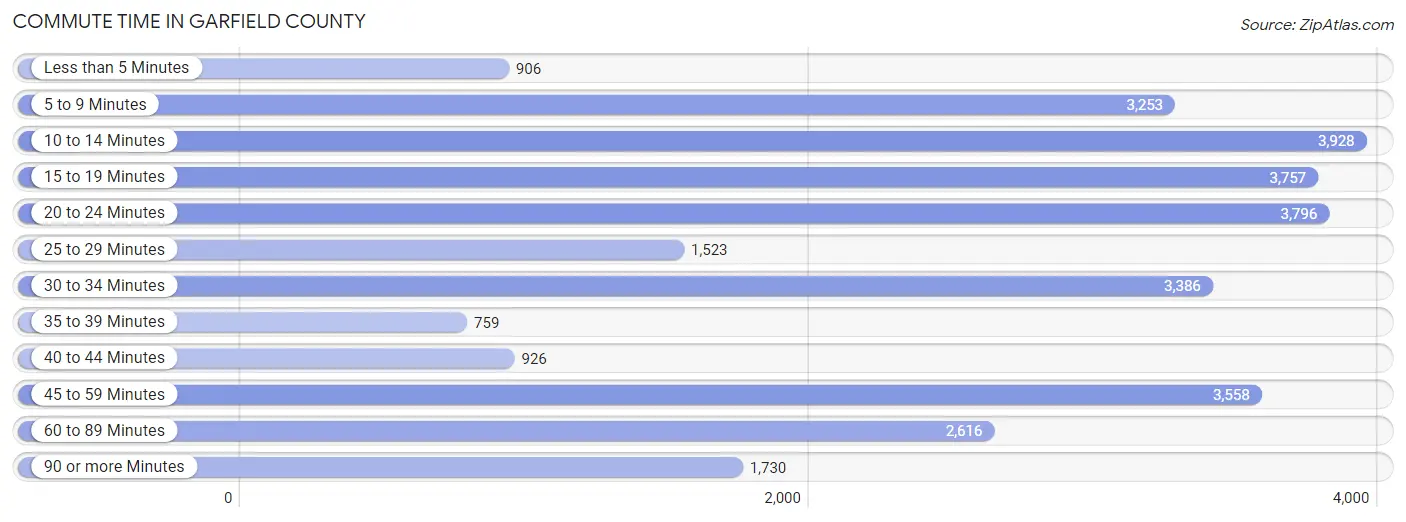
| Commute Time | # Commuters | % Commuters |
| Less than 5 Minutes | 906 | 3.0% |
| 5 to 9 Minutes | 3,253 | 10.8% |
| 10 to 14 Minutes | 3,928 | 13.0% |
| 15 to 19 Minutes | 3,757 | 12.5% |
| 20 to 24 Minutes | 3,796 | 12.6% |
| 25 to 29 Minutes | 1,523 | 5.1% |
| 30 to 34 Minutes | 3,386 | 11.2% |
| 35 to 39 Minutes | 759 | 2.5% |
| 40 to 44 Minutes | 926 | 3.1% |
| 45 to 59 Minutes | 3,558 | 11.8% |
| 60 to 89 Minutes | 2,616 | 8.7% |
| 90 or more Minutes | 1,730 | 5.7% |
Commute Time by Sex in Garfield County
The most common commute times in Garfield County are 20 to 24 minutes (2,262 commuters, 12.9%) for males and 15 to 19 minutes (1,903 commuters, 15.0%) for females.
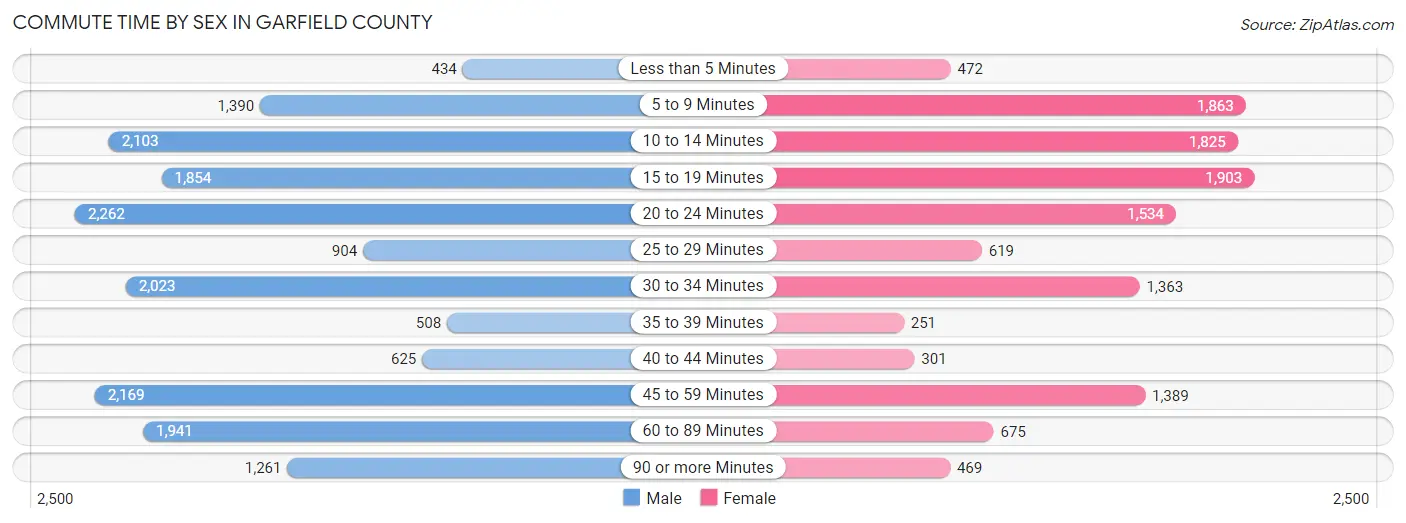
| Commute Time | Male | Female |
| Less than 5 Minutes | 434 (2.5%) | 472 (3.7%) |
| 5 to 9 Minutes | 1,390 (8.0%) | 1,863 (14.7%) |
| 10 to 14 Minutes | 2,103 (12.0%) | 1,825 (14.4%) |
| 15 to 19 Minutes | 1,854 (10.6%) | 1,903 (15.0%) |
| 20 to 24 Minutes | 2,262 (12.9%) | 1,534 (12.1%) |
| 25 to 29 Minutes | 904 (5.2%) | 619 (4.9%) |
| 30 to 34 Minutes | 2,023 (11.6%) | 1,363 (10.8%) |
| 35 to 39 Minutes | 508 (2.9%) | 251 (2.0%) |
| 40 to 44 Minutes | 625 (3.6%) | 301 (2.4%) |
| 45 to 59 Minutes | 2,169 (12.4%) | 1,389 (11.0%) |
| 60 to 89 Minutes | 1,941 (11.1%) | 675 (5.3%) |
| 90 or more Minutes | 1,261 (7.2%) | 469 (3.7%) |
Time of Departure to Work by Sex in Garfield County
The most frequent times of departure to work in Garfield County are 7:00 AM to 7:29 AM (3,161, 18.1%) for males and 7:00 AM to 7:29 AM (2,279, 18.0%) for females.
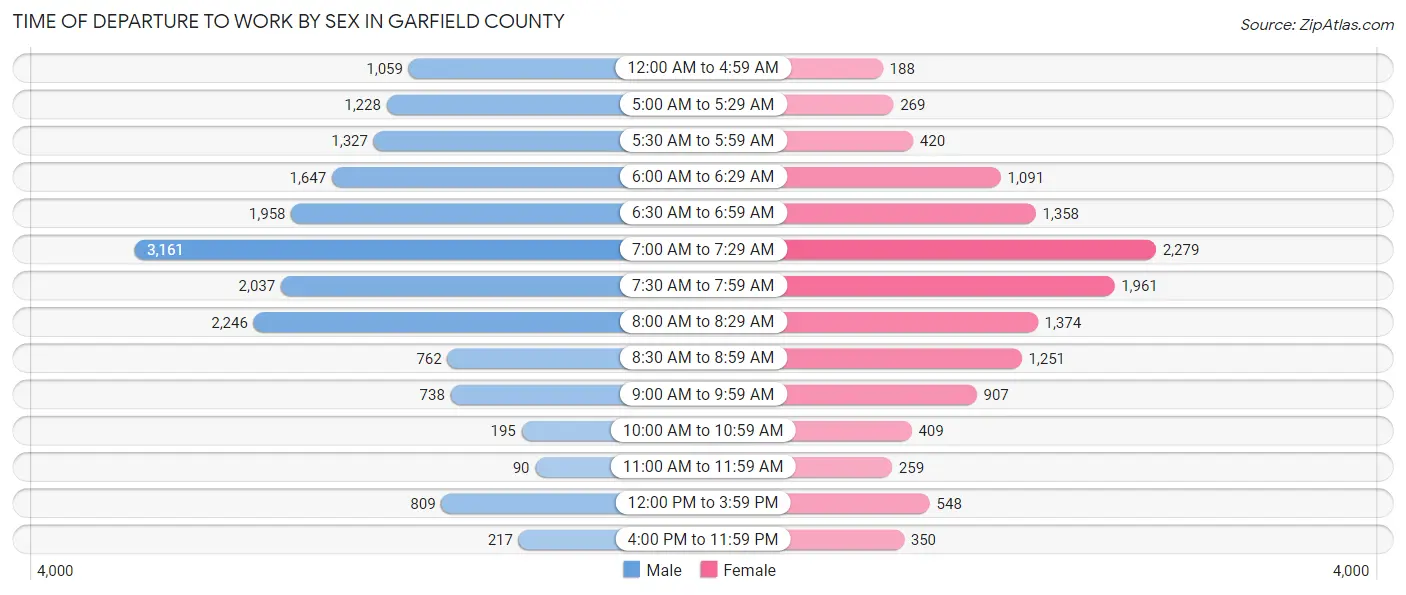
| Time of Departure | Male | Female |
| 12:00 AM to 4:59 AM | 1,059 (6.1%) | 188 (1.5%) |
| 5:00 AM to 5:29 AM | 1,228 (7.0%) | 269 (2.1%) |
| 5:30 AM to 5:59 AM | 1,327 (7.6%) | 420 (3.3%) |
| 6:00 AM to 6:29 AM | 1,647 (9.4%) | 1,091 (8.6%) |
| 6:30 AM to 6:59 AM | 1,958 (11.2%) | 1,358 (10.7%) |
| 7:00 AM to 7:29 AM | 3,161 (18.1%) | 2,279 (18.0%) |
| 7:30 AM to 7:59 AM | 2,037 (11.7%) | 1,961 (15.5%) |
| 8:00 AM to 8:29 AM | 2,246 (12.9%) | 1,374 (10.8%) |
| 8:30 AM to 8:59 AM | 762 (4.4%) | 1,251 (9.9%) |
| 9:00 AM to 9:59 AM | 738 (4.2%) | 907 (7.2%) |
| 10:00 AM to 10:59 AM | 195 (1.1%) | 409 (3.2%) |
| 11:00 AM to 11:59 AM | 90 (0.5%) | 259 (2.1%) |
| 12:00 PM to 3:59 PM | 809 (4.6%) | 548 (4.3%) |
| 4:00 PM to 11:59 PM | 217 (1.2%) | 350 (2.8%) |
| Total | 17,474 (100.0%) | 12,664 (100.0%) |
Housing Occupancy in Garfield County
Occupancy by Ownership in Garfield County
Of the total 22,390 dwellings in Garfield County, owner-occupied units account for 15,653 (69.9%), while renter-occupied units make up 6,737 (30.1%).
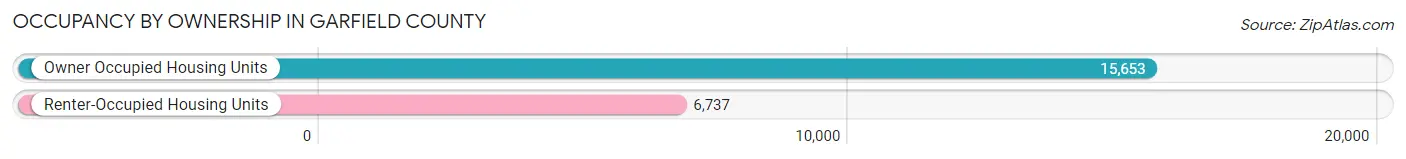
| Occupancy | # Housing Units | % Housing Units |
| Owner Occupied Housing Units | 15,653 | 69.9% |
| Renter-Occupied Housing Units | 6,737 | 30.1% |
| Total Occupied Housing Units | 22,390 | 100.0% |
Occupancy by Household Size in Garfield County
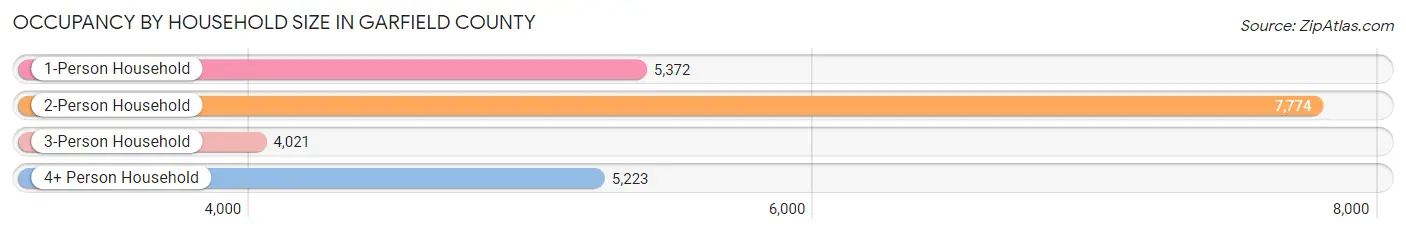
| Household Size | # Housing Units | % Housing Units |
| 1-Person Household | 5,372 | 24.0% |
| 2-Person Household | 7,774 | 34.7% |
| 3-Person Household | 4,021 | 18.0% |
| 4+ Person Household | 5,223 | 23.3% |
| Total Housing Units | 22,390 | 100.0% |
Occupancy by Ownership by Household Size in Garfield County
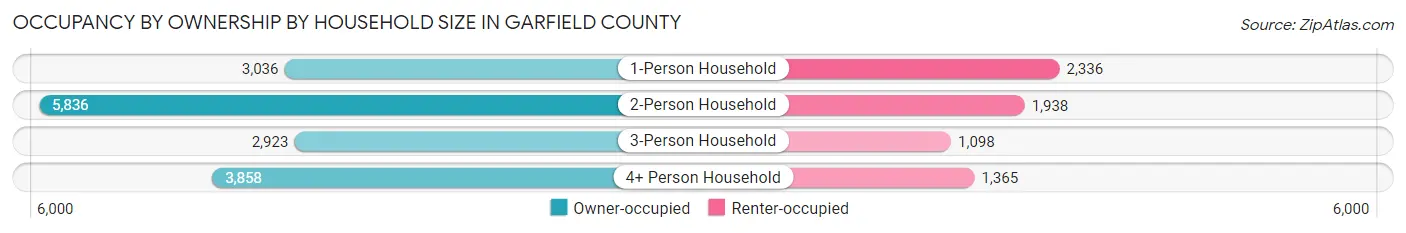
| Household Size | Owner-occupied | Renter-occupied |
| 1-Person Household | 3,036 (56.5%) | 2,336 (43.5%) |
| 2-Person Household | 5,836 (75.1%) | 1,938 (24.9%) |
| 3-Person Household | 2,923 (72.7%) | 1,098 (27.3%) |
| 4+ Person Household | 3,858 (73.9%) | 1,365 (26.1%) |
| Total Housing Units | 15,653 (69.9%) | 6,737 (30.1%) |
Occupancy by Educational Attainment in Garfield County
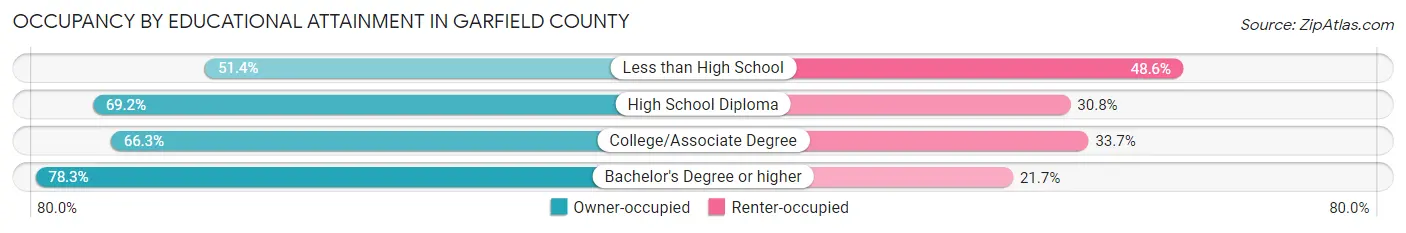
| Household Size | Owner-occupied | Renter-occupied |
| Less than High School | 1,095 (51.4%) | 1,037 (48.6%) |
| High School Diploma | 3,403 (69.2%) | 1,515 (30.8%) |
| College/Associate Degree | 4,740 (66.3%) | 2,407 (33.7%) |
| Bachelor's Degree or higher | 6,415 (78.3%) | 1,778 (21.7%) |
Occupancy by Age of Householder in Garfield County
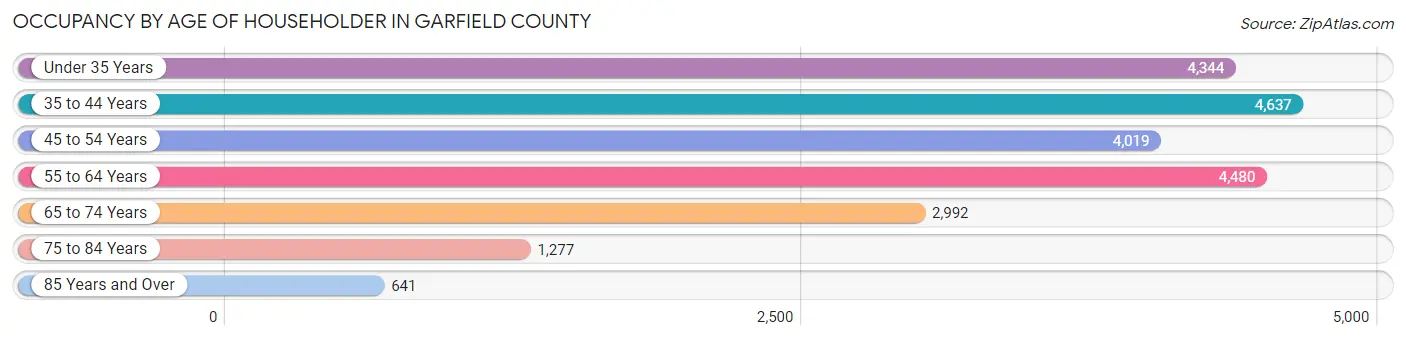
| Age Bracket | # Households | % Households |
| Under 35 Years | 4,344 | 19.4% |
| 35 to 44 Years | 4,637 | 20.7% |
| 45 to 54 Years | 4,019 | 17.9% |
| 55 to 64 Years | 4,480 | 20.0% |
| 65 to 74 Years | 2,992 | 13.4% |
| 75 to 84 Years | 1,277 | 5.7% |
| 85 Years and Over | 641 | 2.9% |
| Total | 22,390 | 100.0% |
Housing Finances in Garfield County
Median Income by Occupancy in Garfield County
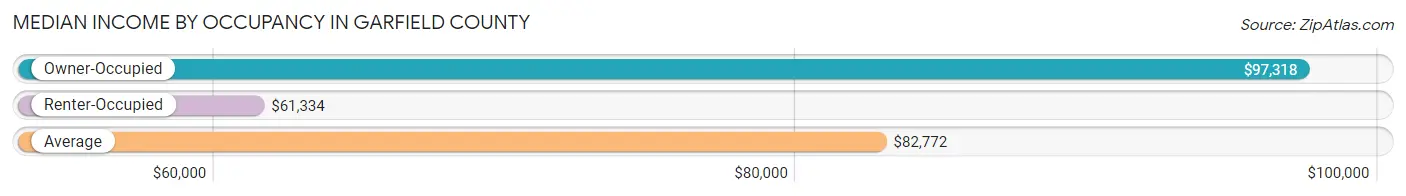
| Occupancy Type | # Households | Median Income |
| Owner-Occupied | 15,653 (69.9%) | $97,318 |
| Renter-Occupied | 6,737 (30.1%) | $61,334 |
| Average | 22,390 (100.0%) | $82,772 |
Occupancy by Householder Income Bracket in Garfield County
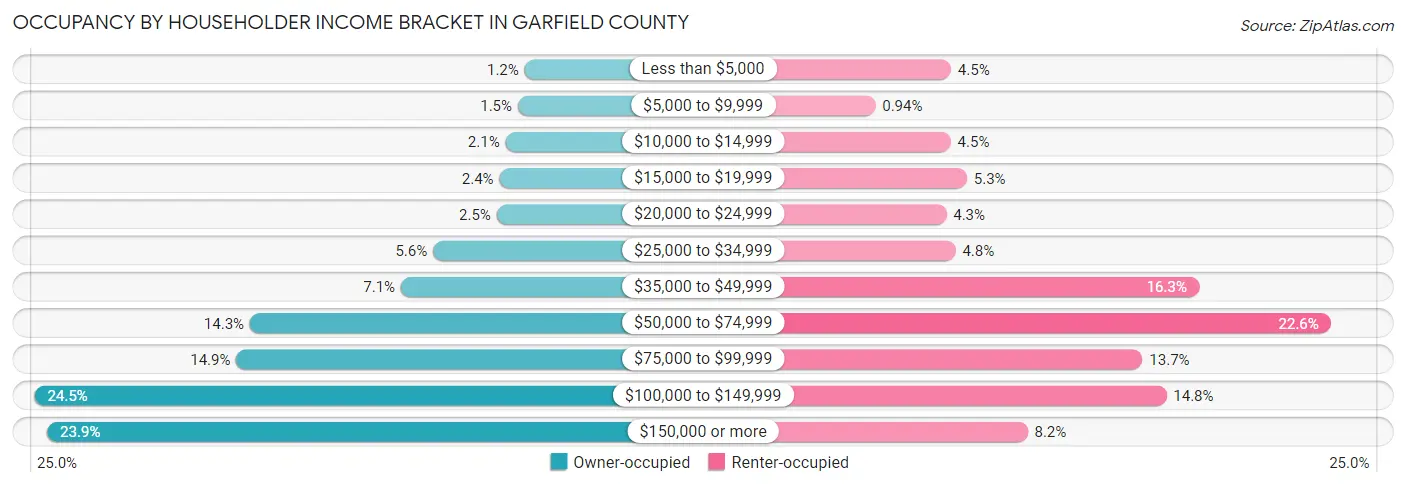
| Income Bracket | Owner-occupied | Renter-occupied |
| Less than $5,000 | 187 (1.2%) | 306 (4.5%) |
| $5,000 to $9,999 | 237 (1.5%) | 63 (0.9%) |
| $10,000 to $14,999 | 328 (2.1%) | 305 (4.5%) |
| $15,000 to $19,999 | 374 (2.4%) | 357 (5.3%) |
| $20,000 to $24,999 | 395 (2.5%) | 291 (4.3%) |
| $25,000 to $34,999 | 869 (5.6%) | 321 (4.8%) |
| $35,000 to $49,999 | 1,109 (7.1%) | 1,101 (16.3%) |
| $50,000 to $74,999 | 2,234 (14.3%) | 1,524 (22.6%) |
| $75,000 to $99,999 | 2,336 (14.9%) | 920 (13.7%) |
| $100,000 to $149,999 | 3,839 (24.5%) | 997 (14.8%) |
| $150,000 or more | 3,745 (23.9%) | 552 (8.2%) |
| Total | 15,653 (100.0%) | 6,737 (100.0%) |
Monthly Housing Cost Tiers in Garfield County
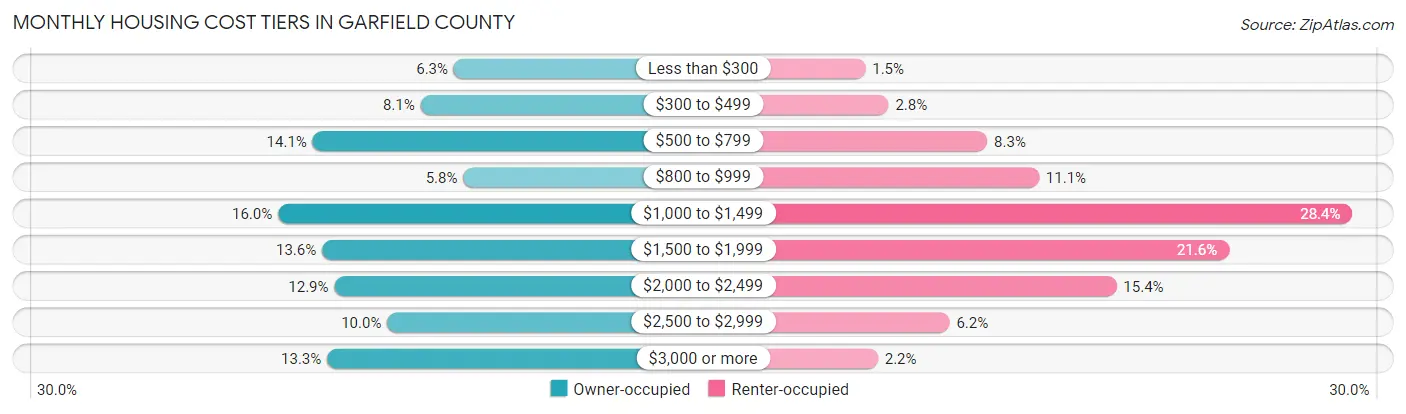
| Monthly Cost | Owner-occupied | Renter-occupied |
| Less than $300 | 984 (6.3%) | 104 (1.5%) |
| $300 to $499 | 1,273 (8.1%) | 190 (2.8%) |
| $500 to $799 | 2,205 (14.1%) | 557 (8.3%) |
| $800 to $999 | 903 (5.8%) | 750 (11.1%) |
| $1,000 to $1,499 | 2,505 (16.0%) | 1,916 (28.4%) |
| $1,500 to $1,999 | 2,124 (13.6%) | 1,457 (21.6%) |
| $2,000 to $2,499 | 2,017 (12.9%) | 1,038 (15.4%) |
| $2,500 to $2,999 | 1,561 (10.0%) | 417 (6.2%) |
| $3,000 or more | 2,081 (13.3%) | 150 (2.2%) |
| Total | 15,653 (100.0%) | 6,737 (100.0%) |
Physical Housing Characteristics in Garfield County
Housing Structures in Garfield County
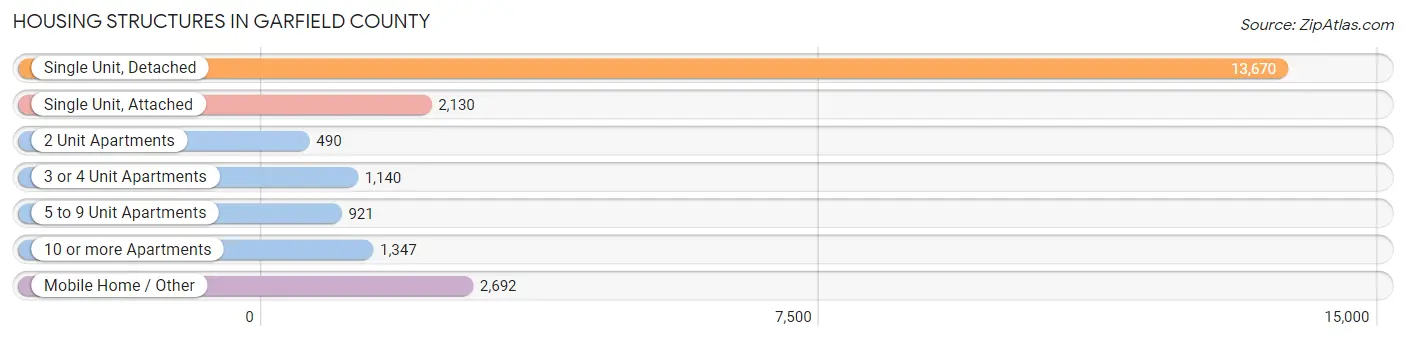
| Structure Type | # Housing Units | % Housing Units |
| Single Unit, Detached | 13,670 | 61.1% |
| Single Unit, Attached | 2,130 | 9.5% |
| 2 Unit Apartments | 490 | 2.2% |
| 3 or 4 Unit Apartments | 1,140 | 5.1% |
| 5 to 9 Unit Apartments | 921 | 4.1% |
| 10 or more Apartments | 1,347 | 6.0% |
| Mobile Home / Other | 2,692 | 12.0% |
| Total | 22,390 | 100.0% |
Housing Structures by Occupancy in Garfield County
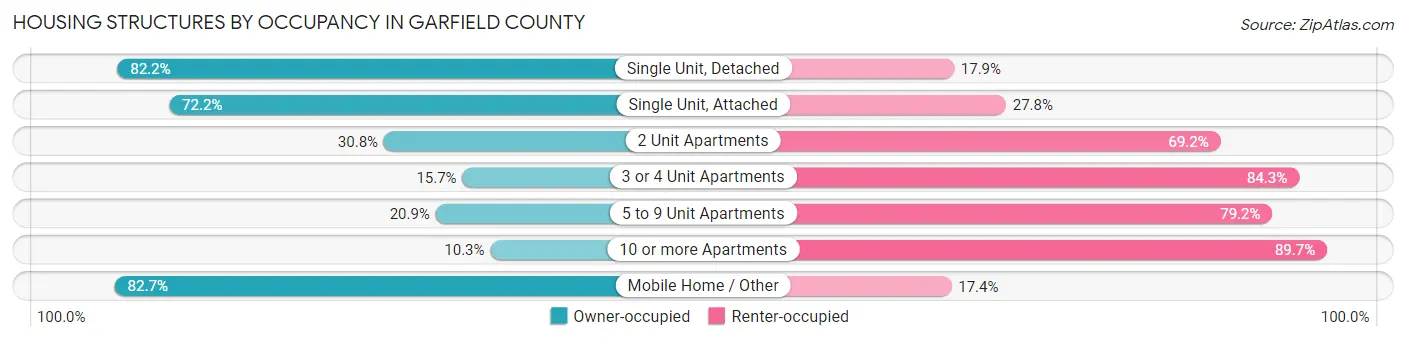
| Structure Type | Owner-occupied | Renter-occupied |
| Single Unit, Detached | 11,230 (82.2%) | 2,440 (17.8%) |
| Single Unit, Attached | 1,537 (72.2%) | 593 (27.8%) |
| 2 Unit Apartments | 151 (30.8%) | 339 (69.2%) |
| 3 or 4 Unit Apartments | 179 (15.7%) | 961 (84.3%) |
| 5 to 9 Unit Apartments | 192 (20.8%) | 729 (79.1%) |
| 10 or more Apartments | 139 (10.3%) | 1,208 (89.7%) |
| Mobile Home / Other | 2,225 (82.7%) | 467 (17.3%) |
| Total | 15,653 (69.9%) | 6,737 (30.1%) |
Housing Structures by Number of Rooms in Garfield County
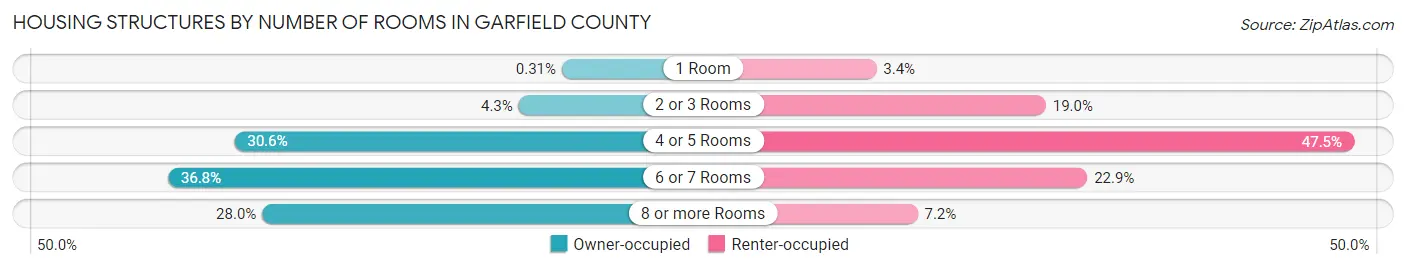
| Number of Rooms | Owner-occupied | Renter-occupied |
| 1 Room | 48 (0.3%) | 227 (3.4%) |
| 2 or 3 Rooms | 675 (4.3%) | 1,283 (19.0%) |
| 4 or 5 Rooms | 4,790 (30.6%) | 3,202 (47.5%) |
| 6 or 7 Rooms | 5,753 (36.7%) | 1,541 (22.9%) |
| 8 or more Rooms | 4,387 (28.0%) | 484 (7.2%) |
| Total | 15,653 (100.0%) | 6,737 (100.0%) |
Housing Structure by Heating Type in Garfield County
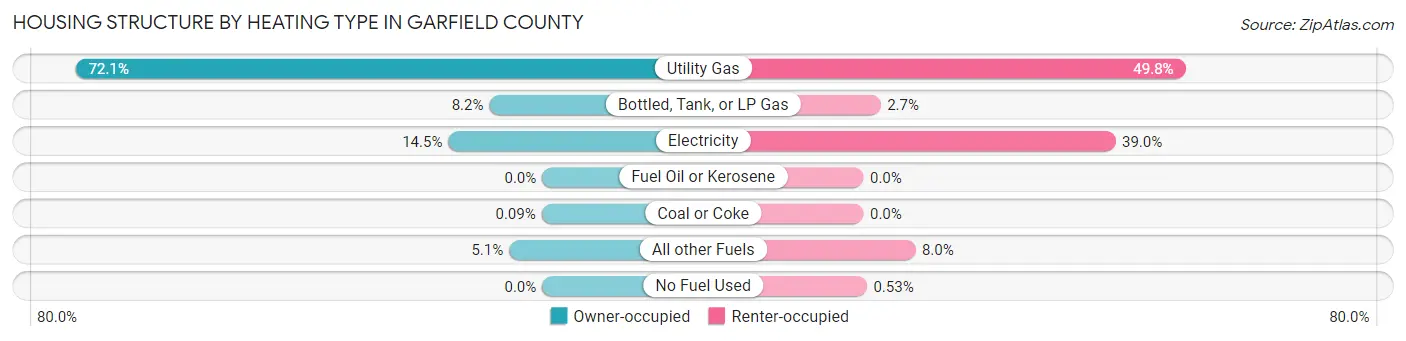
| Heating Type | Owner-occupied | Renter-occupied |
| Utility Gas | 11,291 (72.1%) | 3,357 (49.8%) |
| Bottled, Tank, or LP Gas | 1,277 (8.2%) | 179 (2.7%) |
| Electricity | 2,271 (14.5%) | 2,624 (39.0%) |
| Fuel Oil or Kerosene | 0 (0.0%) | 0 (0.0%) |
| Coal or Coke | 14 (0.1%) | 0 (0.0%) |
| All other Fuels | 800 (5.1%) | 541 (8.0%) |
| No Fuel Used | 0 (0.0%) | 36 (0.5%) |
| Total | 15,653 (100.0%) | 6,737 (100.0%) |
Household Vehicle Usage in Garfield County
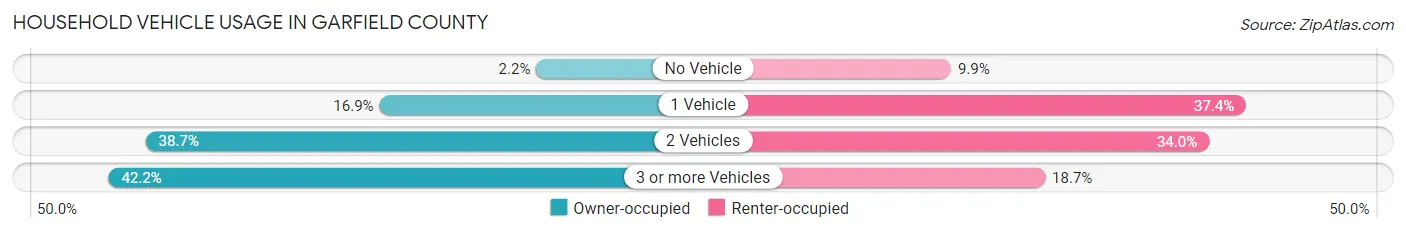
| Vehicles per Household | Owner-occupied | Renter-occupied |
| No Vehicle | 351 (2.2%) | 667 (9.9%) |
| 1 Vehicle | 2,643 (16.9%) | 2,522 (37.4%) |
| 2 Vehicles | 6,058 (38.7%) | 2,289 (34.0%) |
| 3 or more Vehicles | 6,601 (42.2%) | 1,259 (18.7%) |
| Total | 15,653 (100.0%) | 6,737 (100.0%) |
Real Estate & Mortgages in Garfield County
Real Estate and Mortgage Overview in Garfield County
| Characteristic | Without Mortgage | With Mortgage |
| Housing Units | 5,387 | 10,266 |
| Median Property Value | $375,600 | $471,000 |
| Median Household Income | $70,411 | $2,840 |
| Monthly Housing Costs | $563 | $2,056 |
| Real Estate Taxes | $1,631 | $314 |
Property Value by Mortgage Status in Garfield County
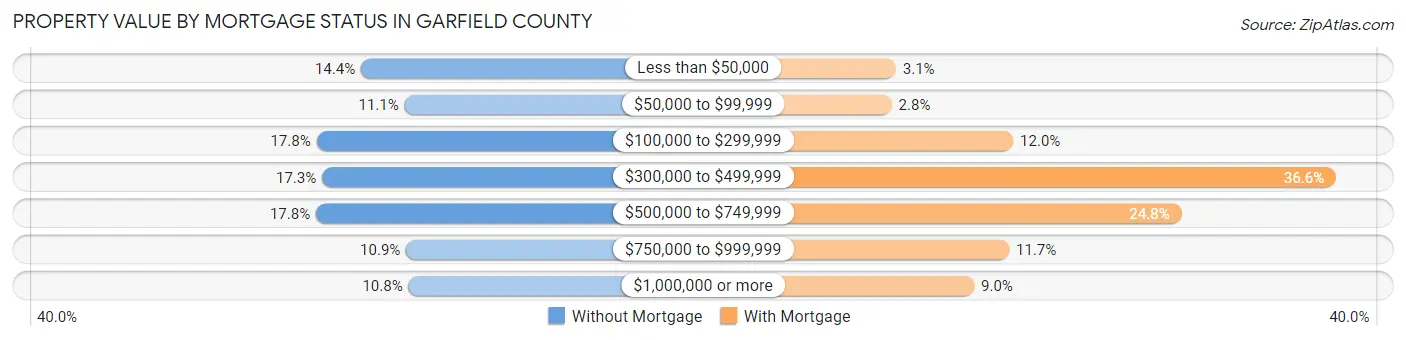
| Property Value | Without Mortgage | With Mortgage |
| Less than $50,000 | 774 (14.4%) | 315 (3.1%) |
| $50,000 to $99,999 | 595 (11.1%) | 282 (2.8%) |
| $100,000 to $299,999 | 957 (17.8%) | 1,233 (12.0%) |
| $300,000 to $499,999 | 934 (17.3%) | 3,758 (36.6%) |
| $500,000 to $749,999 | 959 (17.8%) | 2,550 (24.8%) |
| $750,000 to $999,999 | 589 (10.9%) | 1,201 (11.7%) |
| $1,000,000 or more | 579 (10.7%) | 927 (9.0%) |
| Total | 5,387 (100.0%) | 10,266 (100.0%) |
Household Income by Mortgage Status in Garfield County
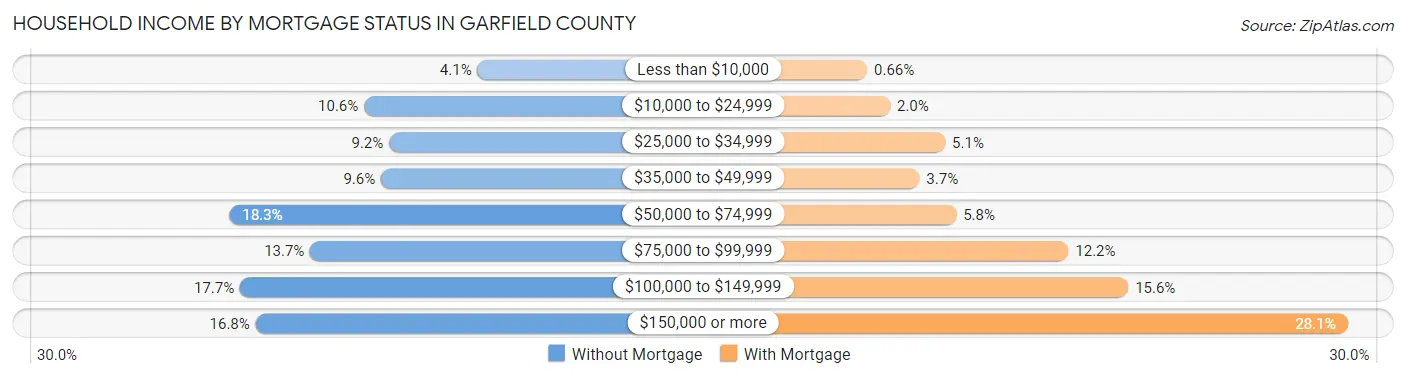
| Household Income | Without Mortgage | With Mortgage |
| Less than $10,000 | 222 (4.1%) | 68 (0.7%) |
| $10,000 to $24,999 | 571 (10.6%) | 202 (2.0%) |
| $25,000 to $34,999 | 494 (9.2%) | 526 (5.1%) |
| $35,000 to $49,999 | 519 (9.6%) | 375 (3.6%) |
| $50,000 to $74,999 | 986 (18.3%) | 590 (5.8%) |
| $75,000 to $99,999 | 737 (13.7%) | 1,248 (12.2%) |
| $100,000 to $149,999 | 953 (17.7%) | 1,599 (15.6%) |
| $150,000 or more | 905 (16.8%) | 2,886 (28.1%) |
| Total | 5,387 (100.0%) | 10,266 (100.0%) |
Property Value to Household Income Ratio in Garfield County
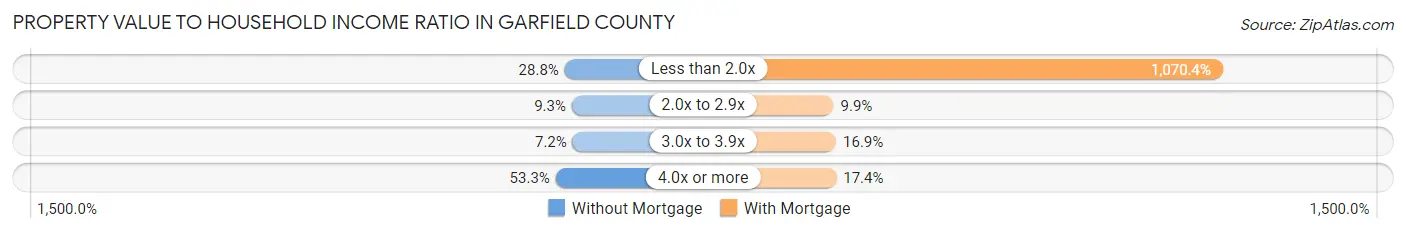
| Value-to-Income Ratio | Without Mortgage | With Mortgage |
| Less than 2.0x | 1,550 (28.8%) | 109,885 (1,070.4%) |
| 2.0x to 2.9x | 500 (9.3%) | 1,018 (9.9%) |
| 3.0x to 3.9x | 386 (7.2%) | 1,733 (16.9%) |
| 4.0x or more | 2,872 (53.3%) | 1,783 (17.4%) |
| Total | 5,387 (100.0%) | 10,266 (100.0%) |
Real Estate Taxes by Mortgage Status in Garfield County
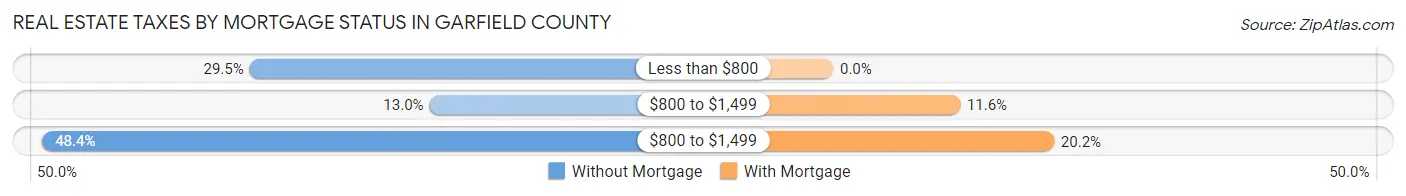
| Property Taxes | Without Mortgage | With Mortgage |
| Less than $800 | 1,587 (29.5%) | 0 (0.0%) |
| $800 to $1,499 | 702 (13.0%) | 1,190 (11.6%) |
| $800 to $1,499 | 2,607 (48.4%) | 2,071 (20.2%) |
| Total | 5,387 (100.0%) | 10,266 (100.0%) |
Health & Disability in Garfield County
Health Insurance Coverage by Age in Garfield County
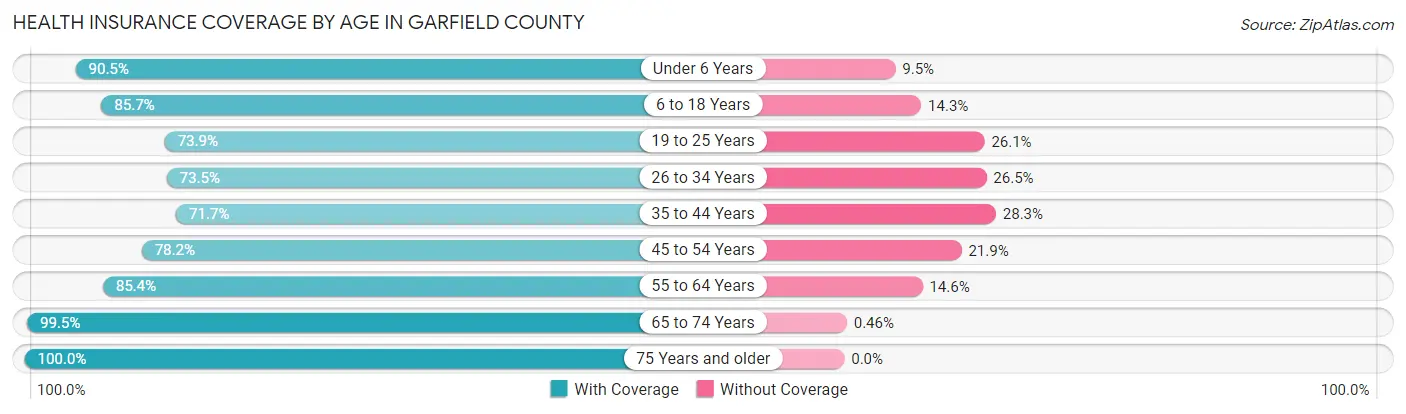
| Age Bracket | With Coverage | Without Coverage |
| Under 6 Years | 4,456 (90.5%) | 469 (9.5%) |
| 6 to 18 Years | 9,635 (85.7%) | 1,612 (14.3%) |
| 19 to 25 Years | 3,577 (73.9%) | 1,266 (26.1%) |
| 26 to 34 Years | 5,544 (73.5%) | 1,999 (26.5%) |
| 35 to 44 Years | 6,279 (71.7%) | 2,473 (28.3%) |
| 45 to 54 Years | 5,986 (78.1%) | 1,674 (21.8%) |
| 55 to 64 Years | 6,747 (85.4%) | 1,152 (14.6%) |
| 65 to 74 Years | 5,419 (99.5%) | 25 (0.5%) |
| 75 Years and older | 2,761 (100.0%) | 0 (0.0%) |
| Total | 50,404 (82.5%) | 10,670 (17.5%) |
Health Insurance Coverage by Citizenship Status in Garfield County
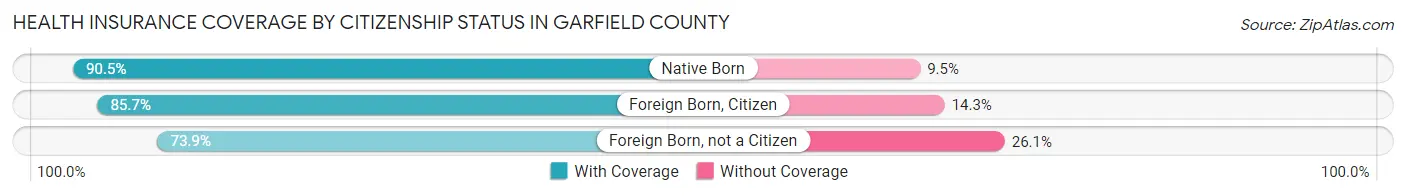
| Citizenship Status | With Coverage | Without Coverage |
| Native Born | 4,456 (90.5%) | 469 (9.5%) |
| Foreign Born, Citizen | 9,635 (85.7%) | 1,612 (14.3%) |
| Foreign Born, not a Citizen | 3,577 (73.9%) | 1,266 (26.1%) |
Health Insurance Coverage by Household Income in Garfield County
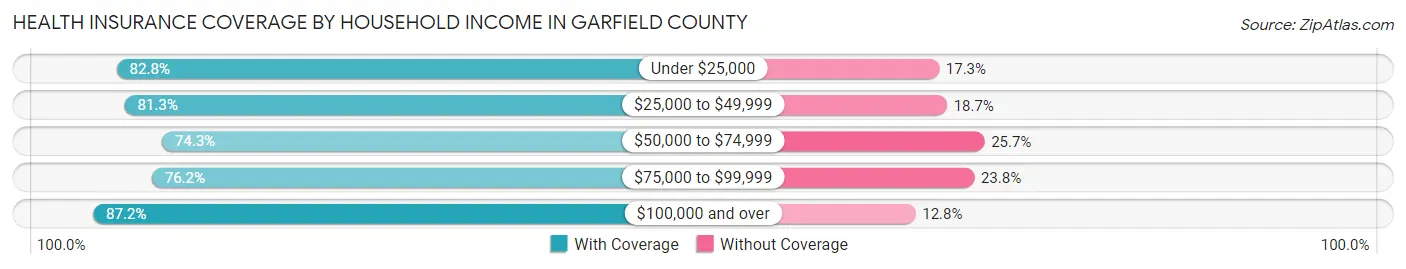
| Household Income | With Coverage | Without Coverage |
| Under $25,000 | 4,030 (82.8%) | 840 (17.2%) |
| $25,000 to $49,999 | 5,734 (81.3%) | 1,321 (18.7%) |
| $50,000 to $74,999 | 7,273 (74.3%) | 2,521 (25.7%) |
| $75,000 to $99,999 | 6,816 (76.2%) | 2,132 (23.8%) |
| $100,000 and over | 26,130 (87.2%) | 3,850 (12.8%) |
Public vs Private Health Insurance Coverage by Age in Garfield County
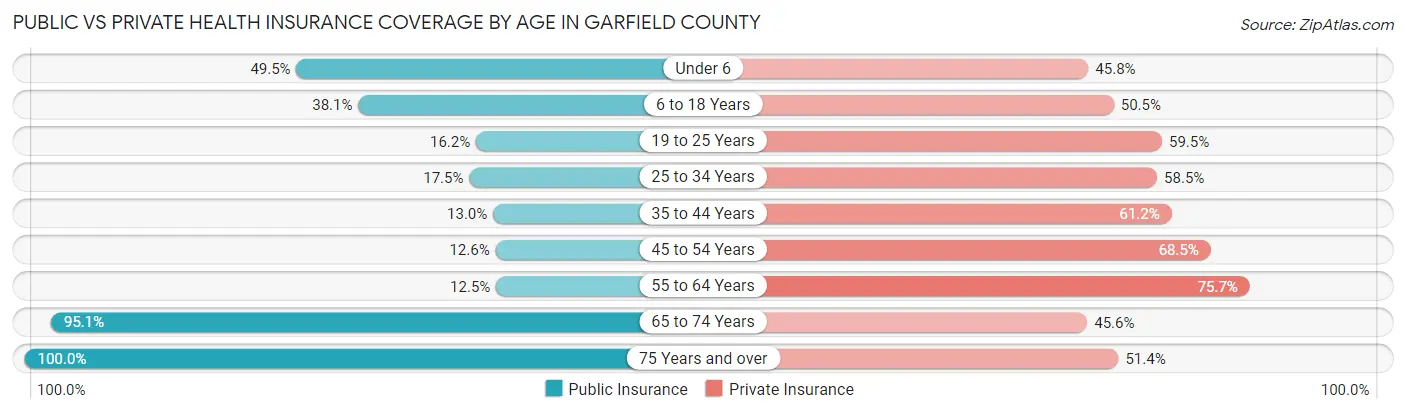
| Age Bracket | Public Insurance | Private Insurance |
| Under 6 | 2,440 (49.5%) | 2,254 (45.8%) |
| 6 to 18 Years | 4,281 (38.1%) | 5,677 (50.5%) |
| 19 to 25 Years | 785 (16.2%) | 2,879 (59.5%) |
| 25 to 34 Years | 1,317 (17.5%) | 4,416 (58.5%) |
| 35 to 44 Years | 1,141 (13.0%) | 5,356 (61.2%) |
| 45 to 54 Years | 965 (12.6%) | 5,245 (68.5%) |
| 55 to 64 Years | 985 (12.5%) | 5,980 (75.7%) |
| 65 to 74 Years | 5,179 (95.1%) | 2,481 (45.6%) |
| 75 Years and over | 2,761 (100.0%) | 1,418 (51.4%) |
| Total | 19,854 (32.5%) | 35,706 (58.5%) |
Disability Status by Sex by Age in Garfield County
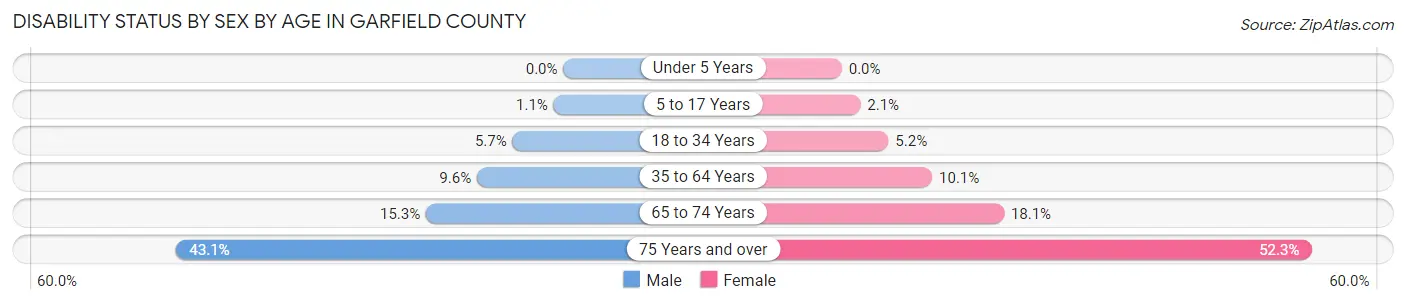
| Age Bracket | Male | Female |
| Under 5 Years | 0 (0.0%) | 0 (0.0%) |
| 5 to 17 Years | 62 (1.1%) | 113 (2.1%) |
| 18 to 34 Years | 395 (5.7%) | 332 (5.2%) |
| 35 to 64 Years | 1,222 (9.6%) | 1,168 (10.1%) |
| 65 to 74 Years | 420 (15.3%) | 487 (18.1%) |
| 75 Years and over | 508 (43.1%) | 827 (52.3%) |
Disability Class by Sex by Age in Garfield County
Disability Class: Hearing Difficulty
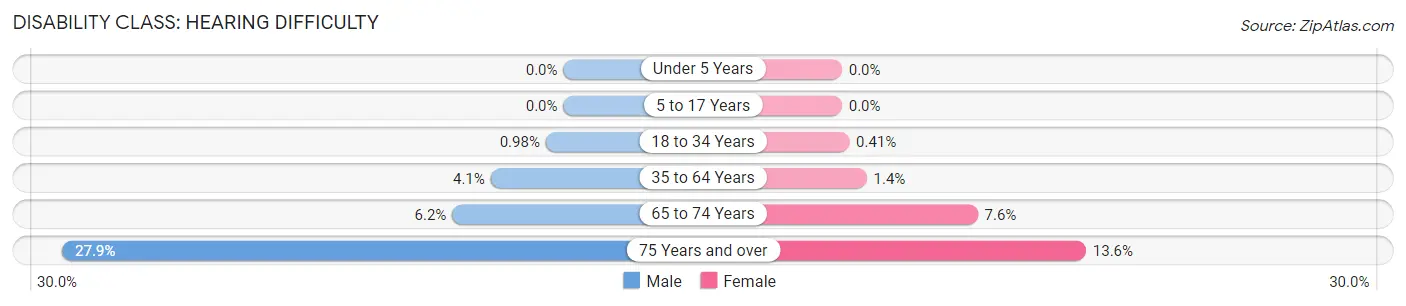
| Age Bracket | Male | Female |
| Under 5 Years | 0 (0.0%) | 0 (0.0%) |
| 5 to 17 Years | 0 (0.0%) | 0 (0.0%) |
| 18 to 34 Years | 68 (1.0%) | 26 (0.4%) |
| 35 to 64 Years | 514 (4.1%) | 160 (1.4%) |
| 65 to 74 Years | 170 (6.2%) | 204 (7.6%) |
| 75 Years and over | 329 (27.9%) | 215 (13.6%) |
Disability Class: Vision Difficulty
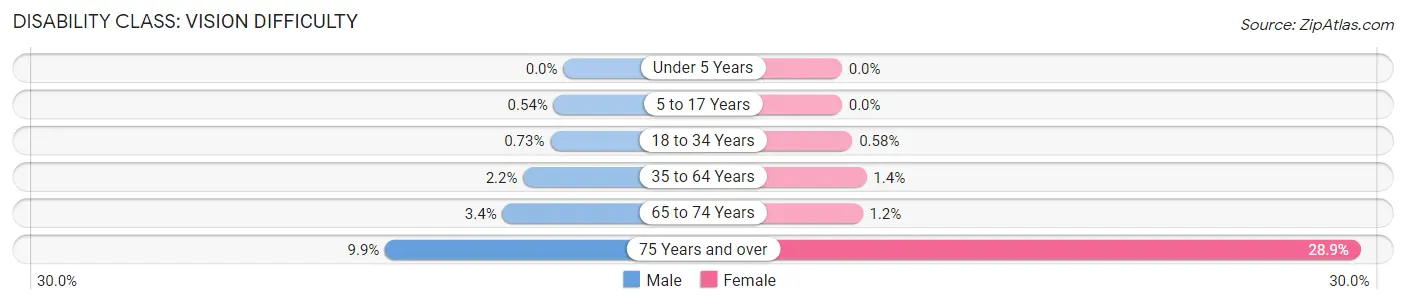
| Age Bracket | Male | Female |
| Under 5 Years | 0 (0.0%) | 0 (0.0%) |
| 5 to 17 Years | 31 (0.5%) | 0 (0.0%) |
| 18 to 34 Years | 51 (0.7%) | 37 (0.6%) |
| 35 to 64 Years | 283 (2.2%) | 159 (1.4%) |
| 65 to 74 Years | 93 (3.4%) | 31 (1.1%) |
| 75 Years and over | 117 (9.9%) | 457 (28.9%) |
Disability Class: Cognitive Difficulty
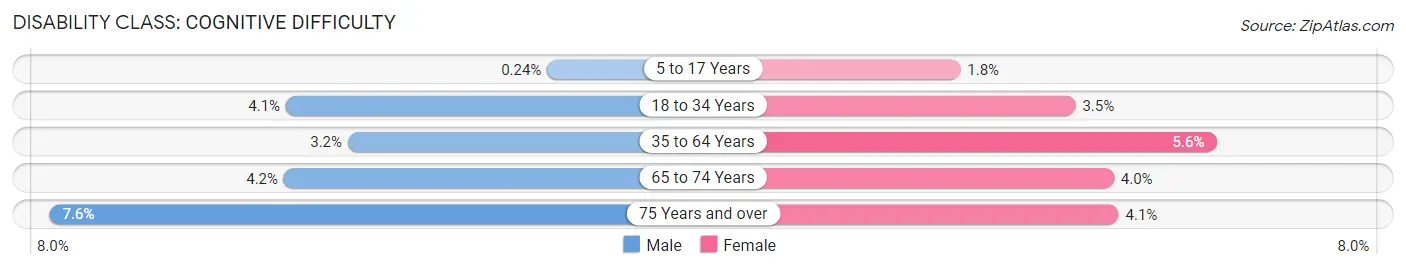
| Age Bracket | Male | Female |
| 5 to 17 Years | 14 (0.2%) | 96 (1.8%) |
| 18 to 34 Years | 287 (4.1%) | 222 (3.5%) |
| 35 to 64 Years | 406 (3.2%) | 646 (5.6%) |
| 65 to 74 Years | 114 (4.2%) | 109 (4.0%) |
| 75 Years and over | 90 (7.6%) | 65 (4.1%) |
Disability Class: Ambulatory Difficulty
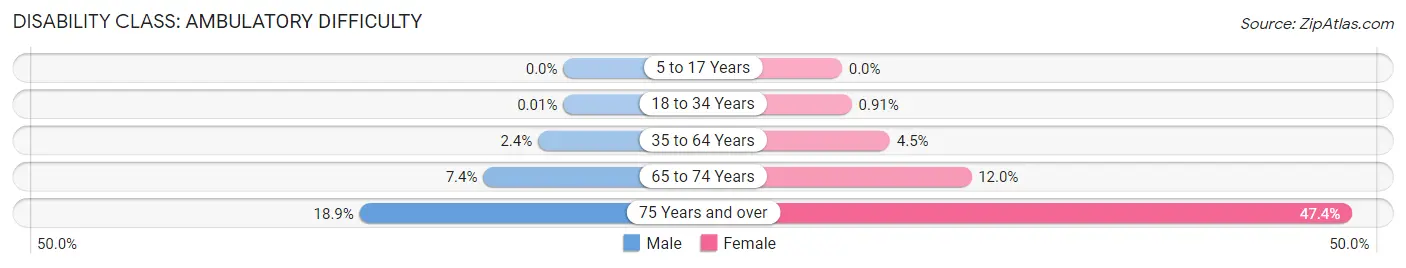
| Age Bracket | Male | Female |
| 5 to 17 Years | 0 (0.0%) | 0 (0.0%) |
| 18 to 34 Years | 1 (0.0%) | 58 (0.9%) |
| 35 to 64 Years | 298 (2.4%) | 518 (4.5%) |
| 65 to 74 Years | 204 (7.4%) | 324 (12.0%) |
| 75 Years and over | 223 (18.9%) | 749 (47.3%) |
Disability Class: Self-Care Difficulty
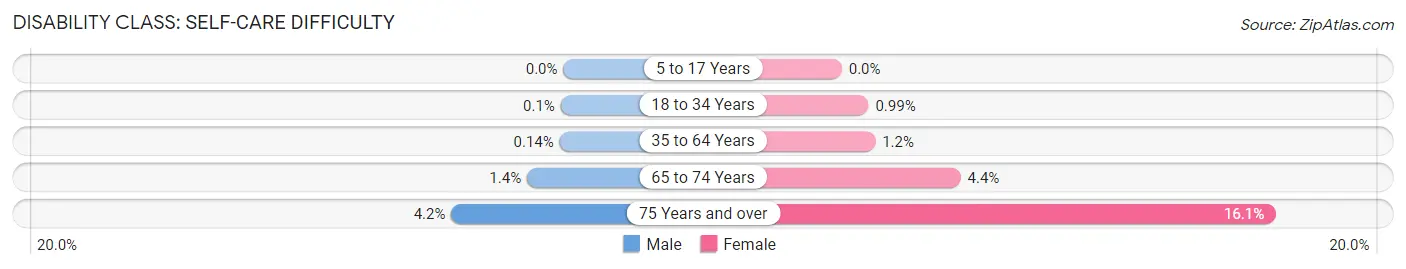
| Age Bracket | Male | Female |
| 5 to 17 Years | 0 (0.0%) | 0 (0.0%) |
| 18 to 34 Years | 7 (0.1%) | 63 (1.0%) |
| 35 to 64 Years | 18 (0.1%) | 144 (1.2%) |
| 65 to 74 Years | 37 (1.3%) | 119 (4.4%) |
| 75 Years and over | 49 (4.2%) | 255 (16.1%) |
Technology Access in Garfield County
Computing Device Access in Garfield County
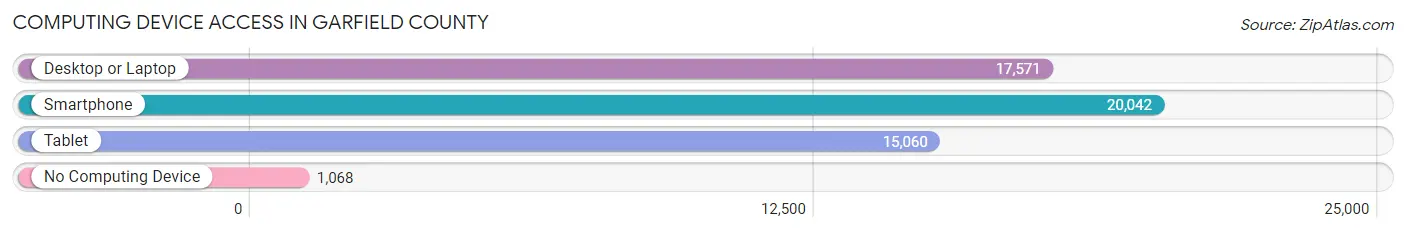
| Device Type | # Households | % Households |
| Desktop or Laptop | 17,571 | 78.5% |
| Smartphone | 20,042 | 89.5% |
| Tablet | 15,060 | 67.3% |
| No Computing Device | 1,068 | 4.8% |
| Total | 22,390 | 100.0% |
Internet Access in Garfield County
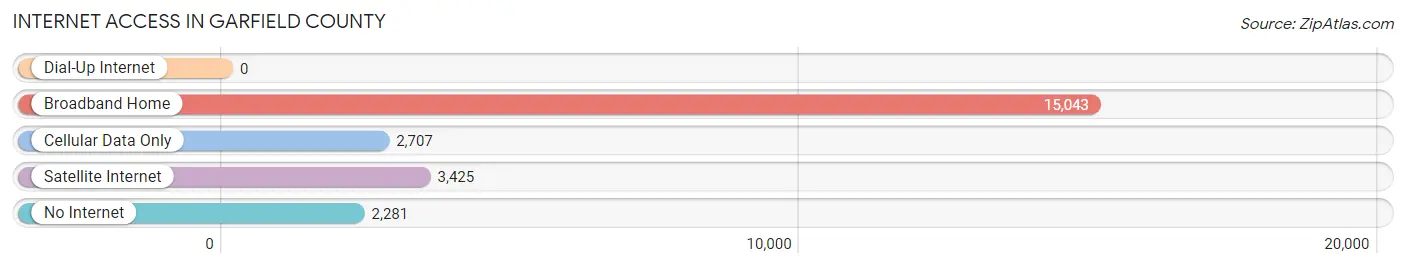
| Internet Type | # Households | % Households |
| Dial-Up Internet | 0 | 0.0% |
| Broadband Home | 15,043 | 67.2% |
| Cellular Data Only | 2,707 | 12.1% |
| Satellite Internet | 3,425 | 15.3% |
| No Internet | 2,281 | 10.2% |
| Total | 22,390 | 100.0% |
Garfield County Summary
Garfield County is located in the western part of the state of Colorado, and is one of the 64 counties in the state. It is bordered by Eagle County to the north, Pitkin County to the east, Mesa County to the south, and Rio Blanco County to the west. The county seat is Glenwood Springs, and the largest city is Rifle. The county was named after James A. Garfield, the 20th President of the United States.
Geography
Garfield County covers an area of 2,956 square miles, making it the seventh largest county in Colorado. The county is located in the Rocky Mountains, and is home to several mountain ranges, including the Flat Tops, the Elk Mountains, and the Roan Plateau. The county is also home to several rivers, including the Colorado River, the Roaring Fork River, and the Eagle River. The highest point in the county is Mount Sopris, which has an elevation of 12,953 feet.
The county is divided into two distinct regions: the western portion is mostly mountainous, while the eastern portion is mostly flat. The western portion is home to the Flat Tops Wilderness Area, which is a popular destination for hikers, campers, and other outdoor enthusiasts. The eastern portion is home to the Colorado River Valley, which is known for its agricultural production.
Climate
Garfield County has a semi-arid climate, with hot summers and cold winters. The average annual temperature is around 50 degrees Fahrenheit, and the average annual precipitation is around 16 inches. The county is also prone to extreme weather, including heavy snowfall in the winter and severe thunderstorms in the summer.
Demographics
As of the 2010 census, Garfield County had a population of 56,389. The population is spread out, with the largest city, Rifle, having a population of 9,172. The county is predominantly white, with 87.3% of the population identifying as white. The next largest racial group is Hispanic or Latino, which makes up 8.2% of the population. The median household income in the county is $54,845, and the median home value is $269,400.
Economy
Garfield County is home to a diverse economy, with a variety of industries providing employment opportunities. The largest industry in the county is tourism, which is driven by the county's proximity to the Rocky Mountains and its many outdoor recreational opportunities. Other major industries include agriculture, energy, and manufacturing. The county is also home to several major employers, including the Garfield County School District, the Garfield County Sheriff's Office, and the Garfield County Airport.
Garfield County is also home to several major energy companies, including EnCana, Anadarko Petroleum, and Williams Companies. These companies are responsible for the majority of the county's energy production, and are major contributors to the local economy.
Conclusion
Garfield County is a diverse and vibrant county located in the western part of Colorado. The county is home to a variety of industries, including tourism, agriculture, energy, and manufacturing. The county is also home to several major employers, and is a major contributor to the state's economy. The county is also home to a variety of outdoor recreational opportunities, making it a popular destination for tourists and outdoor enthusiasts.
Common Questions
What is the Total Population of Garfield County?
Total Population of Garfield County is 61,683.
What is the Total Male Population of Garfield County?
Total Male Population of Garfield County is 31,693.
What is the Total Female Population of Garfield County?
Total Female Population of Garfield County is 29,990.
What is the Ratio of Males per 100 Females in Garfield County?
There are 105.68 Males per 100 Females in Garfield County.
What is the Ratio of Females per 100 Males in Garfield County?
There are 94.63 Females per 100 Males in Garfield County.
What is the Median Population Age in Garfield County?
Median Population Age in Garfield County is 37.2 Years.
What is the Average Family Size in Garfield County
Average Family Size in Garfield County is 3.2 People.
What is the Average Household Size in Garfield County
Average Household Size in Garfield County is 2.7 People.
What is Per Capita Income in Garfield County?
Per Capita income in Garfield County is $39,024.
What is the Median Family Income in Garfield County?
Median Family Income in Garfield County is $96,416.
What is the Median Household income in Garfield County?
Median Household Income in Garfield County is $82,772.
What is Income or Wage Gap in Garfield County?
Income or Wage Gap in Garfield County is 26.8%.
Women in Garfield County earn 73.2 cents for every dollar earned by a man.
What is Family Income Deficit in Garfield County?
Family Income Deficit in Garfield County is $11,416.
Families that are below poverty line in Garfield County earn $11,416 less on average than the poverty threshold level.
What is Inequality or Gini Index in Garfield County?
Inequality or Gini Index in Garfield County is 0.42.
How Large is the Labor Force in Garfield County?
There are 35,165 People in the Labor Forcein in Garfield County.
What is the Percentage of People in the Labor Force in Garfield County?
73.0% of People are in the Labor Force in Garfield County.
What is the Unemployment Rate in Garfield County?
Unemployment Rate in Garfield County is 3.2%.