Fremont County, CO
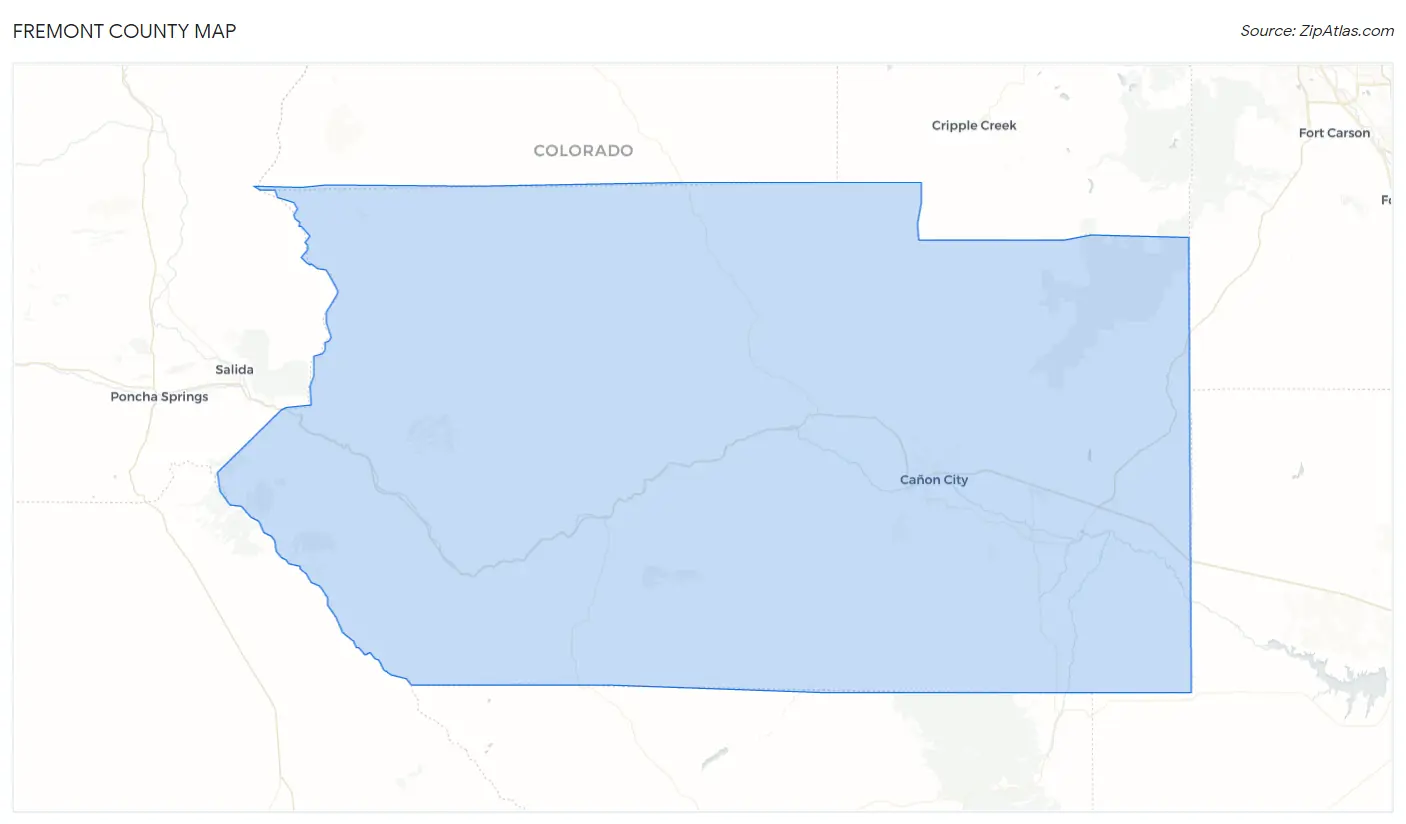
Fremont County Map
Fremont County Overview
49,107
TOTAL POPULATION
28,582
MALE POPULATION
20,525
FEMALE POPULATION
139.25
MALES / 100 FEMALES
71.81
FEMALES / 100 MALES
44.9
MEDIAN AGE
2.8
AVG FAMILY SIZE
2.3
AVG HOUSEHOLD SIZE
$28,224
PER CAPITA INCOME
$73,966
AVG FAMILY INCOME
$56,165
AVG HOUSEHOLD INCOME
25.4%
WAGE / INCOME GAP [ % ]
74.6¢/ $1
WAGE / INCOME GAP [ $ ]
$8,960
FAMILY INCOME DEFICIT
0.47
INEQUALITY / GINI INDEX
17,805
LABOR FORCE [ PEOPLE ]
42.3%
PERCENT IN LABOR FORCE
4.8%
UNEMPLOYMENT RATE
Fremont County Area Codes
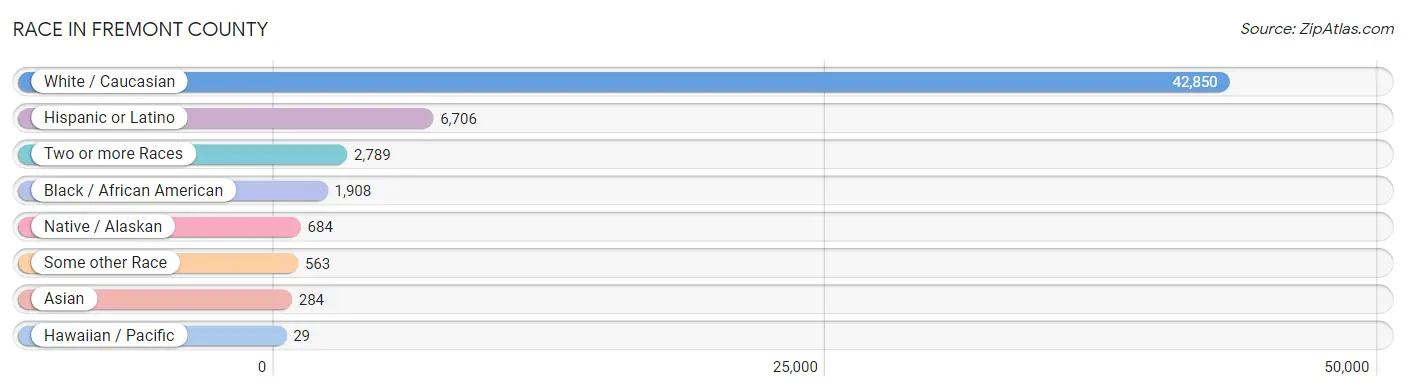
Race in Fremont County
The most populous races in Fremont County are White / Caucasian (42,850 | 87.3%), Hispanic or Latino (6,706 | 13.7%), and Two or more Races (2,789 | 5.7%).
| Race | # Population | % Population |
| Asian | 284 | 0.6% |
| Black / African American | 1,908 | 3.9% |
| Hawaiian / Pacific | 29 | 0.1% |
| Hispanic or Latino | 6,706 | 13.7% |
| Native / Alaskan | 684 | 1.4% |
| White / Caucasian | 42,850 | 87.3% |
| Two or more Races | 2,789 | 5.7% |
| Some other Race | 563 | 1.1% |
| Total | 49,107 | 100.0% |
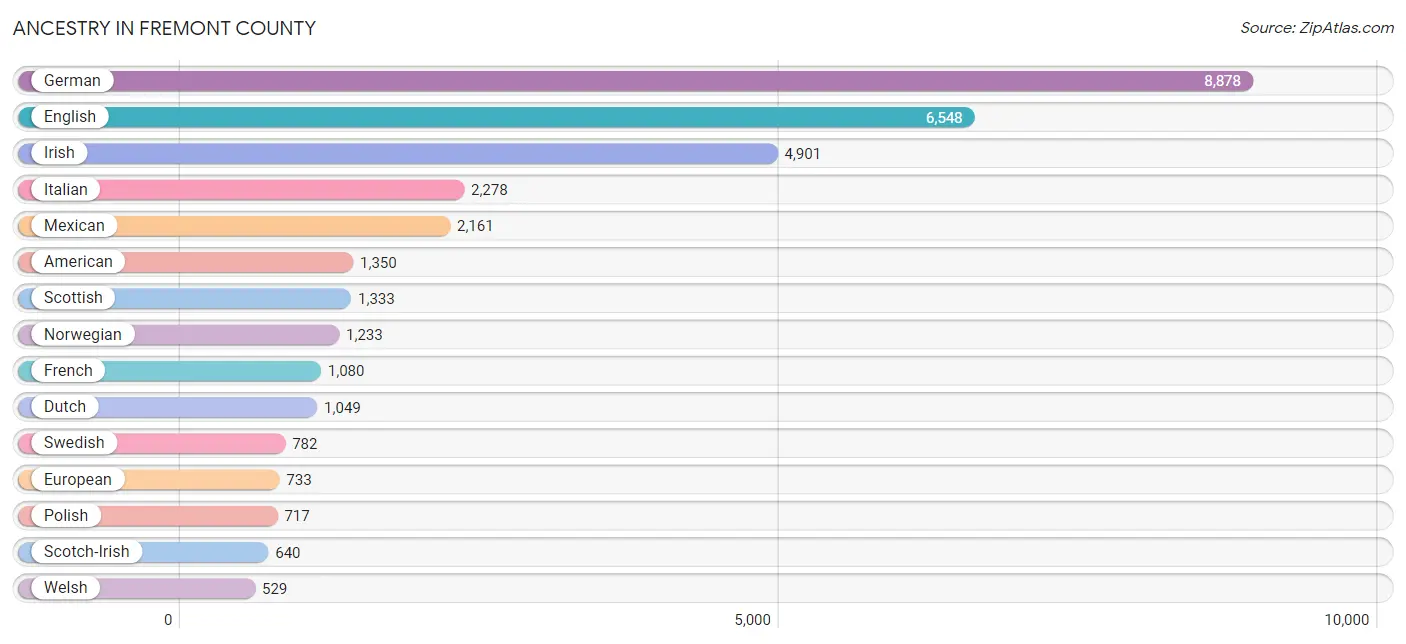
Ancestry in Fremont County
The most populous ancestries reported in Fremont County are German (8,878 | 18.1%), English (6,548 | 13.3%), Irish (4,901 | 10.0%), Italian (2,278 | 4.6%), and Mexican (2,161 | 4.4%), together accounting for 50.4% of all Fremont County residents.
| Ancestry | # Population | % Population |
| African | 50 | 0.1% |
| American | 1,350 | 2.8% |
| Apache | 10 | 0.0% |
| Arab | 138 | 0.3% |
| Arapaho | 2 | 0.0% |
| Armenian | 14 | 0.0% |
| Austrian | 125 | 0.3% |
| Belgian | 37 | 0.1% |
| Bhutanese | 67 | 0.1% |
| Blackfeet | 2 | 0.0% |
| Brazilian | 16 | 0.0% |
| British | 121 | 0.3% |
| Burmese | 87 | 0.2% |
| Canadian | 158 | 0.3% |
| Celtic | 24 | 0.1% |
| Central American | 14 | 0.0% |
| Central American Indian | 42 | 0.1% |
| Cherokee | 299 | 0.6% |
| Chickasaw | 21 | 0.0% |
| Chilean | 45 | 0.1% |
| Chippewa | 7 | 0.0% |
| Choctaw | 10 | 0.0% |
| Colombian | 52 | 0.1% |
| Comanche | 34 | 0.1% |
| Creek | 1 | 0.0% |
| Croatian | 27 | 0.1% |
| Cuban | 126 | 0.3% |
| Czech | 151 | 0.3% |
| Czechoslovakian | 36 | 0.1% |
| Danish | 134 | 0.3% |
| Dominican | 13 | 0.0% |
| Dutch | 1,049 | 2.1% |
| Dutch West Indian | 29 | 0.1% |
| Eastern European | 91 | 0.2% |
| English | 6,548 | 13.3% |
| Ethiopian | 8 | 0.0% |
| European | 733 | 1.5% |
| Finnish | 57 | 0.1% |
| French | 1,080 | 2.2% |
| French Canadian | 122 | 0.3% |
| German | 8,878 | 18.1% |
| Greek | 305 | 0.6% |
| Guamanian / Chamorro | 8 | 0.0% |
| Hungarian | 22 | 0.0% |
| Icelander | 117 | 0.2% |
| Indian (Asian) | 156 | 0.3% |
| Iranian | 14 | 0.0% |
| Irish | 4,901 | 10.0% |
| Iroquois | 32 | 0.1% |
| Israeli | 9 | 0.0% |
| Italian | 2,278 | 4.6% |
| Jordanian | 14 | 0.0% |
| Kiowa | 49 | 0.1% |
| Korean | 30 | 0.1% |
| Lebanese | 63 | 0.1% |
| Liberian | 12 | 0.0% |
| Lithuanian | 19 | 0.0% |
| Macedonian | 26 | 0.1% |
| Mexican | 2,161 | 4.4% |
| Mexican American Indian | 33 | 0.1% |
| Navajo | 144 | 0.3% |
| New Zealander | 19 | 0.0% |
| Nigerian | 12 | 0.0% |
| Northern European | 270 | 0.5% |
| Norwegian | 1,233 | 2.5% |
| Pennsylvania German | 8 | 0.0% |
| Peruvian | 101 | 0.2% |
| Pima | 14 | 0.0% |
| Polish | 717 | 1.5% |
| Portuguese | 149 | 0.3% |
| Pueblo | 8 | 0.0% |
| Puerto Rican | 333 | 0.7% |
| Romanian | 7 | 0.0% |
| Russian | 191 | 0.4% |
| Salvadoran | 14 | 0.0% |
| Scandinavian | 277 | 0.6% |
| Scotch-Irish | 640 | 1.3% |
| Scottish | 1,333 | 2.7% |
| Sioux | 22 | 0.0% |
| Slavic | 61 | 0.1% |
| Slovak | 70 | 0.1% |
| Slovene | 127 | 0.3% |
| South American | 198 | 0.4% |
| Spaniard | 341 | 0.7% |
| Spanish | 438 | 0.9% |
| Spanish American | 131 | 0.3% |
| Sri Lankan | 28 | 0.1% |
| Subsaharan African | 70 | 0.1% |
| Swedish | 782 | 1.6% |
| Swiss | 89 | 0.2% |
| Syrian | 51 | 0.1% |
| Thai | 9 | 0.0% |
| Tlingit-Haida | 68 | 0.1% |
| Turkish | 29 | 0.1% |
| Ukrainian | 27 | 0.1% |
| Ute | 48 | 0.1% |
| Welsh | 529 | 1.1% |
| Yugoslavian | 49 | 0.1% | View All 98 Rows |
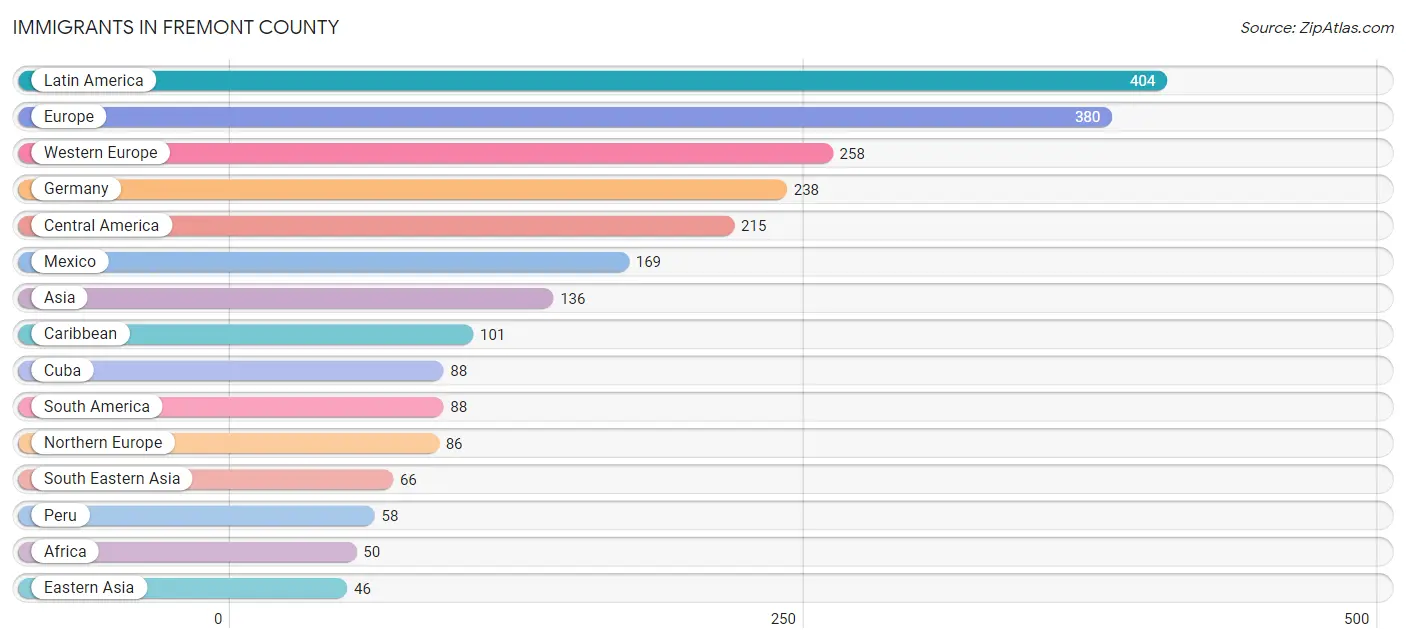
Immigrants in Fremont County
The most numerous immigrant groups reported in Fremont County came from Latin America (404 | 0.8%), Europe (380 | 0.8%), Western Europe (258 | 0.5%), Germany (238 | 0.5%), and Central America (215 | 0.4%), together accounting for 3.0% of all Fremont County residents.
| Immigration Origin | # Population | % Population |
| Africa | 50 | 0.1% |
| Asia | 136 | 0.3% |
| Australia | 2 | 0.0% |
| Brazil | 16 | 0.0% |
| Canada | 13 | 0.0% |
| Caribbean | 101 | 0.2% |
| Central America | 215 | 0.4% |
| Chile | 4 | 0.0% |
| China | 18 | 0.0% |
| Colombia | 10 | 0.0% |
| Cuba | 88 | 0.2% |
| Dominican Republic | 13 | 0.0% |
| Eastern Africa | 21 | 0.0% |
| Eastern Asia | 46 | 0.1% |
| Eastern Europe | 9 | 0.0% |
| El Salvador | 24 | 0.1% |
| England | 43 | 0.1% |
| Eritrea | 8 | 0.0% |
| Ethiopia | 13 | 0.0% |
| Europe | 380 | 0.8% |
| France | 20 | 0.0% |
| Germany | 238 | 0.5% |
| Honduras | 11 | 0.0% |
| Hong Kong | 3 | 0.0% |
| Hungary | 9 | 0.0% |
| Indonesia | 42 | 0.1% |
| Ireland | 11 | 0.0% |
| Italy | 23 | 0.1% |
| Japan | 3 | 0.0% |
| Jordan | 14 | 0.0% |
| Korea | 25 | 0.1% |
| Latin America | 404 | 0.8% |
| Mexico | 169 | 0.3% |
| Northern Africa | 21 | 0.0% |
| Northern Europe | 86 | 0.2% |
| Oceania | 23 | 0.1% |
| Peru | 58 | 0.1% |
| Philippines | 4 | 0.0% |
| South America | 88 | 0.2% |
| South Eastern Asia | 66 | 0.1% |
| Southern Europe | 27 | 0.1% |
| Spain | 4 | 0.0% |
| Sweden | 27 | 0.1% |
| Thailand | 20 | 0.0% |
| Western Asia | 24 | 0.1% |
| Western Europe | 258 | 0.5% |
| Yemen | 10 | 0.0% | View All 47 Rows |
Sex and Age in Fremont County
Sex and Age in Fremont County
The most populous age groups in Fremont County are 30 to 34 Years (2,571 | 9.0%) for men and 55 to 59 Years (1,831 | 8.9%) for women.
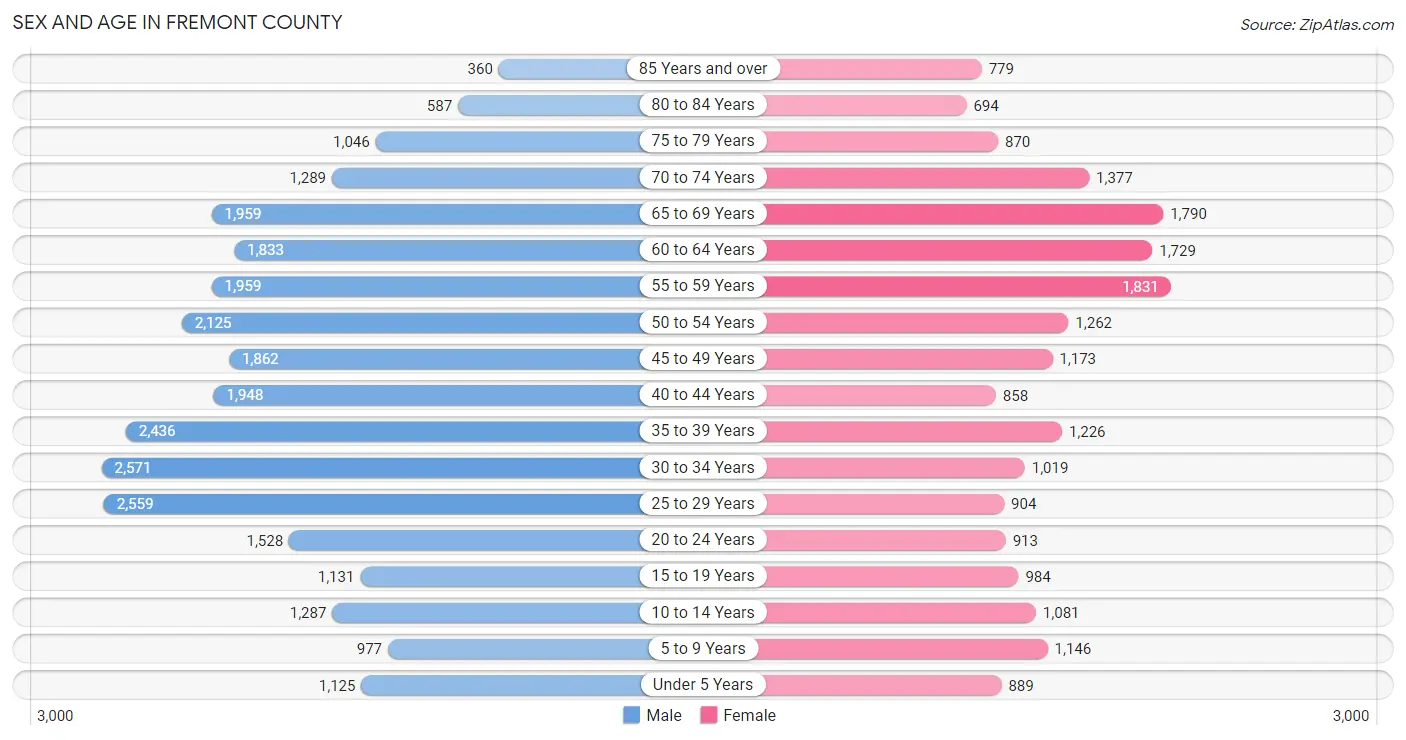
| Age Bracket | Male | Female |
| Under 5 Years | 1,125 (3.9%) | 889 (4.3%) |
| 5 to 9 Years | 977 (3.4%) | 1,146 (5.6%) |
| 10 to 14 Years | 1,287 (4.5%) | 1,081 (5.3%) |
| 15 to 19 Years | 1,131 (4.0%) | 984 (4.8%) |
| 20 to 24 Years | 1,528 (5.3%) | 913 (4.4%) |
| 25 to 29 Years | 2,559 (8.9%) | 904 (4.4%) |
| 30 to 34 Years | 2,571 (9.0%) | 1,019 (5.0%) |
| 35 to 39 Years | 2,436 (8.5%) | 1,226 (6.0%) |
| 40 to 44 Years | 1,948 (6.8%) | 858 (4.2%) |
| 45 to 49 Years | 1,862 (6.5%) | 1,173 (5.7%) |
| 50 to 54 Years | 2,125 (7.4%) | 1,262 (6.1%) |
| 55 to 59 Years | 1,959 (6.9%) | 1,831 (8.9%) |
| 60 to 64 Years | 1,833 (6.4%) | 1,729 (8.4%) |
| 65 to 69 Years | 1,959 (6.9%) | 1,790 (8.7%) |
| 70 to 74 Years | 1,289 (4.5%) | 1,377 (6.7%) |
| 75 to 79 Years | 1,046 (3.7%) | 870 (4.2%) |
| 80 to 84 Years | 587 (2.1%) | 694 (3.4%) |
| 85 Years and over | 360 (1.3%) | 779 (3.8%) |
| Total | 28,582 (100.0%) | 20,525 (100.0%) |
Families and Households in Fremont County
Median Family Size in Fremont County
The median family size in Fremont County is 2.84 persons per family, with single female/mother families (1,488 | 13.4%) accounting for the largest median family size of 3 persons per family. On the other hand, single male/father families (880 | 7.9%) represent the smallest median family size with 2.43 persons per family.
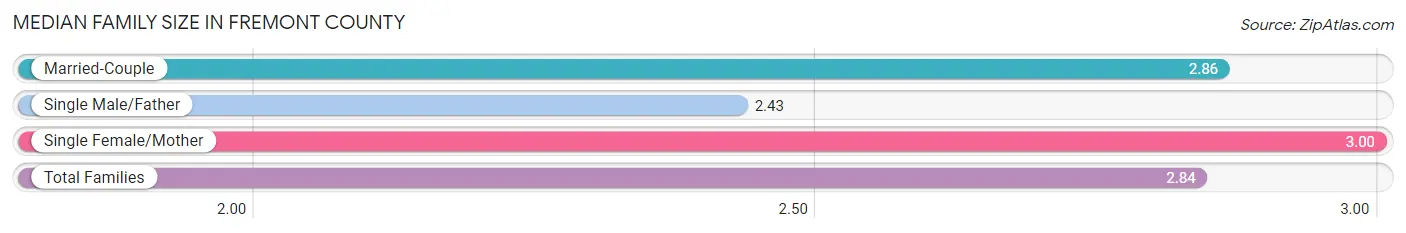
| Family Type | # Families | Family Size |
| Married-Couple | 8,720 (78.6%) | 2.86 |
| Single Male/Father | 880 (7.9%) | 2.43 |
| Single Female/Mother | 1,488 (13.4%) | 3.00 |
| Total Families | 11,088 (100.0%) | 2.84 |
Median Household Size in Fremont County
The median household size in Fremont County is 2.30 persons per household, with single female/mother households (1,488 | 8.4%) accounting for the largest median household size of 3.16 persons per household. non-family households (6,589 | 37.3%) represent the smallest median household size with 1.22 persons per household.
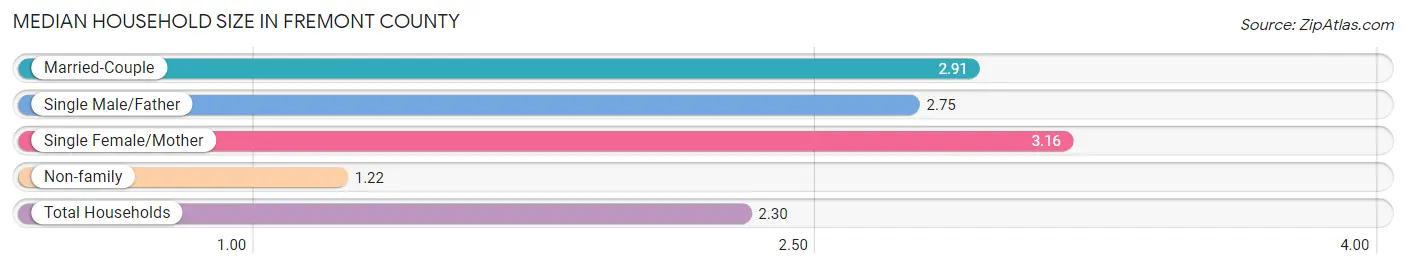
| Household Type | # Households | Household Size |
| Married-Couple | 8,720 (49.3%) | 2.91 |
| Single Male/Father | 880 (5.0%) | 2.75 |
| Single Female/Mother | 1,488 (8.4%) | 3.16 |
| Non-family | 6,589 (37.3%) | 1.22 |
| Total Households | 17,677 (100.0%) | 2.30 |
Household Size by Marriage Status in Fremont County
Out of a total of 17,677 households in Fremont County, 11,088 (62.7%) are family households, while 6,589 (37.3%) are nonfamily households. The most numerous type of family households are 2-person households, comprising 6,022, and the most common type of nonfamily households are 1-person households, comprising 5,411.
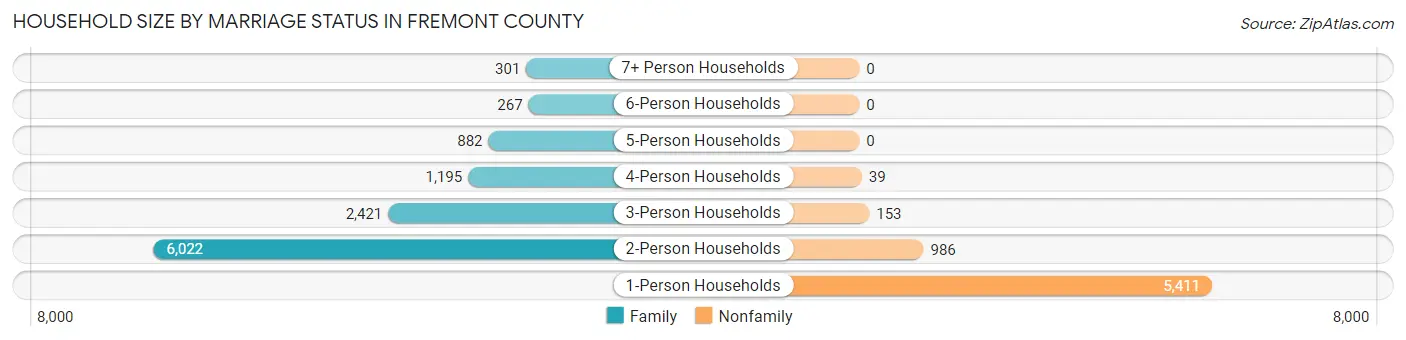
| Household Size | Family Households | Nonfamily Households |
| 1-Person Households | - | 5,411 (30.6%) |
| 2-Person Households | 6,022 (34.1%) | 986 (5.6%) |
| 3-Person Households | 2,421 (13.7%) | 153 (0.9%) |
| 4-Person Households | 1,195 (6.8%) | 39 (0.2%) |
| 5-Person Households | 882 (5.0%) | 0 (0.0%) |
| 6-Person Households | 267 (1.5%) | 0 (0.0%) |
| 7+ Person Households | 301 (1.7%) | 0 (0.0%) |
| Total | 11,088 (62.7%) | 6,589 (37.3%) |
Female Fertility in Fremont County
Fertility by Age in Fremont County
Average fertility rate in Fremont County is 65.0 births per 1,000 women. Women in the age bracket of 20 to 34 years have the highest fertility rate with 138.0 births per 1,000 women. Women in the age bracket of 20 to 34 years acount for 83.2% of all women with births.
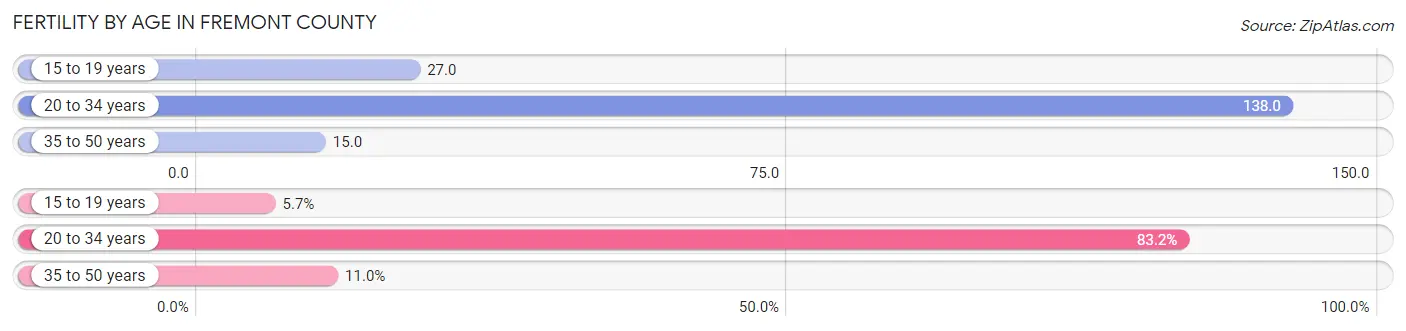
| Age Bracket | Women with Births | Births / 1,000 Women |
| 15 to 19 years | 27 (5.7%) | 27.0 |
| 20 to 34 years | 392 (83.2%) | 138.0 |
| 35 to 50 years | 52 (11.0%) | 15.0 |
| Total | 471 (100.0%) | 65.0 |
Fertility by Age by Marriage Status in Fremont County
66.9% of women with births (471) in Fremont County are married. The highest percentage of unmarried women with births falls into 15 to 19 years age bracket with 100.0% of them unmarried at the time of birth, while the lowest percentage of unmarried women with births belong to 35 to 50 years age bracket with 0.0% of them unmarried.
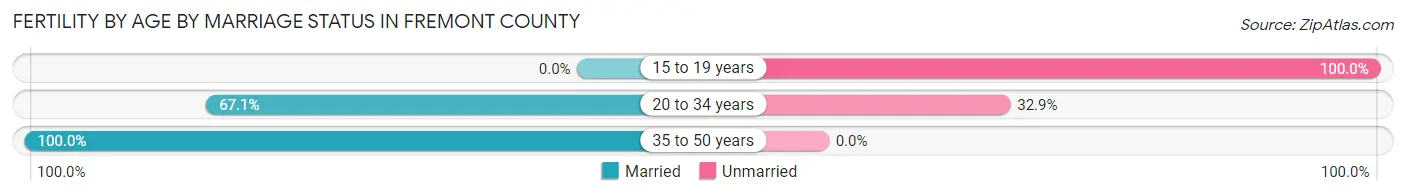
| Age Bracket | Married | Unmarried |
| 15 to 19 years | 0 (0.0%) | 27 (100.0%) |
| 20 to 34 years | 263 (67.1%) | 129 (32.9%) |
| 35 to 50 years | 52 (100.0%) | 0 (0.0%) |
| Total | 315 (66.9%) | 156 (33.1%) |
Fertility by Education in Fremont County
Average fertility rate in Fremont County is 65.0 births per 1,000 women. Women with the education attainment of college or associate's degree have the highest fertility rate of 81.0 births per 1,000 women, while women with the education attainment of graduate degree have the lowest fertility at 38.0 births per 1,000 women. Women with the education attainment of college or associate's degree represent 45.9% of all women with births.
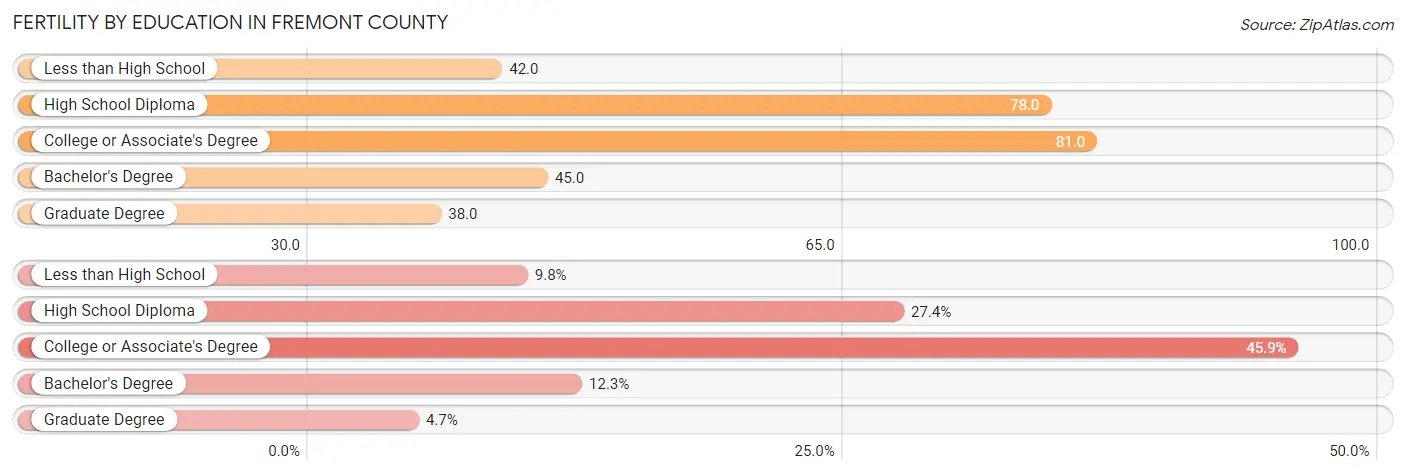
| Educational Attainment | Women with Births | Births / 1,000 Women |
| Less than High School | 46 (9.8%) | 42.0 |
| High School Diploma | 129 (27.4%) | 78.0 |
| College or Associate's Degree | 216 (45.9%) | 81.0 |
| Bachelor's Degree | 58 (12.3%) | 45.0 |
| Graduate Degree | 22 (4.7%) | 38.0 |
| Total | 471 (100.0%) | 65.0 |
Fertility by Education by Marriage Status in Fremont County
33.1% of women with births in Fremont County are unmarried. Women with the educational attainment of graduate degree are most likely to be married with 100.0% of them married at childbirth, while women with the educational attainment of high school diploma are least likely to be married with 78.3% of them unmarried at childbirth.
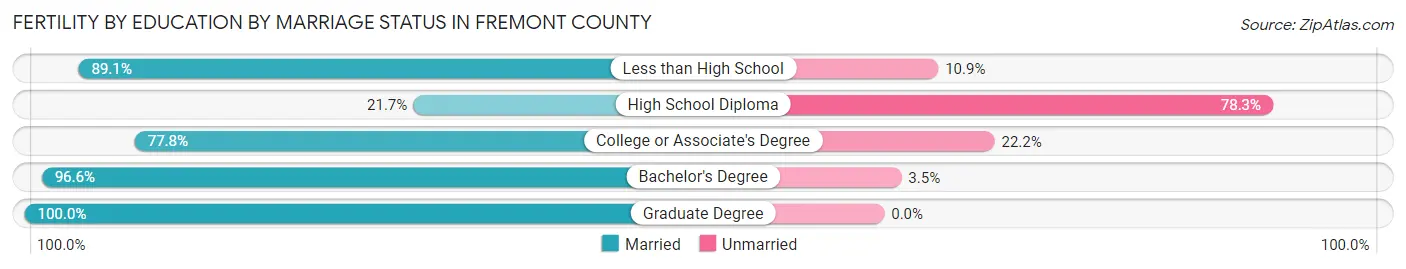
| Educational Attainment | Married | Unmarried |
| Less than High School | 41 (89.1%) | 5 (10.9%) |
| High School Diploma | 28 (21.7%) | 101 (78.3%) |
| College or Associate's Degree | 168 (77.8%) | 48 (22.2%) |
| Bachelor's Degree | 56 (96.6%) | 2 (3.5%) |
| Graduate Degree | 22 (100.0%) | 0 (0.0%) |
| Total | 315 (66.9%) | 156 (33.1%) |
Income in Fremont County
Income Overview in Fremont County
Per Capita Income in Fremont County is $28,224, while median incomes of families and households are $73,966 and $56,165 respectively.
| Characteristic | Number | Measure |
| Per Capita Income | 49,107 | $28,224 |
| Median Family Income | 11,088 | $73,966 |
| Mean Family Income | 11,088 | $89,868 |
| Median Household Income | 17,677 | $56,165 |
| Mean Household Income | 17,677 | $75,869 |
| Income Deficit | 11,088 | $8,960 |
| Wage / Income Gap (%) | 49,107 | 25.43% |
| Wage / Income Gap ($) | 49,107 | 74.57¢ per $1 |
| Gini / Inequality Index | 49,107 | 0.47 |
Earnings by Sex in Fremont County
Average Earnings in Fremont County are $36,973, $43,005 for men and $32,070 for women, a difference of 25.4%.
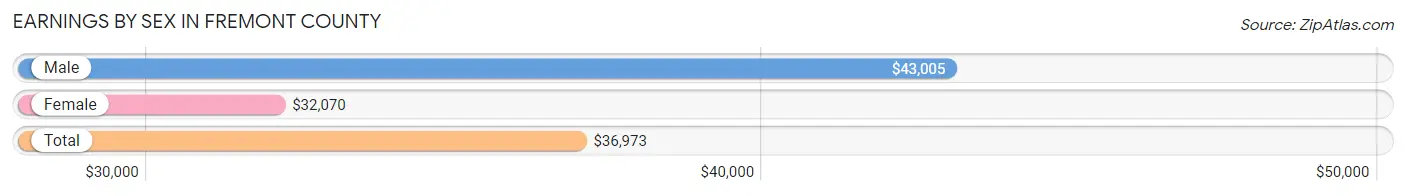
| Sex | Number | Average Earnings |
| Male | 10,220 (53.5%) | $43,005 |
| Female | 8,894 (46.5%) | $32,070 |
| Total | 19,114 (100.0%) | $36,973 |
Earnings by Sex by Income Bracket in Fremont County
The most common earnings brackets in Fremont County are $55,000 to $64,999 for men (1,146 | 11.2%) and $55,000 to $64,999 for women (957 | 10.8%).
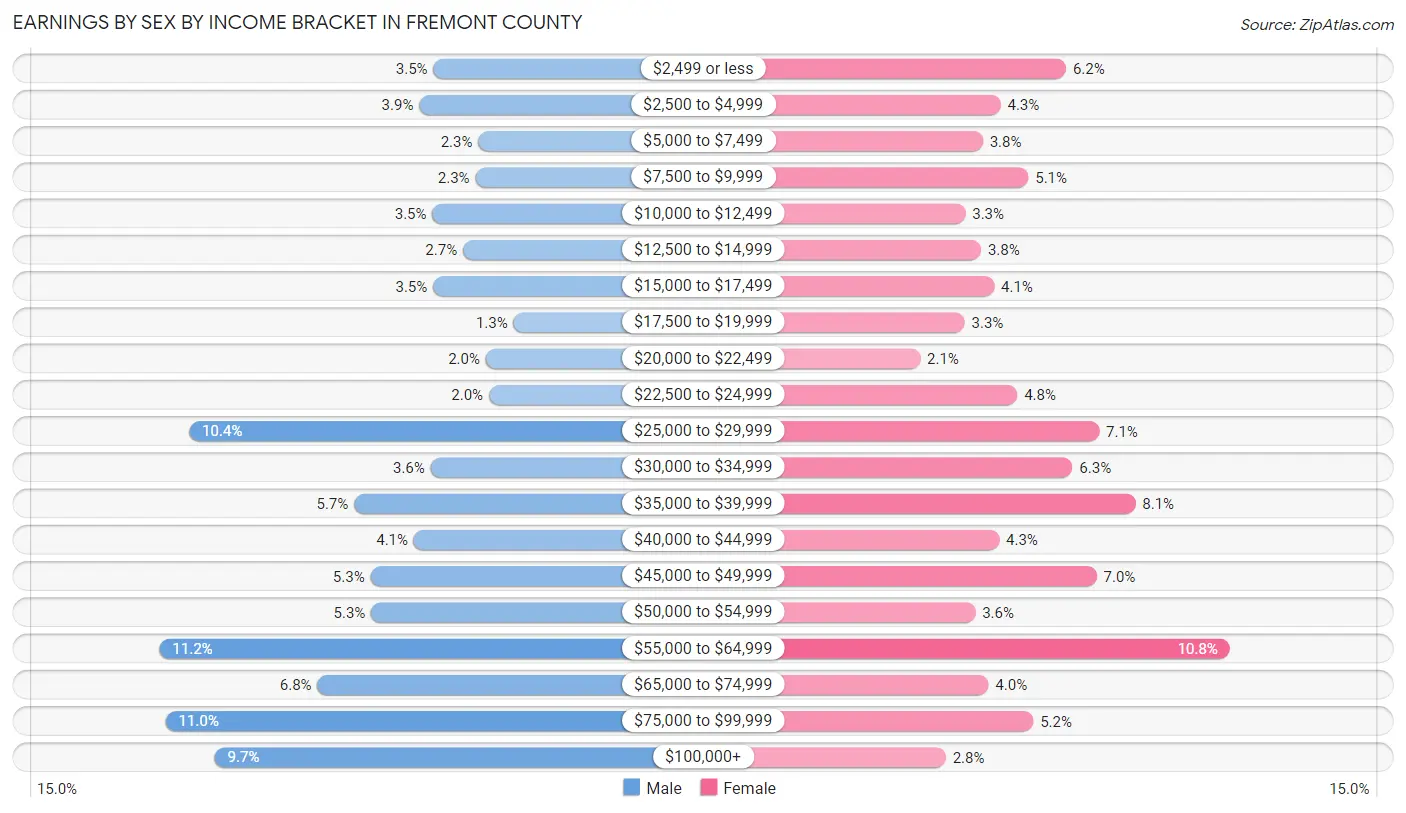
| Income | Male | Female |
| $2,499 or less | 359 (3.5%) | 548 (6.2%) |
| $2,500 to $4,999 | 400 (3.9%) | 384 (4.3%) |
| $5,000 to $7,499 | 230 (2.2%) | 340 (3.8%) |
| $7,500 to $9,999 | 238 (2.3%) | 454 (5.1%) |
| $10,000 to $12,499 | 362 (3.5%) | 296 (3.3%) |
| $12,500 to $14,999 | 274 (2.7%) | 335 (3.8%) |
| $15,000 to $17,499 | 360 (3.5%) | 368 (4.1%) |
| $17,500 to $19,999 | 129 (1.3%) | 294 (3.3%) |
| $20,000 to $22,499 | 208 (2.0%) | 183 (2.1%) |
| $22,500 to $24,999 | 199 (1.9%) | 426 (4.8%) |
| $25,000 to $29,999 | 1,061 (10.4%) | 631 (7.1%) |
| $30,000 to $34,999 | 367 (3.6%) | 564 (6.3%) |
| $35,000 to $39,999 | 587 (5.7%) | 721 (8.1%) |
| $40,000 to $44,999 | 415 (4.1%) | 381 (4.3%) |
| $45,000 to $49,999 | 540 (5.3%) | 624 (7.0%) |
| $50,000 to $54,999 | 538 (5.3%) | 321 (3.6%) |
| $55,000 to $64,999 | 1,146 (11.2%) | 957 (10.8%) |
| $65,000 to $74,999 | 692 (6.8%) | 354 (4.0%) |
| $75,000 to $99,999 | 1,128 (11.0%) | 466 (5.2%) |
| $100,000+ | 987 (9.7%) | 247 (2.8%) |
| Total | 10,220 (100.0%) | 8,894 (100.0%) |
Earnings by Sex by Educational Attainment in Fremont County
Average earnings in Fremont County are $47,078 for men and $35,036 for women, a difference of 25.6%. Men with an educational attainment of graduate degree enjoy the highest average annual earnings of $70,549, while those with high school diploma education earn the least with $29,722. Women with an educational attainment of graduate degree earn the most with the average annual earnings of $47,260, while those with high school diploma education have the smallest earnings of $27,122.
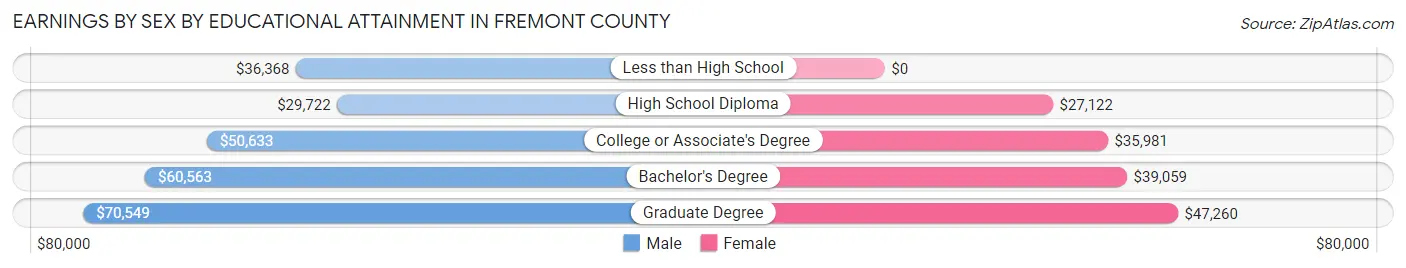
| Educational Attainment | Male Income | Female Income |
| Less than High School | $36,368 | $0 |
| High School Diploma | $29,722 | $27,122 |
| College or Associate's Degree | $50,633 | $35,981 |
| Bachelor's Degree | $60,563 | $39,059 |
| Graduate Degree | $70,549 | $47,260 |
| Total | $47,078 | $35,036 |
Family Income in Fremont County
Family Income Brackets in Fremont County
According to the Fremont County family income data, there are 2,129 families falling into the $100,000 to $149,999 income range, which is the most common income bracket and makes up 19.2% of all families. Conversely, the less than $10,000 income bracket is the least frequent group with only 222 families (2.0%) belonging to this category.
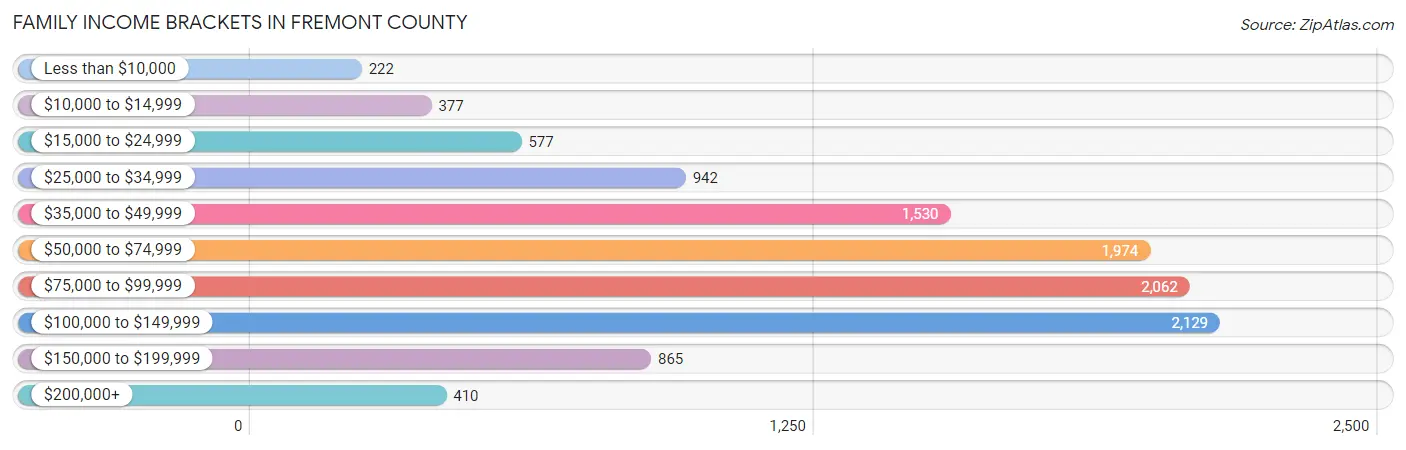
| Income Bracket | # Families | % Families |
| Less than $10,000 | 222 | 2.0% |
| $10,000 to $14,999 | 377 | 3.4% |
| $15,000 to $24,999 | 577 | 5.2% |
| $25,000 to $34,999 | 942 | 8.5% |
| $35,000 to $49,999 | 1,530 | 13.8% |
| $50,000 to $74,999 | 1,974 | 17.8% |
| $75,000 to $99,999 | 2,062 | 18.6% |
| $100,000 to $149,999 | 2,129 | 19.2% |
| $150,000 to $199,999 | 865 | 7.8% |
| $200,000+ | 410 | 3.7% |
Family Income by Famaliy Size in Fremont County
7+ person families (244 | 2.2%) account for the highest median family income in Fremont County with $104,419 per family, while 2-person families (6,424 | 57.9%) have the highest median income of $35,154 per family member.
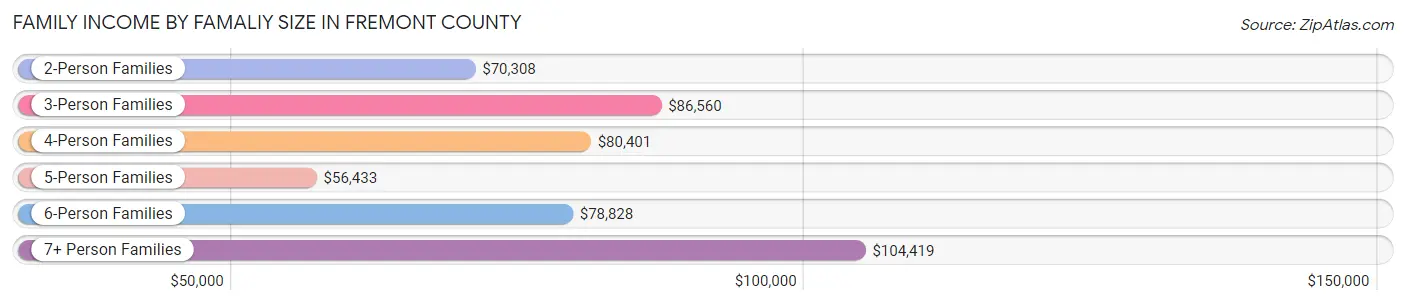
| Income Bracket | # Families | Median Income |
| 2-Person Families | 6,424 (57.9%) | $70,308 |
| 3-Person Families | 2,315 (20.9%) | $86,560 |
| 4-Person Families | 1,051 (9.5%) | $80,401 |
| 5-Person Families | 853 (7.7%) | $56,433 |
| 6-Person Families | 201 (1.8%) | $78,828 |
| 7+ Person Families | 244 (2.2%) | $104,419 |
| Total | 11,088 (100.0%) | $73,966 |
Family Income by Number of Earners in Fremont County
The median family income in Fremont County is $73,966, with families comprising 3+ earners (782) having the highest median family income of $114,327, while families with no earners (2,819) have the lowest median family income of $45,872, accounting for 7.0% and 25.4% of families, respectively.
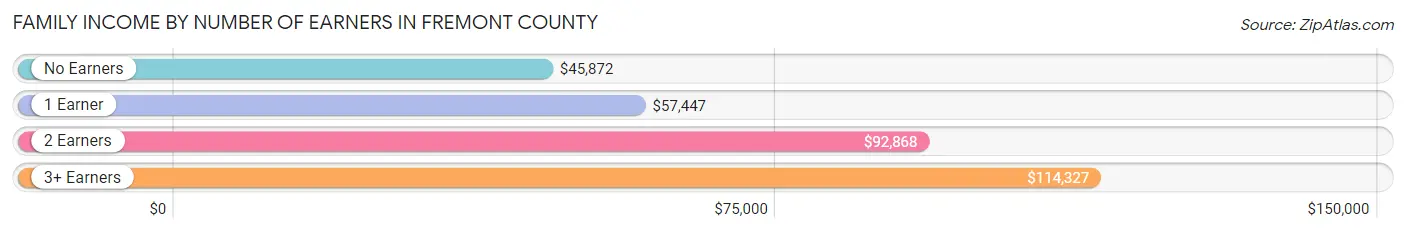
| Number of Earners | # Families | Median Income |
| No Earners | 2,819 (25.4%) | $45,872 |
| 1 Earner | 3,681 (33.2%) | $57,447 |
| 2 Earners | 3,806 (34.3%) | $92,868 |
| 3+ Earners | 782 (7.0%) | $114,327 |
| Total | 11,088 (100.0%) | $73,966 |
Household Income in Fremont County
Household Income Brackets in Fremont County
With 2,987 households falling in the category, the $50,000 to $74,999 income range is the most frequent in Fremont County, accounting for 16.9% of all households. In contrast, only 495 households (2.8%) fall into the $200,000+ income bracket, making it the least populous group.
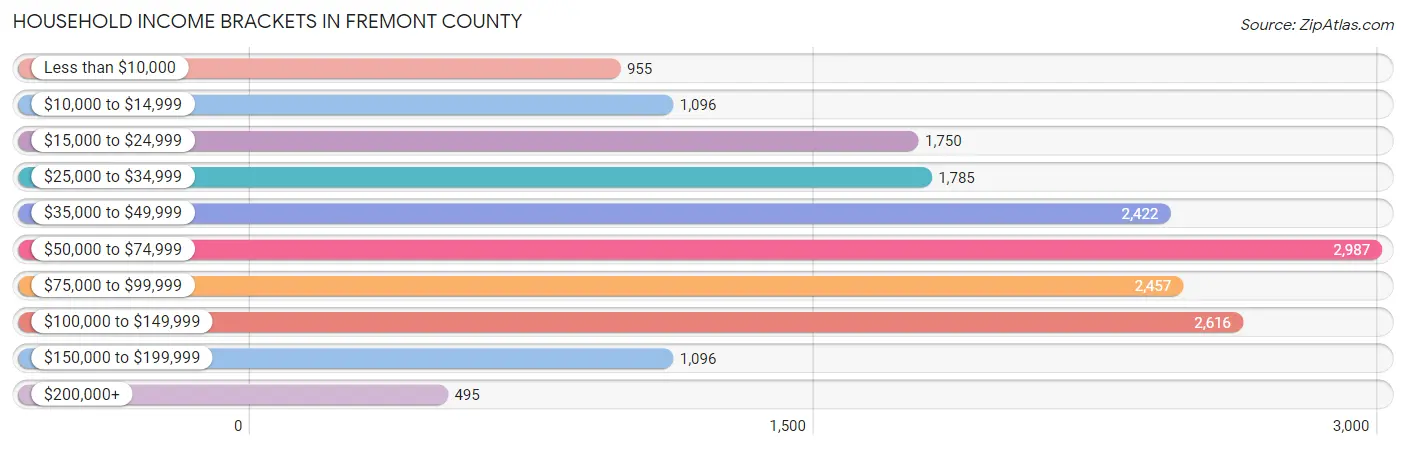
| Income Bracket | # Households | % Households |
| Less than $10,000 | 955 | 5.4% |
| $10,000 to $14,999 | 1,096 | 6.2% |
| $15,000 to $24,999 | 1,750 | 9.9% |
| $25,000 to $34,999 | 1,785 | 10.1% |
| $35,000 to $49,999 | 2,422 | 13.7% |
| $50,000 to $74,999 | 2,987 | 16.9% |
| $75,000 to $99,999 | 2,457 | 13.9% |
| $100,000 to $149,999 | 2,616 | 14.8% |
| $150,000 to $199,999 | 1,096 | 6.2% |
| $200,000+ | 495 | 2.8% |
Household Income by Householder Age in Fremont County
The median household income in Fremont County is $56,165, with the highest median household income of $67,263 found in the 25 to 44 years age bracket for the primary householder. A total of 3,837 households (21.7%) fall into this category. Meanwhile, the 15 to 24 years age bracket for the primary householder has the lowest median household income of $39,006, with 790 households (4.5%) in this group.
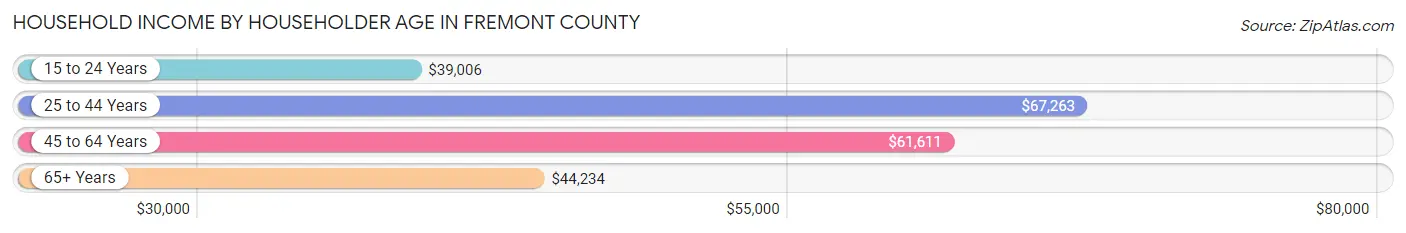
| Income Bracket | # Households | Median Income |
| 15 to 24 Years | 790 (4.5%) | $39,006 |
| 25 to 44 Years | 3,837 (21.7%) | $67,263 |
| 45 to 64 Years | 6,717 (38.0%) | $61,611 |
| 65+ Years | 6,333 (35.8%) | $44,234 |
| Total | 17,677 (100.0%) | $56,165 |
Poverty in Fremont County
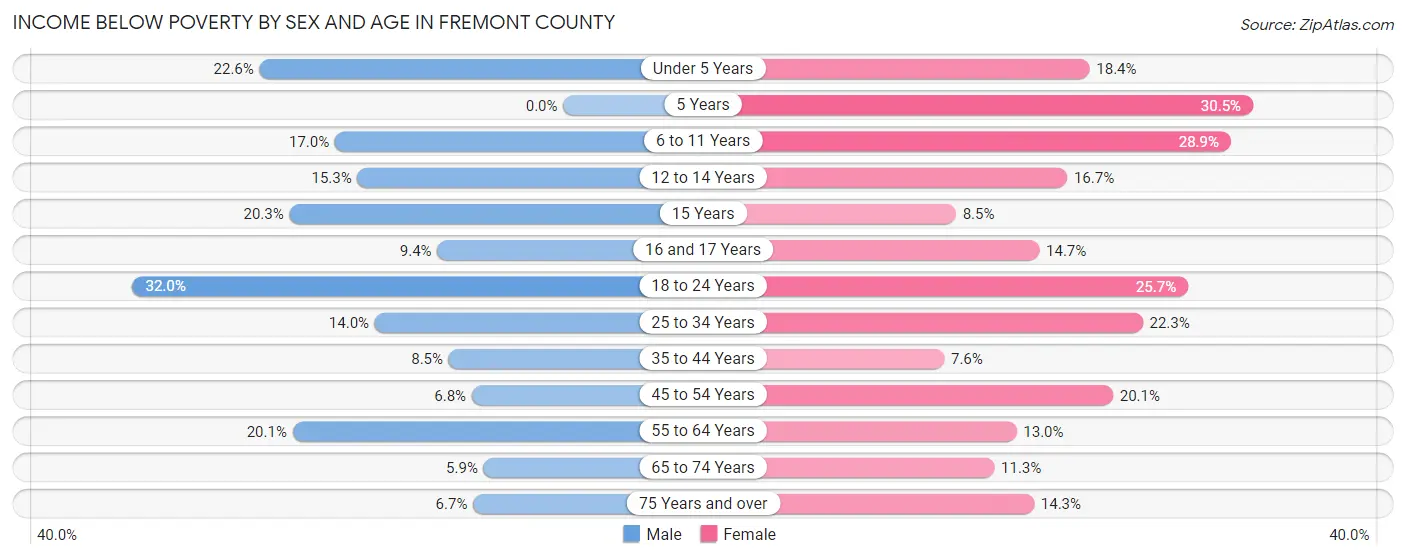
Income Below Poverty by Sex and Age in Fremont County
With 13.6% poverty level for males and 16.5% for females among the residents of Fremont County, 18 to 24 year old males and 5 year old females are the most vulnerable to poverty, with 457 males (32.0%) and 76 females (30.5%) in their respective age groups living below the poverty level.
| Age Bracket | Male | Female |
| Under 5 Years | 244 (22.6%) | 157 (18.4%) |
| 5 Years | 0 (0.0%) | 76 (30.5%) |
| 6 to 11 Years | 233 (17.0%) | 383 (28.9%) |
| 12 to 14 Years | 108 (15.3%) | 108 (16.7%) |
| 15 Years | 75 (20.3%) | 11 (8.5%) |
| 16 and 17 Years | 36 (9.3%) | 74 (14.6%) |
| 18 to 24 Years | 457 (32.0%) | 323 (25.7%) |
| 25 to 34 Years | 437 (14.0%) | 419 (22.3%) |
| 35 to 44 Years | 154 (8.5%) | 156 (7.6%) |
| 45 to 54 Years | 173 (6.8%) | 488 (20.1%) |
| 55 to 64 Years | 565 (20.1%) | 458 (13.0%) |
| 65 to 74 Years | 169 (5.9%) | 349 (11.3%) |
| 75 Years and over | 127 (6.7%) | 301 (14.3%) |
| Total | 2,778 (13.6%) | 3,303 (16.5%) |
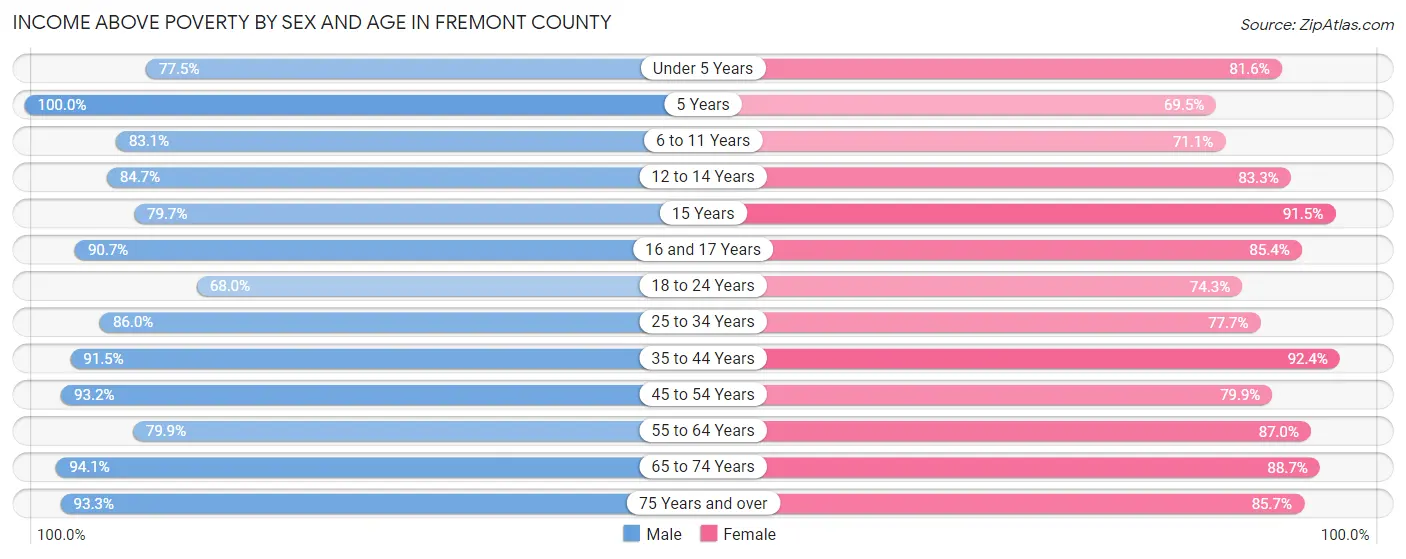
Income Above Poverty by Sex and Age in Fremont County
According to the poverty statistics in Fremont County, males aged 5 years and females aged 35 to 44 years are the age groups that are most secure financially, with 100.0% of males and 92.4% of females in these age groups living above the poverty line.
| Age Bracket | Male | Female |
| Under 5 Years | 838 (77.4%) | 697 (81.6%) |
| 5 Years | 82 (100.0%) | 173 (69.5%) |
| 6 to 11 Years | 1,142 (83.1%) | 943 (71.1%) |
| 12 to 14 Years | 599 (84.7%) | 538 (83.3%) |
| 15 Years | 294 (79.7%) | 119 (91.5%) |
| 16 and 17 Years | 349 (90.6%) | 431 (85.4%) |
| 18 to 24 Years | 972 (68.0%) | 934 (74.3%) |
| 25 to 34 Years | 2,687 (86.0%) | 1,457 (77.7%) |
| 35 to 44 Years | 1,657 (91.5%) | 1,900 (92.4%) |
| 45 to 54 Years | 2,374 (93.2%) | 1,937 (79.9%) |
| 55 to 64 Years | 2,247 (79.9%) | 3,077 (87.0%) |
| 65 to 74 Years | 2,690 (94.1%) | 2,738 (88.7%) |
| 75 Years and over | 1,770 (93.3%) | 1,810 (85.7%) |
| Total | 17,701 (86.4%) | 16,754 (83.5%) |
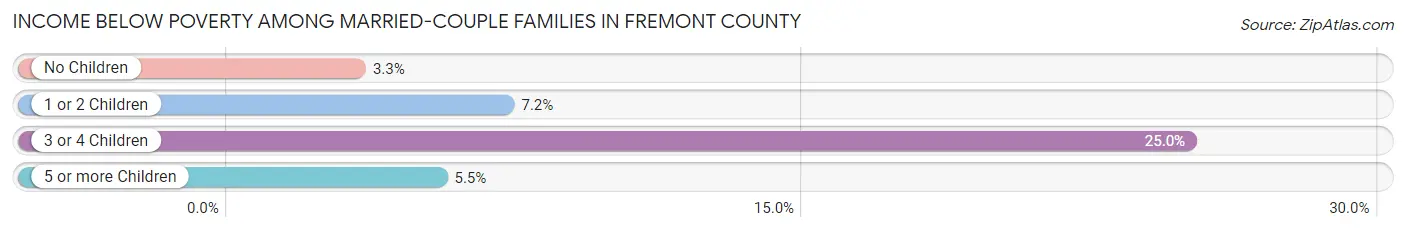
Income Below Poverty Among Married-Couple Families in Fremont County
The poverty statistics for married-couple families in Fremont County show that 5.8% or 503 of the total 8,720 families live below the poverty line. Families with 3 or 4 children have the highest poverty rate of 25.0%, comprising of 157 families. On the other hand, families with no children have the lowest poverty rate of 3.3%, which includes 202 families.
| Children | Above Poverty | Below Poverty |
| No Children | 5,849 (96.7%) | 202 (3.3%) |
| 1 or 2 Children | 1,708 (92.8%) | 133 (7.2%) |
| 3 or 4 Children | 470 (75.0%) | 157 (25.0%) |
| 5 or more Children | 190 (94.5%) | 11 (5.5%) |
| Total | 8,217 (94.2%) | 503 (5.8%) |
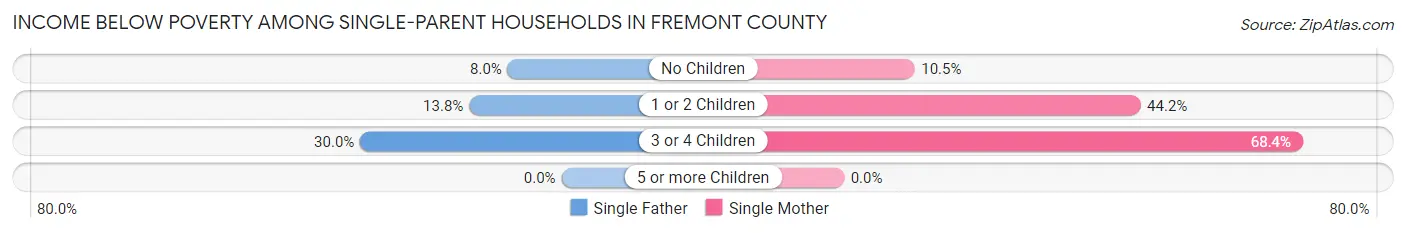
Income Below Poverty Among Single-Parent Households in Fremont County
According to the poverty data in Fremont County, 12.4% or 109 single-father households and 32.1% or 478 single-mother households are living below the poverty line. Among single-father households, those with 3 or 4 children have the highest poverty rate, with 12 households (30.0%) experiencing poverty. Likewise, among single-mother households, those with 3 or 4 children have the highest poverty rate, with 117 households (68.4%) falling below the poverty line.
| Children | Single Father | Single Mother |
| No Children | 26 (8.0%) | 69 (10.5%) |
| 1 or 2 Children | 71 (13.8%) | 292 (44.2%) |
| 3 or 4 Children | 12 (30.0%) | 117 (68.4%) |
| 5 or more Children | 0 (0.0%) | 0 (0.0%) |
| Total | 109 (12.4%) | 478 (32.1%) |
Income Below Poverty Among Married-Couple vs Single-Parent Households in Fremont County
The poverty data for Fremont County shows that 503 of the married-couple family households (5.8%) and 587 of the single-parent households (24.8%) are living below the poverty level. Within the married-couple family households, those with 3 or 4 children have the highest poverty rate, with 157 households (25.0%) falling below the poverty line. Among the single-parent households, those with 3 or 4 children have the highest poverty rate, with 129 household (61.1%) living below poverty.
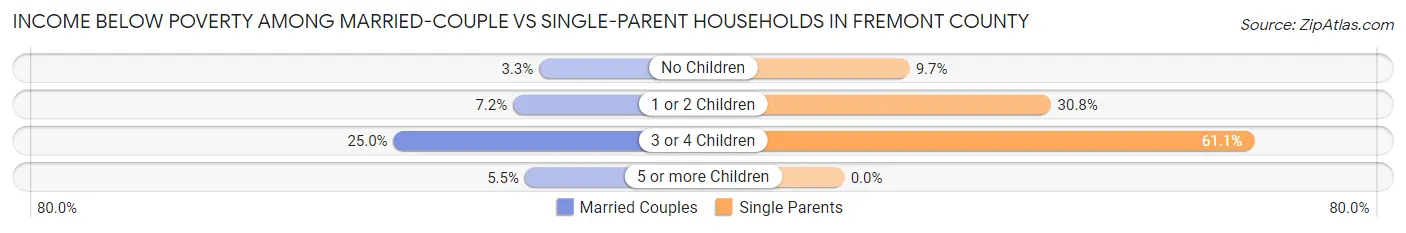
| Children | Married-Couple Families | Single-Parent Households |
| No Children | 202 (3.3%) | 95 (9.7%) |
| 1 or 2 Children | 133 (7.2%) | 363 (30.8%) |
| 3 or 4 Children | 157 (25.0%) | 129 (61.1%) |
| 5 or more Children | 11 (5.5%) | 0 (0.0%) |
| Total | 503 (5.8%) | 587 (24.8%) |
Employment Characteristics in Fremont County
Employment by Class of Employer in Fremont County
Among the 16,657 employed individuals in Fremont County, private company employees (9,193 | 55.2%), local government employees (1,975 | 11.9%), and self-employed (not incorporated) (1,376 | 8.3%) make up the most common classes of employment.
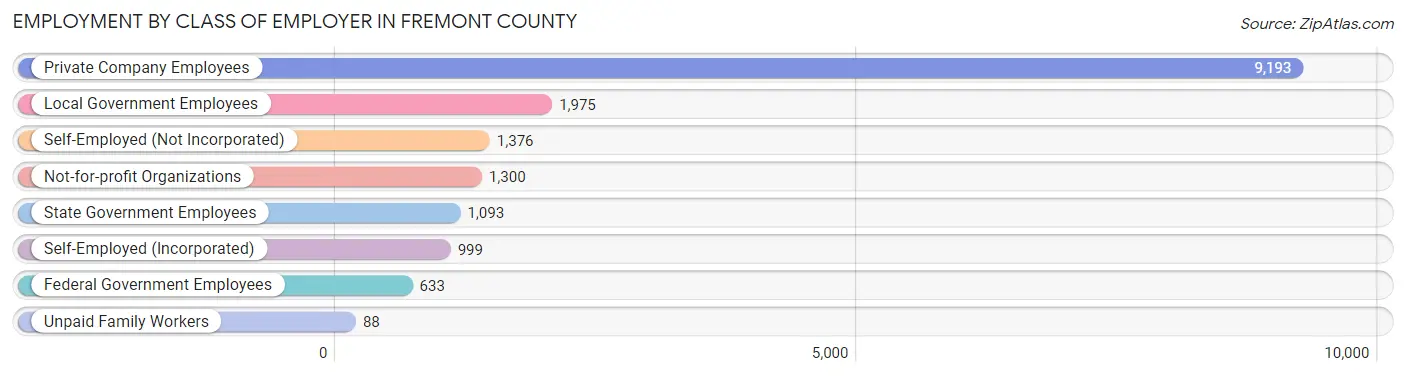
| Employer Class | # Employees | % Employees |
| Private Company Employees | 9,193 | 55.2% |
| Self-Employed (Incorporated) | 999 | 6.0% |
| Self-Employed (Not Incorporated) | 1,376 | 8.3% |
| Not-for-profit Organizations | 1,300 | 7.8% |
| Local Government Employees | 1,975 | 11.9% |
| State Government Employees | 1,093 | 6.6% |
| Federal Government Employees | 633 | 3.8% |
| Unpaid Family Workers | 88 | 0.5% |
| Total | 16,657 | 100.0% |
Employment Status by Age in Fremont County
According to the labor force statistics for Fremont County, out of the total population over 16 years of age (42,093), 42.3% or 17,805 individuals are in the labor force, with 4.8% or 855 of them unemployed. The age group with the highest labor force participation rate is 45 to 54 years, with 60.4% or 3,879 individuals in the labor force. Within the labor force, the 16 to 19 years age range has the highest percentage of unemployed individuals, with 15.3% or 88 of them being unemployed.
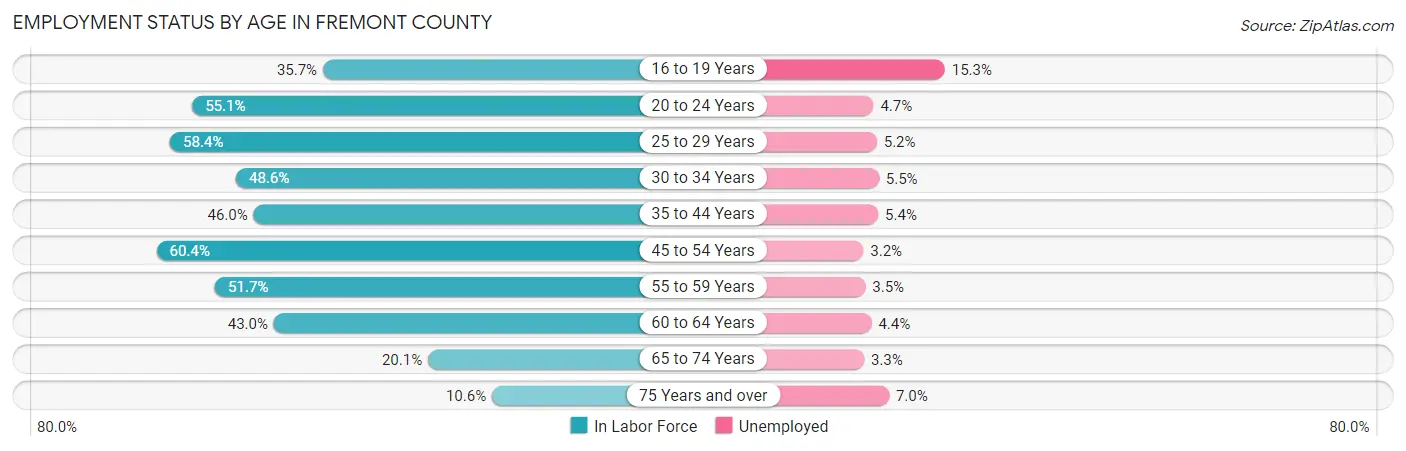
| Age Bracket | In Labor Force | Unemployed |
| 16 to 19 Years | 573 (35.7%) | 88 (15.3%) |
| 20 to 24 Years | 1,345 (55.1%) | 63 (4.7%) |
| 25 to 29 Years | 2,022 (58.4%) | 105 (5.2%) |
| 30 to 34 Years | 1,745 (48.6%) | 96 (5.5%) |
| 35 to 44 Years | 2,975 (46.0%) | 161 (5.4%) |
| 45 to 54 Years | 3,879 (60.4%) | 124 (3.2%) |
| 55 to 59 Years | 1,959 (51.7%) | 69 (3.5%) |
| 60 to 64 Years | 1,532 (43.0%) | 67 (4.4%) |
| 65 to 74 Years | 1,289 (20.1%) | 43 (3.3%) |
| 75 Years and over | 460 (10.6%) | 32 (7.0%) |
| Total | 17,805 (42.3%) | 855 (4.8%) |
Employment Status by Educational Attainment in Fremont County
According to labor force statistics for Fremont County, 51.7% of individuals (14,112) out of the total population between 25 and 64 years of age (27,295) are in the labor force, with 4.4% or 621 of them being unemployed. The group with the highest labor force participation rate are those with the educational attainment of bachelor's degree or higher, with 77.9% or 3,911 individuals in the labor force. Within the labor force, individuals with less than high school education have the highest percentage of unemployment, with 7.6% or 60 of them being unemployed.
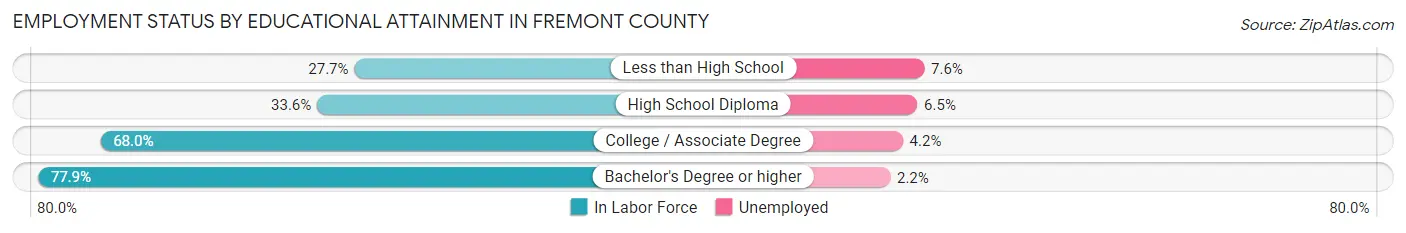
| Educational Attainment | In Labor Force | Unemployed |
| Less than High School | 788 (27.7%) | 216 (7.6%) |
| High School Diploma | 3,704 (33.6%) | 716 (6.5%) |
| College / Associate Degree | 5,717 (68.0%) | 353 (4.2%) |
| Bachelor's Degree or higher | 3,911 (77.9%) | 110 (2.2%) |
| Total | 14,112 (51.7%) | 1,201 (4.4%) |
Employment Occupations by Sex in Fremont County
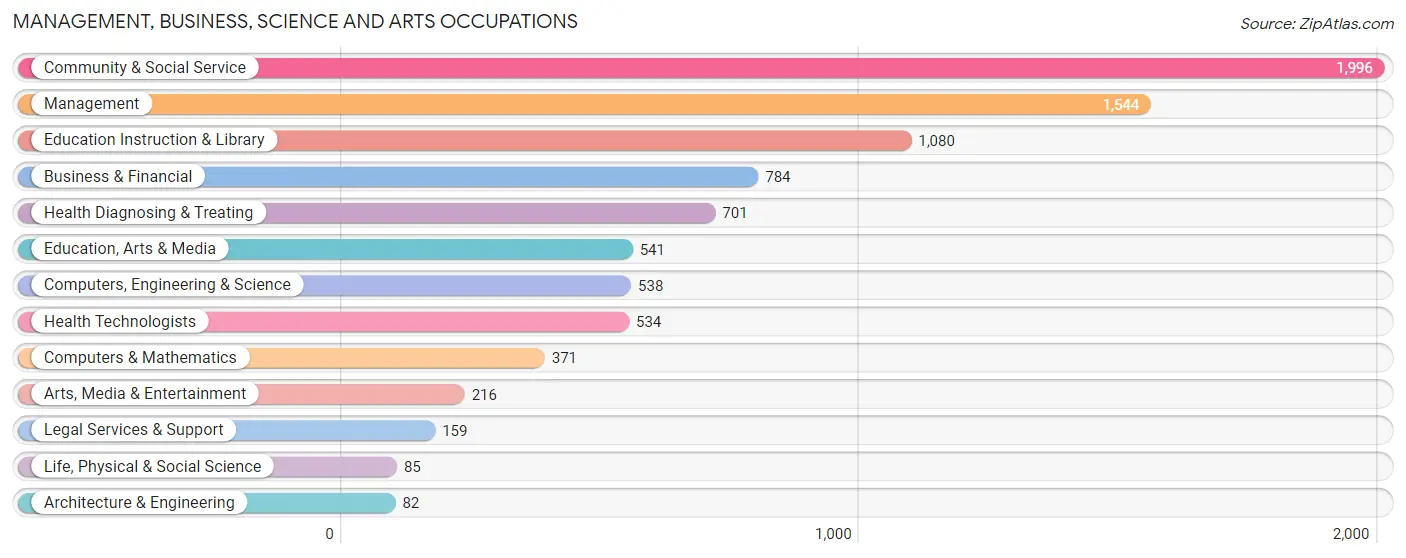
Management, Business, Science and Arts Occupations
The most common Management, Business, Science and Arts occupations in Fremont County are Community & Social Service (1,996 | 11.8%), Management (1,544 | 9.2%), Education Instruction & Library (1,080 | 6.4%), Business & Financial (784 | 4.6%), and Health Diagnosing & Treating (701 | 4.2%).
Management, Business, Science and Arts Occupations by Sex
Within the Management, Business, Science and Arts occupations in Fremont County, the most male-oriented occupations are Architecture & Engineering (100.0%), Arts, Media & Entertainment (61.6%), and Management (57.9%), while the most female-oriented occupations are Business & Financial (75.1%), Legal Services & Support (73.6%), and Education Instruction & Library (68.7%).

| Occupation | Male | Female |
| Management | 894 (57.9%) | 650 (42.1%) |
| Business & Financial | 195 (24.9%) | 589 (75.1%) |
| Computers, Engineering & Science | 299 (55.6%) | 239 (44.4%) |
| Computers & Mathematics | 169 (45.6%) | 202 (54.4%) |
| Architecture & Engineering | 82 (100.0%) | 0 (0.0%) |
| Life, Physical & Social Science | 48 (56.5%) | 37 (43.5%) |
| Community & Social Service | 688 (34.5%) | 1,308 (65.5%) |
| Education, Arts & Media | 175 (32.4%) | 366 (67.6%) |
| Legal Services & Support | 42 (26.4%) | 117 (73.6%) |
| Education Instruction & Library | 338 (31.3%) | 742 (68.7%) |
| Arts, Media & Entertainment | 133 (61.6%) | 83 (38.4%) |
| Health Diagnosing & Treating | 276 (39.4%) | 425 (60.6%) |
| Health Technologists | 205 (38.4%) | 329 (61.6%) |
| Total (Category) | 2,352 (42.3%) | 3,211 (57.7%) |
| Total (Overall) | 9,052 (53.7%) | 7,803 (46.3%) |
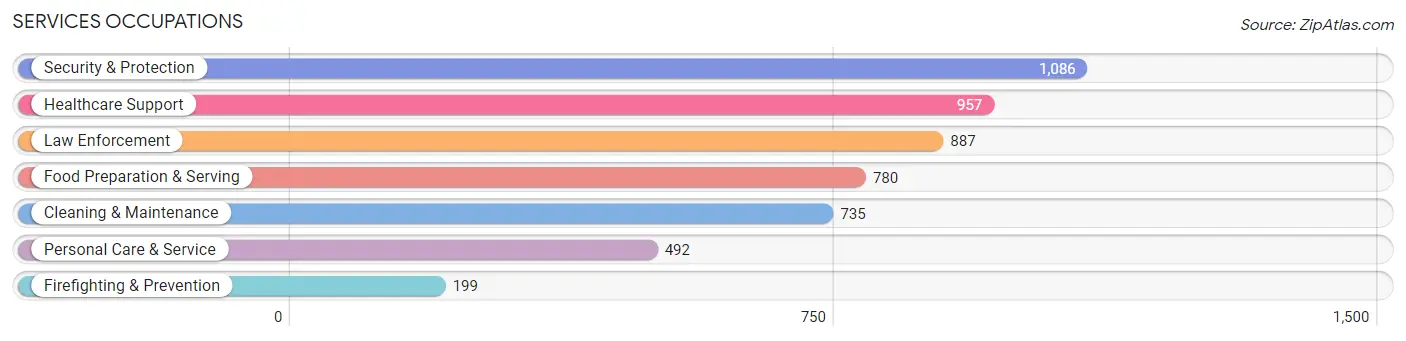
Services Occupations
The most common Services occupations in Fremont County are Security & Protection (1,086 | 6.4%), Healthcare Support (957 | 5.7%), Law Enforcement (887 | 5.3%), Food Preparation & Serving (780 | 4.6%), and Cleaning & Maintenance (735 | 4.4%).
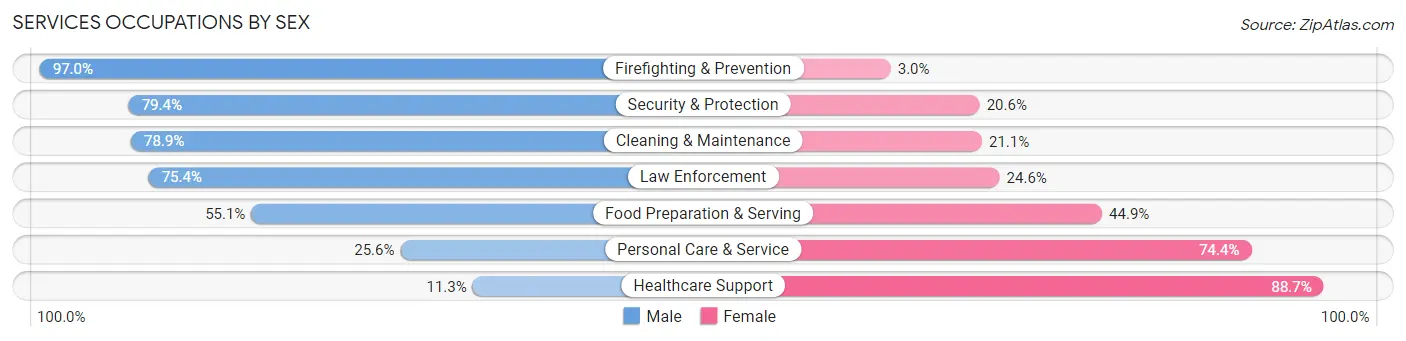
Services Occupations by Sex
Within the Services occupations in Fremont County, the most male-oriented occupations are Firefighting & Prevention (97.0%), Security & Protection (79.4%), and Cleaning & Maintenance (78.9%), while the most female-oriented occupations are Healthcare Support (88.7%), Personal Care & Service (74.4%), and Food Preparation & Serving (44.9%).
| Occupation | Male | Female |
| Healthcare Support | 108 (11.3%) | 849 (88.7%) |
| Security & Protection | 862 (79.4%) | 224 (20.6%) |
| Firefighting & Prevention | 193 (97.0%) | 6 (3.0%) |
| Law Enforcement | 669 (75.4%) | 218 (24.6%) |
| Food Preparation & Serving | 430 (55.1%) | 350 (44.9%) |
| Cleaning & Maintenance | 580 (78.9%) | 155 (21.1%) |
| Personal Care & Service | 126 (25.6%) | 366 (74.4%) |
| Total (Category) | 2,106 (52.0%) | 1,944 (48.0%) |
| Total (Overall) | 9,052 (53.7%) | 7,803 (46.3%) |
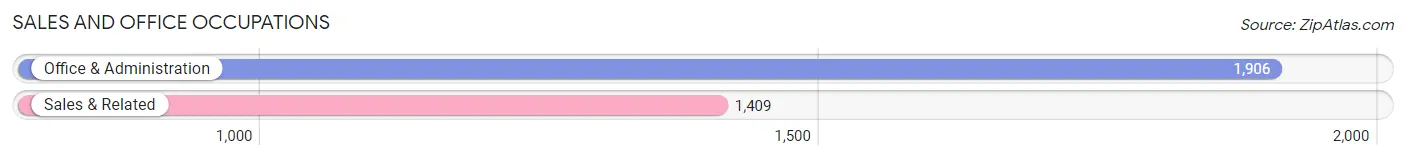
Sales and Office Occupations
The most common Sales and Office occupations in Fremont County are Office & Administration (1,906 | 11.3%), and Sales & Related (1,409 | 8.4%).
Sales and Office Occupations by Sex
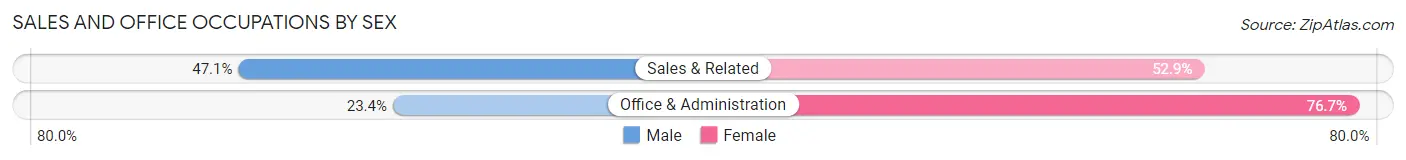
| Occupation | Male | Female |
| Sales & Related | 664 (47.1%) | 745 (52.9%) |
| Office & Administration | 445 (23.4%) | 1,461 (76.6%) |
| Total (Category) | 1,109 (33.5%) | 2,206 (66.5%) |
| Total (Overall) | 9,052 (53.7%) | 7,803 (46.3%) |
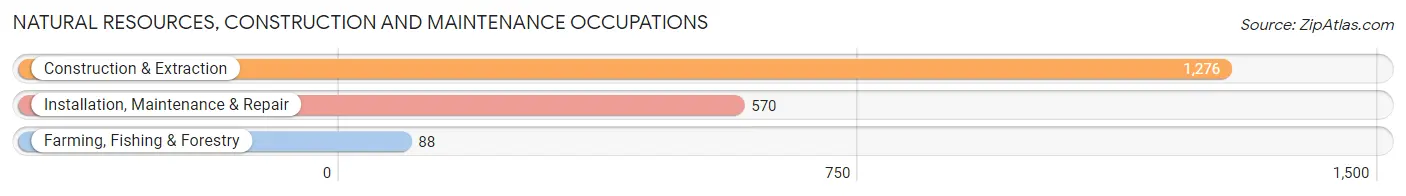
Natural Resources, Construction and Maintenance Occupations
The most common Natural Resources, Construction and Maintenance occupations in Fremont County are Construction & Extraction (1,276 | 7.6%), Installation, Maintenance & Repair (570 | 3.4%), and Farming, Fishing & Forestry (88 | 0.5%).
Natural Resources, Construction and Maintenance Occupations by Sex
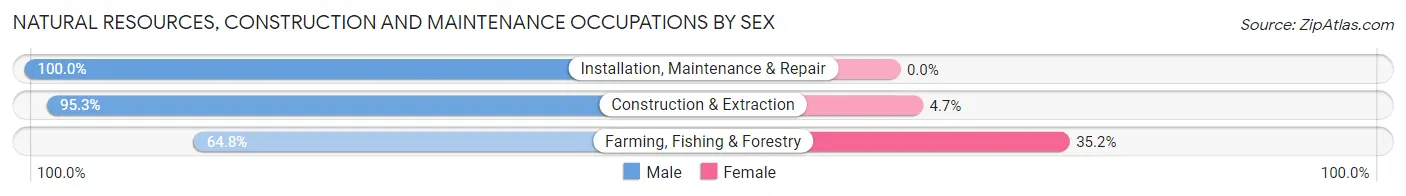
| Occupation | Male | Female |
| Farming, Fishing & Forestry | 57 (64.8%) | 31 (35.2%) |
| Construction & Extraction | 1,216 (95.3%) | 60 (4.7%) |
| Installation, Maintenance & Repair | 570 (100.0%) | 0 (0.0%) |
| Total (Category) | 1,843 (95.3%) | 91 (4.7%) |
| Total (Overall) | 9,052 (53.7%) | 7,803 (46.3%) |
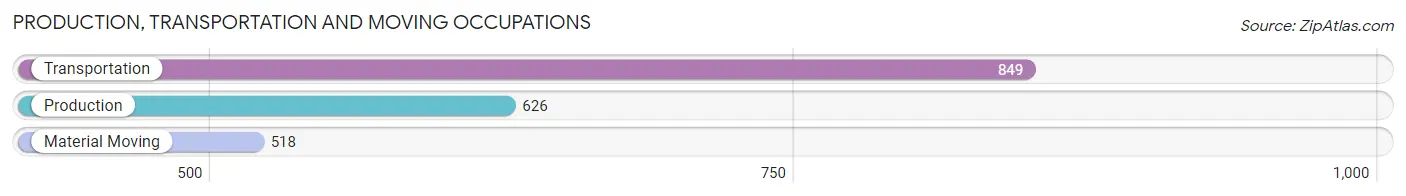
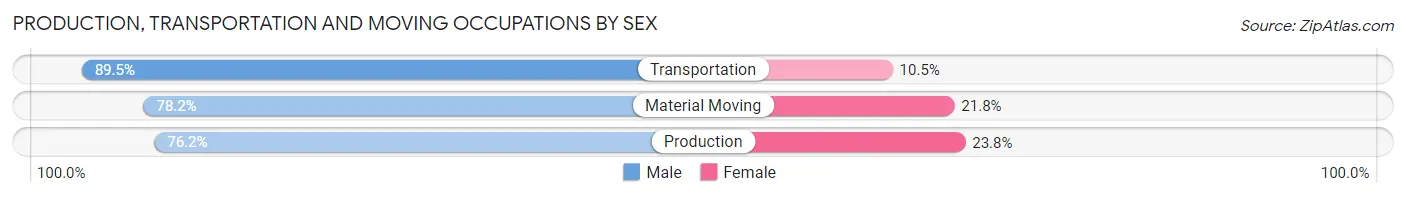
Production, Transportation and Moving Occupations
The most common Production, Transportation and Moving occupations in Fremont County are Transportation (849 | 5.0%), Production (626 | 3.7%), and Material Moving (518 | 3.1%).
Production, Transportation and Moving Occupations by Sex
| Occupation | Male | Female |
| Production | 477 (76.2%) | 149 (23.8%) |
| Transportation | 760 (89.5%) | 89 (10.5%) |
| Material Moving | 405 (78.2%) | 113 (21.8%) |
| Total (Category) | 1,642 (82.4%) | 351 (17.6%) |
| Total (Overall) | 9,052 (53.7%) | 7,803 (46.3%) |
Employment Industries by Sex in Fremont County
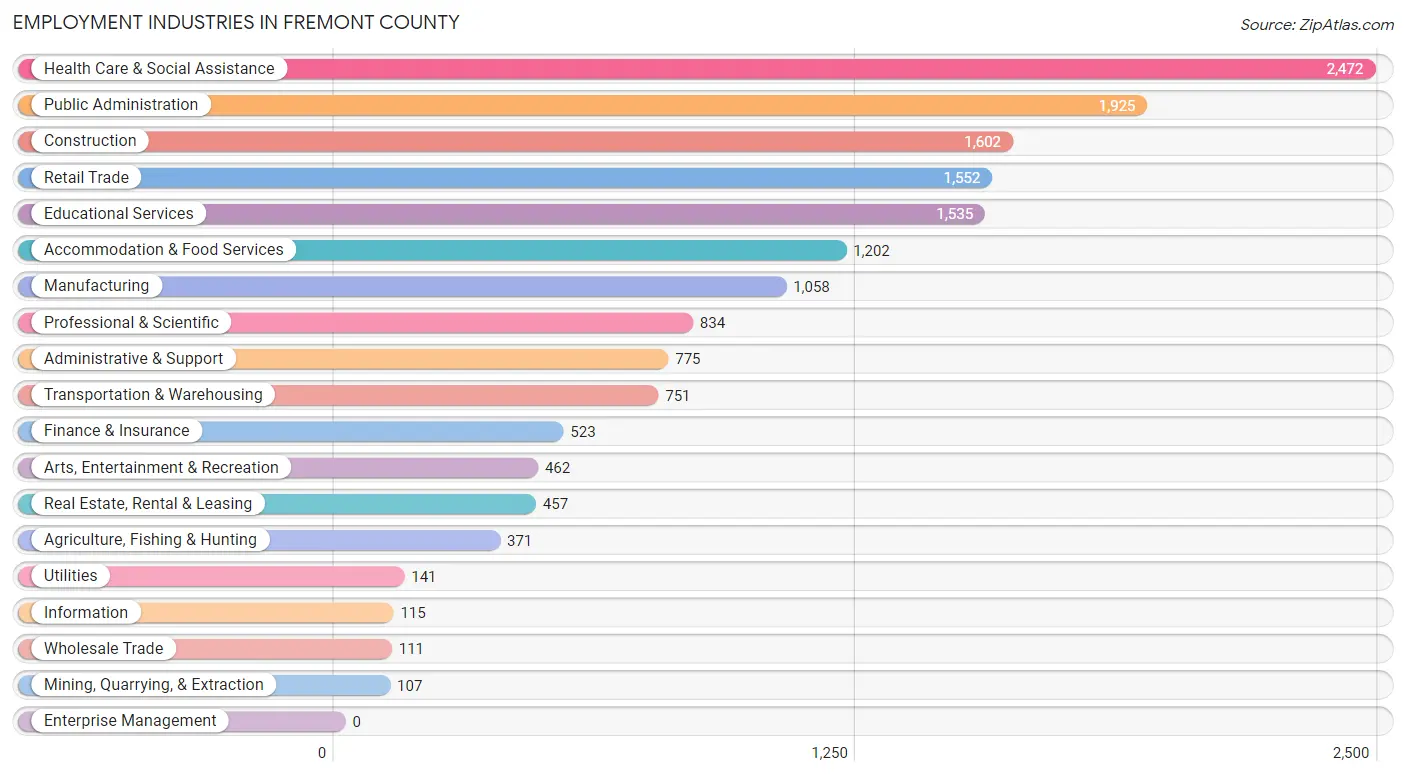
Employment Industries in Fremont County
The major employment industries in Fremont County include Health Care & Social Assistance (2,472 | 14.7%), Public Administration (1,925 | 11.4%), Construction (1,602 | 9.5%), Retail Trade (1,552 | 9.2%), and Educational Services (1,535 | 9.1%).
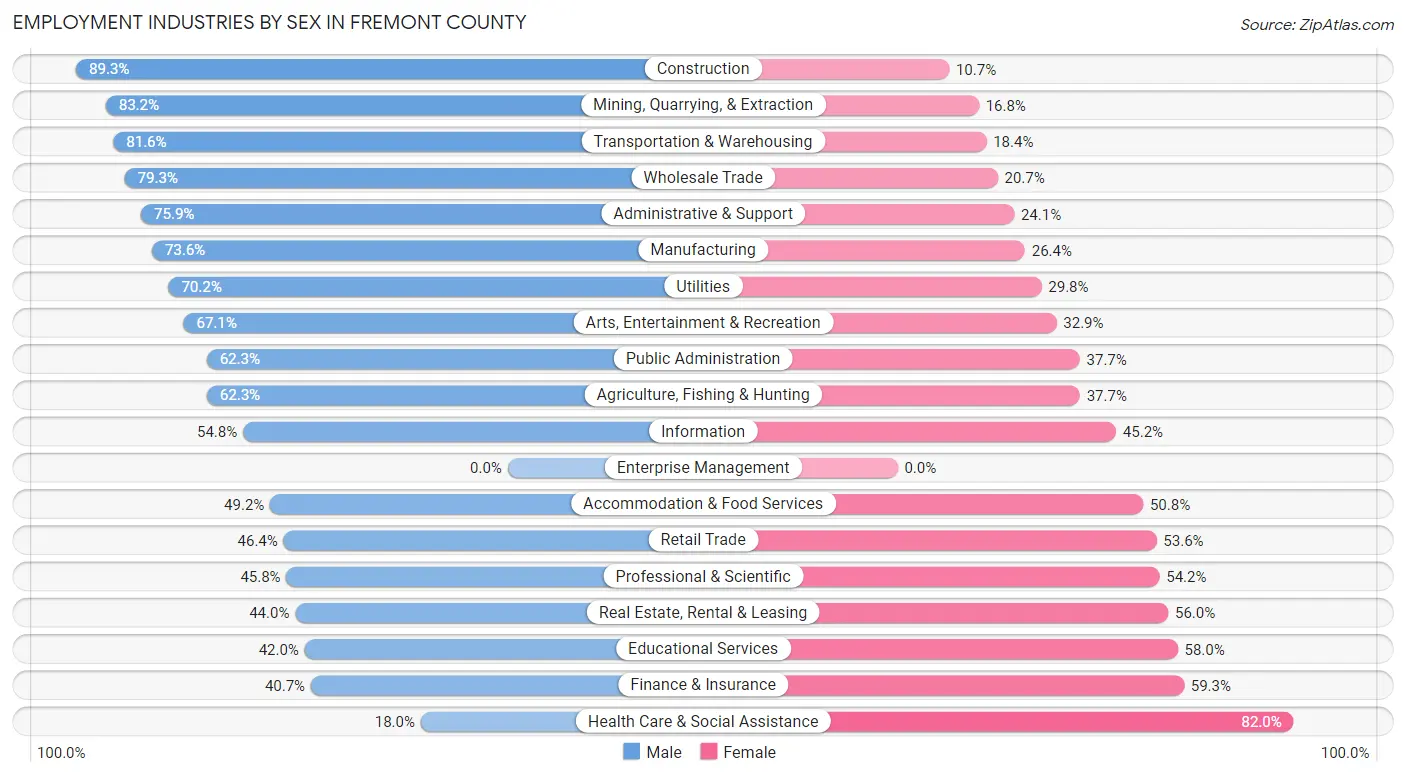
Employment Industries by Sex in Fremont County
The Fremont County industries that see more men than women are Construction (89.3%), Mining, Quarrying, & Extraction (83.2%), and Transportation & Warehousing (81.6%), whereas the industries that tend to have a higher number of women are Health Care & Social Assistance (82.0%), Finance & Insurance (59.3%), and Educational Services (58.0%).
| Industry | Male | Female |
| Agriculture, Fishing & Hunting | 231 (62.3%) | 140 (37.7%) |
| Mining, Quarrying, & Extraction | 89 (83.2%) | 18 (16.8%) |
| Construction | 1,431 (89.3%) | 171 (10.7%) |
| Manufacturing | 779 (73.6%) | 279 (26.4%) |
| Wholesale Trade | 88 (79.3%) | 23 (20.7%) |
| Retail Trade | 720 (46.4%) | 832 (53.6%) |
| Transportation & Warehousing | 613 (81.6%) | 138 (18.4%) |
| Utilities | 99 (70.2%) | 42 (29.8%) |
| Information | 63 (54.8%) | 52 (45.2%) |
| Finance & Insurance | 213 (40.7%) | 310 (59.3%) |
| Real Estate, Rental & Leasing | 201 (44.0%) | 256 (56.0%) |
| Professional & Scientific | 382 (45.8%) | 452 (54.2%) |
| Enterprise Management | 0 (0.0%) | 0 (0.0%) |
| Administrative & Support | 588 (75.9%) | 187 (24.1%) |
| Educational Services | 645 (42.0%) | 890 (58.0%) |
| Health Care & Social Assistance | 445 (18.0%) | 2,027 (82.0%) |
| Arts, Entertainment & Recreation | 310 (67.1%) | 152 (32.9%) |
| Accommodation & Food Services | 591 (49.2%) | 611 (50.8%) |
| Public Administration | 1,199 (62.3%) | 726 (37.7%) |
| Total | 9,052 (53.7%) | 7,803 (46.3%) |
Education in Fremont County
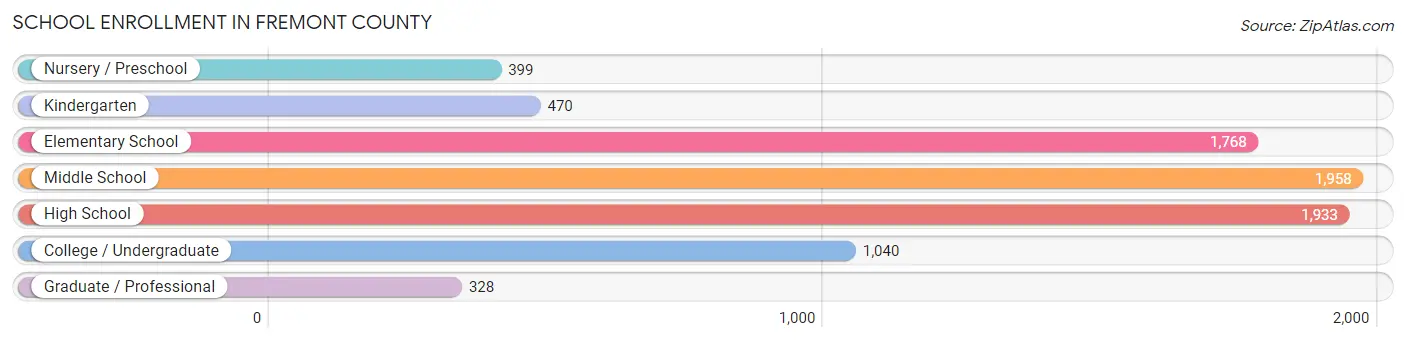
School Enrollment in Fremont County
The most common levels of schooling among the 7,896 students in Fremont County are middle school (1,958 | 24.8%), high school (1,933 | 24.5%), and elementary school (1,768 | 22.4%).
| School Level | # Students | % Students |
| Nursery / Preschool | 399 | 5.1% |
| Kindergarten | 470 | 5.9% |
| Elementary School | 1,768 | 22.4% |
| Middle School | 1,958 | 24.8% |
| High School | 1,933 | 24.5% |
| College / Undergraduate | 1,040 | 13.2% |
| Graduate / Professional | 328 | 4.2% |
| Total | 7,896 | 100.0% |
School Enrollment by Age by Funding Source in Fremont County
Out of a total of 7,896 students who are enrolled in schools in Fremont County, 979 (12.4%) attend a private institution, while the remaining 6,917 (87.6%) are enrolled in public schools. The age group of 20 to 24 year olds has the highest likelihood of being enrolled in private schools, with 41 (24.7% in the age bracket) enrolled. Conversely, the age group of 15 to 17 year olds has the lowest likelihood of being enrolled in a private school, with 1,318 (93.6% in the age bracket) attending a public institution.

| Age Bracket | Public School | Private School |
| 3 to 4 Year Olds | 297 (83.2%) | 60 (16.8%) |
| 5 to 9 Year Old | 1,741 (86.2%) | 279 (13.8%) |
| 10 to 14 Year Olds | 2,062 (88.8%) | 260 (11.2%) |
| 15 to 17 Year Olds | 1,318 (93.6%) | 90 (6.4%) |
| 18 to 19 Year Olds | 508 (92.7%) | 40 (7.3%) |
| 20 to 24 Year Olds | 125 (75.3%) | 41 (24.7%) |
| 25 to 34 Year Olds | 461 (78.5%) | 126 (21.5%) |
| 35 Years and over | 401 (82.2%) | 87 (17.8%) |
| Total | 6,917 (87.6%) | 979 (12.4%) |
Educational Attainment by Field of Study in Fremont County
Business (1,275 | 14.9%), education (1,166 | 13.7%), arts & humanities (901 | 10.5%), social sciences (824 | 9.7%), and science & technology (707 | 8.3%) are the most common fields of study among 8,537 individuals in Fremont County who have obtained a bachelor's degree or higher.
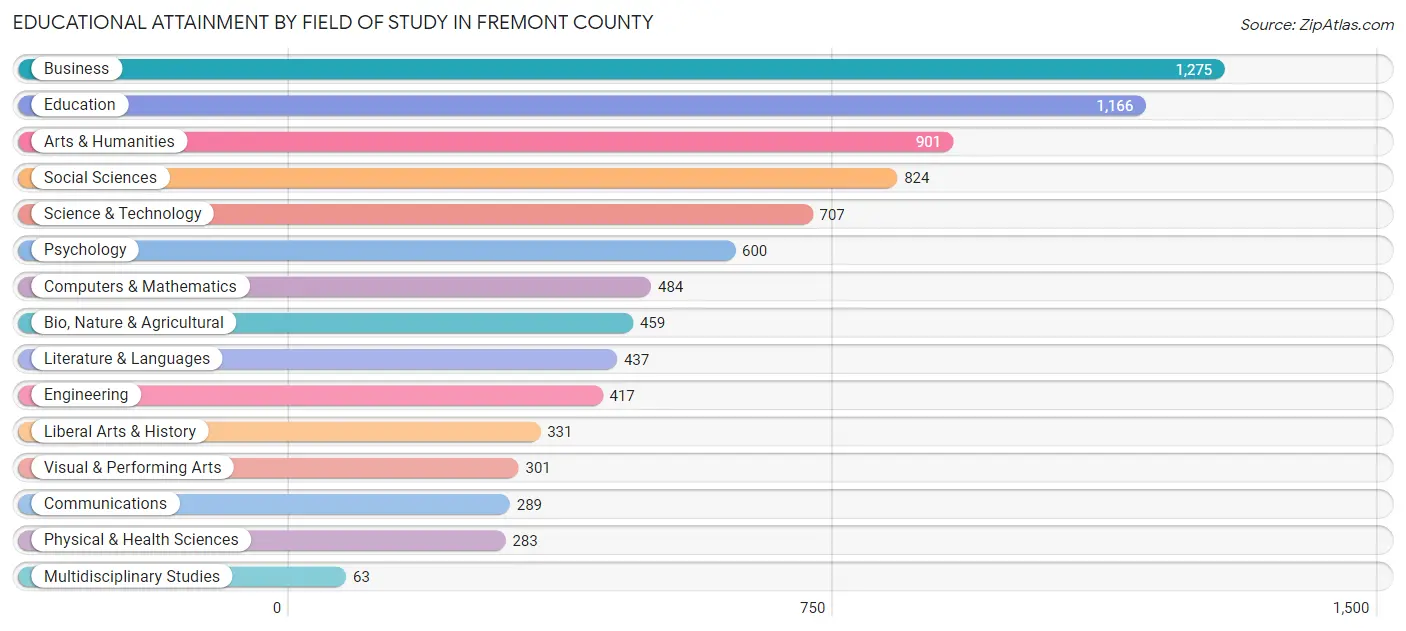
| Field of Study | # Graduates | % Graduates |
| Computers & Mathematics | 484 | 5.7% |
| Bio, Nature & Agricultural | 459 | 5.4% |
| Physical & Health Sciences | 283 | 3.3% |
| Psychology | 600 | 7.0% |
| Social Sciences | 824 | 9.7% |
| Engineering | 417 | 4.9% |
| Multidisciplinary Studies | 63 | 0.7% |
| Science & Technology | 707 | 8.3% |
| Business | 1,275 | 14.9% |
| Education | 1,166 | 13.7% |
| Literature & Languages | 437 | 5.1% |
| Liberal Arts & History | 331 | 3.9% |
| Visual & Performing Arts | 301 | 3.5% |
| Communications | 289 | 3.4% |
| Arts & Humanities | 901 | 10.5% |
| Total | 8,537 | 100.0% |
Transportation & Commute in Fremont County
Vehicle Availability by Sex in Fremont County
The most prevalent vehicle ownership categories in Fremont County are males with 2 vehicles (2,992, accounting for 33.1%) and females with 2 vehicles (2,318, making up 39.3%).
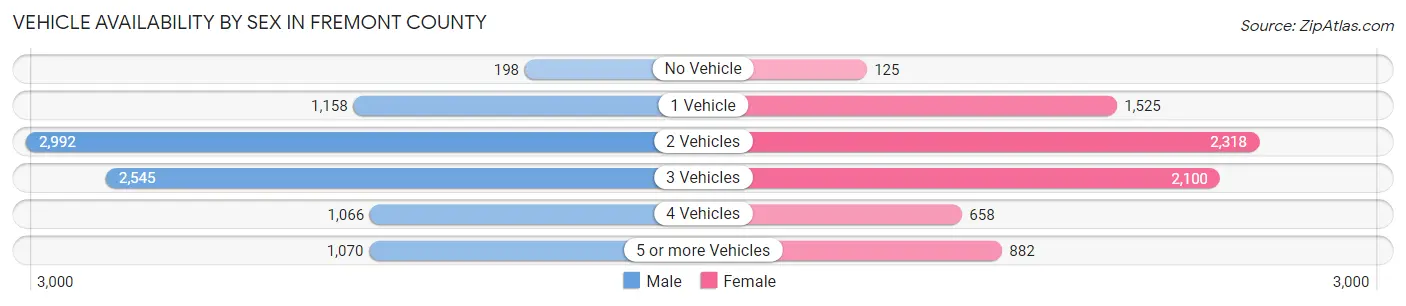
| Vehicles Available | Male | Female |
| No Vehicle | 198 (2.2%) | 125 (1.6%) |
| 1 Vehicle | 1,158 (12.8%) | 1,525 (20.0%) |
| 2 Vehicles | 2,992 (33.1%) | 2,318 (30.5%) |
| 3 Vehicles | 2,545 (28.2%) | 2,100 (27.6%) |
| 4 Vehicles | 1,066 (11.8%) | 658 (8.6%) |
| 5 or more Vehicles | 1,070 (11.8%) | 882 (11.6%) |
| Total | 9,029 (100.0%) | 7,608 (100.0%) |
Commute Time in Fremont County
The most frequently occuring commute durations in Fremont County are 5 to 9 minutes (2,665 commuters, 18.0%), 10 to 14 minutes (2,629 commuters, 17.8%), and 15 to 19 minutes (2,290 commuters, 15.5%).
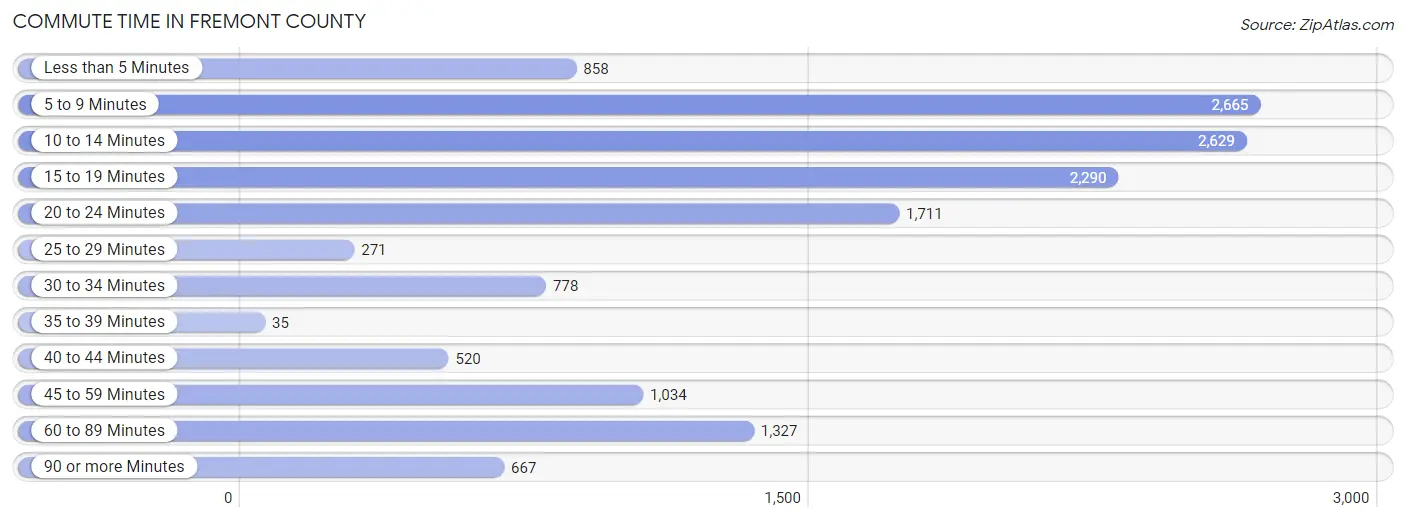
| Commute Time | # Commuters | % Commuters |
| Less than 5 Minutes | 858 | 5.8% |
| 5 to 9 Minutes | 2,665 | 18.0% |
| 10 to 14 Minutes | 2,629 | 17.8% |
| 15 to 19 Minutes | 2,290 | 15.5% |
| 20 to 24 Minutes | 1,711 | 11.6% |
| 25 to 29 Minutes | 271 | 1.8% |
| 30 to 34 Minutes | 778 | 5.3% |
| 35 to 39 Minutes | 35 | 0.2% |
| 40 to 44 Minutes | 520 | 3.5% |
| 45 to 59 Minutes | 1,034 | 7.0% |
| 60 to 89 Minutes | 1,327 | 9.0% |
| 90 or more Minutes | 667 | 4.5% |
Commute Time by Sex in Fremont County
The most common commute times in Fremont County are 15 to 19 minutes (1,474 commuters, 17.9%) for males and 5 to 9 minutes (1,464 commuters, 22.3%) for females.
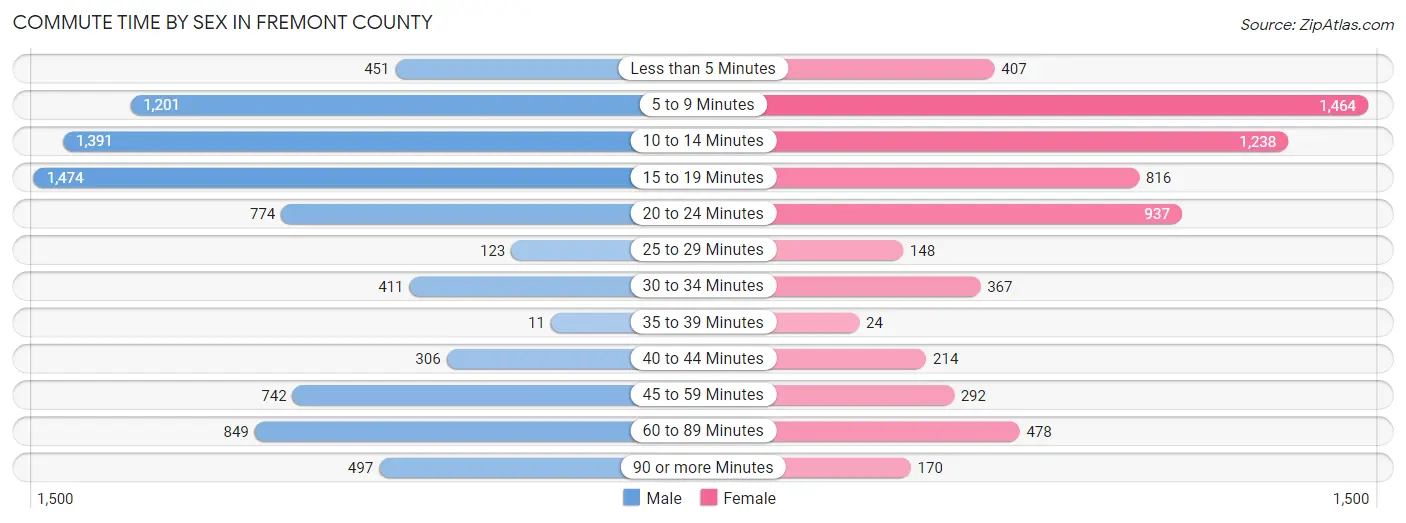
| Commute Time | Male | Female |
| Less than 5 Minutes | 451 (5.5%) | 407 (6.2%) |
| 5 to 9 Minutes | 1,201 (14.6%) | 1,464 (22.3%) |
| 10 to 14 Minutes | 1,391 (16.9%) | 1,238 (18.9%) |
| 15 to 19 Minutes | 1,474 (17.9%) | 816 (12.4%) |
| 20 to 24 Minutes | 774 (9.4%) | 937 (14.3%) |
| 25 to 29 Minutes | 123 (1.5%) | 148 (2.3%) |
| 30 to 34 Minutes | 411 (5.0%) | 367 (5.6%) |
| 35 to 39 Minutes | 11 (0.1%) | 24 (0.4%) |
| 40 to 44 Minutes | 306 (3.7%) | 214 (3.3%) |
| 45 to 59 Minutes | 742 (9.0%) | 292 (4.4%) |
| 60 to 89 Minutes | 849 (10.3%) | 478 (7.3%) |
| 90 or more Minutes | 497 (6.0%) | 170 (2.6%) |
Time of Departure to Work by Sex in Fremont County
The most frequent times of departure to work in Fremont County are 7:00 AM to 7:29 AM (1,142, 13.9%) for males and 7:30 AM to 7:59 AM (1,401, 21.4%) for females.
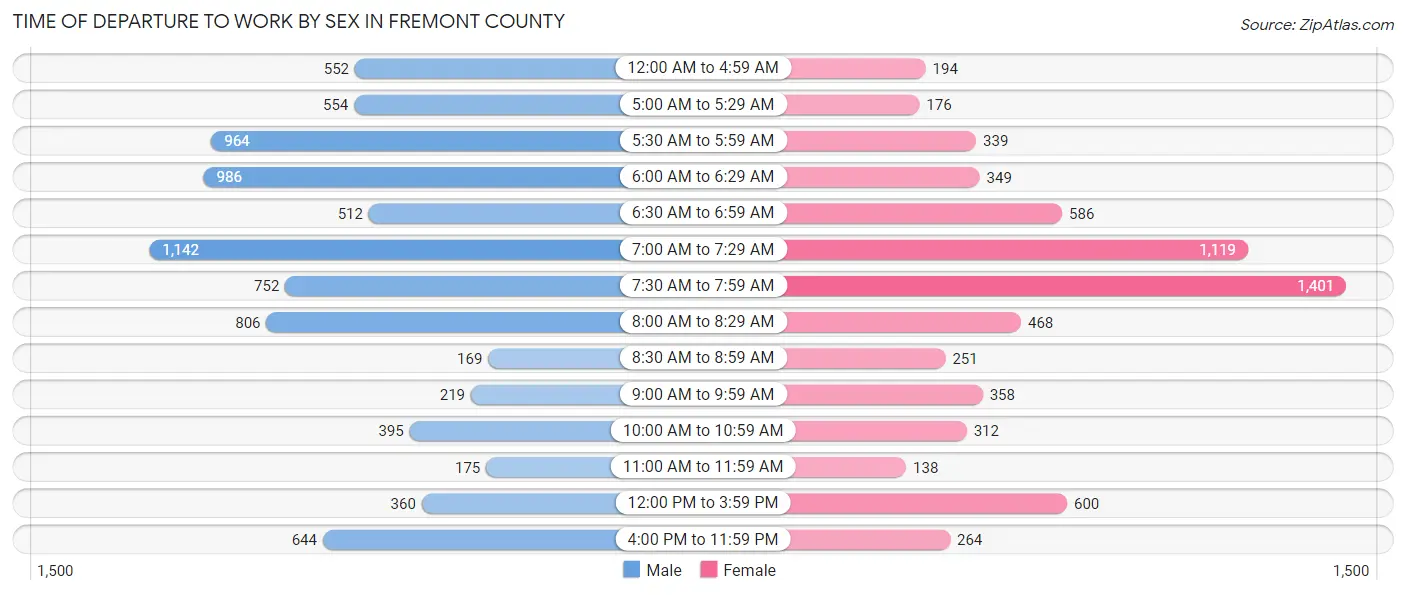
| Time of Departure | Male | Female |
| 12:00 AM to 4:59 AM | 552 (6.7%) | 194 (3.0%) |
| 5:00 AM to 5:29 AM | 554 (6.7%) | 176 (2.7%) |
| 5:30 AM to 5:59 AM | 964 (11.7%) | 339 (5.2%) |
| 6:00 AM to 6:29 AM | 986 (12.0%) | 349 (5.3%) |
| 6:30 AM to 6:59 AM | 512 (6.2%) | 586 (8.9%) |
| 7:00 AM to 7:29 AM | 1,142 (13.9%) | 1,119 (17.1%) |
| 7:30 AM to 7:59 AM | 752 (9.1%) | 1,401 (21.4%) |
| 8:00 AM to 8:29 AM | 806 (9.8%) | 468 (7.1%) |
| 8:30 AM to 8:59 AM | 169 (2.1%) | 251 (3.8%) |
| 9:00 AM to 9:59 AM | 219 (2.7%) | 358 (5.5%) |
| 10:00 AM to 10:59 AM | 395 (4.8%) | 312 (4.8%) |
| 11:00 AM to 11:59 AM | 175 (2.1%) | 138 (2.1%) |
| 12:00 PM to 3:59 PM | 360 (4.4%) | 600 (9.1%) |
| 4:00 PM to 11:59 PM | 644 (7.8%) | 264 (4.0%) |
| Total | 8,230 (100.0%) | 6,555 (100.0%) |
Housing Occupancy in Fremont County
Occupancy by Ownership in Fremont County
Of the total 17,677 dwellings in Fremont County, owner-occupied units account for 13,326 (75.4%), while renter-occupied units make up 4,351 (24.6%).
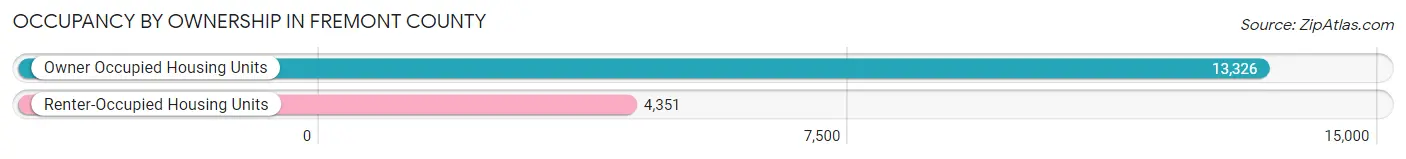
| Occupancy | # Housing Units | % Housing Units |
| Owner Occupied Housing Units | 13,326 | 75.4% |
| Renter-Occupied Housing Units | 4,351 | 24.6% |
| Total Occupied Housing Units | 17,677 | 100.0% |
Occupancy by Household Size in Fremont County
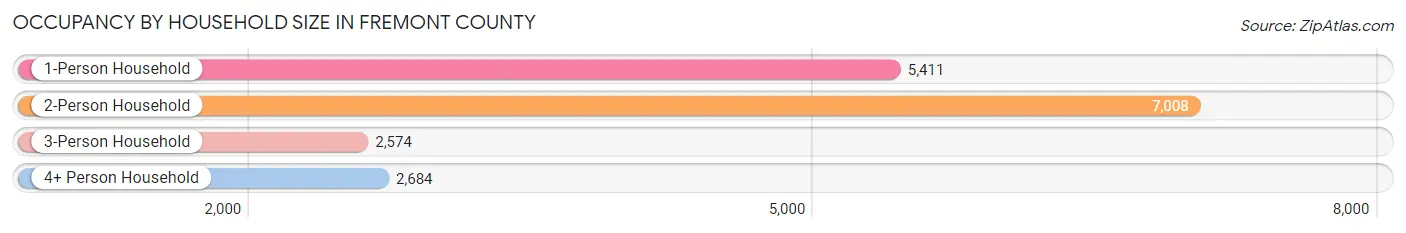
| Household Size | # Housing Units | % Housing Units |
| 1-Person Household | 5,411 | 30.6% |
| 2-Person Household | 7,008 | 39.6% |
| 3-Person Household | 2,574 | 14.6% |
| 4+ Person Household | 2,684 | 15.2% |
| Total Housing Units | 17,677 | 100.0% |
Occupancy by Ownership by Household Size in Fremont County
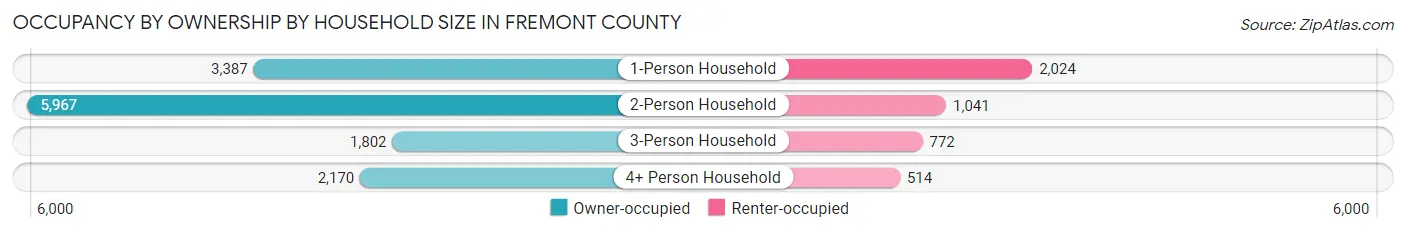
| Household Size | Owner-occupied | Renter-occupied |
| 1-Person Household | 3,387 (62.6%) | 2,024 (37.4%) |
| 2-Person Household | 5,967 (85.2%) | 1,041 (14.8%) |
| 3-Person Household | 1,802 (70.0%) | 772 (30.0%) |
| 4+ Person Household | 2,170 (80.8%) | 514 (19.2%) |
| Total Housing Units | 13,326 (75.4%) | 4,351 (24.6%) |
Occupancy by Educational Attainment in Fremont County
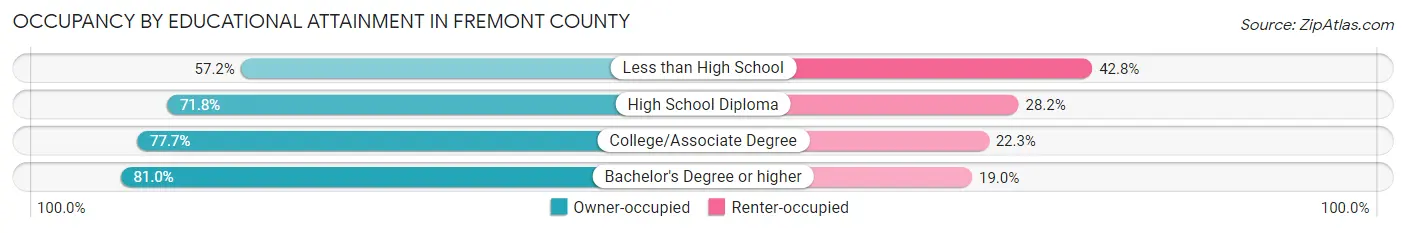
| Household Size | Owner-occupied | Renter-occupied |
| Less than High School | 706 (57.2%) | 529 (42.8%) |
| High School Diploma | 3,630 (71.8%) | 1,428 (28.2%) |
| College/Associate Degree | 5,403 (77.7%) | 1,552 (22.3%) |
| Bachelor's Degree or higher | 3,587 (81.0%) | 842 (19.0%) |
Occupancy by Age of Householder in Fremont County
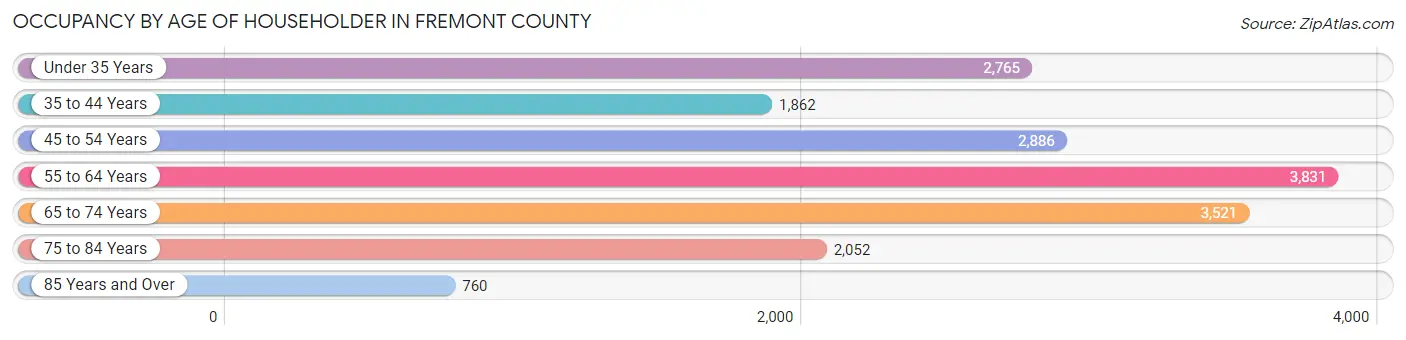
| Age Bracket | # Households | % Households |
| Under 35 Years | 2,765 | 15.6% |
| 35 to 44 Years | 1,862 | 10.5% |
| 45 to 54 Years | 2,886 | 16.3% |
| 55 to 64 Years | 3,831 | 21.7% |
| 65 to 74 Years | 3,521 | 19.9% |
| 75 to 84 Years | 2,052 | 11.6% |
| 85 Years and Over | 760 | 4.3% |
| Total | 17,677 | 100.0% |
Housing Finances in Fremont County
Median Income by Occupancy in Fremont County
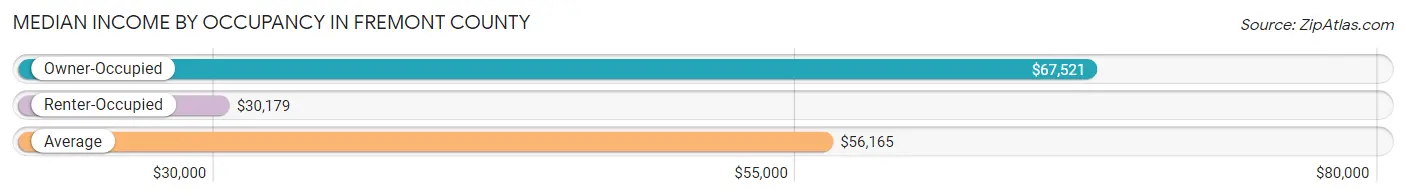
| Occupancy Type | # Households | Median Income |
| Owner-Occupied | 13,326 (75.4%) | $67,521 |
| Renter-Occupied | 4,351 (24.6%) | $30,179 |
| Average | 17,677 (100.0%) | $56,165 |
Occupancy by Householder Income Bracket in Fremont County
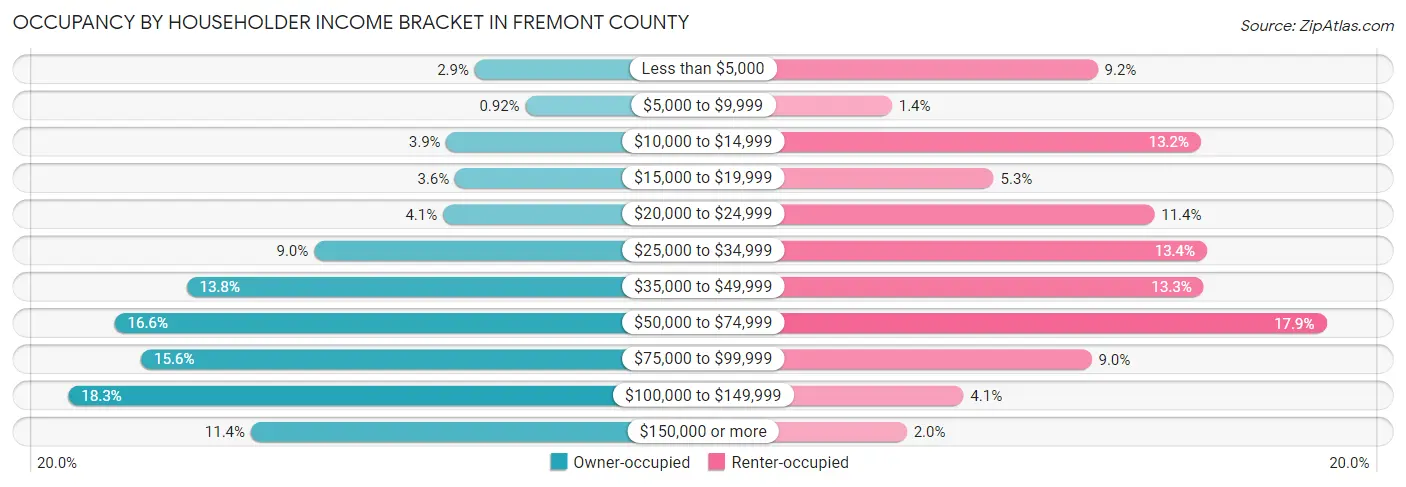
| Income Bracket | Owner-occupied | Renter-occupied |
| Less than $5,000 | 380 (2.9%) | 401 (9.2%) |
| $5,000 to $9,999 | 122 (0.9%) | 60 (1.4%) |
| $10,000 to $14,999 | 524 (3.9%) | 572 (13.2%) |
| $15,000 to $19,999 | 480 (3.6%) | 229 (5.3%) |
| $20,000 to $24,999 | 541 (4.1%) | 495 (11.4%) |
| $25,000 to $34,999 | 1,196 (9.0%) | 582 (13.4%) |
| $35,000 to $49,999 | 1,843 (13.8%) | 577 (13.3%) |
| $50,000 to $74,999 | 2,208 (16.6%) | 780 (17.9%) |
| $75,000 to $99,999 | 2,073 (15.6%) | 391 (9.0%) |
| $100,000 to $149,999 | 2,443 (18.3%) | 179 (4.1%) |
| $150,000 or more | 1,516 (11.4%) | 85 (1.9%) |
| Total | 13,326 (100.0%) | 4,351 (100.0%) |
Monthly Housing Cost Tiers in Fremont County
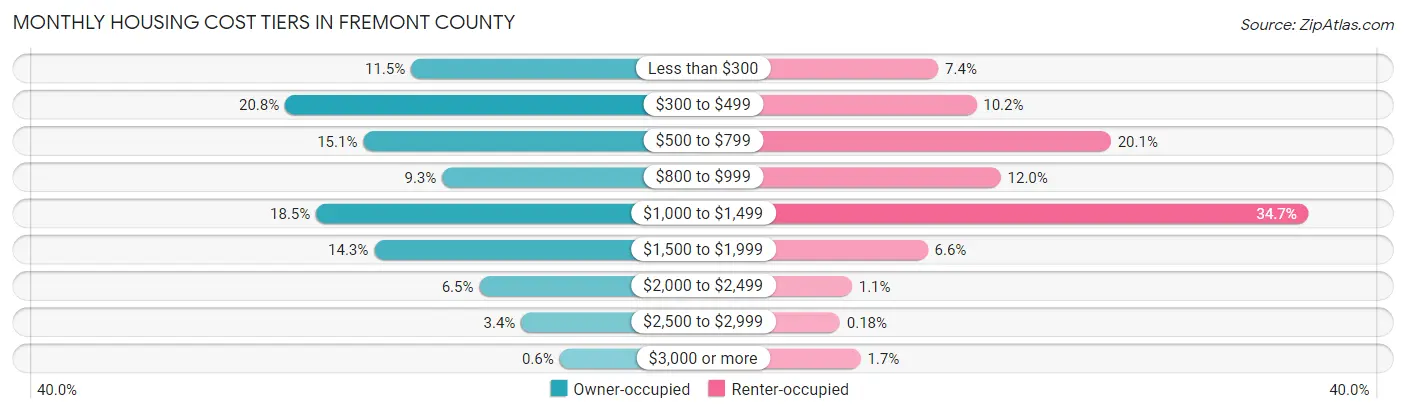
| Monthly Cost | Owner-occupied | Renter-occupied |
| Less than $300 | 1,538 (11.5%) | 323 (7.4%) |
| $300 to $499 | 2,775 (20.8%) | 445 (10.2%) |
| $500 to $799 | 2,007 (15.1%) | 876 (20.1%) |
| $800 to $999 | 1,232 (9.2%) | 523 (12.0%) |
| $1,000 to $1,499 | 2,469 (18.5%) | 1,510 (34.7%) |
| $1,500 to $1,999 | 1,900 (14.3%) | 289 (6.6%) |
| $2,000 to $2,499 | 868 (6.5%) | 46 (1.1%) |
| $2,500 to $2,999 | 457 (3.4%) | 8 (0.2%) |
| $3,000 or more | 80 (0.6%) | 74 (1.7%) |
| Total | 13,326 (100.0%) | 4,351 (100.0%) |
Physical Housing Characteristics in Fremont County
Housing Structures in Fremont County
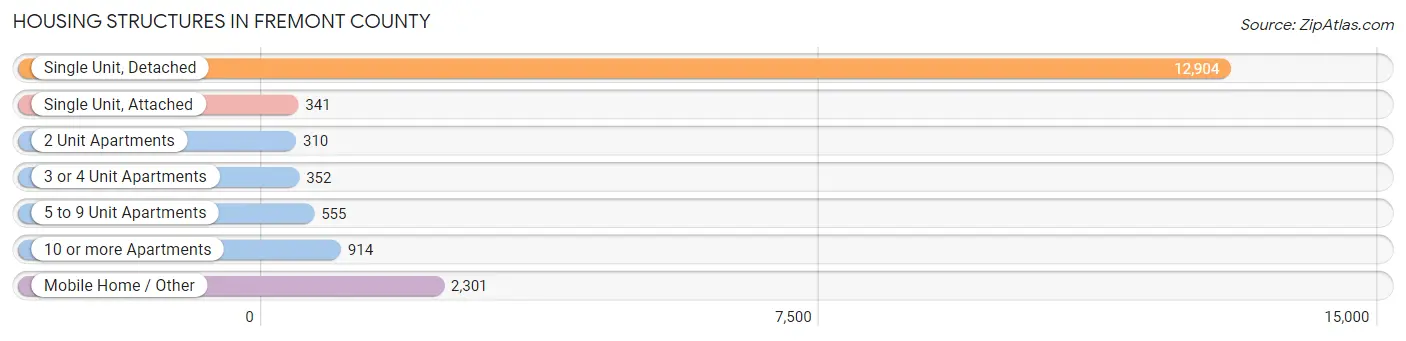
| Structure Type | # Housing Units | % Housing Units |
| Single Unit, Detached | 12,904 | 73.0% |
| Single Unit, Attached | 341 | 1.9% |
| 2 Unit Apartments | 310 | 1.8% |
| 3 or 4 Unit Apartments | 352 | 2.0% |
| 5 to 9 Unit Apartments | 555 | 3.1% |
| 10 or more Apartments | 914 | 5.2% |
| Mobile Home / Other | 2,301 | 13.0% |
| Total | 17,677 | 100.0% |
Housing Structures by Occupancy in Fremont County
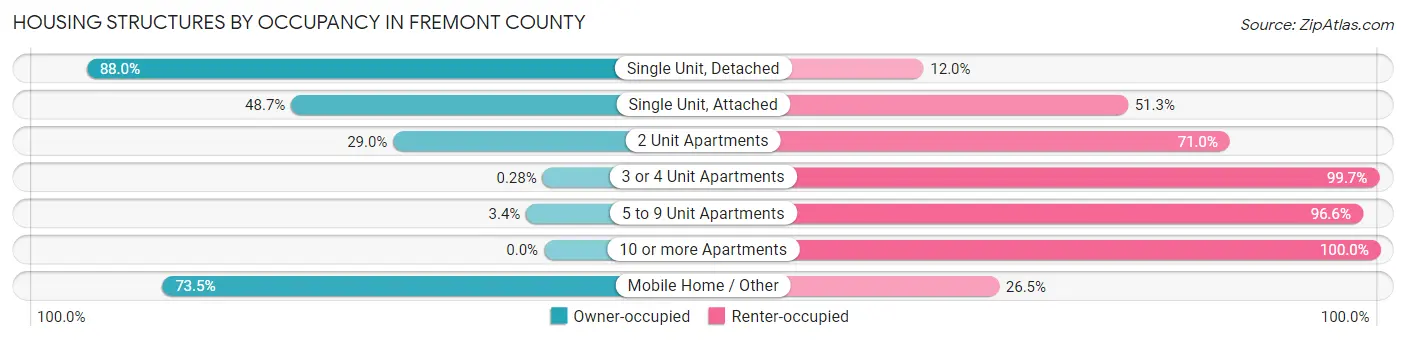
| Structure Type | Owner-occupied | Renter-occupied |
| Single Unit, Detached | 11,359 (88.0%) | 1,545 (12.0%) |
| Single Unit, Attached | 166 (48.7%) | 175 (51.3%) |
| 2 Unit Apartments | 90 (29.0%) | 220 (71.0%) |
| 3 or 4 Unit Apartments | 1 (0.3%) | 351 (99.7%) |
| 5 to 9 Unit Apartments | 19 (3.4%) | 536 (96.6%) |
| 10 or more Apartments | 0 (0.0%) | 914 (100.0%) |
| Mobile Home / Other | 1,691 (73.5%) | 610 (26.5%) |
| Total | 13,326 (75.4%) | 4,351 (24.6%) |
Housing Structures by Number of Rooms in Fremont County
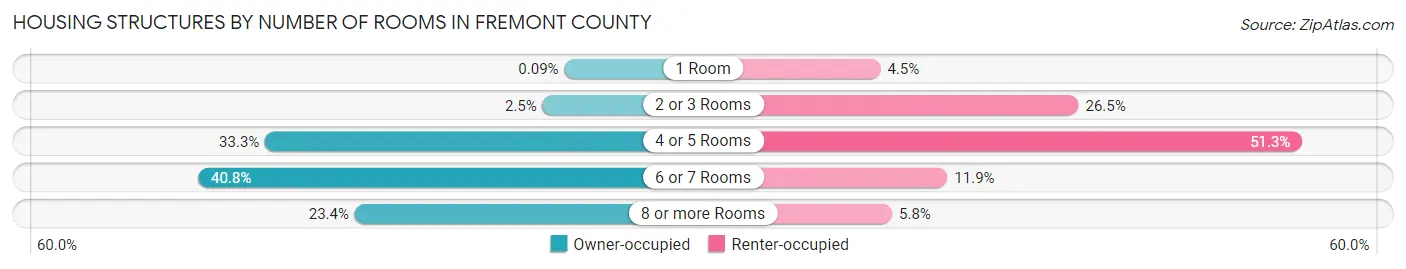
| Number of Rooms | Owner-occupied | Renter-occupied |
| 1 Room | 12 (0.1%) | 196 (4.5%) |
| 2 or 3 Rooms | 335 (2.5%) | 1,152 (26.5%) |
| 4 or 5 Rooms | 4,437 (33.3%) | 2,232 (51.3%) |
| 6 or 7 Rooms | 5,431 (40.7%) | 519 (11.9%) |
| 8 or more Rooms | 3,111 (23.4%) | 252 (5.8%) |
| Total | 13,326 (100.0%) | 4,351 (100.0%) |
Housing Structure by Heating Type in Fremont County
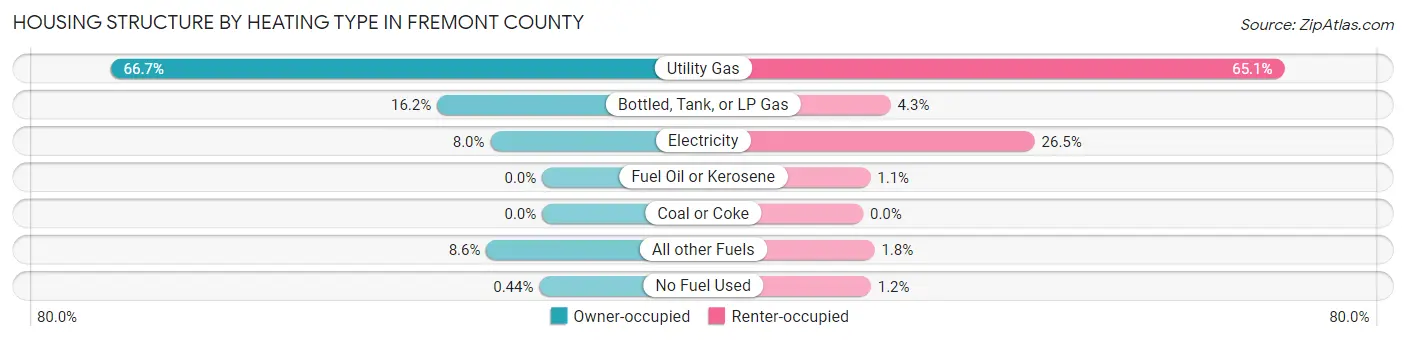
| Heating Type | Owner-occupied | Renter-occupied |
| Utility Gas | 8,888 (66.7%) | 2,833 (65.1%) |
| Bottled, Tank, or LP Gas | 2,164 (16.2%) | 186 (4.3%) |
| Electricity | 1,066 (8.0%) | 1,154 (26.5%) |
| Fuel Oil or Kerosene | 0 (0.0%) | 49 (1.1%) |
| Coal or Coke | 0 (0.0%) | 0 (0.0%) |
| All other Fuels | 1,150 (8.6%) | 77 (1.8%) |
| No Fuel Used | 58 (0.4%) | 52 (1.2%) |
| Total | 13,326 (100.0%) | 4,351 (100.0%) |
Household Vehicle Usage in Fremont County
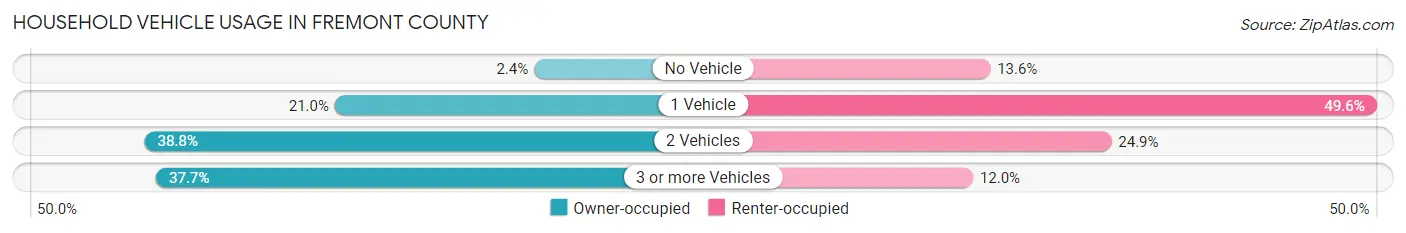
| Vehicles per Household | Owner-occupied | Renter-occupied |
| No Vehicle | 325 (2.4%) | 590 (13.6%) |
| 1 Vehicle | 2,804 (21.0%) | 2,159 (49.6%) |
| 2 Vehicles | 5,171 (38.8%) | 1,082 (24.9%) |
| 3 or more Vehicles | 5,026 (37.7%) | 520 (11.9%) |
| Total | 13,326 (100.0%) | 4,351 (100.0%) |
Real Estate & Mortgages in Fremont County
Real Estate and Mortgage Overview in Fremont County
| Characteristic | Without Mortgage | With Mortgage |
| Housing Units | 6,072 | 7,254 |
| Median Property Value | $260,500 | $268,000 |
| Median Household Income | $52,443 | $1,033 |
| Monthly Housing Costs | $421 | $80 |
| Real Estate Taxes | $972 | $94 |
Property Value by Mortgage Status in Fremont County
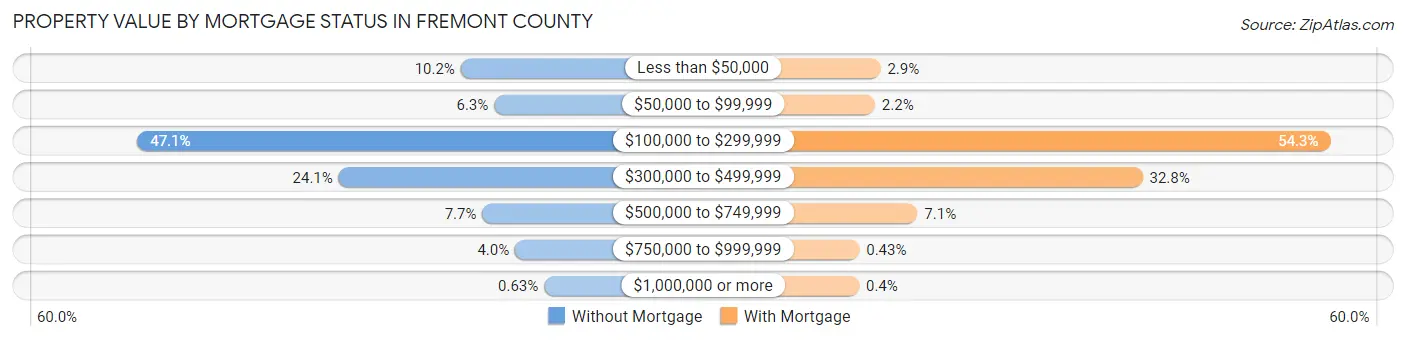
| Property Value | Without Mortgage | With Mortgage |
| Less than $50,000 | 617 (10.2%) | 207 (2.9%) |
| $50,000 to $99,999 | 385 (6.3%) | 160 (2.2%) |
| $100,000 to $299,999 | 2,861 (47.1%) | 3,935 (54.2%) |
| $300,000 to $499,999 | 1,464 (24.1%) | 2,379 (32.8%) |
| $500,000 to $749,999 | 467 (7.7%) | 513 (7.1%) |
| $750,000 to $999,999 | 240 (4.0%) | 31 (0.4%) |
| $1,000,000 or more | 38 (0.6%) | 29 (0.4%) |
| Total | 6,072 (100.0%) | 7,254 (100.0%) |
Household Income by Mortgage Status in Fremont County
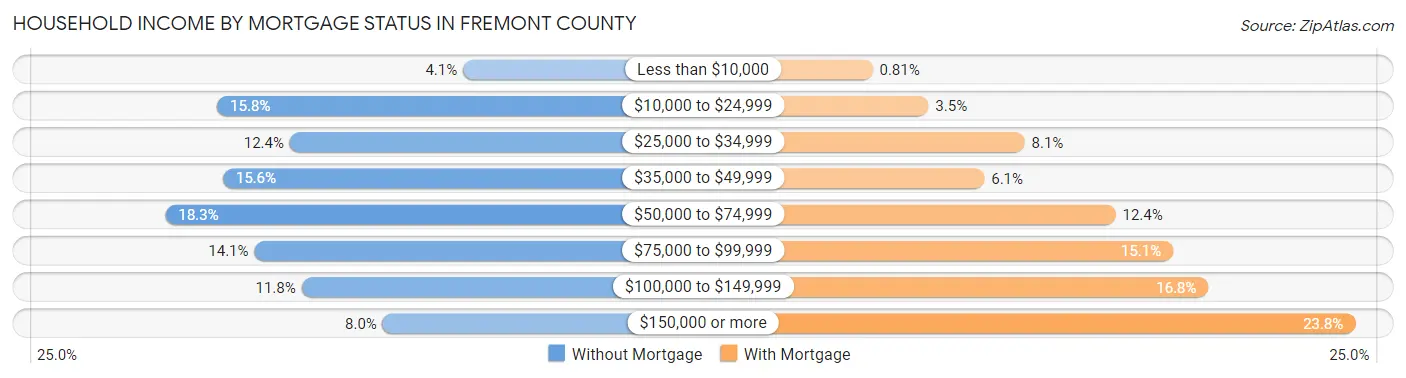
| Household Income | Without Mortgage | With Mortgage |
| Less than $10,000 | 250 (4.1%) | 59 (0.8%) |
| $10,000 to $24,999 | 961 (15.8%) | 252 (3.5%) |
| $25,000 to $34,999 | 751 (12.4%) | 584 (8.1%) |
| $35,000 to $49,999 | 945 (15.6%) | 445 (6.1%) |
| $50,000 to $74,999 | 1,111 (18.3%) | 898 (12.4%) |
| $75,000 to $99,999 | 854 (14.1%) | 1,097 (15.1%) |
| $100,000 to $149,999 | 717 (11.8%) | 1,219 (16.8%) |
| $150,000 or more | 483 (8.0%) | 1,726 (23.8%) |
| Total | 6,072 (100.0%) | 7,254 (100.0%) |
Property Value to Household Income Ratio in Fremont County
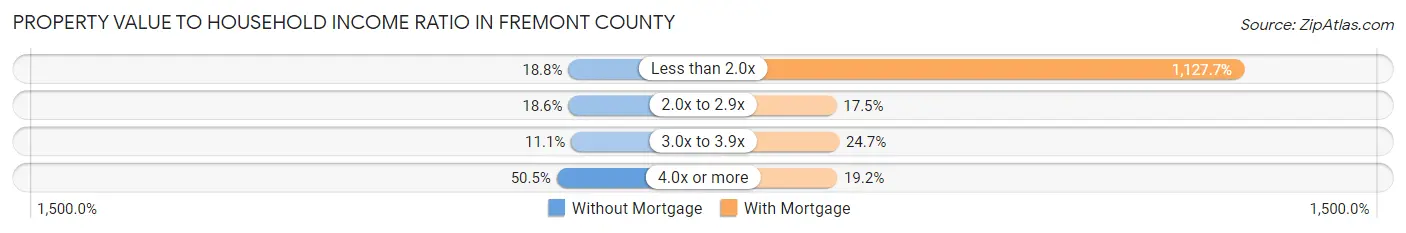
| Value-to-Income Ratio | Without Mortgage | With Mortgage |
| Less than 2.0x | 1,144 (18.8%) | 81,800 (1,127.7%) |
| 2.0x to 2.9x | 1,132 (18.6%) | 1,267 (17.5%) |
| 3.0x to 3.9x | 675 (11.1%) | 1,794 (24.7%) |
| 4.0x or more | 3,066 (50.5%) | 1,394 (19.2%) |
| Total | 6,072 (100.0%) | 7,254 (100.0%) |
Real Estate Taxes by Mortgage Status in Fremont County
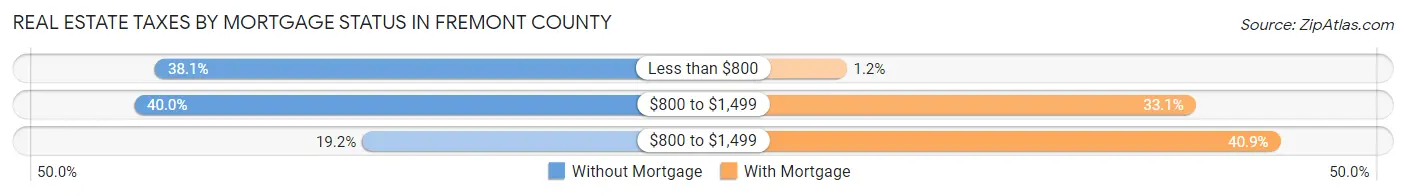
| Property Taxes | Without Mortgage | With Mortgage |
| Less than $800 | 2,312 (38.1%) | 89 (1.2%) |
| $800 to $1,499 | 2,429 (40.0%) | 2,401 (33.1%) |
| $800 to $1,499 | 1,165 (19.2%) | 2,963 (40.8%) |
| Total | 6,072 (100.0%) | 7,254 (100.0%) |
Health & Disability in Fremont County
Health Insurance Coverage by Age in Fremont County
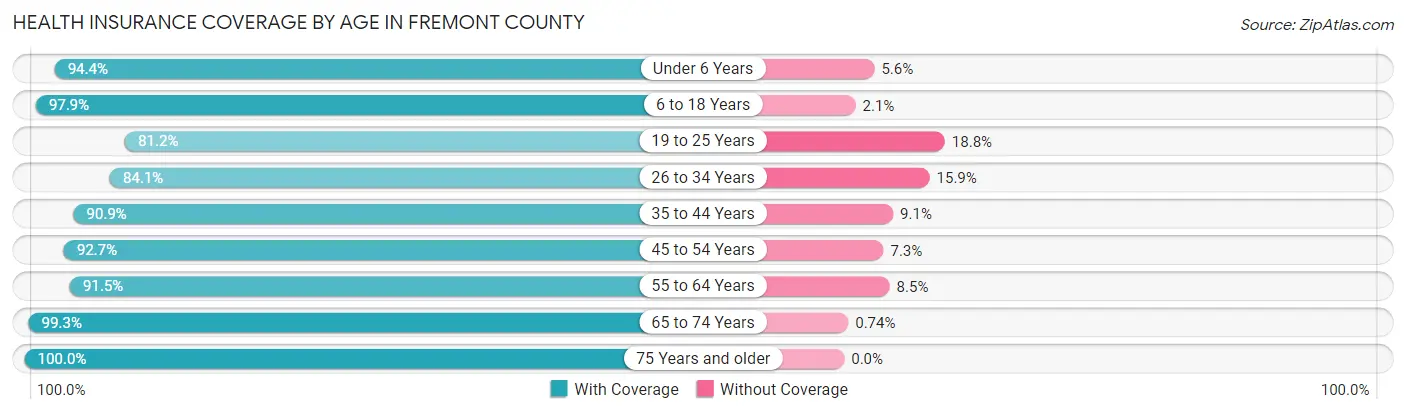
| Age Bracket | With Coverage | Without Coverage |
| Under 6 Years | 2,249 (94.4%) | 134 (5.6%) |
| 6 to 18 Years | 5,764 (97.9%) | 124 (2.1%) |
| 19 to 25 Years | 2,304 (81.2%) | 532 (18.8%) |
| 26 to 34 Years | 3,710 (84.1%) | 702 (15.9%) |
| 35 to 44 Years | 3,480 (90.9%) | 349 (9.1%) |
| 45 to 54 Years | 4,608 (92.7%) | 364 (7.3%) |
| 55 to 64 Years | 5,810 (91.5%) | 537 (8.5%) |
| 65 to 74 Years | 5,902 (99.3%) | 44 (0.7%) |
| 75 Years and older | 4,008 (100.0%) | 0 (0.0%) |
| Total | 37,835 (93.1%) | 2,786 (6.9%) |
Health Insurance Coverage by Citizenship Status in Fremont County
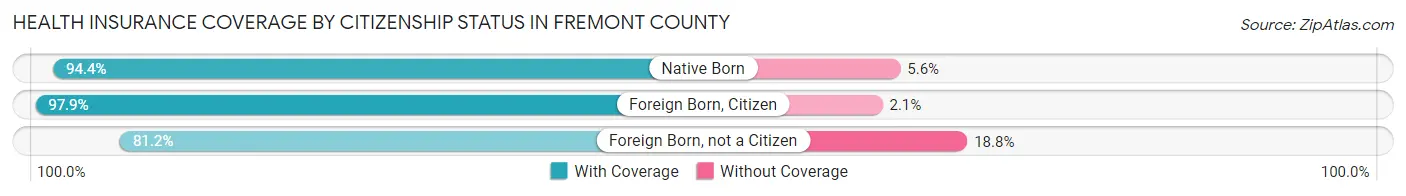
| Citizenship Status | With Coverage | Without Coverage |
| Native Born | 2,249 (94.4%) | 134 (5.6%) |
| Foreign Born, Citizen | 5,764 (97.9%) | 124 (2.1%) |
| Foreign Born, not a Citizen | 2,304 (81.2%) | 532 (18.8%) |
Health Insurance Coverage by Household Income in Fremont County
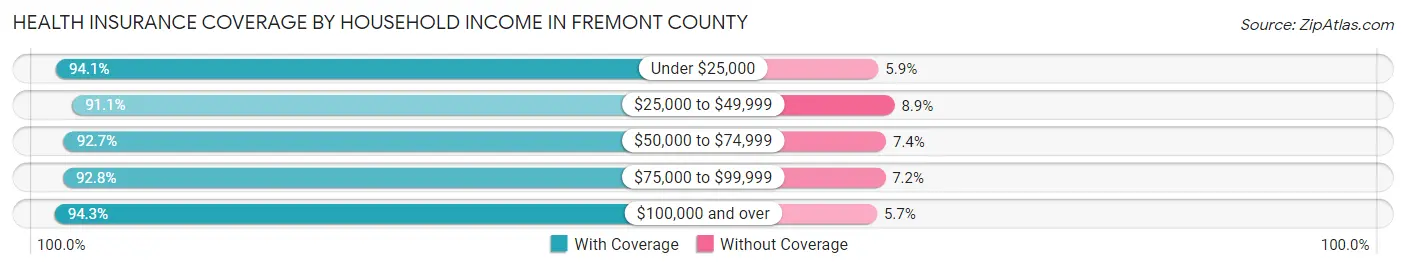
| Household Income | With Coverage | Without Coverage |
| Under $25,000 | 5,673 (94.1%) | 357 (5.9%) |
| $25,000 to $49,999 | 6,953 (91.1%) | 682 (8.9%) |
| $50,000 to $74,999 | 6,542 (92.6%) | 519 (7.3%) |
| $75,000 to $99,999 | 6,539 (92.8%) | 507 (7.2%) |
| $100,000 and over | 12,007 (94.3%) | 721 (5.7%) |
Public vs Private Health Insurance Coverage by Age in Fremont County
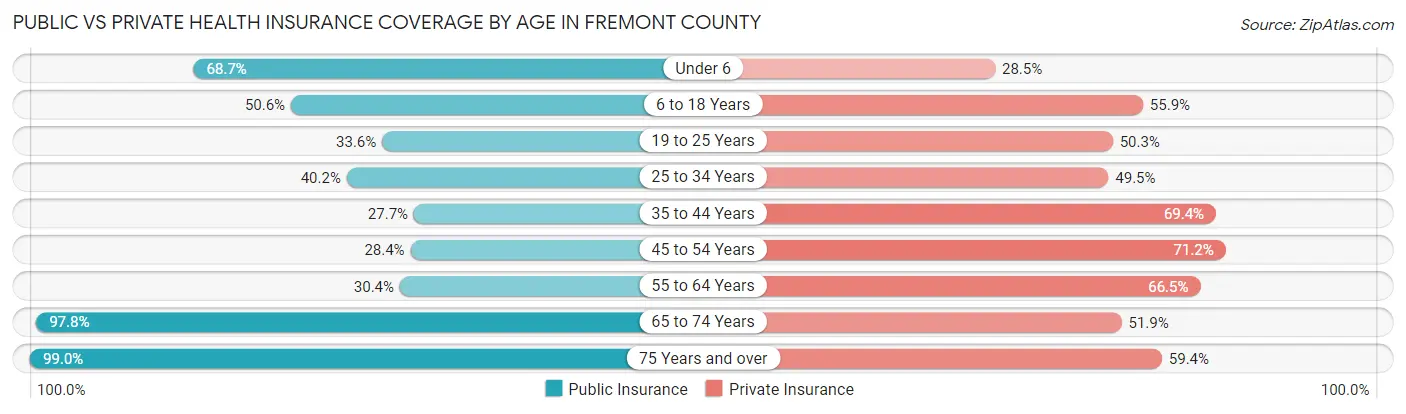
| Age Bracket | Public Insurance | Private Insurance |
| Under 6 | 1,636 (68.6%) | 678 (28.4%) |
| 6 to 18 Years | 2,977 (50.6%) | 3,291 (55.9%) |
| 19 to 25 Years | 954 (33.6%) | 1,426 (50.3%) |
| 25 to 34 Years | 1,774 (40.2%) | 2,183 (49.5%) |
| 35 to 44 Years | 1,062 (27.7%) | 2,659 (69.4%) |
| 45 to 54 Years | 1,411 (28.4%) | 3,542 (71.2%) |
| 55 to 64 Years | 1,926 (30.3%) | 4,223 (66.5%) |
| 65 to 74 Years | 5,817 (97.8%) | 3,088 (51.9%) |
| 75 Years and over | 3,968 (99.0%) | 2,381 (59.4%) |
| Total | 21,525 (53.0%) | 23,471 (57.8%) |
Disability Status by Sex by Age in Fremont County
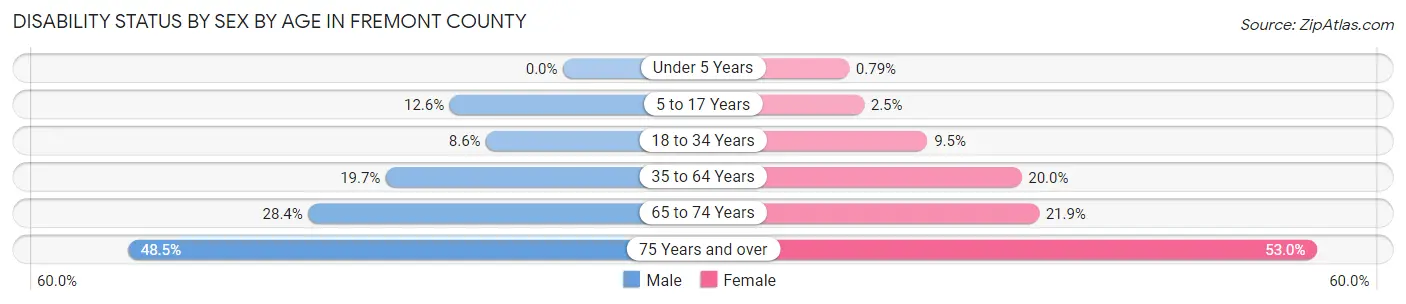
| Age Bracket | Male | Female |
| Under 5 Years | 0 (0.0%) | 7 (0.8%) |
| 5 to 17 Years | 379 (12.6%) | 70 (2.5%) |
| 18 to 34 Years | 386 (8.6%) | 298 (9.5%) |
| 35 to 64 Years | 1,407 (19.7%) | 1,602 (20.0%) |
| 65 to 74 Years | 811 (28.4%) | 677 (21.9%) |
| 75 Years and over | 920 (48.5%) | 1,118 (53.0%) |
Disability Class by Sex by Age in Fremont County
Disability Class: Hearing Difficulty
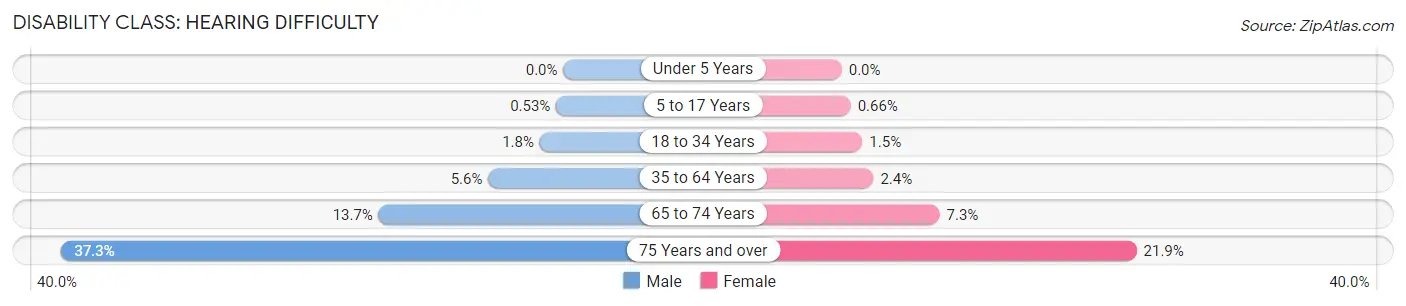
| Age Bracket | Male | Female |
| Under 5 Years | 0 (0.0%) | 0 (0.0%) |
| 5 to 17 Years | 16 (0.5%) | 19 (0.7%) |
| 18 to 34 Years | 79 (1.8%) | 48 (1.5%) |
| 35 to 64 Years | 397 (5.6%) | 188 (2.4%) |
| 65 to 74 Years | 392 (13.7%) | 224 (7.3%) |
| 75 Years and over | 707 (37.3%) | 462 (21.9%) |
Disability Class: Vision Difficulty
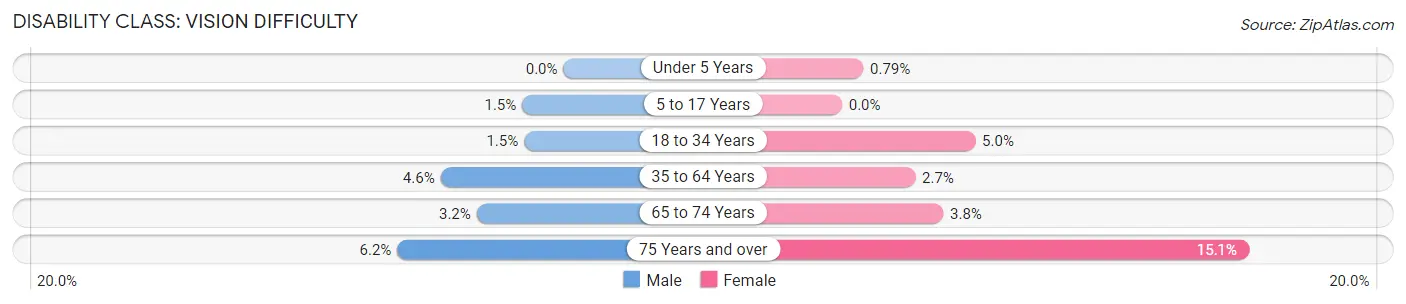
| Age Bracket | Male | Female |
| Under 5 Years | 0 (0.0%) | 7 (0.8%) |
| 5 to 17 Years | 46 (1.5%) | 0 (0.0%) |
| 18 to 34 Years | 66 (1.5%) | 155 (5.0%) |
| 35 to 64 Years | 325 (4.6%) | 218 (2.7%) |
| 65 to 74 Years | 92 (3.2%) | 116 (3.8%) |
| 75 Years and over | 117 (6.2%) | 319 (15.1%) |
Disability Class: Cognitive Difficulty
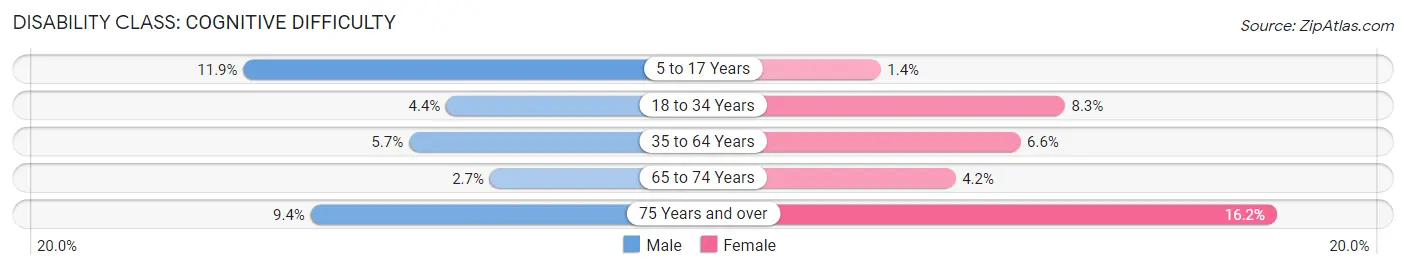
| Age Bracket | Male | Female |
| 5 to 17 Years | 357 (11.9%) | 41 (1.4%) |
| 18 to 34 Years | 196 (4.3%) | 259 (8.3%) |
| 35 to 64 Years | 409 (5.7%) | 531 (6.6%) |
| 65 to 74 Years | 78 (2.7%) | 130 (4.2%) |
| 75 Years and over | 178 (9.4%) | 341 (16.2%) |
Disability Class: Ambulatory Difficulty
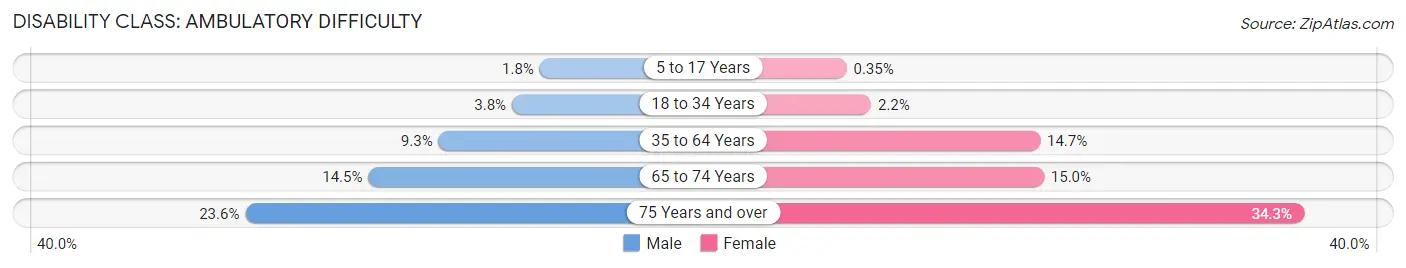
| Age Bracket | Male | Female |
| 5 to 17 Years | 53 (1.8%) | 10 (0.4%) |
| 18 to 34 Years | 172 (3.8%) | 68 (2.2%) |
| 35 to 64 Years | 661 (9.3%) | 1,180 (14.7%) |
| 65 to 74 Years | 414 (14.5%) | 463 (15.0%) |
| 75 Years and over | 448 (23.6%) | 724 (34.3%) |
Disability Class: Self-Care Difficulty
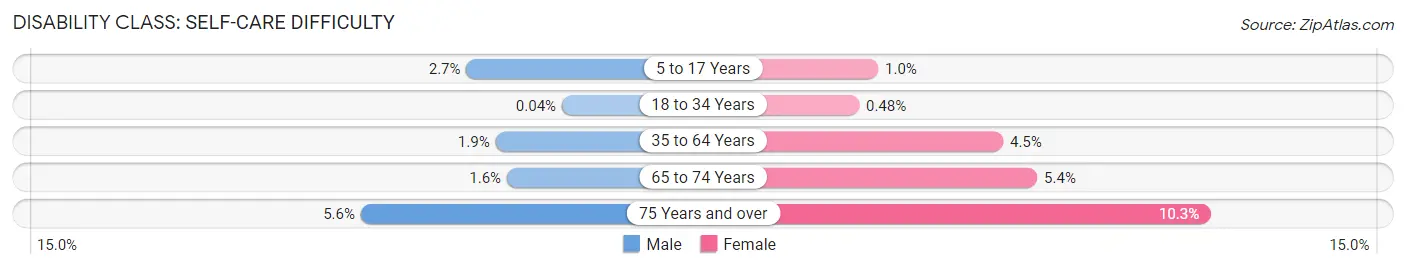
| Age Bracket | Male | Female |
| 5 to 17 Years | 81 (2.7%) | 29 (1.0%) |
| 18 to 34 Years | 2 (0.0%) | 15 (0.5%) |
| 35 to 64 Years | 135 (1.9%) | 360 (4.5%) |
| 65 to 74 Years | 45 (1.6%) | 168 (5.4%) |
| 75 Years and over | 107 (5.6%) | 217 (10.3%) |
Technology Access in Fremont County
Computing Device Access in Fremont County
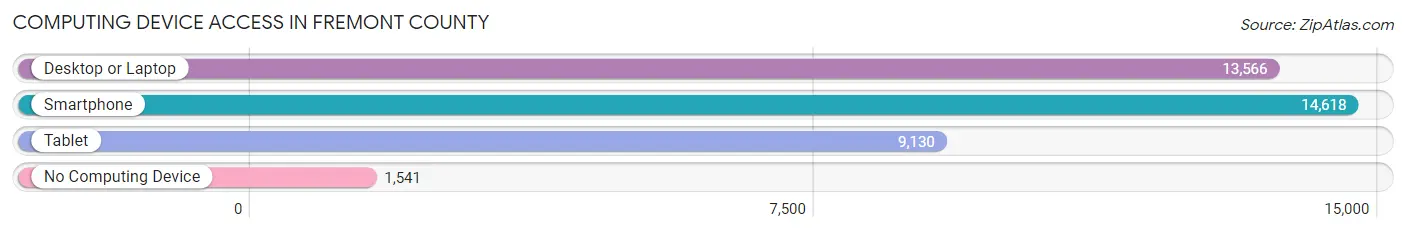
| Device Type | # Households | % Households |
| Desktop or Laptop | 13,566 | 76.7% |
| Smartphone | 14,618 | 82.7% |
| Tablet | 9,130 | 51.6% |
| No Computing Device | 1,541 | 8.7% |
| Total | 17,677 | 100.0% |
Internet Access in Fremont County
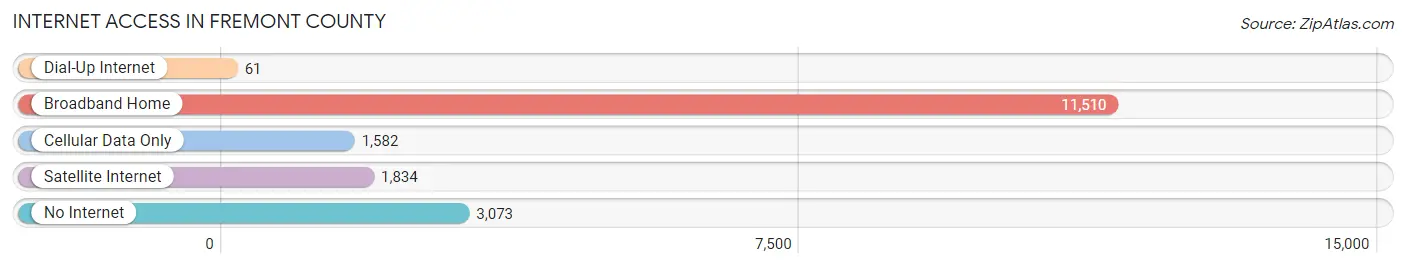
| Internet Type | # Households | % Households |
| Dial-Up Internet | 61 | 0.4% |
| Broadband Home | 11,510 | 65.1% |
| Cellular Data Only | 1,582 | 8.9% |
| Satellite Internet | 1,834 | 10.4% |
| No Internet | 3,073 | 17.4% |
| Total | 17,677 | 100.0% |
Fremont County Summary
Fremont County is located in the south-central region of Colorado, and is the tenth most populous county in the state. It is bordered by El Paso County to the north, Pueblo County to the east, Custer County to the south, and Chaffee County to the west. The county seat is Cañon City, and the largest city is Florence.
History
Fremont County was established in 1861 as one of the original 17 counties of the Colorado Territory. It was named after John C. Fremont, an explorer and the first Republican presidential candidate. The county was originally much larger than it is today, encompassing parts of what are now El Paso, Pueblo, Custer, and Chaffee counties.
The county was home to several Native American tribes, including the Ute, Arapaho, and Cheyenne. The first white settlers arrived in the area in the late 1850s, and the county was officially established in 1861.
The county was home to several mining towns, including Florence, Victor, and Cripple Creek. The Florence and Cripple Creek Railroad was built in the late 1800s to transport ore from the mines to the smelters in Cañon City.
The county was also home to several military installations, including Fort Carson, Camp Hale, and the Royal Gorge Bridge and Park. The Royal Gorge Bridge was built in 1929 and is the highest suspension bridge in the United States.
Geography
Fremont County is located in the south-central region of Colorado, and is bordered by El Paso County to the north, Pueblo County to the east, Custer County to the south, and Chaffee County to the west. The county covers an area of 2,541 square miles, and is the tenth largest county in the state.
The county is located in the foothills of the Rocky Mountains, and is home to several mountain ranges, including the Sangre de Cristo Mountains, the Wet Mountains, and the Mosquito Range. The county is also home to several rivers, including the Arkansas River, the South Platte River, and the Purgatoire River.
The highest point in the county is Mount Ouray, which has an elevation of 13,971 feet. The lowest point is the Arkansas River, which has an elevation of 4,600 feet.
Economy
Fremont County has a diverse economy, with a mix of agriculture, manufacturing, tourism, and government services. The county is home to several large employers, including the Colorado Department of Corrections, the U.S. Air Force Academy, and the Royal Gorge Bridge and Park.
Agriculture is an important part of the county’s economy, with cattle, sheep, and hay being the main agricultural products. The county is also home to several wineries and breweries, as well as several recreational activities, such as camping, fishing, and hunting.
Tourism is also an important part of the county’s economy, with the Royal Gorge Bridge and Park being the most popular tourist attraction. The county is also home to several museums, including the Royal Gorge Regional Museum and History Center, the Fremont County Pioneer Museum, and the Florence Mining Museum.
Demographics
As of the 2010 census, Fremont County had a population of 46,824. The population was spread out, with 24.3% under the age of 18, 8.2% from 18 to 24, 28.2% from 25 to 44, 24.7% from 45 to 64, and 14.6% who were 65 years of age or older. The median age was 38.3 years.
The racial makeup of the county was 90.2% White, 0.7% Black or African American, 1.2% Native American, 0.7% Asian, 0.1% Pacific Islander, 4.7% from other races, and 2.4% from two or more races. Hispanic or Latino of any race were 11.3% of the population.
The median income for a household in the county was $41,945, and the median income for a family was $50,945. The per capita income for the county was $21,845. About 11.2% of families and 14.7% of the population were below the poverty line, including 19.2% of those under age 18 and 8.2% of those age 65 or over.
Common Questions
What is the Total Population of Fremont County?
Total Population of Fremont County is 49,107.
What is the Total Male Population of Fremont County?
Total Male Population of Fremont County is 28,582.
What is the Total Female Population of Fremont County?
Total Female Population of Fremont County is 20,525.
What is the Ratio of Males per 100 Females in Fremont County?
There are 139.25 Males per 100 Females in Fremont County.
What is the Ratio of Females per 100 Males in Fremont County?
There are 71.81 Females per 100 Males in Fremont County.
What is the Median Population Age in Fremont County?
Median Population Age in Fremont County is 44.9 Years.
What is the Average Family Size in Fremont County
Average Family Size in Fremont County is 2.8 People.
What is the Average Household Size in Fremont County
Average Household Size in Fremont County is 2.3 People.
What is Per Capita Income in Fremont County?
Per Capita income in Fremont County is $28,224.
What is the Median Family Income in Fremont County?
Median Family Income in Fremont County is $73,966.
What is the Median Household income in Fremont County?
Median Household Income in Fremont County is $56,165.
What is Income or Wage Gap in Fremont County?
Income or Wage Gap in Fremont County is 25.4%.
Women in Fremont County earn 74.6 cents for every dollar earned by a man.
What is Family Income Deficit in Fremont County?
Family Income Deficit in Fremont County is $8,960.
Families that are below poverty line in Fremont County earn $8,960 less on average than the poverty threshold level.
What is Inequality or Gini Index in Fremont County?
Inequality or Gini Index in Fremont County is 0.47.
How Large is the Labor Force in Fremont County?
There are 17,805 People in the Labor Forcein in Fremont County.
What is the Percentage of People in the Labor Force in Fremont County?
42.3% of People are in the Labor Force in Fremont County.
What is the Unemployment Rate in Fremont County?
Unemployment Rate in Fremont County is 4.8%.