Elbert County, CO
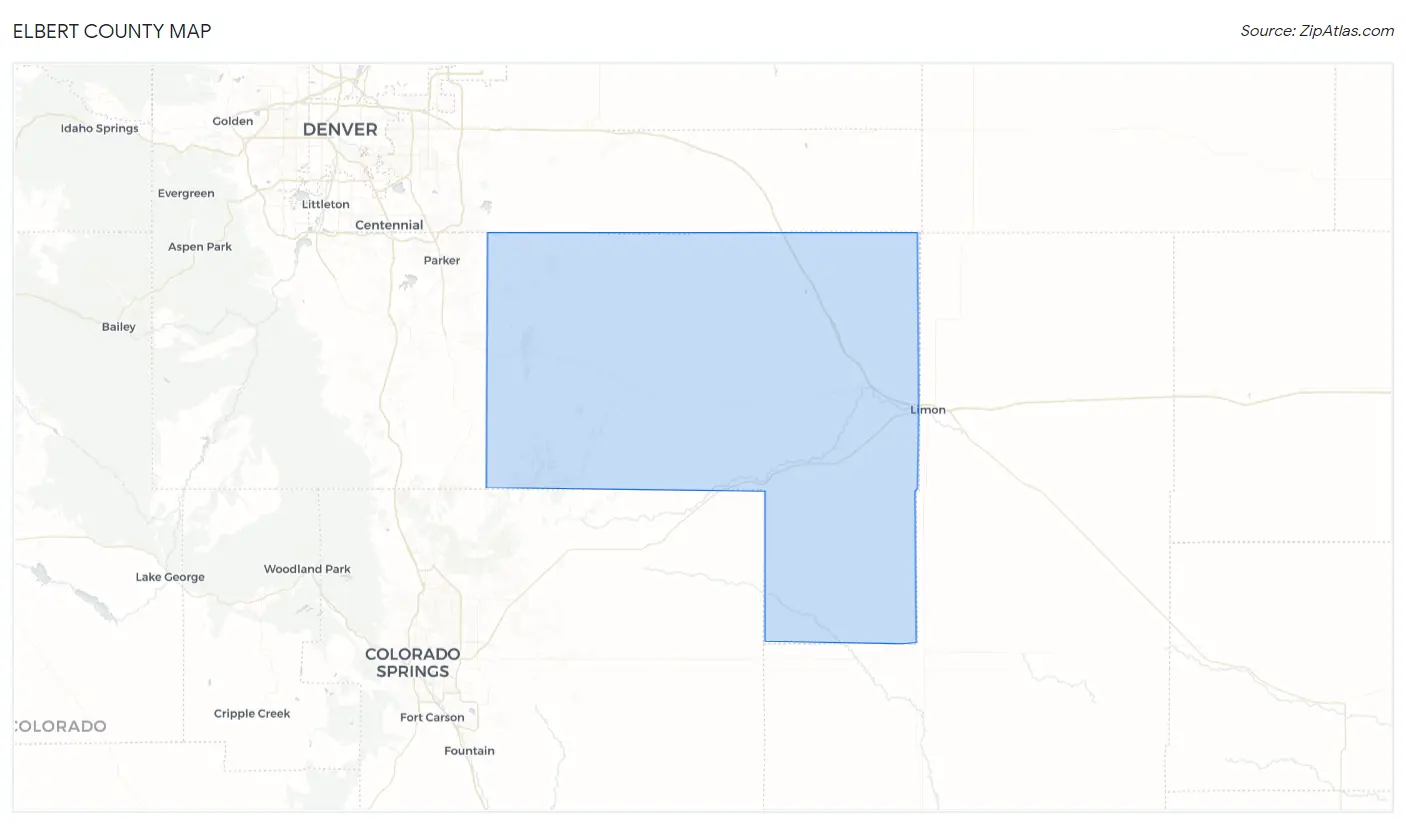
Elbert County Map
Elbert County Overview
26,457
TOTAL POPULATION
13,448
MALE POPULATION
13,009
FEMALE POPULATION
103.37
MALES / 100 FEMALES
96.74
FEMALES / 100 MALES
45.6
MEDIAN AGE
3.0
AVG FAMILY SIZE
2.8
AVG HOUSEHOLD SIZE
$55,535
PER CAPITA INCOME
$136,020
AVG FAMILY INCOME
$124,360
AVG HOUSEHOLD INCOME
32.8%
WAGE / INCOME GAP [ % ]
67.2¢/ $1
WAGE / INCOME GAP [ $ ]
$9,456
FAMILY INCOME DEFICIT
0.41
INEQUALITY / GINI INDEX
14,529
LABOR FORCE [ PEOPLE ]
66.4%
PERCENT IN LABOR FORCE
2.3%
UNEMPLOYMENT RATE
Elbert County Area Codes
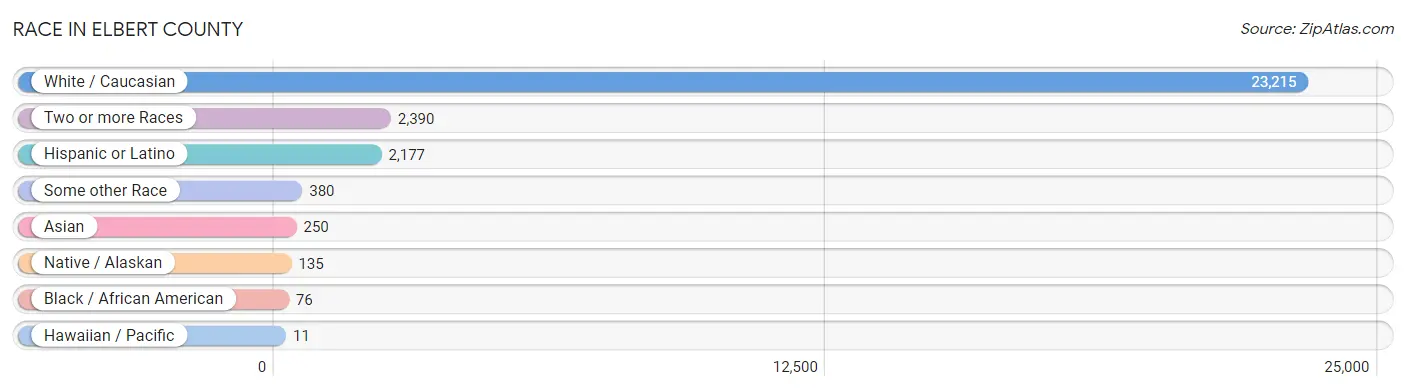
Race in Elbert County
The most populous races in Elbert County are White / Caucasian (23,215 | 87.7%), Two or more Races (2,390 | 9.0%), and Hispanic or Latino (2,177 | 8.2%).
| Race | # Population | % Population |
| Asian | 250 | 0.9% |
| Black / African American | 76 | 0.3% |
| Hawaiian / Pacific | 11 | 0.0% |
| Hispanic or Latino | 2,177 | 8.2% |
| Native / Alaskan | 135 | 0.5% |
| White / Caucasian | 23,215 | 87.7% |
| Two or more Races | 2,390 | 9.0% |
| Some other Race | 380 | 1.4% |
| Total | 26,457 | 100.0% |
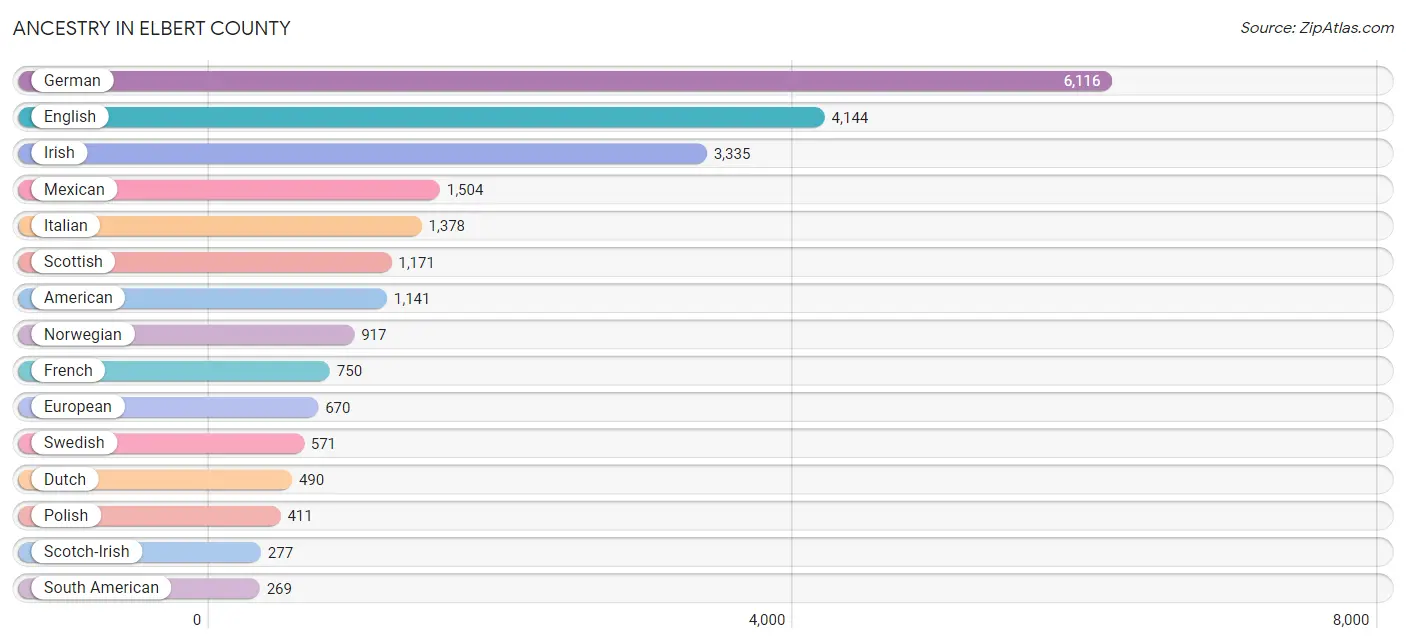
Ancestry in Elbert County
The most populous ancestries reported in Elbert County are German (6,116 | 23.1%), English (4,144 | 15.7%), Irish (3,335 | 12.6%), Mexican (1,504 | 5.7%), and Italian (1,378 | 5.2%), together accounting for 62.3% of all Elbert County residents.
| Ancestry | # Population | % Population |
| African | 30 | 0.1% |
| American | 1,141 | 4.3% |
| Apache | 28 | 0.1% |
| Arab | 47 | 0.2% |
| Austrian | 103 | 0.4% |
| Basque | 9 | 0.0% |
| Bhutanese | 94 | 0.4% |
| Blackfeet | 4 | 0.0% |
| British | 139 | 0.5% |
| Burmese | 174 | 0.7% |
| Cajun | 2 | 0.0% |
| Canadian | 33 | 0.1% |
| Celtic | 5 | 0.0% |
| Central American | 30 | 0.1% |
| Cherokee | 153 | 0.6% |
| Choctaw | 42 | 0.2% |
| Colombian | 222 | 0.8% |
| Creek | 10 | 0.0% |
| Croatian | 10 | 0.0% |
| Cuban | 10 | 0.0% |
| Czech | 138 | 0.5% |
| Czechoslovakian | 36 | 0.1% |
| Danish | 99 | 0.4% |
| Dutch | 490 | 1.8% |
| Eastern European | 76 | 0.3% |
| English | 4,144 | 15.7% |
| European | 670 | 2.5% |
| Finnish | 26 | 0.1% |
| French | 750 | 2.8% |
| French Canadian | 176 | 0.7% |
| German | 6,116 | 23.1% |
| Greek | 118 | 0.4% |
| Guamanian / Chamorro | 18 | 0.1% |
| Guatemalan | 3 | 0.0% |
| Hungarian | 91 | 0.3% |
| Indian (Asian) | 32 | 0.1% |
| Irish | 3,335 | 12.6% |
| Iroquois | 1 | 0.0% |
| Italian | 1,378 | 5.2% |
| Korean | 142 | 0.5% |
| Laotian | 26 | 0.1% |
| Lithuanian | 15 | 0.1% |
| Luxembourger | 3 | 0.0% |
| Malaysian | 34 | 0.1% |
| Mexican | 1,504 | 5.7% |
| Mexican American Indian | 10 | 0.0% |
| Moroccan | 43 | 0.2% |
| Native Hawaiian | 11 | 0.0% |
| Northern European | 85 | 0.3% |
| Norwegian | 917 | 3.5% |
| Pakistani | 9 | 0.0% |
| Palestinian | 4 | 0.0% |
| Panamanian | 27 | 0.1% |
| Peruvian | 47 | 0.2% |
| Pima | 5 | 0.0% |
| Polish | 411 | 1.5% |
| Portuguese | 48 | 0.2% |
| Pueblo | 7 | 0.0% |
| Puerto Rican | 32 | 0.1% |
| Puget Sound Salish | 15 | 0.1% |
| Russian | 176 | 0.7% |
| Scandinavian | 79 | 0.3% |
| Scotch-Irish | 277 | 1.1% |
| Scottish | 1,171 | 4.4% |
| Seminole | 18 | 0.1% |
| Serbian | 4 | 0.0% |
| Sioux | 15 | 0.1% |
| Slavic | 26 | 0.1% |
| Slovak | 66 | 0.3% |
| Slovene | 3 | 0.0% |
| South American | 269 | 1.0% |
| Spaniard | 150 | 0.6% |
| Spanish | 129 | 0.5% |
| Spanish American | 26 | 0.1% |
| Sri Lankan | 25 | 0.1% |
| Subsaharan African | 30 | 0.1% |
| Swedish | 571 | 2.2% |
| Swiss | 115 | 0.4% |
| Syrian | 4 | 0.0% |
| Thai | 26 | 0.1% |
| Tlingit-Haida | 74 | 0.3% |
| Tongan | 18 | 0.1% |
| Ukrainian | 15 | 0.1% |
| Welsh | 180 | 0.7% |
| Yugoslavian | 13 | 0.1% | View All 85 Rows |
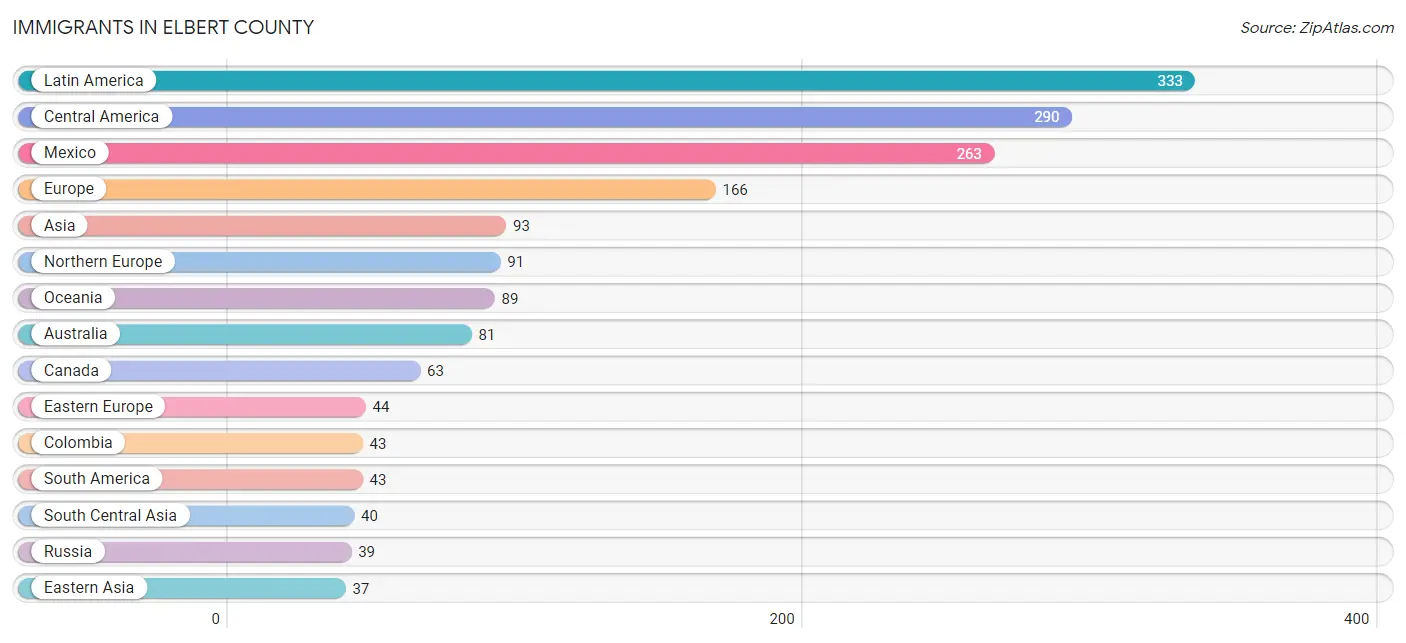
Immigrants in Elbert County
The most numerous immigrant groups reported in Elbert County came from Latin America (333 | 1.3%), Central America (290 | 1.1%), Mexico (263 | 1.0%), Europe (166 | 0.6%), and Asia (93 | 0.4%), together accounting for 4.3% of all Elbert County residents.
| Immigration Origin | # Population | % Population |
| Africa | 3 | 0.0% |
| Asia | 93 | 0.4% |
| Australia | 81 | 0.3% |
| Canada | 63 | 0.2% |
| Central America | 290 | 1.1% |
| Colombia | 43 | 0.2% |
| Denmark | 18 | 0.1% |
| Eastern Asia | 37 | 0.1% |
| Eastern Europe | 44 | 0.2% |
| England | 16 | 0.1% |
| Europe | 166 | 0.6% |
| Hungary | 5 | 0.0% |
| India | 26 | 0.1% |
| Japan | 35 | 0.1% |
| Korea | 2 | 0.0% |
| Latin America | 333 | 1.3% |
| Mexico | 263 | 1.0% |
| Netherlands | 31 | 0.1% |
| Northern Europe | 91 | 0.3% |
| Oceania | 89 | 0.3% |
| Pakistan | 14 | 0.1% |
| Panama | 27 | 0.1% |
| Russia | 39 | 0.2% |
| Singapore | 7 | 0.0% |
| South Africa | 3 | 0.0% |
| South America | 43 | 0.2% |
| South Central Asia | 40 | 0.2% |
| South Eastern Asia | 16 | 0.1% |
| Sweden | 11 | 0.0% |
| Thailand | 9 | 0.0% |
| Western Europe | 31 | 0.1% | View All 31 Rows |
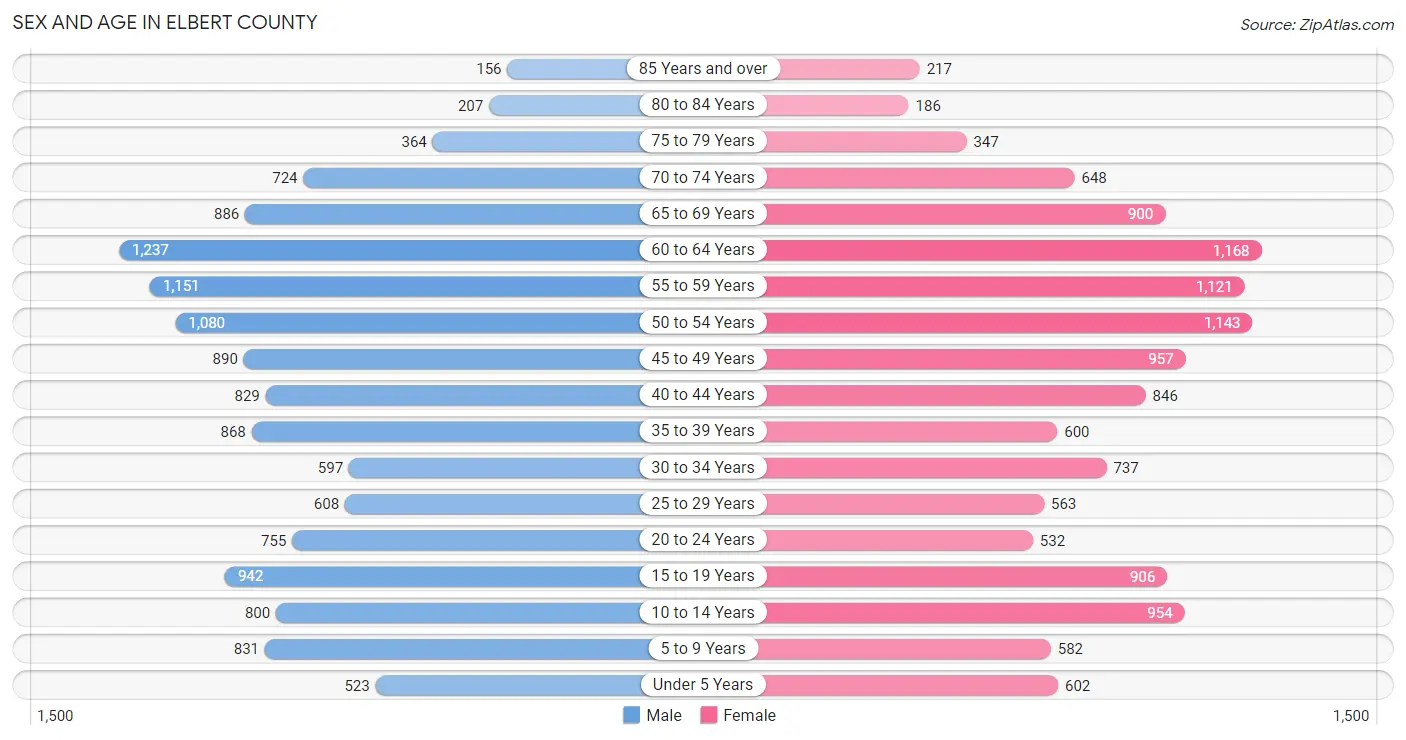
Sex and Age in Elbert County
Sex and Age in Elbert County
The most populous age groups in Elbert County are 60 to 64 Years (1,237 | 9.2%) for men and 60 to 64 Years (1,168 | 9.0%) for women.
| Age Bracket | Male | Female |
| Under 5 Years | 523 (3.9%) | 602 (4.6%) |
| 5 to 9 Years | 831 (6.2%) | 582 (4.5%) |
| 10 to 14 Years | 800 (5.9%) | 954 (7.3%) |
| 15 to 19 Years | 942 (7.0%) | 906 (7.0%) |
| 20 to 24 Years | 755 (5.6%) | 532 (4.1%) |
| 25 to 29 Years | 608 (4.5%) | 563 (4.3%) |
| 30 to 34 Years | 597 (4.4%) | 737 (5.7%) |
| 35 to 39 Years | 868 (6.5%) | 600 (4.6%) |
| 40 to 44 Years | 829 (6.2%) | 846 (6.5%) |
| 45 to 49 Years | 890 (6.6%) | 957 (7.4%) |
| 50 to 54 Years | 1,080 (8.0%) | 1,143 (8.8%) |
| 55 to 59 Years | 1,151 (8.6%) | 1,121 (8.6%) |
| 60 to 64 Years | 1,237 (9.2%) | 1,168 (9.0%) |
| 65 to 69 Years | 886 (6.6%) | 900 (6.9%) |
| 70 to 74 Years | 724 (5.4%) | 648 (5.0%) |
| 75 to 79 Years | 364 (2.7%) | 347 (2.7%) |
| 80 to 84 Years | 207 (1.5%) | 186 (1.4%) |
| 85 Years and over | 156 (1.2%) | 217 (1.7%) |
| Total | 13,448 (100.0%) | 13,009 (100.0%) |
Families and Households in Elbert County
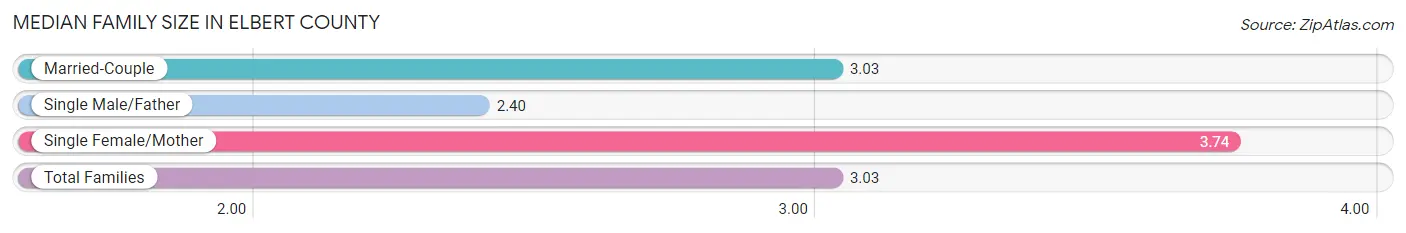
Median Family Size in Elbert County
The median family size in Elbert County is 3.03 persons per family, with single female/mother families (510 | 6.6%) accounting for the largest median family size of 3.74 persons per family. On the other hand, single male/father families (534 | 6.9%) represent the smallest median family size with 2.40 persons per family.
| Family Type | # Families | Family Size |
| Married-Couple | 6,727 (86.6%) | 3.03 |
| Single Male/Father | 534 (6.9%) | 2.40 |
| Single Female/Mother | 510 (6.6%) | 3.74 |
| Total Families | 7,771 (100.0%) | 3.03 |
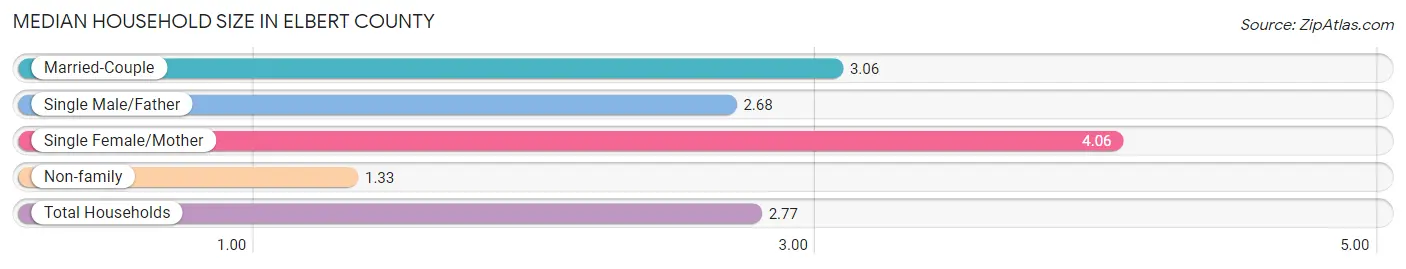
Median Household Size in Elbert County
The median household size in Elbert County is 2.77 persons per household, with single female/mother households (510 | 5.4%) accounting for the largest median household size of 4.06 persons per household. non-family households (1,743 | 18.3%) represent the smallest median household size with 1.33 persons per household.
| Household Type | # Households | Household Size |
| Married-Couple | 6,727 (70.7%) | 3.06 |
| Single Male/Father | 534 (5.6%) | 2.68 |
| Single Female/Mother | 510 (5.4%) | 4.06 |
| Non-family | 1,743 (18.3%) | 1.33 |
| Total Households | 9,514 (100.0%) | 2.77 |
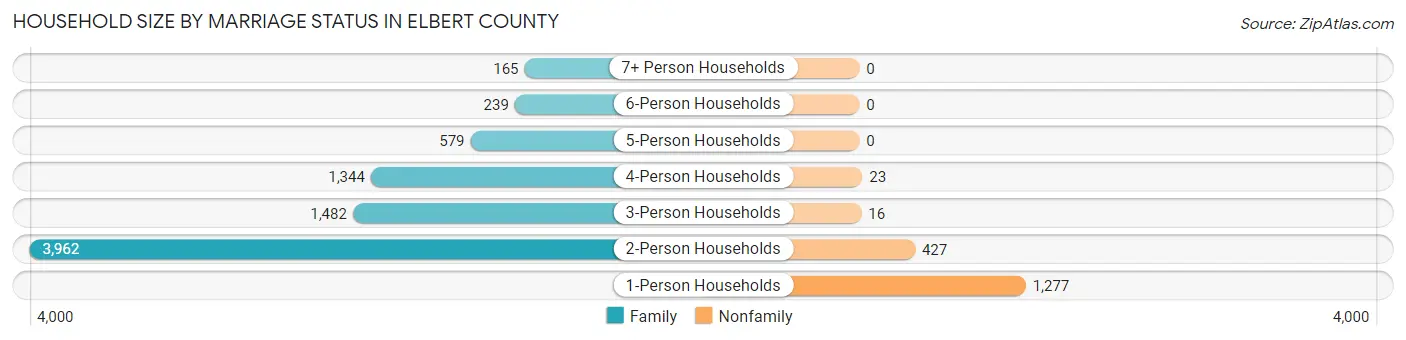
Household Size by Marriage Status in Elbert County
Out of a total of 9,514 households in Elbert County, 7,771 (81.7%) are family households, while 1,743 (18.3%) are nonfamily households. The most numerous type of family households are 2-person households, comprising 3,962, and the most common type of nonfamily households are 1-person households, comprising 1,277.
| Household Size | Family Households | Nonfamily Households |
| 1-Person Households | - | 1,277 (13.4%) |
| 2-Person Households | 3,962 (41.6%) | 427 (4.5%) |
| 3-Person Households | 1,482 (15.6%) | 16 (0.2%) |
| 4-Person Households | 1,344 (14.1%) | 23 (0.2%) |
| 5-Person Households | 579 (6.1%) | 0 (0.0%) |
| 6-Person Households | 239 (2.5%) | 0 (0.0%) |
| 7+ Person Households | 165 (1.7%) | 0 (0.0%) |
| Total | 7,771 (81.7%) | 1,743 (18.3%) |
Female Fertility in Elbert County
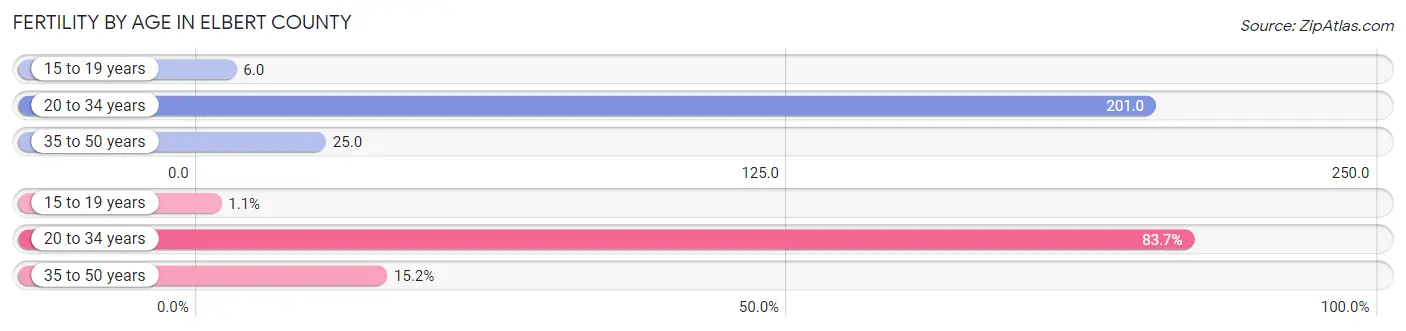
Fertility by Age in Elbert County
Average fertility rate in Elbert County is 81.0 births per 1,000 women. Women in the age bracket of 20 to 34 years have the highest fertility rate with 201.0 births per 1,000 women. Women in the age bracket of 20 to 34 years acount for 83.7% of all women with births.
| Age Bracket | Women with Births | Births / 1,000 Women |
| 15 to 19 years | 5 (1.1%) | 6.0 |
| 20 to 34 years | 369 (83.7%) | 201.0 |
| 35 to 50 years | 67 (15.2%) | 25.0 |
| Total | 441 (100.0%) | 81.0 |
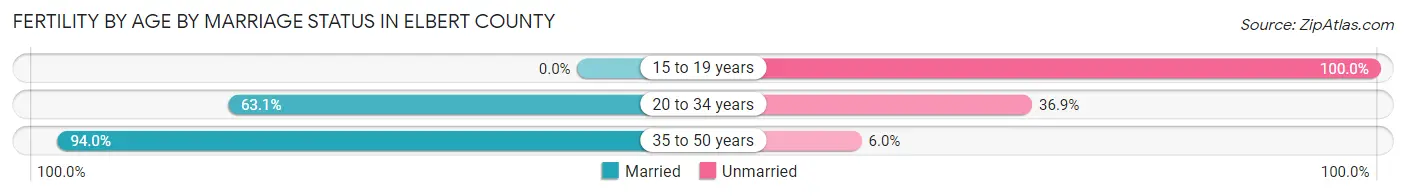
Fertility by Age by Marriage Status in Elbert County
67.1% of women with births (441) in Elbert County are married. The highest percentage of unmarried women with births falls into 15 to 19 years age bracket with 100.0% of them unmarried at the time of birth, while the lowest percentage of unmarried women with births belong to 35 to 50 years age bracket with 6.0% of them unmarried.
| Age Bracket | Married | Unmarried |
| 15 to 19 years | 0 (0.0%) | 5 (100.0%) |
| 20 to 34 years | 233 (63.1%) | 136 (36.9%) |
| 35 to 50 years | 63 (94.0%) | 4 (6.0%) |
| Total | 296 (67.1%) | 145 (32.9%) |
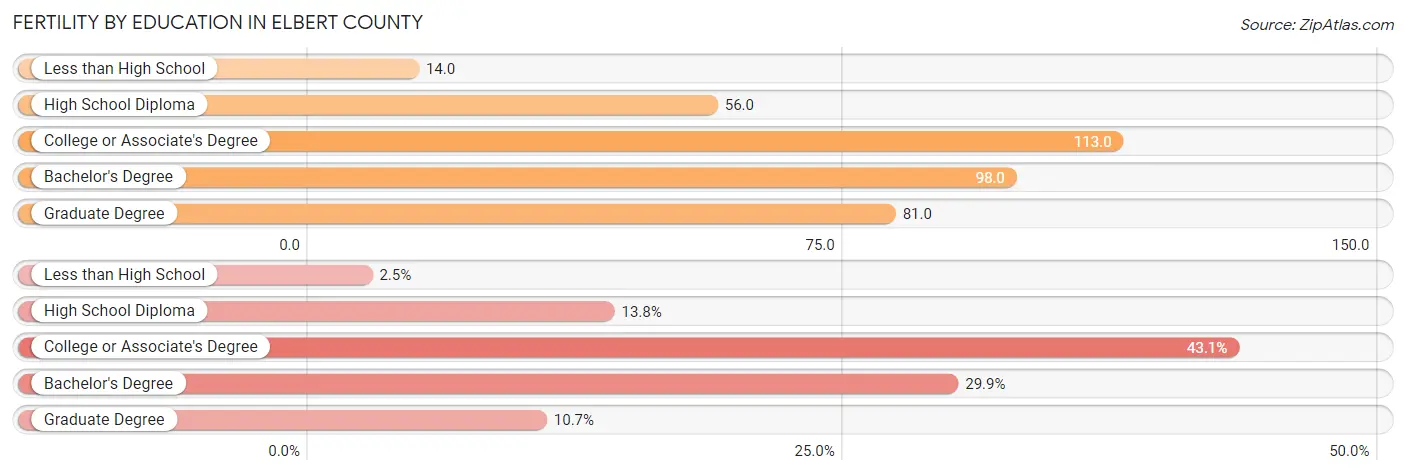
Fertility by Education in Elbert County
Average fertility rate in Elbert County is 81.0 births per 1,000 women. Women with the education attainment of college or associate's degree have the highest fertility rate of 113.0 births per 1,000 women, while women with the education attainment of less than high school have the lowest fertility at 14.0 births per 1,000 women. Women with the education attainment of college or associate's degree represent 43.1% of all women with births.
| Educational Attainment | Women with Births | Births / 1,000 Women |
| Less than High School | 11 (2.5%) | 14.0 |
| High School Diploma | 61 (13.8%) | 56.0 |
| College or Associate's Degree | 190 (43.1%) | 113.0 |
| Bachelor's Degree | 132 (29.9%) | 98.0 |
| Graduate Degree | 47 (10.7%) | 81.0 |
| Total | 441 (100.0%) | 81.0 |
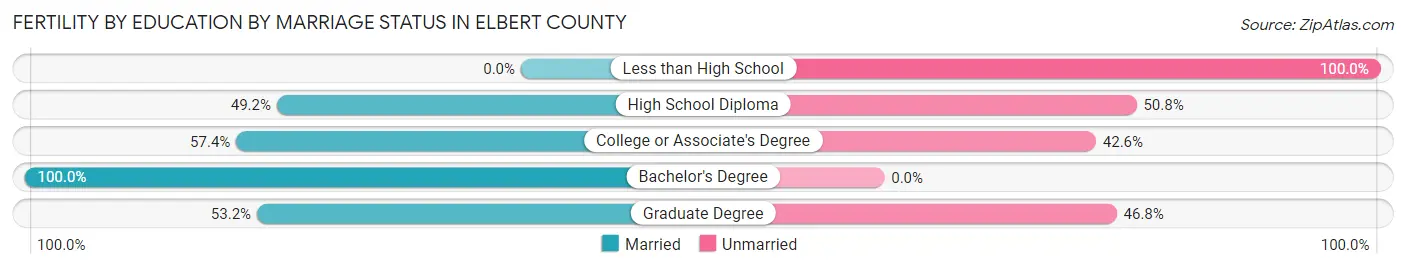
Fertility by Education by Marriage Status in Elbert County
32.9% of women with births in Elbert County are unmarried. Women with the educational attainment of bachelor's degree are most likely to be married with 100.0% of them married at childbirth, while women with the educational attainment of less than high school are least likely to be married with 100.0% of them unmarried at childbirth.
| Educational Attainment | Married | Unmarried |
| Less than High School | 0 (0.0%) | 11 (100.0%) |
| High School Diploma | 30 (49.2%) | 31 (50.8%) |
| College or Associate's Degree | 109 (57.4%) | 81 (42.6%) |
| Bachelor's Degree | 132 (100.0%) | 0 (0.0%) |
| Graduate Degree | 25 (53.2%) | 22 (46.8%) |
| Total | 296 (67.1%) | 145 (32.9%) |
Income in Elbert County
Income Overview in Elbert County
Per Capita Income in Elbert County is $55,535, while median incomes of families and households are $136,020 and $124,360 respectively.
| Characteristic | Number | Measure |
| Per Capita Income | 26,457 | $55,535 |
| Median Family Income | 7,771 | $136,020 |
| Mean Family Income | 7,771 | $162,897 |
| Median Household Income | 9,514 | $124,360 |
| Mean Household Income | 9,514 | $150,842 |
| Income Deficit | 7,771 | $9,456 |
| Wage / Income Gap (%) | 26,457 | 32.83% |
| Wage / Income Gap ($) | 26,457 | 67.17¢ per $1 |
| Gini / Inequality Index | 26,457 | 0.41 |
Earnings by Sex in Elbert County
Average Earnings in Elbert County are $57,531, $69,936 for men and $46,976 for women, a difference of 32.8%.
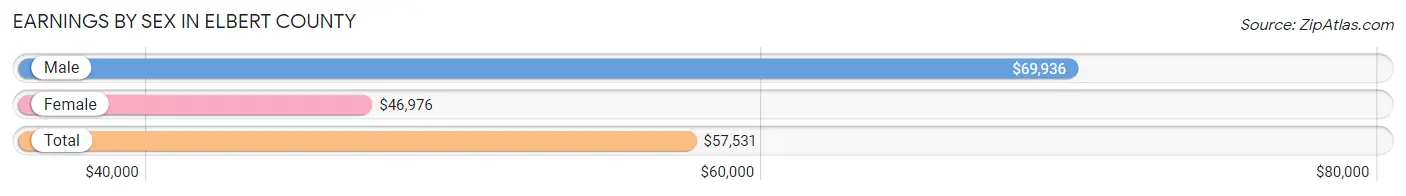
| Sex | Number | Average Earnings |
| Male | 8,559 (55.8%) | $69,936 |
| Female | 6,781 (44.2%) | $46,976 |
| Total | 15,340 (100.0%) | $57,531 |
Earnings by Sex by Income Bracket in Elbert County
The most common earnings brackets in Elbert County are $100,000+ for men (2,901 | 33.9%) and $100,000+ for women (1,132 | 16.7%).
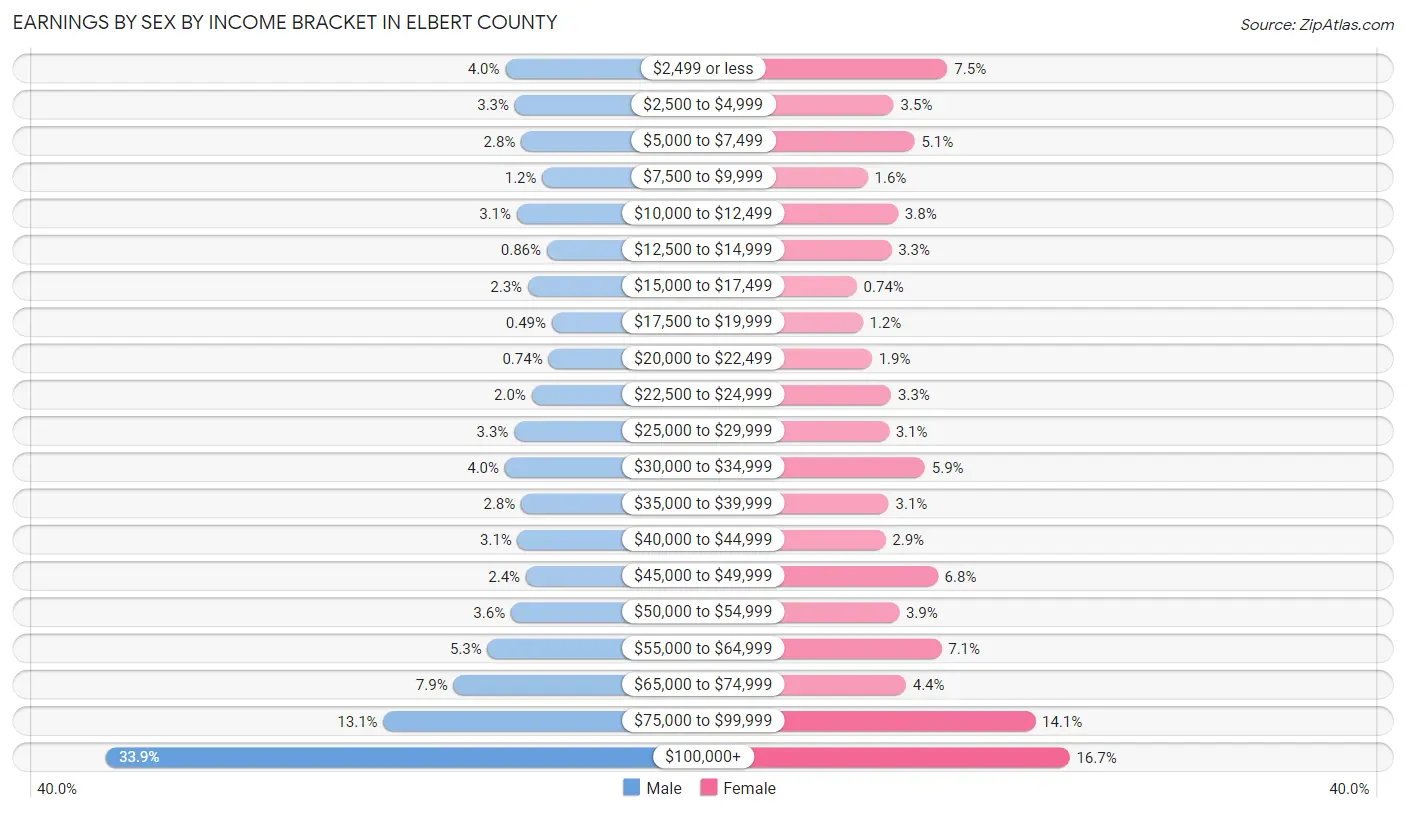
| Income | Male | Female |
| $2,499 or less | 340 (4.0%) | 511 (7.5%) |
| $2,500 to $4,999 | 279 (3.3%) | 238 (3.5%) |
| $5,000 to $7,499 | 238 (2.8%) | 344 (5.1%) |
| $7,500 to $9,999 | 103 (1.2%) | 106 (1.6%) |
| $10,000 to $12,499 | 266 (3.1%) | 260 (3.8%) |
| $12,500 to $14,999 | 74 (0.9%) | 226 (3.3%) |
| $15,000 to $17,499 | 195 (2.3%) | 50 (0.7%) |
| $17,500 to $19,999 | 42 (0.5%) | 80 (1.2%) |
| $20,000 to $22,499 | 63 (0.7%) | 127 (1.9%) |
| $22,500 to $24,999 | 171 (2.0%) | 225 (3.3%) |
| $25,000 to $29,999 | 283 (3.3%) | 213 (3.1%) |
| $30,000 to $34,999 | 343 (4.0%) | 397 (5.9%) |
| $35,000 to $39,999 | 239 (2.8%) | 212 (3.1%) |
| $40,000 to $44,999 | 261 (3.0%) | 196 (2.9%) |
| $45,000 to $49,999 | 208 (2.4%) | 462 (6.8%) |
| $50,000 to $54,999 | 304 (3.5%) | 265 (3.9%) |
| $55,000 to $64,999 | 454 (5.3%) | 480 (7.1%) |
| $65,000 to $74,999 | 673 (7.9%) | 300 (4.4%) |
| $75,000 to $99,999 | 1,122 (13.1%) | 957 (14.1%) |
| $100,000+ | 2,901 (33.9%) | 1,132 (16.7%) |
| Total | 8,559 (100.0%) | 6,781 (100.0%) |
Earnings by Sex by Educational Attainment in Elbert County
Average earnings in Elbert County are $83,349 for men and $53,534 for women, a difference of 35.8%. Men with an educational attainment of graduate degree enjoy the highest average annual earnings of $119,315, while those with less than high school education earn the least with $56,190. Women with an educational attainment of graduate degree earn the most with the average annual earnings of $77,885, while those with less than high school education have the smallest earnings of $24,792.
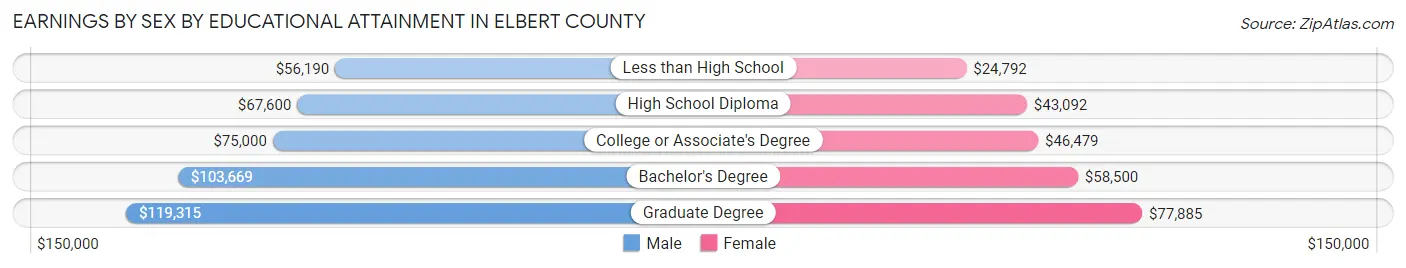
| Educational Attainment | Male Income | Female Income |
| Less than High School | $56,190 | $24,792 |
| High School Diploma | $67,600 | $43,092 |
| College or Associate's Degree | $75,000 | $46,479 |
| Bachelor's Degree | $103,669 | $58,500 |
| Graduate Degree | $119,315 | $77,885 |
| Total | $83,349 | $53,534 |
Family Income in Elbert County
Family Income Brackets in Elbert County
According to the Elbert County family income data, there are 1,764 families falling into the $100,000 to $149,999 income range, which is the most common income bracket and makes up 22.7% of all families. Conversely, the less than $10,000 income bracket is the least frequent group with only 54 families (0.7%) belonging to this category.
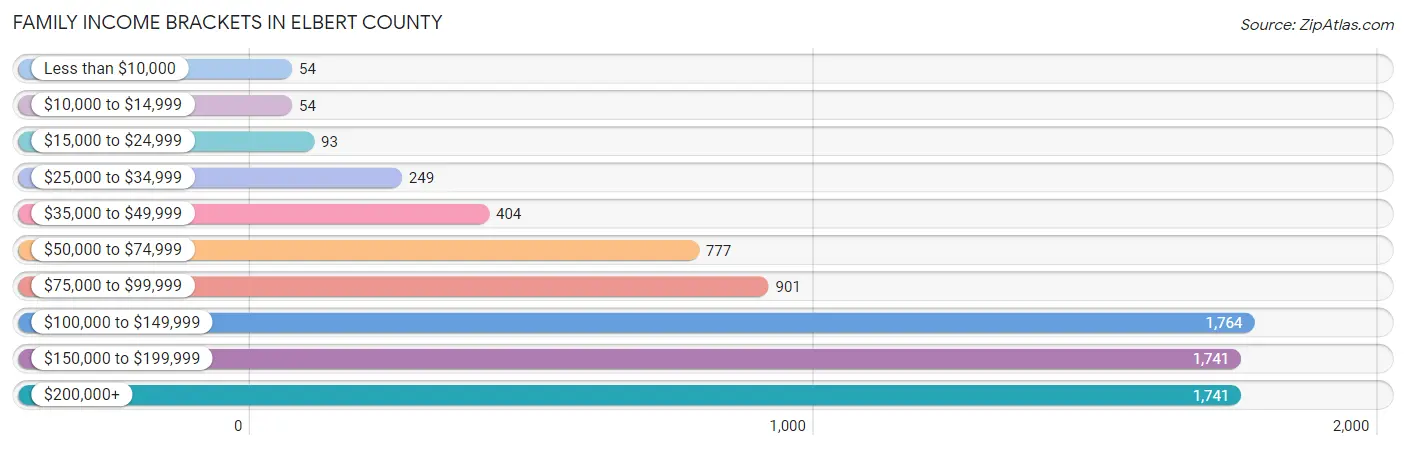
| Income Bracket | # Families | % Families |
| Less than $10,000 | 54 | 0.7% |
| $10,000 to $14,999 | 54 | 0.7% |
| $15,000 to $24,999 | 93 | 1.2% |
| $25,000 to $34,999 | 249 | 3.2% |
| $35,000 to $49,999 | 404 | 5.2% |
| $50,000 to $74,999 | 777 | 10.0% |
| $75,000 to $99,999 | 901 | 11.6% |
| $100,000 to $149,999 | 1,764 | 22.7% |
| $150,000 to $199,999 | 1,741 | 22.4% |
| $200,000+ | 1,741 | 22.4% |
Family Income by Famaliy Size in Elbert County
4-person families (1,187 | 15.3%) account for the highest median family income in Elbert County with $175,313 per family, while 2-person families (4,150 | 53.4%) have the highest median income of $57,334 per family member.
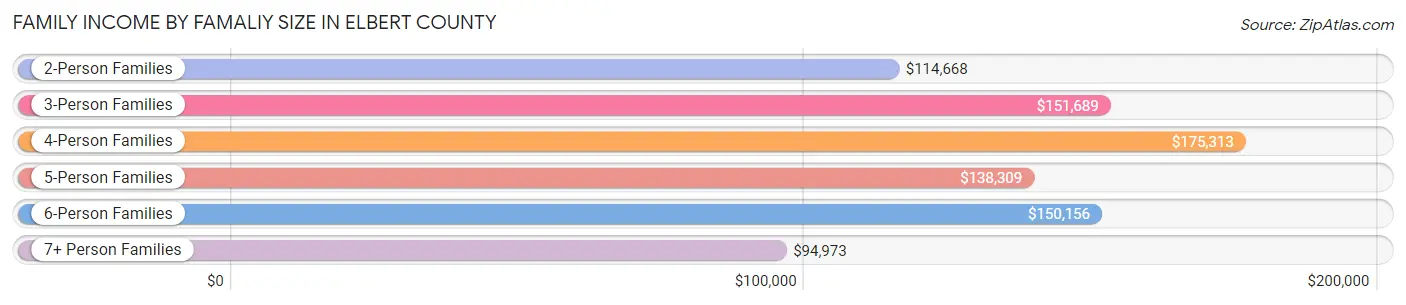
| Income Bracket | # Families | Median Income |
| 2-Person Families | 4,150 (53.4%) | $114,668 |
| 3-Person Families | 1,539 (19.8%) | $151,689 |
| 4-Person Families | 1,187 (15.3%) | $175,313 |
| 5-Person Families | 527 (6.8%) | $138,309 |
| 6-Person Families | 203 (2.6%) | $150,156 |
| 7+ Person Families | 165 (2.1%) | $94,973 |
| Total | 7,771 (100.0%) | $136,020 |
Family Income by Number of Earners in Elbert County
The median family income in Elbert County is $136,020, with families comprising 3+ earners (946) having the highest median family income of $186,653, while families with no earners (1,049) have the lowest median family income of $70,949, accounting for 12.2% and 13.5% of families, respectively.
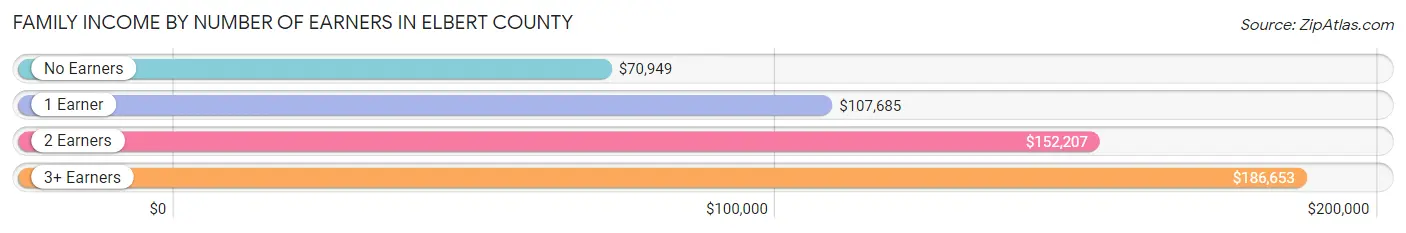
| Number of Earners | # Families | Median Income |
| No Earners | 1,049 (13.5%) | $70,949 |
| 1 Earner | 2,280 (29.3%) | $107,685 |
| 2 Earners | 3,496 (45.0%) | $152,207 |
| 3+ Earners | 946 (12.2%) | $186,653 |
| Total | 7,771 (100.0%) | $136,020 |
Household Income in Elbert County
Household Income Brackets in Elbert County
With 2,150 households falling in the category, the $100,000 to $149,999 income range is the most frequent in Elbert County, accounting for 22.6% of all households. In contrast, only 105 households (1.1%) fall into the $10,000 to $14,999 income bracket, making it the least populous group.
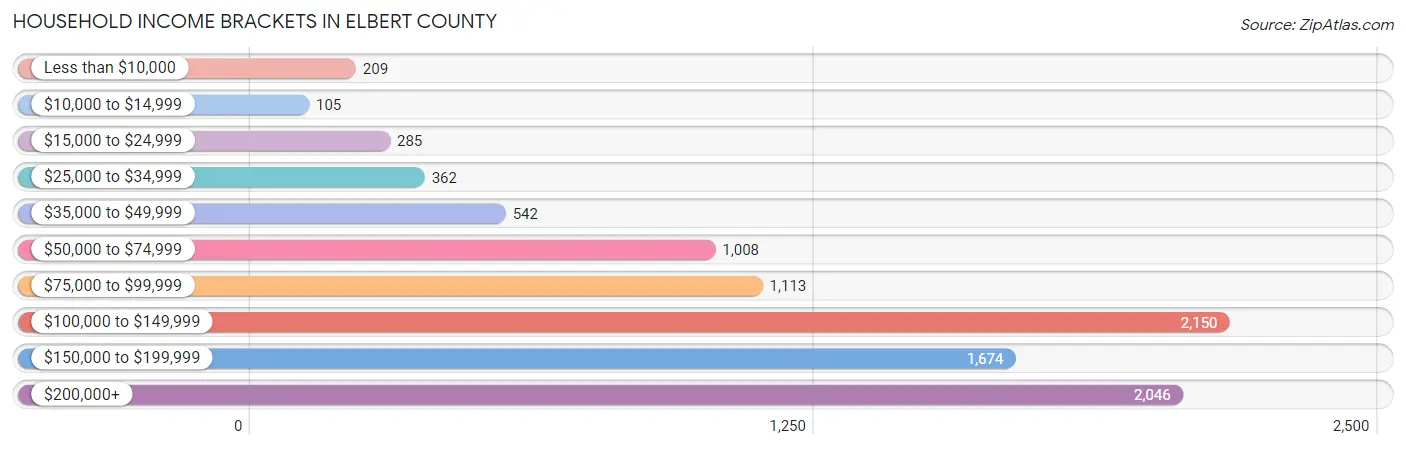
| Income Bracket | # Households | % Households |
| Less than $10,000 | 209 | 2.2% |
| $10,000 to $14,999 | 105 | 1.1% |
| $15,000 to $24,999 | 285 | 3.0% |
| $25,000 to $34,999 | 362 | 3.8% |
| $35,000 to $49,999 | 542 | 5.7% |
| $50,000 to $74,999 | 1,008 | 10.6% |
| $75,000 to $99,999 | 1,113 | 11.7% |
| $100,000 to $149,999 | 2,150 | 22.6% |
| $150,000 to $199,999 | 1,674 | 17.6% |
| $200,000+ | 2,046 | 21.5% |
Household Income by Householder Age in Elbert County
The median household income in Elbert County is $124,360, with the highest median household income of $146,302 found in the 45 to 64 years age bracket for the primary householder. A total of 4,510 households (47.4%) fall into this category. Meanwhile, the 65+ years age bracket for the primary householder has the lowest median household income of $78,156, with 2,628 households (27.6%) in this group.
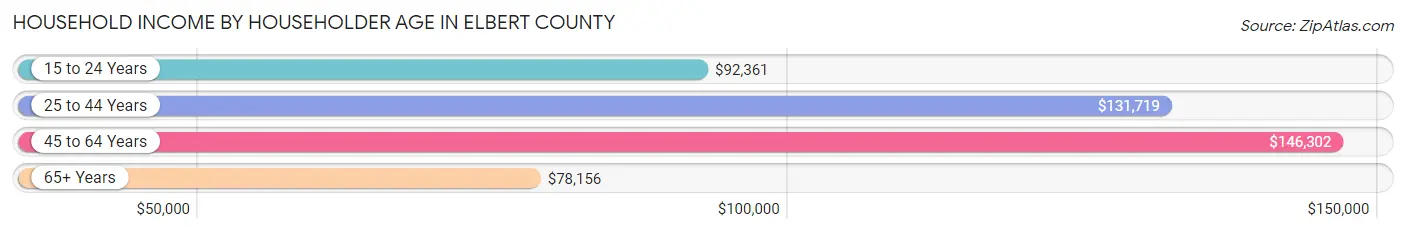
| Income Bracket | # Households | Median Income |
| 15 to 24 Years | 99 (1.0%) | $92,361 |
| 25 to 44 Years | 2,277 (23.9%) | $131,719 |
| 45 to 64 Years | 4,510 (47.4%) | $146,302 |
| 65+ Years | 2,628 (27.6%) | $78,156 |
| Total | 9,514 (100.0%) | $124,360 |
Poverty in Elbert County
Income Below Poverty by Sex and Age in Elbert County
With 3.8% poverty level for males and 4.8% for females among the residents of Elbert County, under 5 year old males and 18 to 24 year old females are the most vulnerable to poverty, with 32 males (6.1%) and 120 females (14.6%) in their respective age groups living below the poverty level.
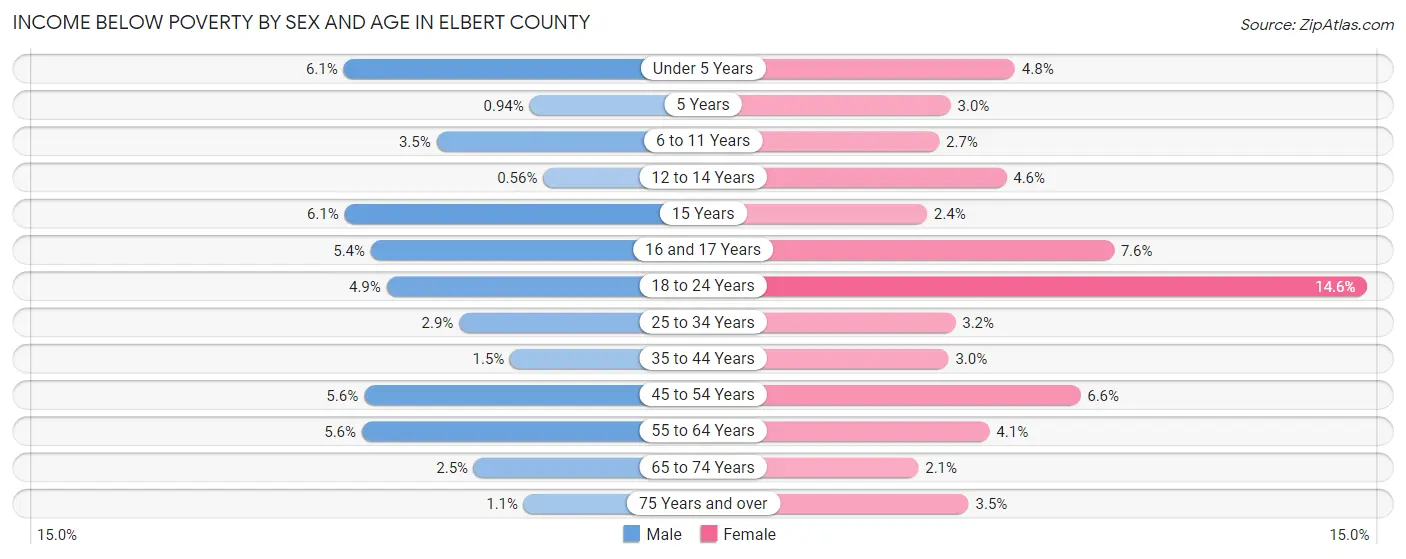
| Age Bracket | Male | Female |
| Under 5 Years | 32 (6.1%) | 29 (4.8%) |
| 5 Years | 2 (0.9%) | 3 (3.0%) |
| 6 to 11 Years | 31 (3.5%) | 20 (2.7%) |
| 12 to 14 Years | 3 (0.6%) | 32 (4.6%) |
| 15 Years | 7 (6.1%) | 4 (2.4%) |
| 16 and 17 Years | 29 (5.4%) | 34 (7.6%) |
| 18 to 24 Years | 51 (4.9%) | 120 (14.6%) |
| 25 to 34 Years | 35 (2.9%) | 41 (3.2%) |
| 35 to 44 Years | 25 (1.5%) | 43 (3.0%) |
| 45 to 54 Years | 109 (5.6%) | 139 (6.6%) |
| 55 to 64 Years | 134 (5.6%) | 94 (4.1%) |
| 65 to 74 Years | 40 (2.5%) | 33 (2.1%) |
| 75 Years and over | 8 (1.1%) | 26 (3.5%) |
| Total | 506 (3.8%) | 618 (4.8%) |
Income Above Poverty by Sex and Age in Elbert County
According to the poverty statistics in Elbert County, males aged 12 to 14 years and females aged 65 to 74 years are the age groups that are most secure financially, with 99.4% of males and 97.9% of females in these age groups living above the poverty line.
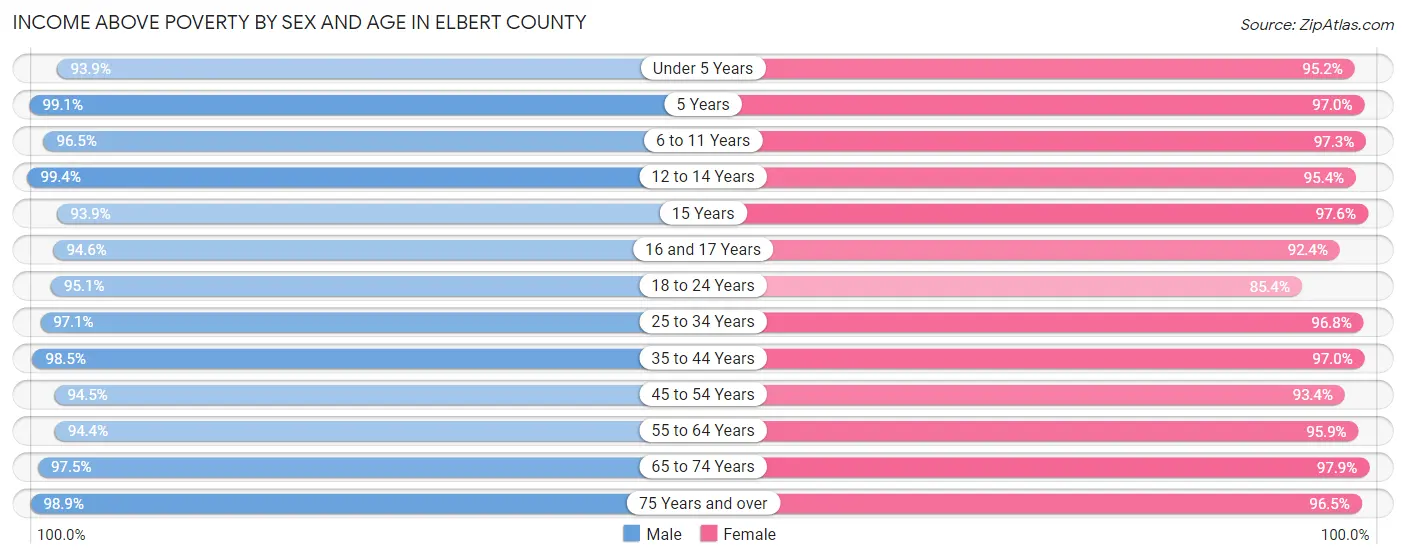
| Age Bracket | Male | Female |
| Under 5 Years | 491 (93.9%) | 573 (95.2%) |
| 5 Years | 211 (99.1%) | 96 (97.0%) |
| 6 to 11 Years | 848 (96.5%) | 718 (97.3%) |
| 12 to 14 Years | 533 (99.4%) | 667 (95.4%) |
| 15 Years | 108 (93.9%) | 165 (97.6%) |
| 16 and 17 Years | 512 (94.6%) | 415 (92.4%) |
| 18 to 24 Years | 985 (95.1%) | 700 (85.4%) |
| 25 to 34 Years | 1,170 (97.1%) | 1,255 (96.8%) |
| 35 to 44 Years | 1,666 (98.5%) | 1,403 (97.0%) |
| 45 to 54 Years | 1,854 (94.5%) | 1,954 (93.4%) |
| 55 to 64 Years | 2,254 (94.4%) | 2,195 (95.9%) |
| 65 to 74 Years | 1,568 (97.5%) | 1,514 (97.9%) |
| 75 Years and over | 716 (98.9%) | 711 (96.5%) |
| Total | 12,916 (96.2%) | 12,366 (95.2%) |
Income Below Poverty Among Married-Couple Families in Elbert County
The poverty statistics for married-couple families in Elbert County show that 1.5% or 102 of the total 6,727 families live below the poverty line. Families with 5 or more children have the highest poverty rate of 6.3%, comprising of 6 families. On the other hand, families with no children have the lowest poverty rate of 1.1%, which includes 50 families.
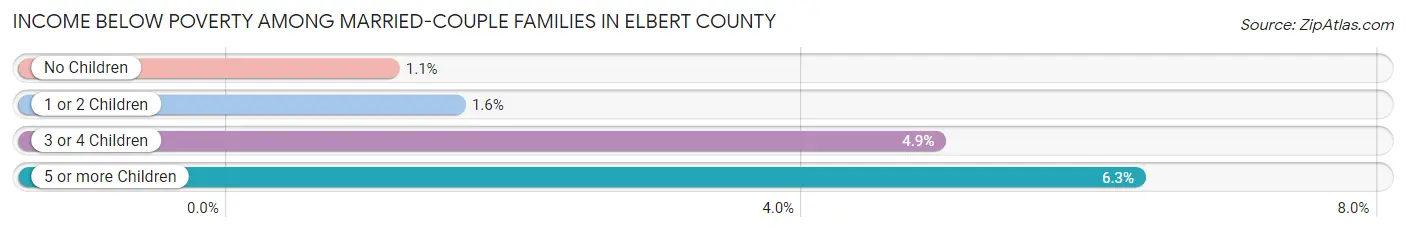
| Children | Above Poverty | Below Poverty |
| No Children | 4,400 (98.9%) | 50 (1.1%) |
| 1 or 2 Children | 1,808 (98.4%) | 29 (1.6%) |
| 3 or 4 Children | 328 (95.1%) | 17 (4.9%) |
| 5 or more Children | 89 (93.7%) | 6 (6.3%) |
| Total | 6,625 (98.5%) | 102 (1.5%) |
Income Below Poverty Among Single-Parent Households in Elbert County
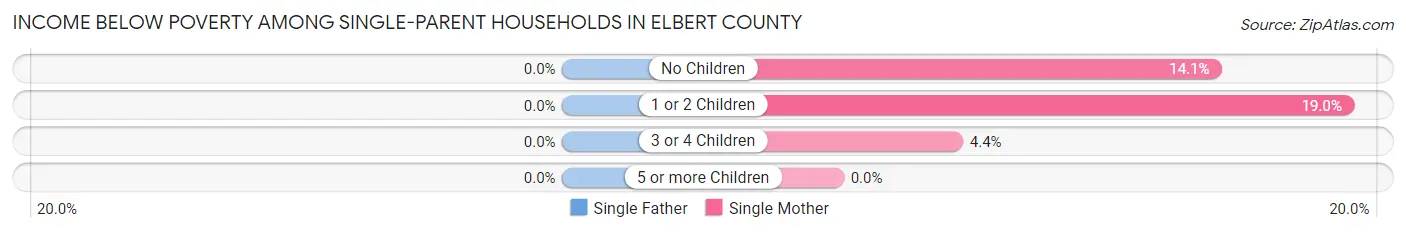
| Children | Single Father | Single Mother |
| No Children | 0 (0.0%) | 28 (14.1%) |
| 1 or 2 Children | 0 (0.0%) | 38 (19.0%) |
| 3 or 4 Children | 0 (0.0%) | 4 (4.4%) |
| 5 or more Children | 0 (0.0%) | 0 (0.0%) |
| Total | 0 (0.0%) | 70 (13.7%) |
Income Below Poverty Among Married-Couple vs Single-Parent Households in Elbert County
The poverty data for Elbert County shows that 102 of the married-couple family households (1.5%) and 70 of the single-parent households (6.7%) are living below the poverty level. Within the married-couple family households, those with 5 or more children have the highest poverty rate, with 6 households (6.3%) falling below the poverty line. Among the single-parent households, those with 1 or 2 children have the highest poverty rate, with 38 household (7.2%) living below poverty.
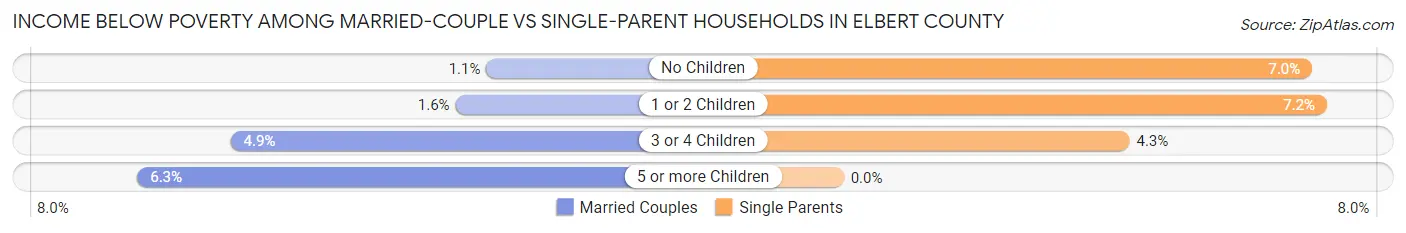
| Children | Married-Couple Families | Single-Parent Households |
| No Children | 50 (1.1%) | 28 (7.0%) |
| 1 or 2 Children | 29 (1.6%) | 38 (7.2%) |
| 3 or 4 Children | 17 (4.9%) | 4 (4.3%) |
| 5 or more Children | 6 (6.3%) | 0 (0.0%) |
| Total | 102 (1.5%) | 70 (6.7%) |
Employment Characteristics in Elbert County
Employment by Class of Employer in Elbert County
Among the 13,823 employed individuals in Elbert County, private company employees (8,985 | 65.0%), self-employed (incorporated) (1,210 | 8.7%), and local government employees (1,192 | 8.6%) make up the most common classes of employment.
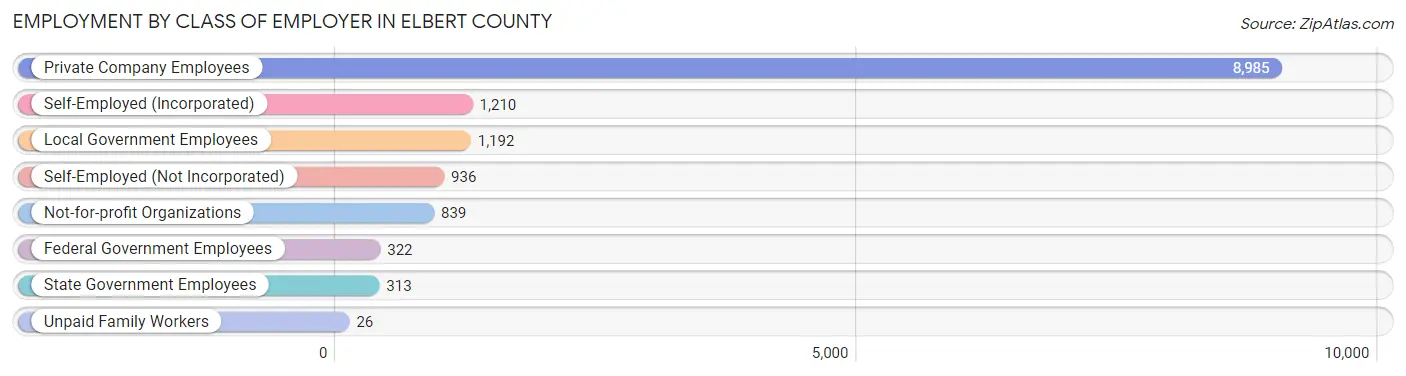
| Employer Class | # Employees | % Employees |
| Private Company Employees | 8,985 | 65.0% |
| Self-Employed (Incorporated) | 1,210 | 8.7% |
| Self-Employed (Not Incorporated) | 936 | 6.8% |
| Not-for-profit Organizations | 839 | 6.1% |
| Local Government Employees | 1,192 | 8.6% |
| State Government Employees | 313 | 2.3% |
| Federal Government Employees | 322 | 2.3% |
| Unpaid Family Workers | 26 | 0.2% |
| Total | 13,823 | 100.0% |
Employment Status by Age in Elbert County
According to the labor force statistics for Elbert County, out of the total population over 16 years of age (21,881), 66.4% or 14,529 individuals are in the labor force, with 2.3% or 334 of them unemployed. The age group with the highest labor force participation rate is 20 to 24 years, with 90.1% or 1,160 individuals in the labor force. Within the labor force, the 16 to 19 years age range has the highest percentage of unemployed individuals, with 7.4% or 61 of them being unemployed.
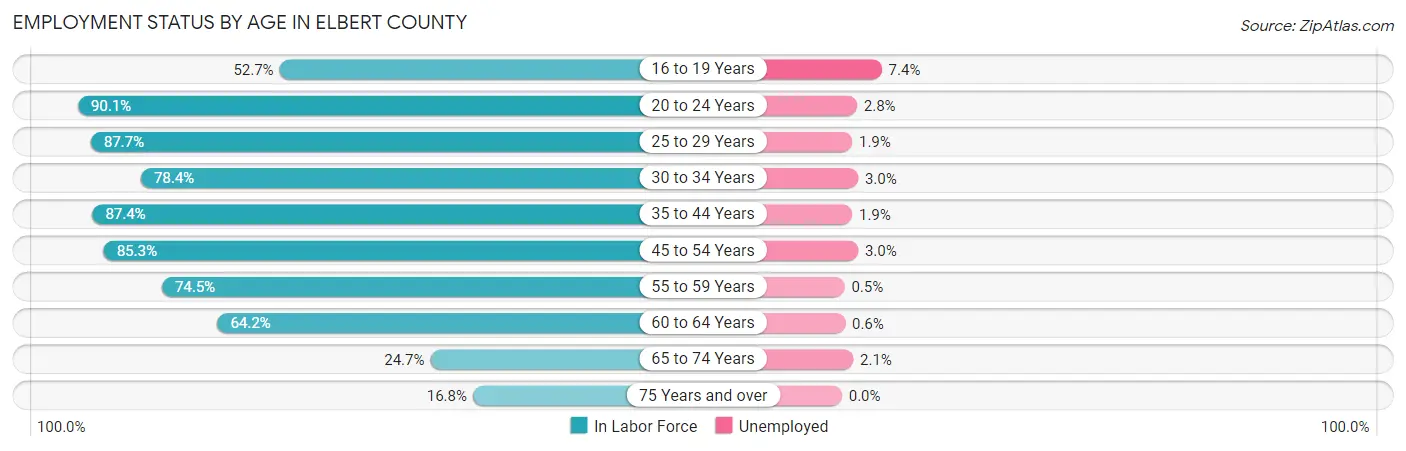
| Age Bracket | In Labor Force | Unemployed |
| 16 to 19 Years | 824 (52.7%) | 61 (7.4%) |
| 20 to 24 Years | 1,160 (90.1%) | 32 (2.8%) |
| 25 to 29 Years | 1,027 (87.7%) | 20 (1.9%) |
| 30 to 34 Years | 1,046 (78.4%) | 31 (3.0%) |
| 35 to 44 Years | 2,747 (87.4%) | 52 (1.9%) |
| 45 to 54 Years | 3,472 (85.3%) | 104 (3.0%) |
| 55 to 59 Years | 1,693 (74.5%) | 8 (0.5%) |
| 60 to 64 Years | 1,544 (64.2%) | 9 (0.6%) |
| 65 to 74 Years | 780 (24.7%) | 16 (2.1%) |
| 75 Years and over | 248 (16.8%) | 0 (0.0%) |
| Total | 14,529 (66.4%) | 334 (2.3%) |
Employment Status by Educational Attainment in Elbert County
According to labor force statistics for Elbert County, 80.1% of individuals (11,530) out of the total population between 25 and 64 years of age (14,395) are in the labor force, with 1.9% or 219 of them being unemployed. The group with the highest labor force participation rate are those with the educational attainment of bachelor's degree or higher, with 83.9% or 4,260 individuals in the labor force. Within the labor force, individuals with high school diploma education have the highest percentage of unemployment, with 3.5% or 99 of them being unemployed.
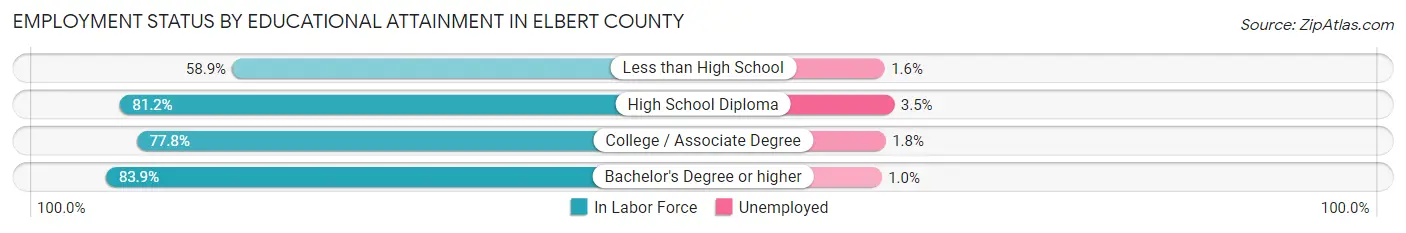
| Educational Attainment | In Labor Force | Unemployed |
| Less than High School | 311 (58.9%) | 8 (1.6%) |
| High School Diploma | 2,817 (81.2%) | 121 (3.5%) |
| College / Associate Degree | 4,140 (77.8%) | 96 (1.8%) |
| Bachelor's Degree or higher | 4,260 (83.9%) | 51 (1.0%) |
| Total | 11,530 (80.1%) | 274 (1.9%) |
Employment Occupations by Sex in Elbert County
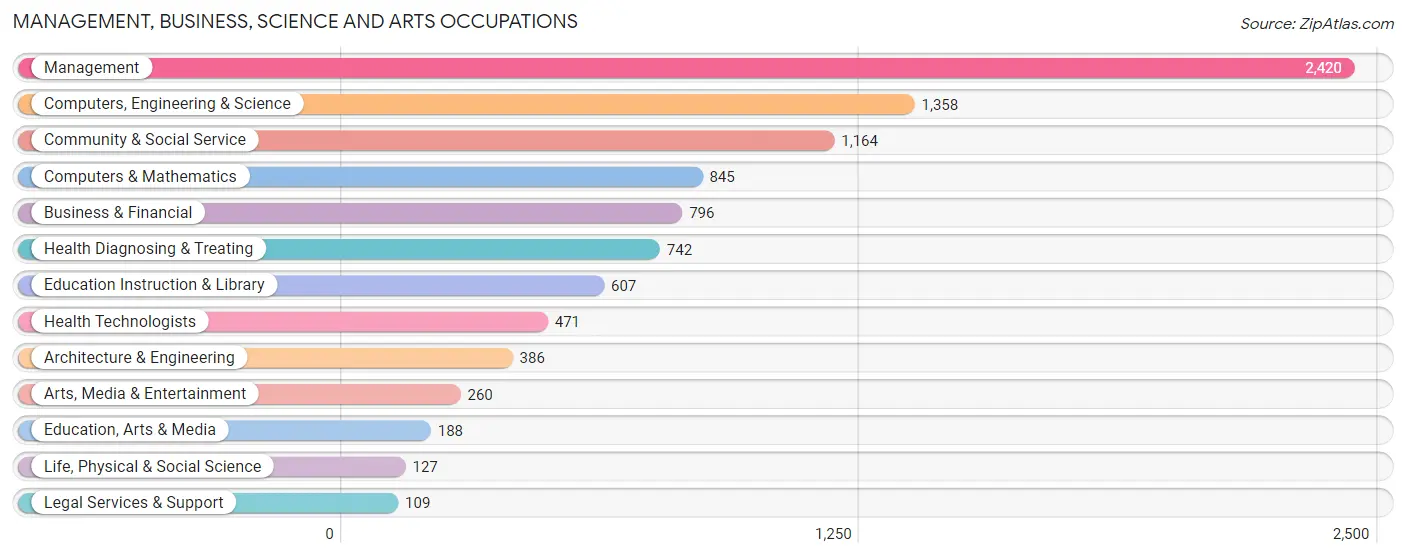
Management, Business, Science and Arts Occupations
The most common Management, Business, Science and Arts occupations in Elbert County are Management (2,420 | 17.1%), Computers, Engineering & Science (1,358 | 9.6%), Community & Social Service (1,164 | 8.2%), Computers & Mathematics (845 | 6.0%), and Business & Financial (796 | 5.6%).
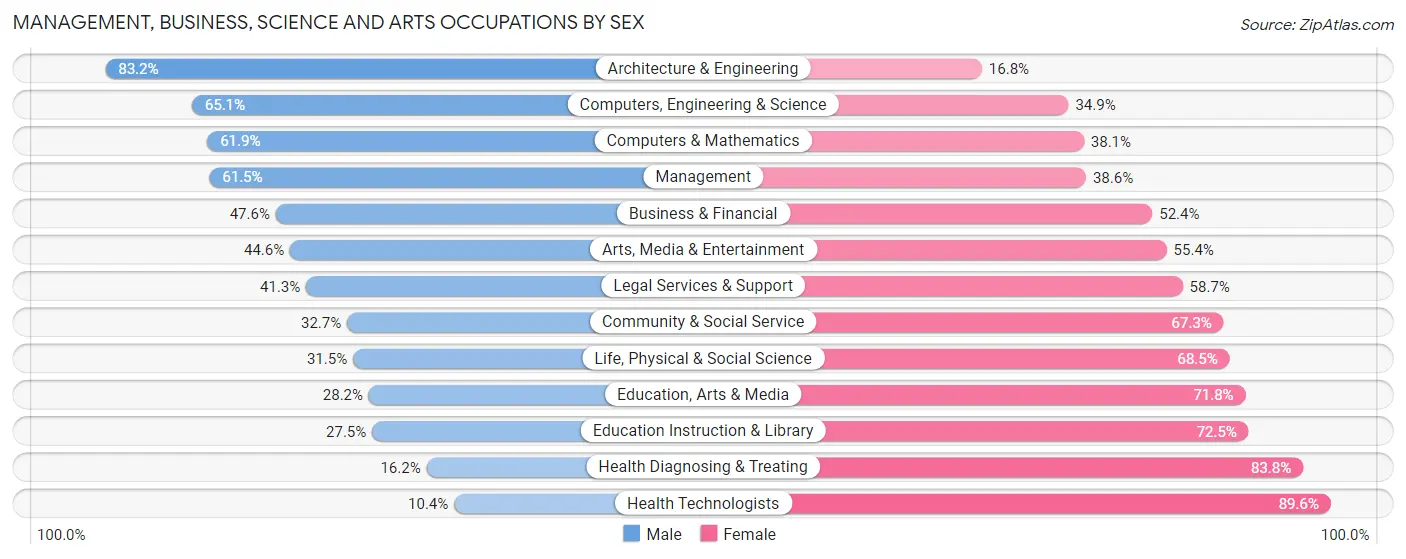
Management, Business, Science and Arts Occupations by Sex
Within the Management, Business, Science and Arts occupations in Elbert County, the most male-oriented occupations are Architecture & Engineering (83.2%), Computers, Engineering & Science (65.1%), and Computers & Mathematics (61.9%), while the most female-oriented occupations are Health Technologists (89.6%), Health Diagnosing & Treating (83.8%), and Education Instruction & Library (72.5%).
| Occupation | Male | Female |
| Management | 1,487 (61.5%) | 933 (38.6%) |
| Business & Financial | 379 (47.6%) | 417 (52.4%) |
| Computers, Engineering & Science | 884 (65.1%) | 474 (34.9%) |
| Computers & Mathematics | 523 (61.9%) | 322 (38.1%) |
| Architecture & Engineering | 321 (83.2%) | 65 (16.8%) |
| Life, Physical & Social Science | 40 (31.5%) | 87 (68.5%) |
| Community & Social Service | 381 (32.7%) | 783 (67.3%) |
| Education, Arts & Media | 53 (28.2%) | 135 (71.8%) |
| Legal Services & Support | 45 (41.3%) | 64 (58.7%) |
| Education Instruction & Library | 167 (27.5%) | 440 (72.5%) |
| Arts, Media & Entertainment | 116 (44.6%) | 144 (55.4%) |
| Health Diagnosing & Treating | 120 (16.2%) | 622 (83.8%) |
| Health Technologists | 49 (10.4%) | 422 (89.6%) |
| Total (Category) | 3,251 (50.2%) | 3,229 (49.8%) |
| Total (Overall) | 7,899 (55.7%) | 6,278 (44.3%) |
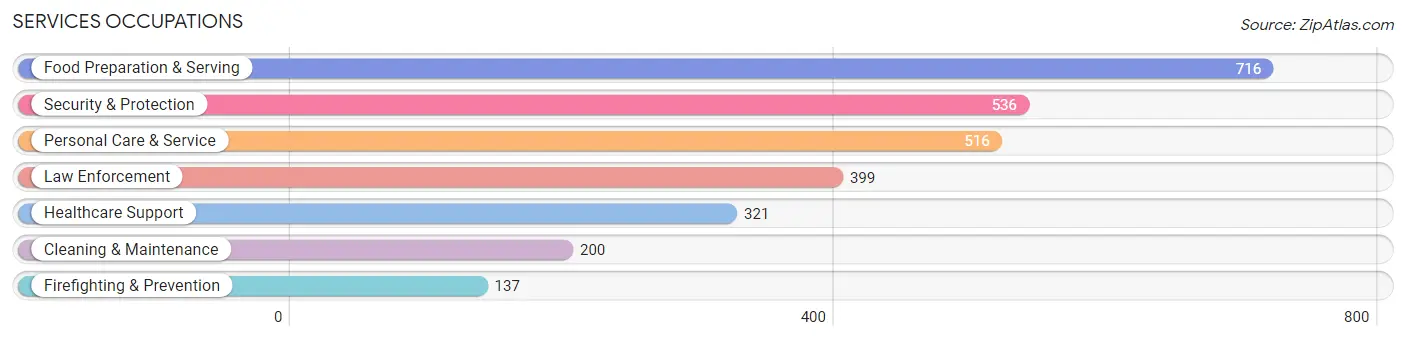
Services Occupations
The most common Services occupations in Elbert County are Food Preparation & Serving (716 | 5.1%), Security & Protection (536 | 3.8%), Personal Care & Service (516 | 3.6%), Law Enforcement (399 | 2.8%), and Healthcare Support (321 | 2.3%).
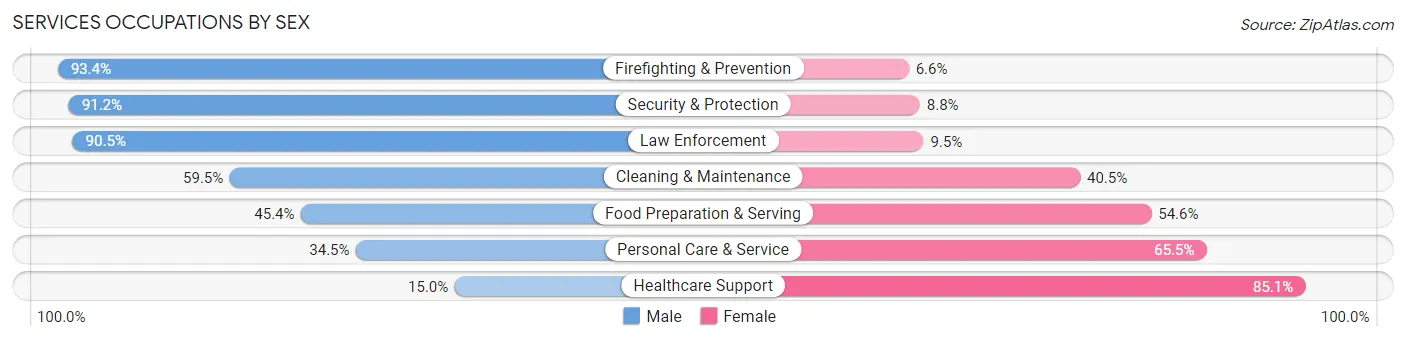
Services Occupations by Sex
Within the Services occupations in Elbert County, the most male-oriented occupations are Firefighting & Prevention (93.4%), Security & Protection (91.2%), and Law Enforcement (90.5%), while the most female-oriented occupations are Healthcare Support (85.1%), Personal Care & Service (65.5%), and Food Preparation & Serving (54.6%).
| Occupation | Male | Female |
| Healthcare Support | 48 (14.9%) | 273 (85.1%) |
| Security & Protection | 489 (91.2%) | 47 (8.8%) |
| Firefighting & Prevention | 128 (93.4%) | 9 (6.6%) |
| Law Enforcement | 361 (90.5%) | 38 (9.5%) |
| Food Preparation & Serving | 325 (45.4%) | 391 (54.6%) |
| Cleaning & Maintenance | 119 (59.5%) | 81 (40.5%) |
| Personal Care & Service | 178 (34.5%) | 338 (65.5%) |
| Total (Category) | 1,159 (50.6%) | 1,130 (49.4%) |
| Total (Overall) | 7,899 (55.7%) | 6,278 (44.3%) |
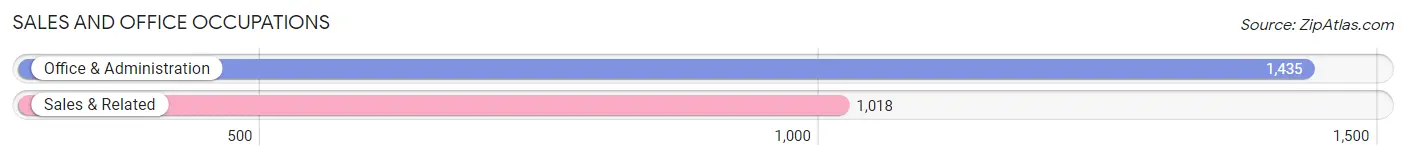
Sales and Office Occupations
The most common Sales and Office occupations in Elbert County are Office & Administration (1,435 | 10.1%), and Sales & Related (1,018 | 7.2%).
Sales and Office Occupations by Sex
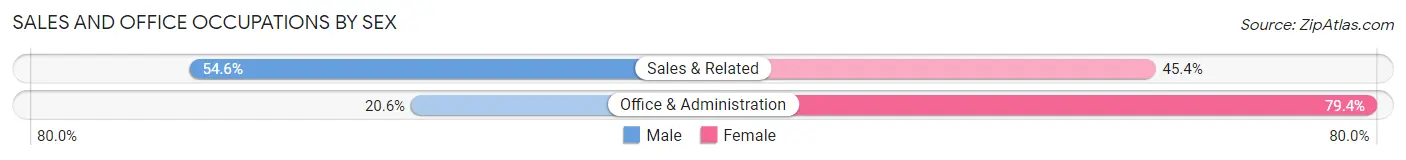
| Occupation | Male | Female |
| Sales & Related | 556 (54.6%) | 462 (45.4%) |
| Office & Administration | 295 (20.6%) | 1,140 (79.4%) |
| Total (Category) | 851 (34.7%) | 1,602 (65.3%) |
| Total (Overall) | 7,899 (55.7%) | 6,278 (44.3%) |
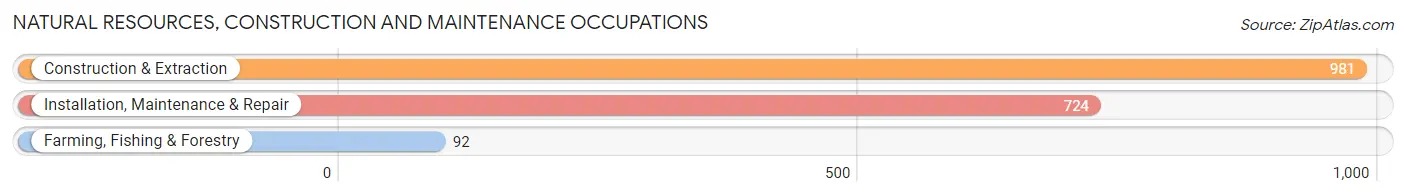
Natural Resources, Construction and Maintenance Occupations
The most common Natural Resources, Construction and Maintenance occupations in Elbert County are Construction & Extraction (981 | 6.9%), Installation, Maintenance & Repair (724 | 5.1%), and Farming, Fishing & Forestry (92 | 0.6%).
Natural Resources, Construction and Maintenance Occupations by Sex
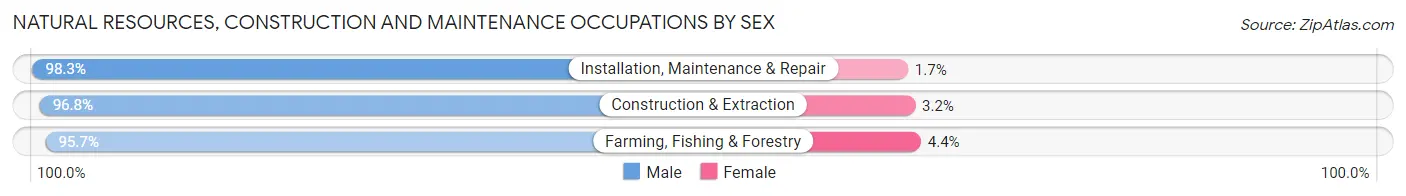
| Occupation | Male | Female |
| Farming, Fishing & Forestry | 88 (95.7%) | 4 (4.3%) |
| Construction & Extraction | 950 (96.8%) | 31 (3.2%) |
| Installation, Maintenance & Repair | 712 (98.3%) | 12 (1.7%) |
| Total (Category) | 1,750 (97.4%) | 47 (2.6%) |
| Total (Overall) | 7,899 (55.7%) | 6,278 (44.3%) |
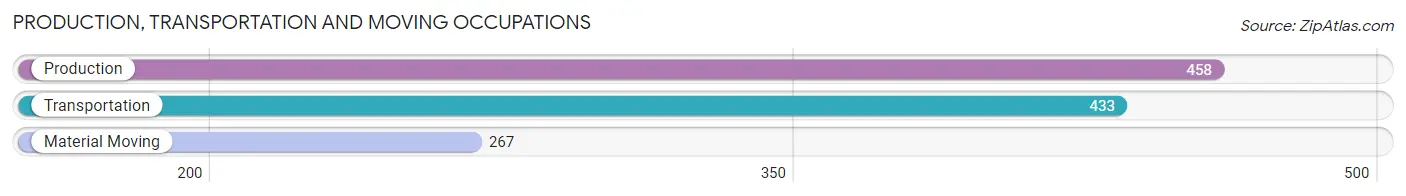
Production, Transportation and Moving Occupations
The most common Production, Transportation and Moving occupations in Elbert County are Production (458 | 3.2%), Transportation (433 | 3.0%), and Material Moving (267 | 1.9%).
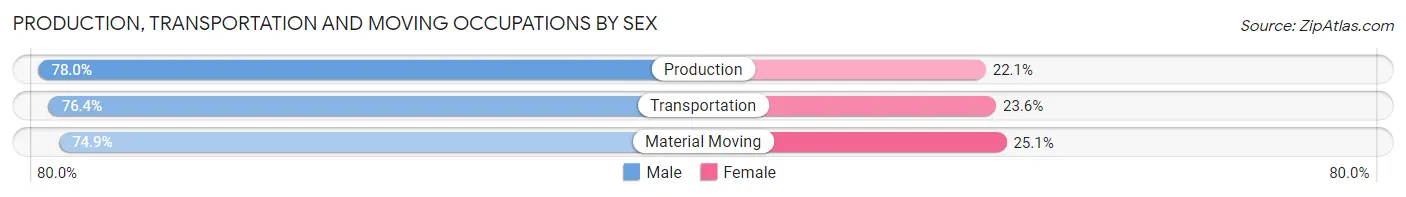
Production, Transportation and Moving Occupations by Sex
| Occupation | Male | Female |
| Production | 357 (77.9%) | 101 (22.1%) |
| Transportation | 331 (76.4%) | 102 (23.6%) |
| Material Moving | 200 (74.9%) | 67 (25.1%) |
| Total (Category) | 888 (76.7%) | 270 (23.3%) |
| Total (Overall) | 7,899 (55.7%) | 6,278 (44.3%) |
Employment Industries by Sex in Elbert County
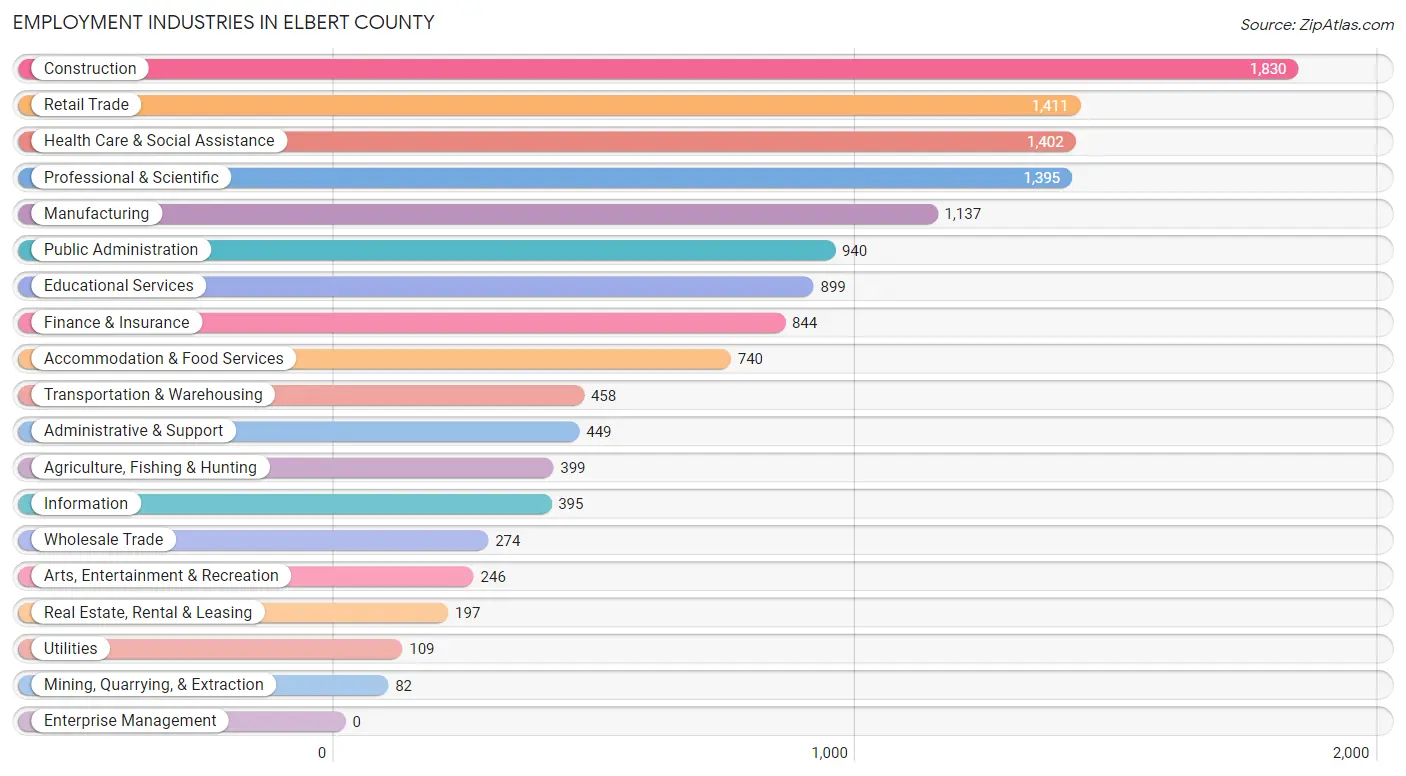
Employment Industries in Elbert County
The major employment industries in Elbert County include Construction (1,830 | 12.9%), Retail Trade (1,411 | 10.0%), Health Care & Social Assistance (1,402 | 9.9%), Professional & Scientific (1,395 | 9.8%), and Manufacturing (1,137 | 8.0%).
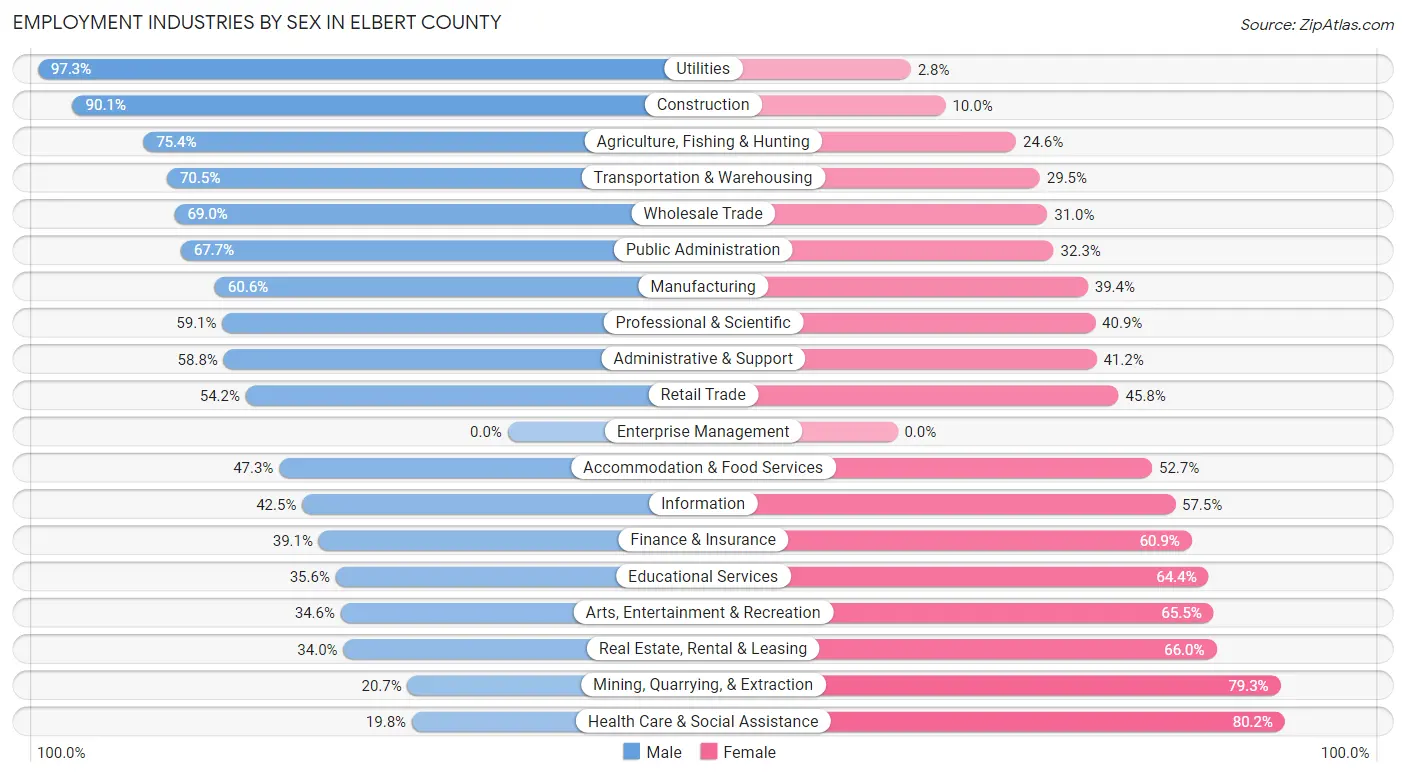
Employment Industries by Sex in Elbert County
The Elbert County industries that see more men than women are Utilities (97.3%), Construction (90.0%), and Agriculture, Fishing & Hunting (75.4%), whereas the industries that tend to have a higher number of women are Health Care & Social Assistance (80.2%), Mining, Quarrying, & Extraction (79.3%), and Real Estate, Rental & Leasing (66.0%).
| Industry | Male | Female |
| Agriculture, Fishing & Hunting | 301 (75.4%) | 98 (24.6%) |
| Mining, Quarrying, & Extraction | 17 (20.7%) | 65 (79.3%) |
| Construction | 1,648 (90.0%) | 182 (10.0%) |
| Manufacturing | 689 (60.6%) | 448 (39.4%) |
| Wholesale Trade | 189 (69.0%) | 85 (31.0%) |
| Retail Trade | 765 (54.2%) | 646 (45.8%) |
| Transportation & Warehousing | 323 (70.5%) | 135 (29.5%) |
| Utilities | 106 (97.3%) | 3 (2.8%) |
| Information | 168 (42.5%) | 227 (57.5%) |
| Finance & Insurance | 330 (39.1%) | 514 (60.9%) |
| Real Estate, Rental & Leasing | 67 (34.0%) | 130 (66.0%) |
| Professional & Scientific | 824 (59.1%) | 571 (40.9%) |
| Enterprise Management | 0 (0.0%) | 0 (0.0%) |
| Administrative & Support | 264 (58.8%) | 185 (41.2%) |
| Educational Services | 320 (35.6%) | 579 (64.4%) |
| Health Care & Social Assistance | 278 (19.8%) | 1,124 (80.2%) |
| Arts, Entertainment & Recreation | 85 (34.5%) | 161 (65.4%) |
| Accommodation & Food Services | 350 (47.3%) | 390 (52.7%) |
| Public Administration | 636 (67.7%) | 304 (32.3%) |
| Total | 7,899 (55.7%) | 6,278 (44.3%) |
Education in Elbert County
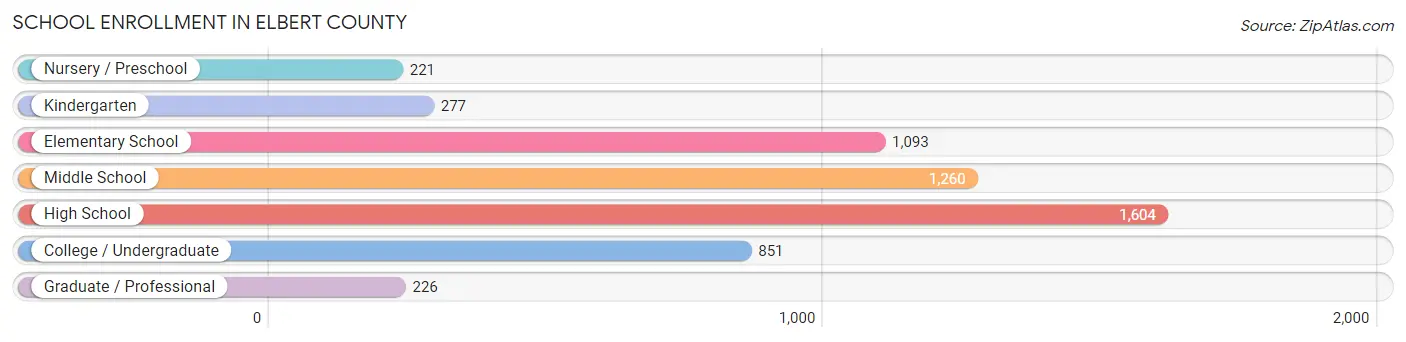
School Enrollment in Elbert County
The most common levels of schooling among the 5,532 students in Elbert County are high school (1,604 | 29.0%), middle school (1,260 | 22.8%), and elementary school (1,093 | 19.8%).
| School Level | # Students | % Students |
| Nursery / Preschool | 221 | 4.0% |
| Kindergarten | 277 | 5.0% |
| Elementary School | 1,093 | 19.8% |
| Middle School | 1,260 | 22.8% |
| High School | 1,604 | 29.0% |
| College / Undergraduate | 851 | 15.4% |
| Graduate / Professional | 226 | 4.1% |
| Total | 5,532 | 100.0% |
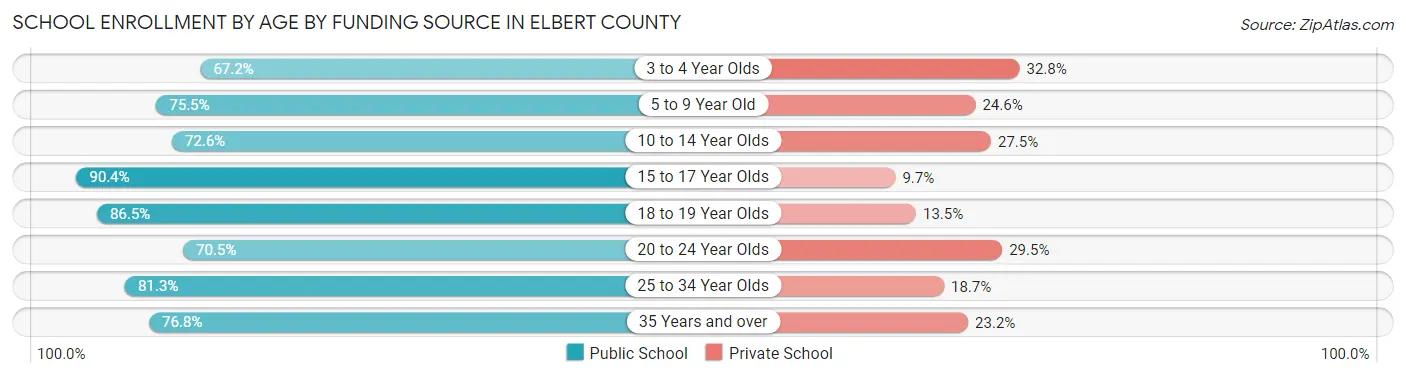
School Enrollment by Age by Funding Source in Elbert County
Out of a total of 5,532 students who are enrolled in schools in Elbert County, 1,195 (21.6%) attend a private institution, while the remaining 4,337 (78.4%) are enrolled in public schools. The age group of 3 to 4 year olds has the highest likelihood of being enrolled in private schools, with 38 (32.8% in the age bracket) enrolled. Conversely, the age group of 15 to 17 year olds has the lowest likelihood of being enrolled in a private school, with 1,151 (90.3% in the age bracket) attending a public institution.
| Age Bracket | Public School | Private School |
| 3 to 4 Year Olds | 78 (67.2%) | 38 (32.8%) |
| 5 to 9 Year Old | 974 (75.4%) | 317 (24.5%) |
| 10 to 14 Year Olds | 1,237 (72.6%) | 468 (27.5%) |
| 15 to 17 Year Olds | 1,151 (90.3%) | 123 (9.7%) |
| 18 to 19 Year Olds | 244 (86.5%) | 38 (13.5%) |
| 20 to 24 Year Olds | 241 (70.5%) | 101 (29.5%) |
| 25 to 34 Year Olds | 200 (81.3%) | 46 (18.7%) |
| 35 Years and over | 212 (76.8%) | 64 (23.2%) |
| Total | 4,337 (78.4%) | 1,195 (21.6%) |
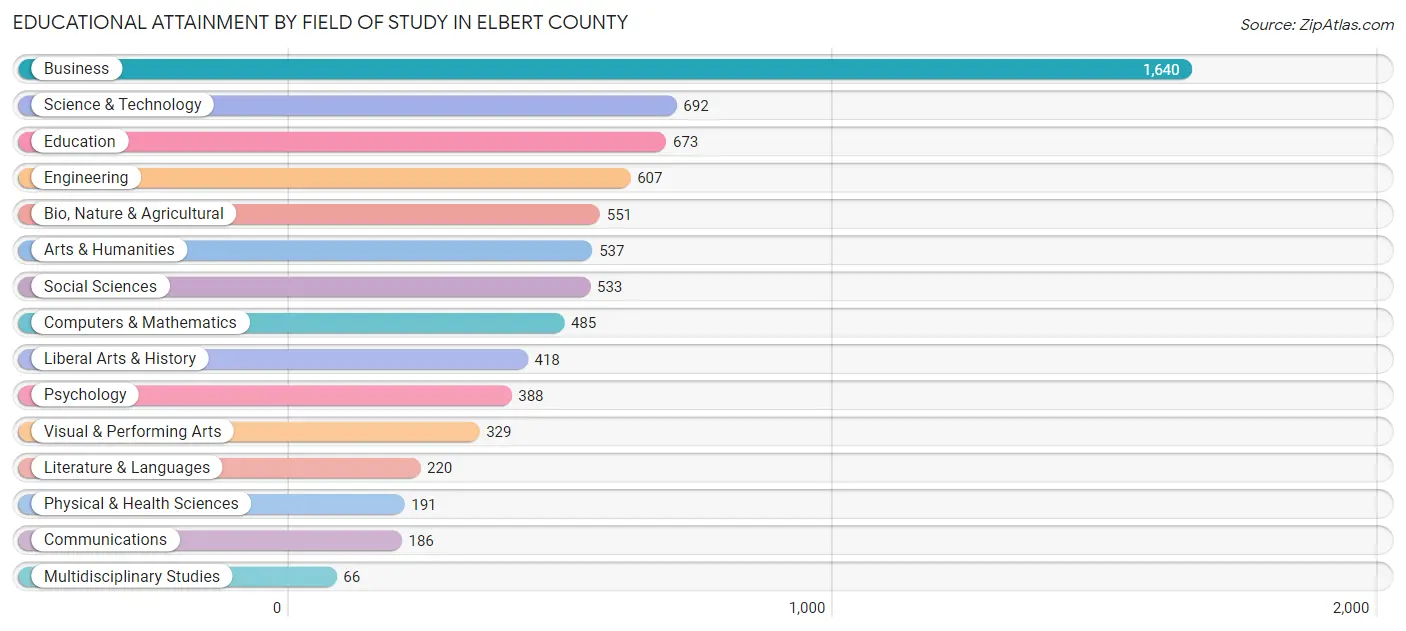
Educational Attainment by Field of Study in Elbert County
Business (1,640 | 21.8%), science & technology (692 | 9.2%), education (673 | 8.9%), engineering (607 | 8.1%), and bio, nature & agricultural (551 | 7.3%) are the most common fields of study among 7,516 individuals in Elbert County who have obtained a bachelor's degree or higher.
| Field of Study | # Graduates | % Graduates |
| Computers & Mathematics | 485 | 6.5% |
| Bio, Nature & Agricultural | 551 | 7.3% |
| Physical & Health Sciences | 191 | 2.5% |
| Psychology | 388 | 5.2% |
| Social Sciences | 533 | 7.1% |
| Engineering | 607 | 8.1% |
| Multidisciplinary Studies | 66 | 0.9% |
| Science & Technology | 692 | 9.2% |
| Business | 1,640 | 21.8% |
| Education | 673 | 8.9% |
| Literature & Languages | 220 | 2.9% |
| Liberal Arts & History | 418 | 5.6% |
| Visual & Performing Arts | 329 | 4.4% |
| Communications | 186 | 2.5% |
| Arts & Humanities | 537 | 7.1% |
| Total | 7,516 | 100.0% |
Transportation & Commute in Elbert County
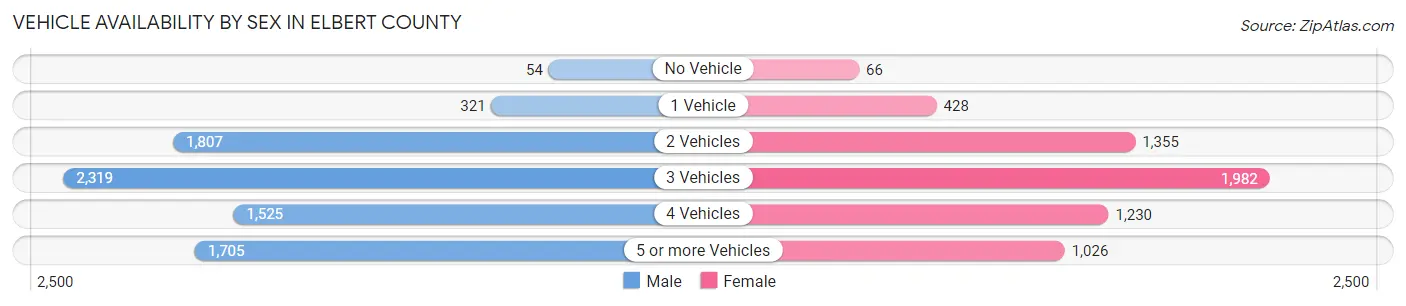
Vehicle Availability by Sex in Elbert County
The most prevalent vehicle ownership categories in Elbert County are males with 3 vehicles (2,319, accounting for 30.0%) and females with 3 vehicles (1,982, making up 38.1%).
| Vehicles Available | Male | Female |
| No Vehicle | 54 (0.7%) | 66 (1.1%) |
| 1 Vehicle | 321 (4.2%) | 428 (7.0%) |
| 2 Vehicles | 1,807 (23.4%) | 1,355 (22.3%) |
| 3 Vehicles | 2,319 (30.0%) | 1,982 (32.6%) |
| 4 Vehicles | 1,525 (19.7%) | 1,230 (20.2%) |
| 5 or more Vehicles | 1,705 (22.1%) | 1,026 (16.9%) |
| Total | 7,731 (100.0%) | 6,087 (100.0%) |
Commute Time in Elbert County
The most frequently occuring commute durations in Elbert County are 45 to 59 minutes (2,779 commuters, 24.0%), 60 to 89 minutes (2,088 commuters, 18.0%), and 30 to 34 minutes (1,445 commuters, 12.5%).
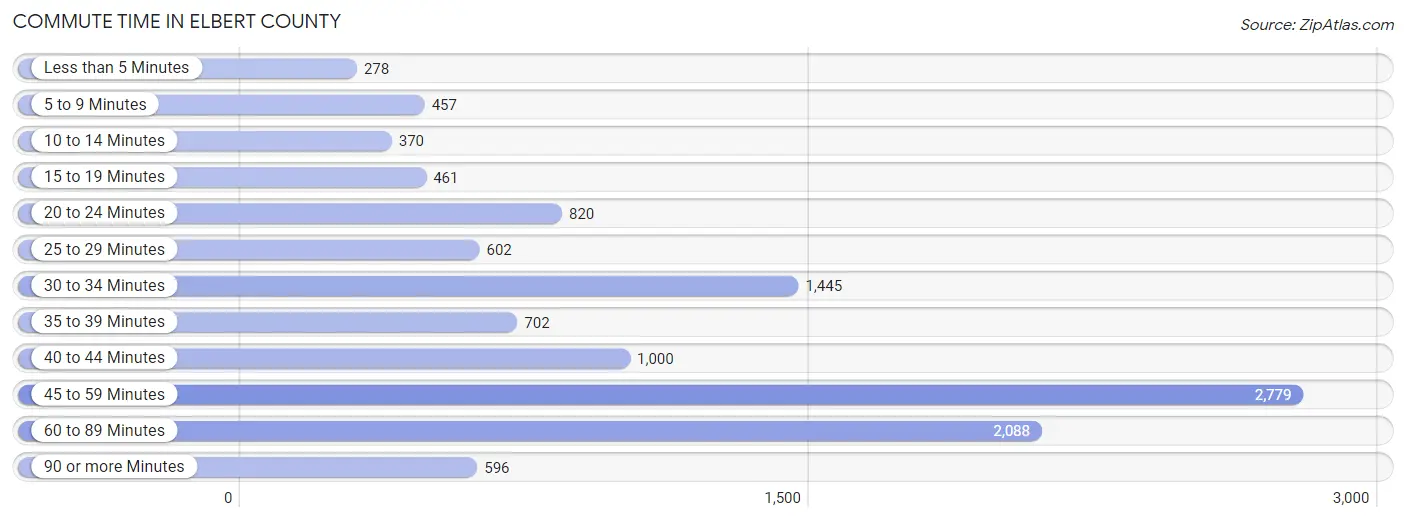
| Commute Time | # Commuters | % Commuters |
| Less than 5 Minutes | 278 | 2.4% |
| 5 to 9 Minutes | 457 | 3.9% |
| 10 to 14 Minutes | 370 | 3.2% |
| 15 to 19 Minutes | 461 | 4.0% |
| 20 to 24 Minutes | 820 | 7.1% |
| 25 to 29 Minutes | 602 | 5.2% |
| 30 to 34 Minutes | 1,445 | 12.5% |
| 35 to 39 Minutes | 702 | 6.0% |
| 40 to 44 Minutes | 1,000 | 8.6% |
| 45 to 59 Minutes | 2,779 | 24.0% |
| 60 to 89 Minutes | 2,088 | 18.0% |
| 90 or more Minutes | 596 | 5.1% |
Commute Time by Sex in Elbert County
The most common commute times in Elbert County are 45 to 59 minutes (1,719 commuters, 25.9%) for males and 45 to 59 minutes (1,060 commuters, 21.4%) for females.
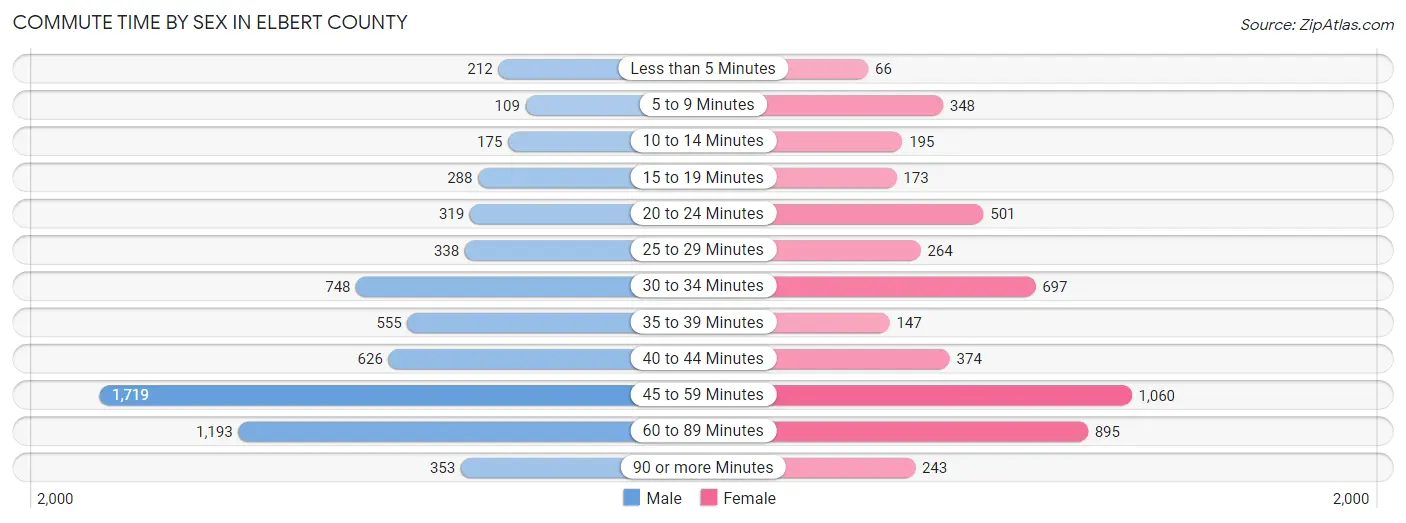
| Commute Time | Male | Female |
| Less than 5 Minutes | 212 (3.2%) | 66 (1.3%) |
| 5 to 9 Minutes | 109 (1.6%) | 348 (7.0%) |
| 10 to 14 Minutes | 175 (2.6%) | 195 (3.9%) |
| 15 to 19 Minutes | 288 (4.3%) | 173 (3.5%) |
| 20 to 24 Minutes | 319 (4.8%) | 501 (10.1%) |
| 25 to 29 Minutes | 338 (5.1%) | 264 (5.3%) |
| 30 to 34 Minutes | 748 (11.3%) | 697 (14.0%) |
| 35 to 39 Minutes | 555 (8.4%) | 147 (3.0%) |
| 40 to 44 Minutes | 626 (9.4%) | 374 (7.5%) |
| 45 to 59 Minutes | 1,719 (25.9%) | 1,060 (21.4%) |
| 60 to 89 Minutes | 1,193 (18.0%) | 895 (18.0%) |
| 90 or more Minutes | 353 (5.3%) | 243 (4.9%) |
Time of Departure to Work by Sex in Elbert County
The most frequent times of departure to work in Elbert County are 6:00 AM to 6:29 AM (1,099, 16.6%) for males and 7:00 AM to 7:29 AM (1,311, 26.4%) for females.
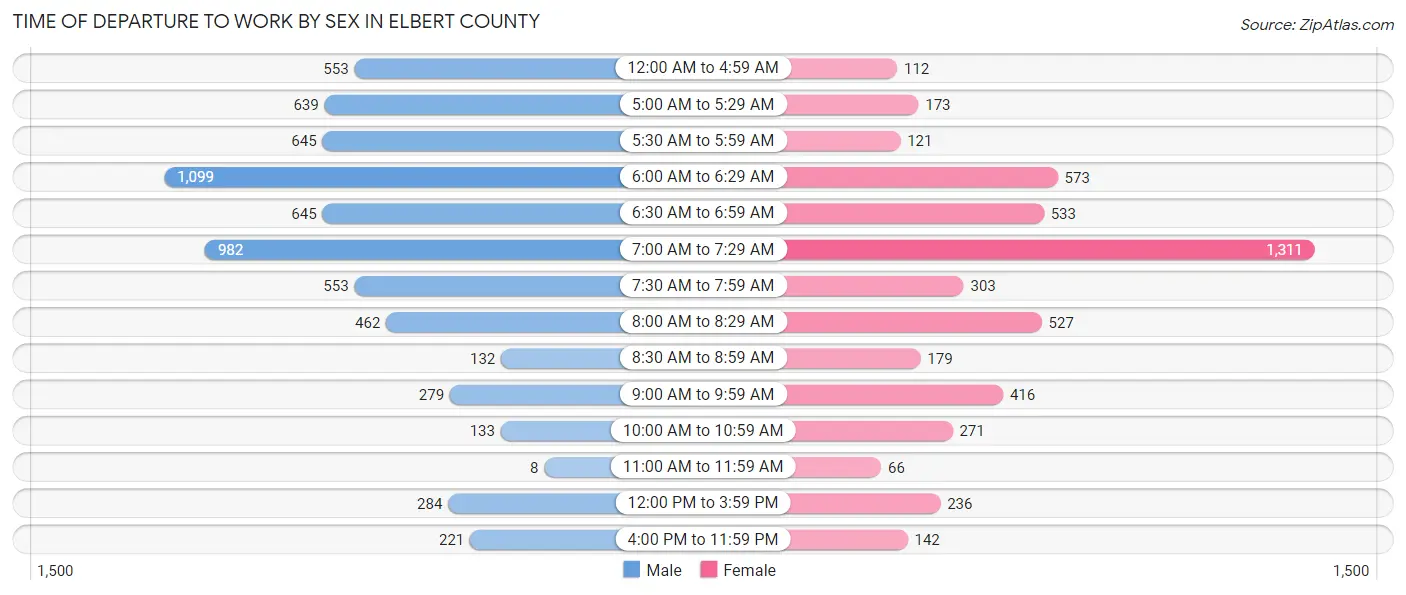
| Time of Departure | Male | Female |
| 12:00 AM to 4:59 AM | 553 (8.3%) | 112 (2.3%) |
| 5:00 AM to 5:29 AM | 639 (9.6%) | 173 (3.5%) |
| 5:30 AM to 5:59 AM | 645 (9.7%) | 121 (2.4%) |
| 6:00 AM to 6:29 AM | 1,099 (16.6%) | 573 (11.6%) |
| 6:30 AM to 6:59 AM | 645 (9.7%) | 533 (10.7%) |
| 7:00 AM to 7:29 AM | 982 (14.8%) | 1,311 (26.4%) |
| 7:30 AM to 7:59 AM | 553 (8.3%) | 303 (6.1%) |
| 8:00 AM to 8:29 AM | 462 (7.0%) | 527 (10.6%) |
| 8:30 AM to 8:59 AM | 132 (2.0%) | 179 (3.6%) |
| 9:00 AM to 9:59 AM | 279 (4.2%) | 416 (8.4%) |
| 10:00 AM to 10:59 AM | 133 (2.0%) | 271 (5.5%) |
| 11:00 AM to 11:59 AM | 8 (0.1%) | 66 (1.3%) |
| 12:00 PM to 3:59 PM | 284 (4.3%) | 236 (4.8%) |
| 4:00 PM to 11:59 PM | 221 (3.3%) | 142 (2.9%) |
| Total | 6,635 (100.0%) | 4,963 (100.0%) |
Housing Occupancy in Elbert County
Occupancy by Ownership in Elbert County
Of the total 9,514 dwellings in Elbert County, owner-occupied units account for 8,881 (93.3%), while renter-occupied units make up 633 (6.7%).
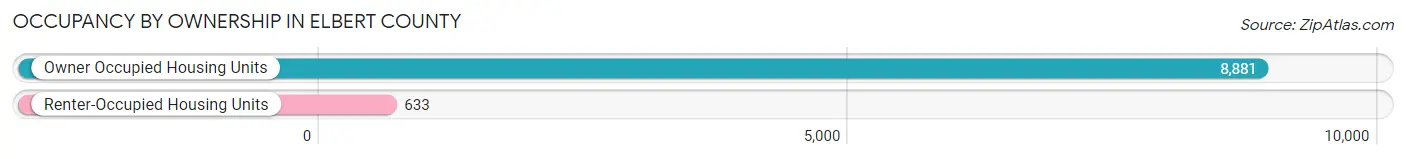
| Occupancy | # Housing Units | % Housing Units |
| Owner Occupied Housing Units | 8,881 | 93.3% |
| Renter-Occupied Housing Units | 633 | 6.7% |
| Total Occupied Housing Units | 9,514 | 100.0% |
Occupancy by Household Size in Elbert County
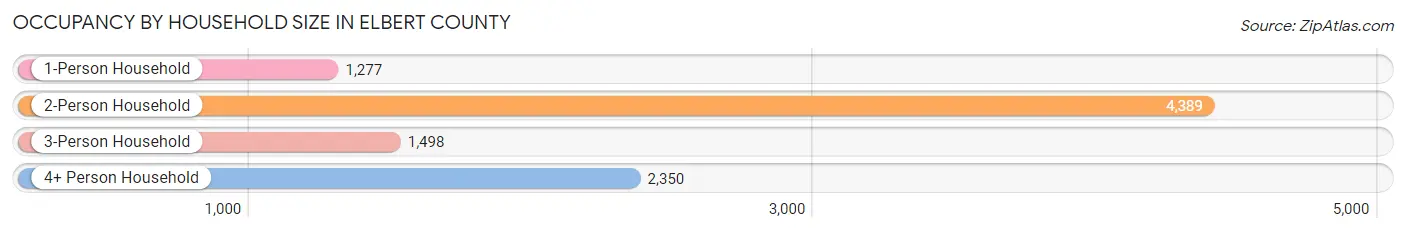
| Household Size | # Housing Units | % Housing Units |
| 1-Person Household | 1,277 | 13.4% |
| 2-Person Household | 4,389 | 46.1% |
| 3-Person Household | 1,498 | 15.8% |
| 4+ Person Household | 2,350 | 24.7% |
| Total Housing Units | 9,514 | 100.0% |
Occupancy by Ownership by Household Size in Elbert County
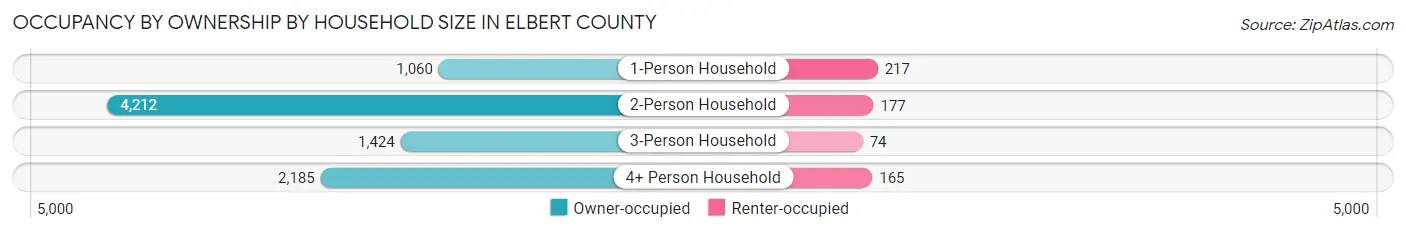
| Household Size | Owner-occupied | Renter-occupied |
| 1-Person Household | 1,060 (83.0%) | 217 (17.0%) |
| 2-Person Household | 4,212 (96.0%) | 177 (4.0%) |
| 3-Person Household | 1,424 (95.1%) | 74 (4.9%) |
| 4+ Person Household | 2,185 (93.0%) | 165 (7.0%) |
| Total Housing Units | 8,881 (93.3%) | 633 (6.7%) |
Occupancy by Educational Attainment in Elbert County
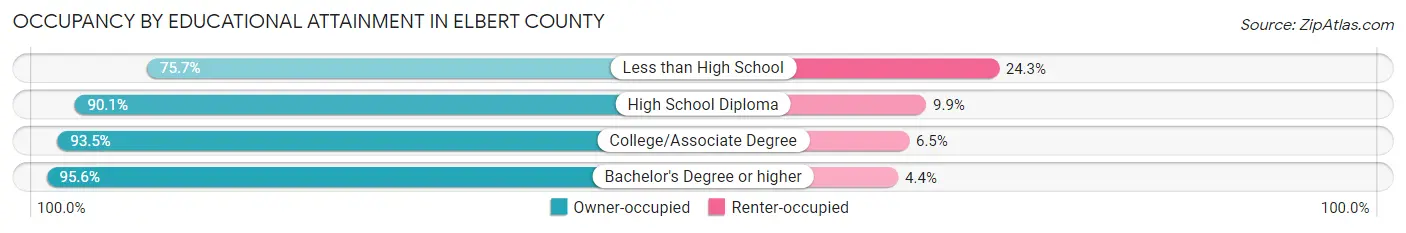
| Household Size | Owner-occupied | Renter-occupied |
| Less than High School | 165 (75.7%) | 53 (24.3%) |
| High School Diploma | 1,639 (90.1%) | 180 (9.9%) |
| College/Associate Degree | 3,215 (93.5%) | 224 (6.5%) |
| Bachelor's Degree or higher | 3,862 (95.6%) | 176 (4.4%) |
Occupancy by Age of Householder in Elbert County
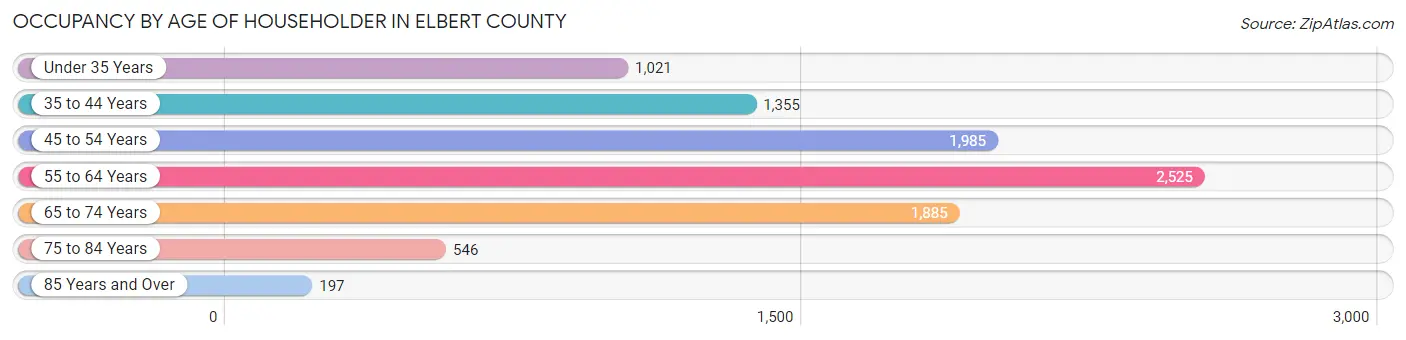
| Age Bracket | # Households | % Households |
| Under 35 Years | 1,021 | 10.7% |
| 35 to 44 Years | 1,355 | 14.2% |
| 45 to 54 Years | 1,985 | 20.9% |
| 55 to 64 Years | 2,525 | 26.5% |
| 65 to 74 Years | 1,885 | 19.8% |
| 75 to 84 Years | 546 | 5.7% |
| 85 Years and Over | 197 | 2.1% |
| Total | 9,514 | 100.0% |
Housing Finances in Elbert County
Median Income by Occupancy in Elbert County
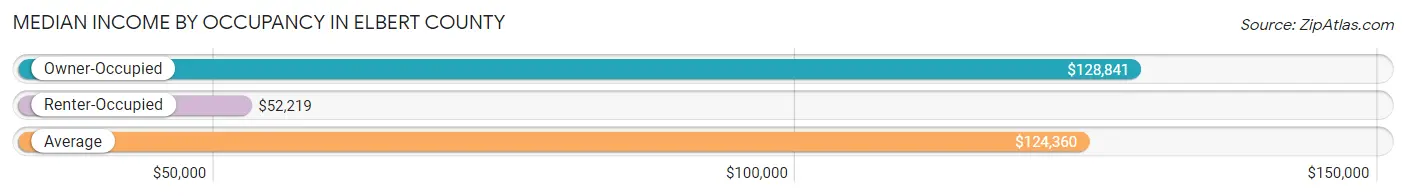
| Occupancy Type | # Households | Median Income |
| Owner-Occupied | 8,881 (93.3%) | $128,841 |
| Renter-Occupied | 633 (6.7%) | $52,219 |
| Average | 9,514 (100.0%) | $124,360 |
Occupancy by Householder Income Bracket in Elbert County
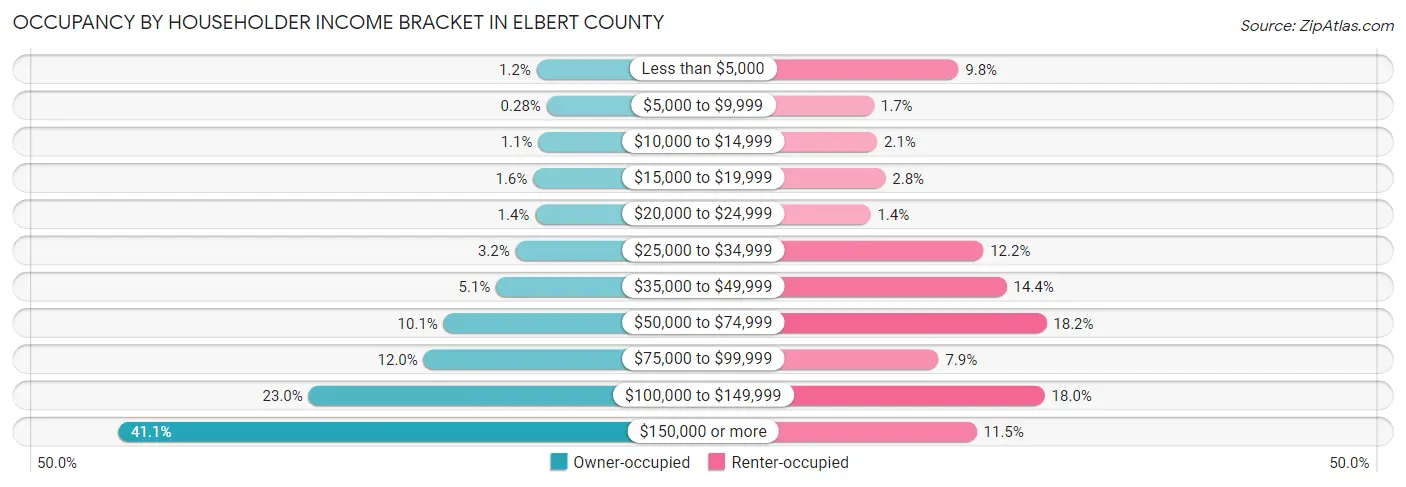
| Income Bracket | Owner-occupied | Renter-occupied |
| Less than $5,000 | 109 (1.2%) | 62 (9.8%) |
| $5,000 to $9,999 | 25 (0.3%) | 11 (1.7%) |
| $10,000 to $14,999 | 96 (1.1%) | 13 (2.1%) |
| $15,000 to $19,999 | 139 (1.6%) | 18 (2.8%) |
| $20,000 to $24,999 | 122 (1.4%) | 9 (1.4%) |
| $25,000 to $34,999 | 288 (3.2%) | 77 (12.2%) |
| $35,000 to $49,999 | 452 (5.1%) | 91 (14.4%) |
| $50,000 to $74,999 | 896 (10.1%) | 115 (18.2%) |
| $75,000 to $99,999 | 1,066 (12.0%) | 50 (7.9%) |
| $100,000 to $149,999 | 2,038 (23.0%) | 114 (18.0%) |
| $150,000 or more | 3,650 (41.1%) | 73 (11.5%) |
| Total | 8,881 (100.0%) | 633 (100.0%) |
Monthly Housing Cost Tiers in Elbert County
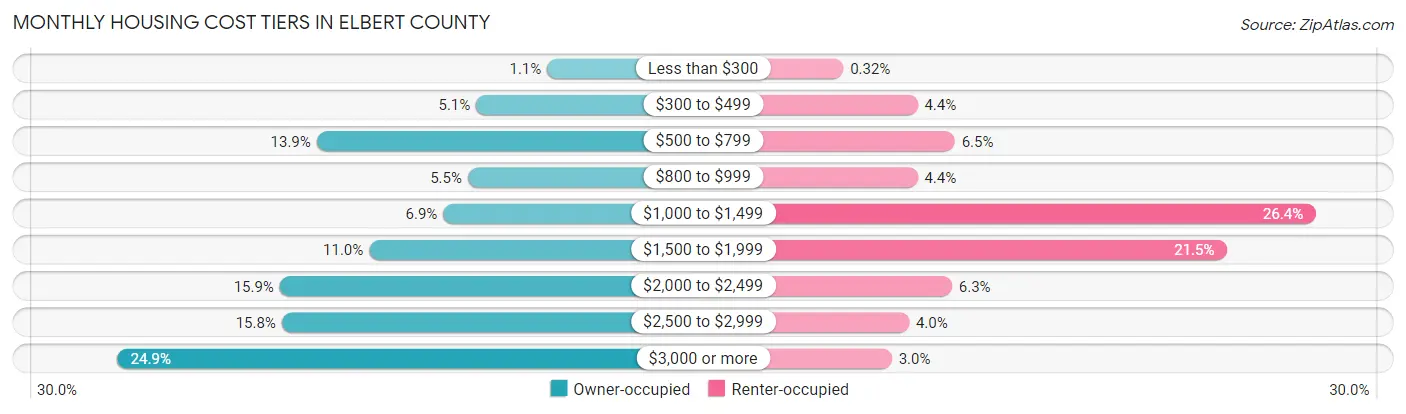
| Monthly Cost | Owner-occupied | Renter-occupied |
| Less than $300 | 101 (1.1%) | 2 (0.3%) |
| $300 to $499 | 449 (5.1%) | 28 (4.4%) |
| $500 to $799 | 1,232 (13.9%) | 41 (6.5%) |
| $800 to $999 | 490 (5.5%) | 28 (4.4%) |
| $1,000 to $1,499 | 611 (6.9%) | 167 (26.4%) |
| $1,500 to $1,999 | 974 (11.0%) | 136 (21.5%) |
| $2,000 to $2,499 | 1,413 (15.9%) | 40 (6.3%) |
| $2,500 to $2,999 | 1,403 (15.8%) | 25 (4.0%) |
| $3,000 or more | 2,208 (24.9%) | 19 (3.0%) |
| Total | 8,881 (100.0%) | 633 (100.0%) |
Physical Housing Characteristics in Elbert County
Housing Structures in Elbert County
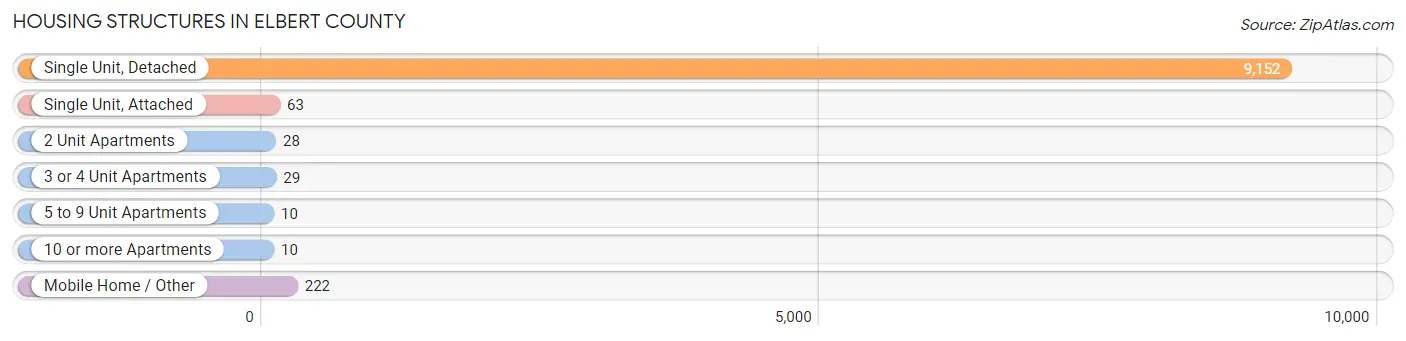
| Structure Type | # Housing Units | % Housing Units |
| Single Unit, Detached | 9,152 | 96.2% |
| Single Unit, Attached | 63 | 0.7% |
| 2 Unit Apartments | 28 | 0.3% |
| 3 or 4 Unit Apartments | 29 | 0.3% |
| 5 to 9 Unit Apartments | 10 | 0.1% |
| 10 or more Apartments | 10 | 0.1% |
| Mobile Home / Other | 222 | 2.3% |
| Total | 9,514 | 100.0% |
Housing Structures by Occupancy in Elbert County
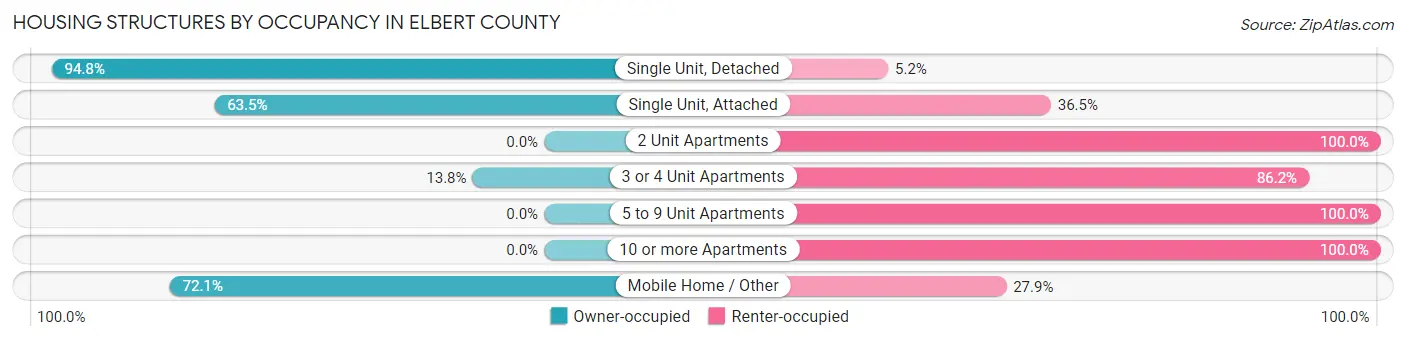
| Structure Type | Owner-occupied | Renter-occupied |
| Single Unit, Detached | 8,677 (94.8%) | 475 (5.2%) |
| Single Unit, Attached | 40 (63.5%) | 23 (36.5%) |
| 2 Unit Apartments | 0 (0.0%) | 28 (100.0%) |
| 3 or 4 Unit Apartments | 4 (13.8%) | 25 (86.2%) |
| 5 to 9 Unit Apartments | 0 (0.0%) | 10 (100.0%) |
| 10 or more Apartments | 0 (0.0%) | 10 (100.0%) |
| Mobile Home / Other | 160 (72.1%) | 62 (27.9%) |
| Total | 8,881 (93.3%) | 633 (6.7%) |
Housing Structures by Number of Rooms in Elbert County
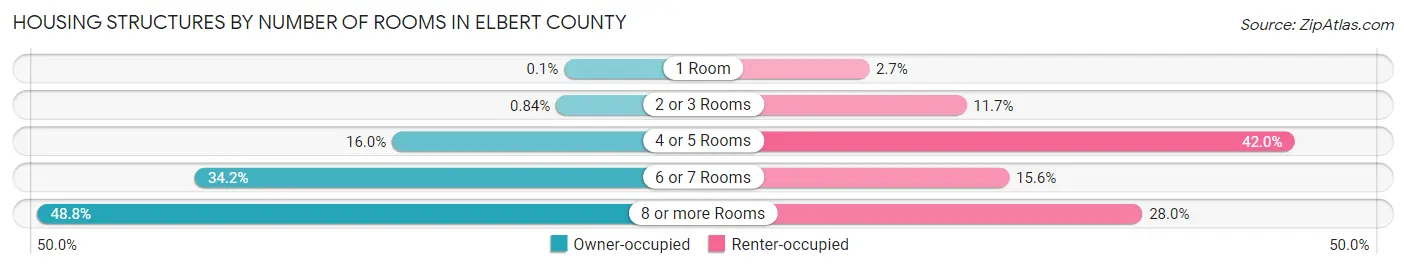
| Number of Rooms | Owner-occupied | Renter-occupied |
| 1 Room | 9 (0.1%) | 17 (2.7%) |
| 2 or 3 Rooms | 75 (0.8%) | 74 (11.7%) |
| 4 or 5 Rooms | 1,423 (16.0%) | 266 (42.0%) |
| 6 or 7 Rooms | 3,041 (34.2%) | 99 (15.6%) |
| 8 or more Rooms | 4,333 (48.8%) | 177 (28.0%) |
| Total | 8,881 (100.0%) | 633 (100.0%) |
Housing Structure by Heating Type in Elbert County
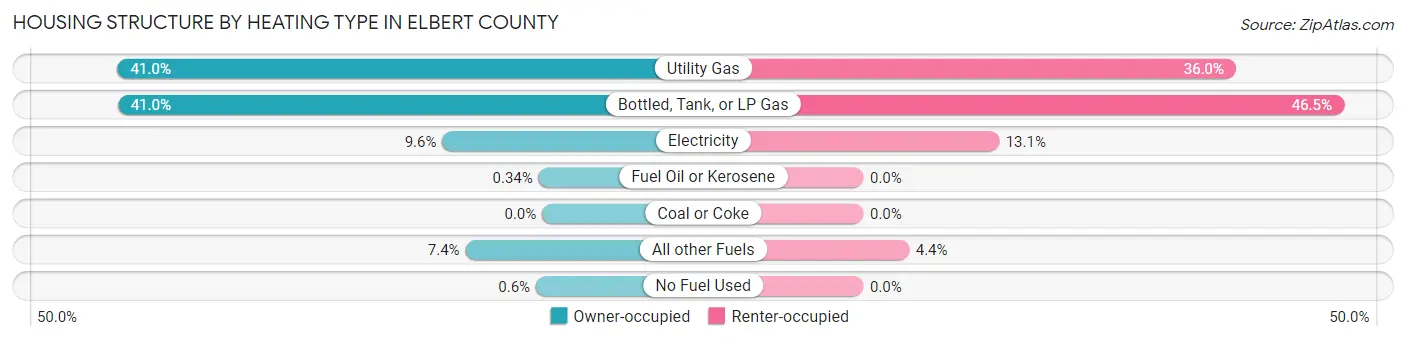
| Heating Type | Owner-occupied | Renter-occupied |
| Utility Gas | 3,643 (41.0%) | 228 (36.0%) |
| Bottled, Tank, or LP Gas | 3,641 (41.0%) | 294 (46.5%) |
| Electricity | 856 (9.6%) | 83 (13.1%) |
| Fuel Oil or Kerosene | 30 (0.3%) | 0 (0.0%) |
| Coal or Coke | 0 (0.0%) | 0 (0.0%) |
| All other Fuels | 658 (7.4%) | 28 (4.4%) |
| No Fuel Used | 53 (0.6%) | 0 (0.0%) |
| Total | 8,881 (100.0%) | 633 (100.0%) |
Household Vehicle Usage in Elbert County
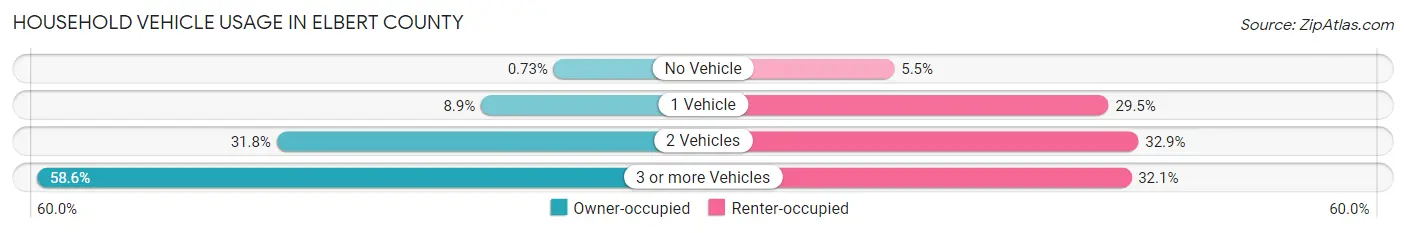
| Vehicles per Household | Owner-occupied | Renter-occupied |
| No Vehicle | 65 (0.7%) | 35 (5.5%) |
| 1 Vehicle | 788 (8.9%) | 187 (29.5%) |
| 2 Vehicles | 2,821 (31.8%) | 208 (32.9%) |
| 3 or more Vehicles | 5,207 (58.6%) | 203 (32.1%) |
| Total | 8,881 (100.0%) | 633 (100.0%) |
Real Estate & Mortgages in Elbert County
Real Estate and Mortgage Overview in Elbert County
| Characteristic | Without Mortgage | With Mortgage |
| Housing Units | 2,283 | 6,598 |
| Median Property Value | $599,000 | $629,000 |
| Median Household Income | $78,932 | $2,970 |
| Monthly Housing Costs | $642 | $2,195 |
| Real Estate Taxes | $2,525 | $101 |
Property Value by Mortgage Status in Elbert County
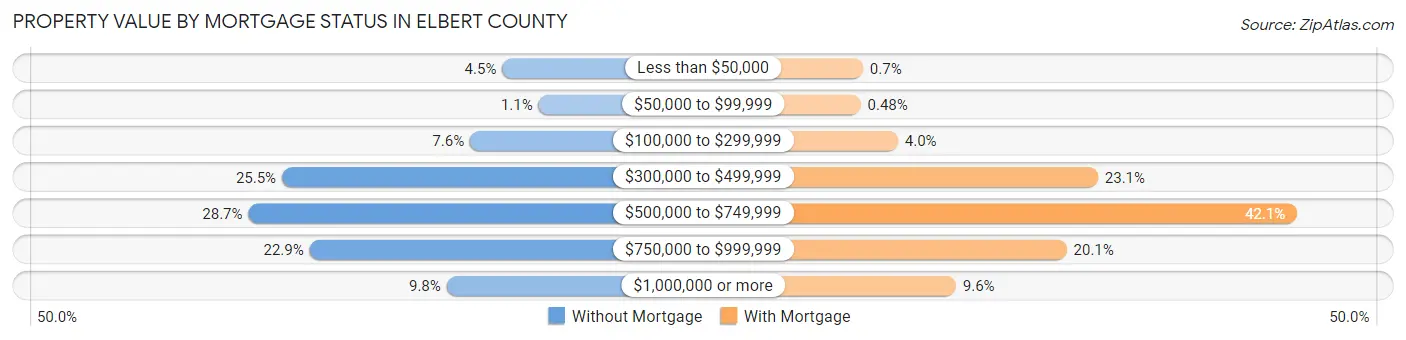
| Property Value | Without Mortgage | With Mortgage |
| Less than $50,000 | 103 (4.5%) | 46 (0.7%) |
| $50,000 to $99,999 | 24 (1.1%) | 32 (0.5%) |
| $100,000 to $299,999 | 173 (7.6%) | 266 (4.0%) |
| $300,000 to $499,999 | 582 (25.5%) | 1,523 (23.1%) |
| $500,000 to $749,999 | 655 (28.7%) | 2,775 (42.1%) |
| $750,000 to $999,999 | 522 (22.9%) | 1,326 (20.1%) |
| $1,000,000 or more | 224 (9.8%) | 630 (9.6%) |
| Total | 2,283 (100.0%) | 6,598 (100.0%) |
Household Income by Mortgage Status in Elbert County
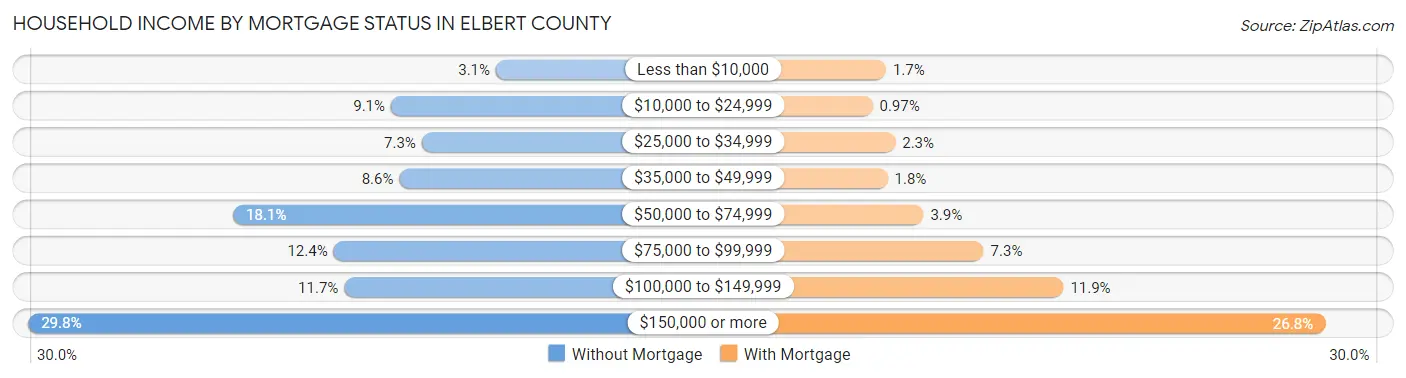
| Household Income | Without Mortgage | With Mortgage |
| Less than $10,000 | 70 (3.1%) | 115 (1.7%) |
| $10,000 to $24,999 | 207 (9.1%) | 64 (1.0%) |
| $25,000 to $34,999 | 167 (7.3%) | 150 (2.3%) |
| $35,000 to $49,999 | 196 (8.6%) | 121 (1.8%) |
| $50,000 to $74,999 | 413 (18.1%) | 256 (3.9%) |
| $75,000 to $99,999 | 282 (12.3%) | 483 (7.3%) |
| $100,000 to $149,999 | 268 (11.7%) | 784 (11.9%) |
| $150,000 or more | 680 (29.8%) | 1,770 (26.8%) |
| Total | 2,283 (100.0%) | 6,598 (100.0%) |
Property Value to Household Income Ratio in Elbert County
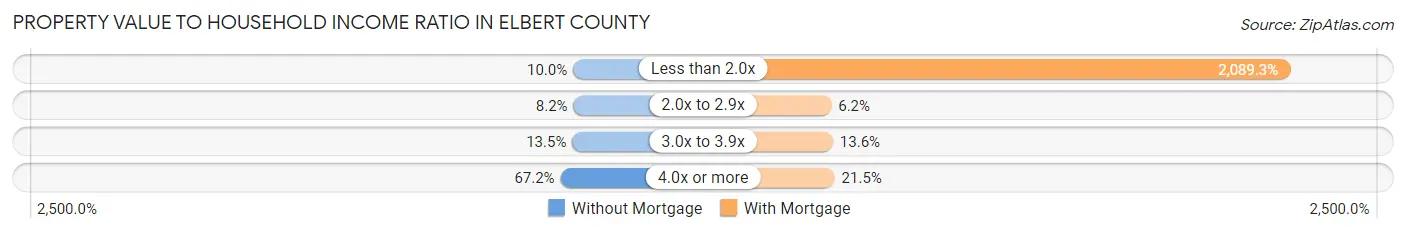
| Value-to-Income Ratio | Without Mortgage | With Mortgage |
| Less than 2.0x | 229 (10.0%) | 137,852 (2,089.3%) |
| 2.0x to 2.9x | 188 (8.2%) | 411 (6.2%) |
| 3.0x to 3.9x | 309 (13.5%) | 897 (13.6%) |
| 4.0x or more | 1,534 (67.2%) | 1,418 (21.5%) |
| Total | 2,283 (100.0%) | 6,598 (100.0%) |
Real Estate Taxes by Mortgage Status in Elbert County
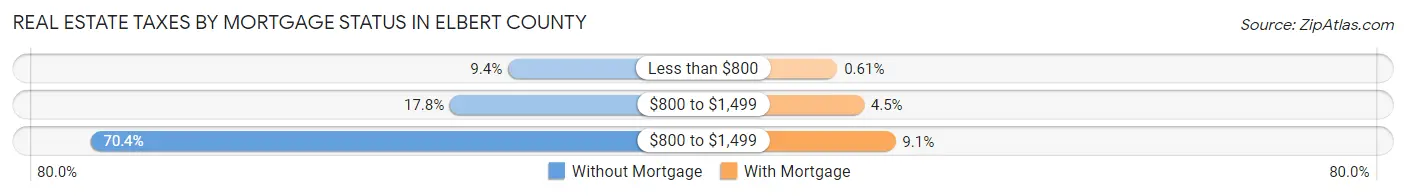
| Property Taxes | Without Mortgage | With Mortgage |
| Less than $800 | 214 (9.4%) | 40 (0.6%) |
| $800 to $1,499 | 407 (17.8%) | 297 (4.5%) |
| $800 to $1,499 | 1,607 (70.4%) | 601 (9.1%) |
| Total | 2,283 (100.0%) | 6,598 (100.0%) |
Health & Disability in Elbert County
Health Insurance Coverage by Age in Elbert County
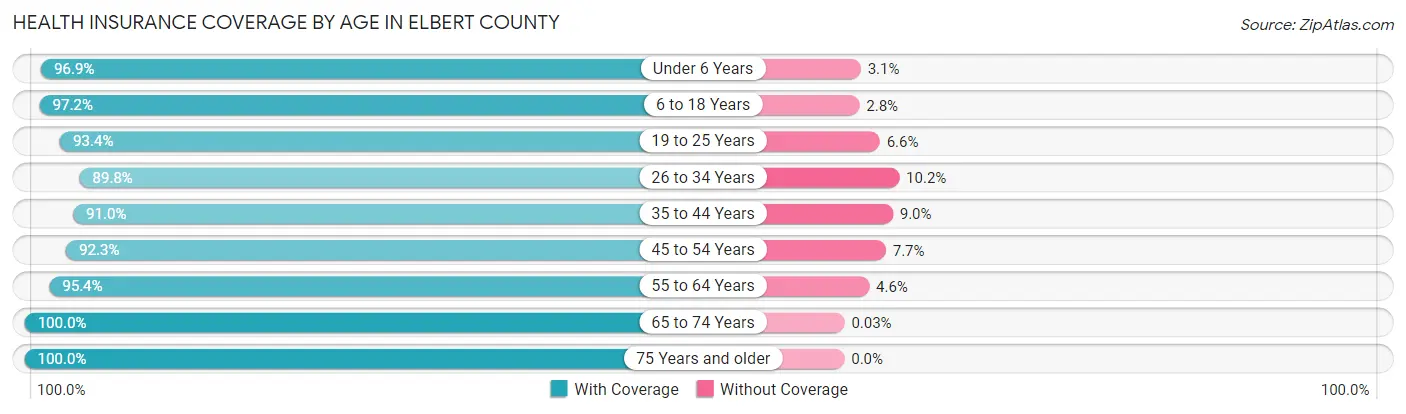
| Age Bracket | With Coverage | Without Coverage |
| Under 6 Years | 1,396 (96.9%) | 44 (3.1%) |
| 6 to 18 Years | 4,355 (97.2%) | 126 (2.8%) |
| 19 to 25 Years | 1,582 (93.4%) | 112 (6.6%) |
| 26 to 34 Years | 2,072 (89.8%) | 236 (10.2%) |
| 35 to 44 Years | 2,838 (91.0%) | 282 (9.0%) |
| 45 to 54 Years | 3,729 (92.3%) | 313 (7.7%) |
| 55 to 64 Years | 4,461 (95.4%) | 216 (4.6%) |
| 65 to 74 Years | 3,154 (100.0%) | 1 (0.0%) |
| 75 Years and older | 1,461 (100.0%) | 0 (0.0%) |
| Total | 25,048 (95.0%) | 1,330 (5.0%) |
Health Insurance Coverage by Citizenship Status in Elbert County
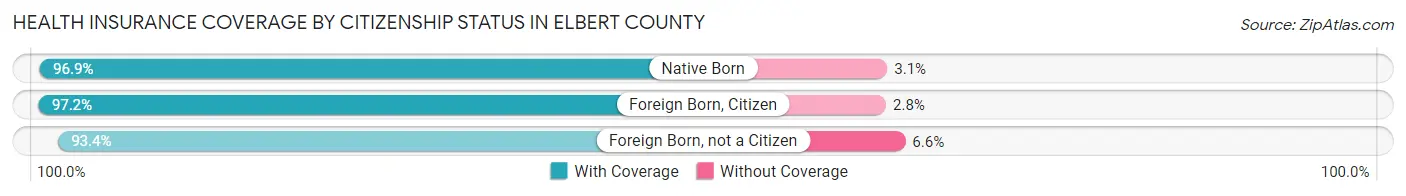
| Citizenship Status | With Coverage | Without Coverage |
| Native Born | 1,396 (96.9%) | 44 (3.1%) |
| Foreign Born, Citizen | 4,355 (97.2%) | 126 (2.8%) |
| Foreign Born, not a Citizen | 1,582 (93.4%) | 112 (6.6%) |
Health Insurance Coverage by Household Income in Elbert County
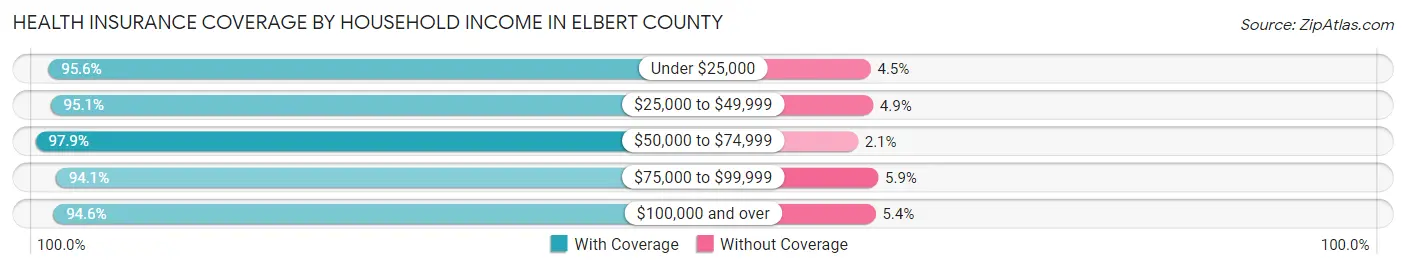
| Household Income | With Coverage | Without Coverage |
| Under $25,000 | 924 (95.6%) | 43 (4.4%) |
| $25,000 to $49,999 | 1,752 (95.1%) | 90 (4.9%) |
| $50,000 to $74,999 | 2,473 (97.9%) | 52 (2.1%) |
| $75,000 to $99,999 | 2,700 (94.1%) | 168 (5.9%) |
| $100,000 and over | 17,184 (94.6%) | 975 (5.4%) |
Public vs Private Health Insurance Coverage by Age in Elbert County
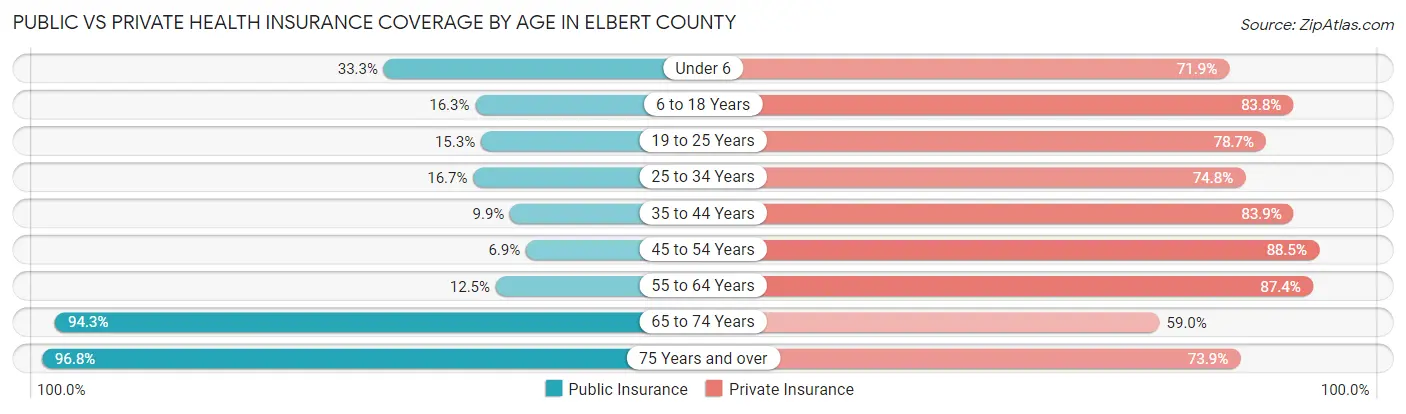
| Age Bracket | Public Insurance | Private Insurance |
| Under 6 | 480 (33.3%) | 1,035 (71.9%) |
| 6 to 18 Years | 732 (16.3%) | 3,754 (83.8%) |
| 19 to 25 Years | 259 (15.3%) | 1,333 (78.7%) |
| 25 to 34 Years | 386 (16.7%) | 1,727 (74.8%) |
| 35 to 44 Years | 308 (9.9%) | 2,616 (83.9%) |
| 45 to 54 Years | 280 (6.9%) | 3,578 (88.5%) |
| 55 to 64 Years | 586 (12.5%) | 4,087 (87.4%) |
| 65 to 74 Years | 2,976 (94.3%) | 1,861 (59.0%) |
| 75 Years and over | 1,414 (96.8%) | 1,080 (73.9%) |
| Total | 7,421 (28.1%) | 21,071 (79.9%) |
Disability Status by Sex by Age in Elbert County
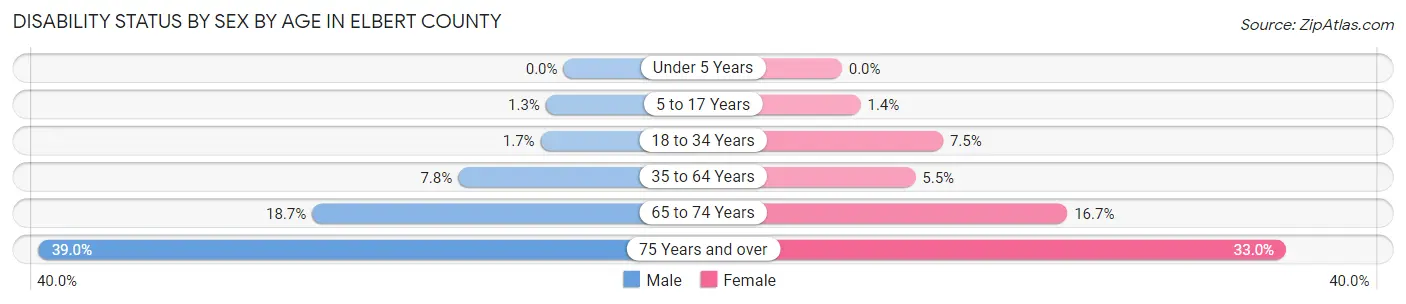
| Age Bracket | Male | Female |
| Under 5 Years | 0 (0.0%) | 0 (0.0%) |
| 5 to 17 Years | 30 (1.3%) | 30 (1.4%) |
| 18 to 34 Years | 38 (1.7%) | 159 (7.5%) |
| 35 to 64 Years | 470 (7.8%) | 318 (5.5%) |
| 65 to 74 Years | 300 (18.7%) | 259 (16.7%) |
| 75 Years and over | 282 (39.0%) | 243 (33.0%) |
Disability Class by Sex by Age in Elbert County
Disability Class: Hearing Difficulty
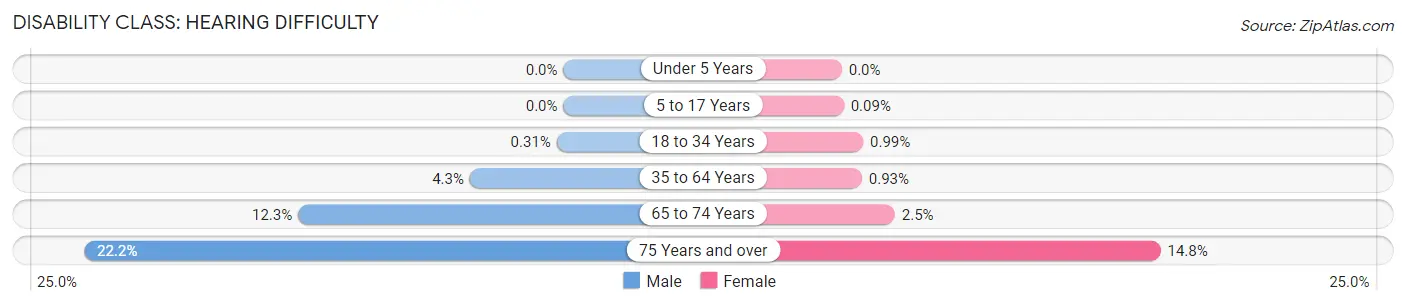
| Age Bracket | Male | Female |
| Under 5 Years | 0 (0.0%) | 0 (0.0%) |
| 5 to 17 Years | 0 (0.0%) | 2 (0.1%) |
| 18 to 34 Years | 7 (0.3%) | 21 (1.0%) |
| 35 to 64 Years | 261 (4.3%) | 54 (0.9%) |
| 65 to 74 Years | 198 (12.3%) | 38 (2.5%) |
| 75 Years and over | 161 (22.2%) | 109 (14.8%) |
Disability Class: Vision Difficulty
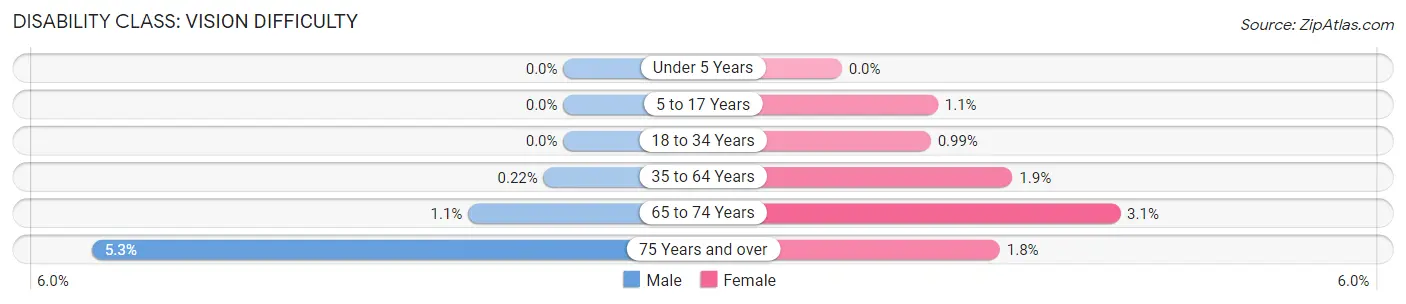
| Age Bracket | Male | Female |
| Under 5 Years | 0 (0.0%) | 0 (0.0%) |
| 5 to 17 Years | 0 (0.0%) | 23 (1.1%) |
| 18 to 34 Years | 0 (0.0%) | 21 (1.0%) |
| 35 to 64 Years | 13 (0.2%) | 111 (1.9%) |
| 65 to 74 Years | 17 (1.1%) | 48 (3.1%) |
| 75 Years and over | 38 (5.2%) | 13 (1.8%) |
Disability Class: Cognitive Difficulty
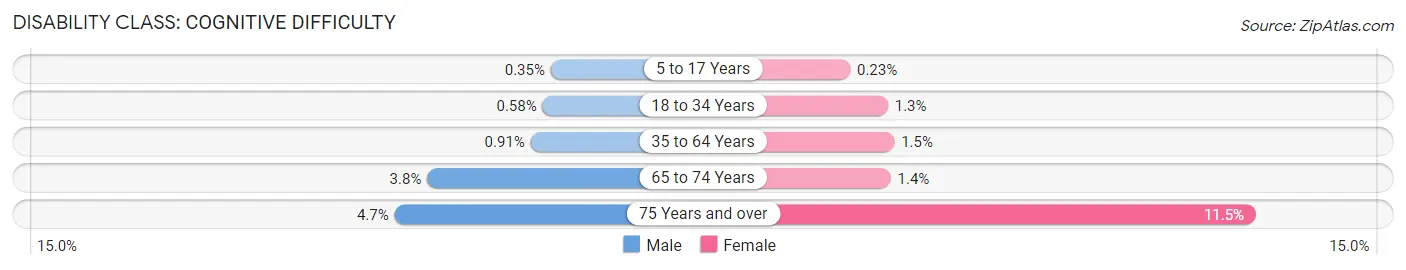
| Age Bracket | Male | Female |
| 5 to 17 Years | 8 (0.4%) | 5 (0.2%) |
| 18 to 34 Years | 13 (0.6%) | 27 (1.3%) |
| 35 to 64 Years | 55 (0.9%) | 85 (1.5%) |
| 65 to 74 Years | 61 (3.8%) | 21 (1.4%) |
| 75 Years and over | 34 (4.7%) | 85 (11.5%) |
Disability Class: Ambulatory Difficulty
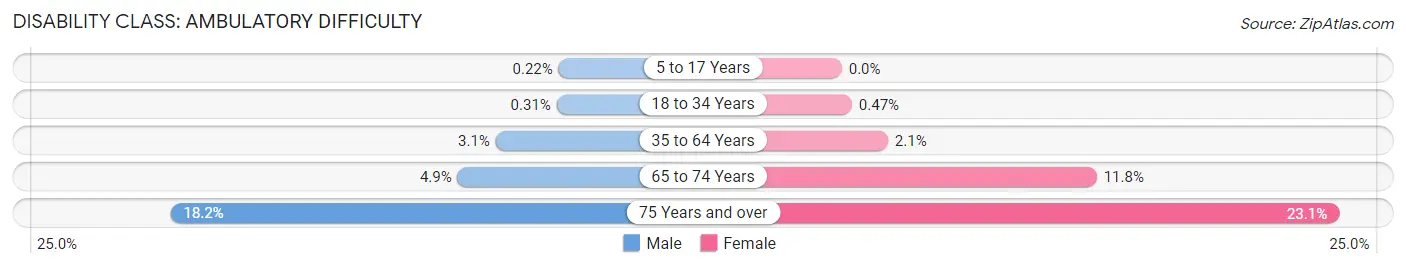
| Age Bracket | Male | Female |
| 5 to 17 Years | 5 (0.2%) | 0 (0.0%) |
| 18 to 34 Years | 7 (0.3%) | 10 (0.5%) |
| 35 to 64 Years | 189 (3.1%) | 125 (2.1%) |
| 65 to 74 Years | 79 (4.9%) | 183 (11.8%) |
| 75 Years and over | 132 (18.2%) | 170 (23.1%) |
Disability Class: Self-Care Difficulty
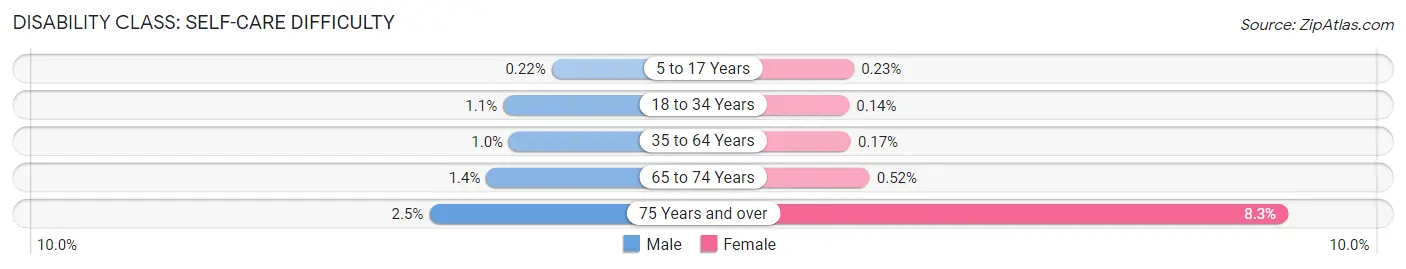
| Age Bracket | Male | Female |
| 5 to 17 Years | 5 (0.2%) | 5 (0.2%) |
| 18 to 34 Years | 25 (1.1%) | 3 (0.1%) |
| 35 to 64 Years | 61 (1.0%) | 10 (0.2%) |
| 65 to 74 Years | 23 (1.4%) | 8 (0.5%) |
| 75 Years and over | 18 (2.5%) | 61 (8.3%) |
Technology Access in Elbert County
Computing Device Access in Elbert County
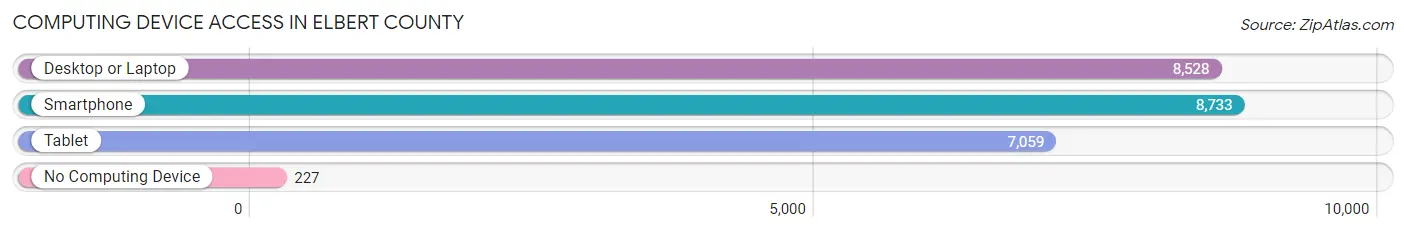
| Device Type | # Households | % Households |
| Desktop or Laptop | 8,528 | 89.6% |
| Smartphone | 8,733 | 91.8% |
| Tablet | 7,059 | 74.2% |
| No Computing Device | 227 | 2.4% |
| Total | 9,514 | 100.0% |
Internet Access in Elbert County
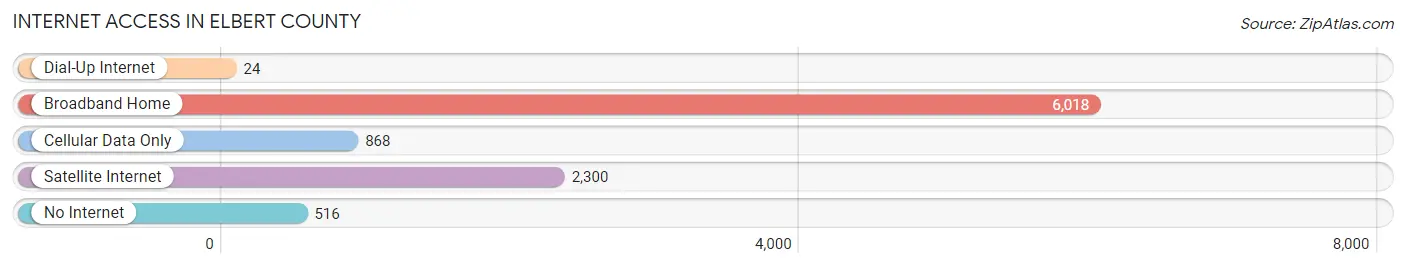
| Internet Type | # Households | % Households |
| Dial-Up Internet | 24 | 0.3% |
| Broadband Home | 6,018 | 63.2% |
| Cellular Data Only | 868 | 9.1% |
| Satellite Internet | 2,300 | 24.2% |
| No Internet | 516 | 5.4% |
| Total | 9,514 | 100.0% |
Elbert County Summary
Elbert County is located in the eastern part of the state of Colorado, and is the second largest county in the state. It is bordered by Lincoln County to the north, El Paso County to the south, Arapahoe County to the west, and Douglas County to the east. The county seat is Kiowa, and the largest city is Elizabeth.
History
Elbert County was established in 1874, and was named after Samuel Elbert, a former governor of the Colorado Territory. The county was originally part of Arapahoe County, but was split off in 1874. The county was originally populated by Native American tribes, including the Arapaho, Cheyenne, and Ute.
The first settlers in the area were ranchers and farmers, who began to arrive in the late 1800s. The county was also home to several mining operations, including gold, silver, and coal. The county was also home to several stagecoach lines, which connected the towns of Elizabeth, Kiowa, and Simla.
Geography
Elbert County covers an area of 2,541 square miles, making it the second largest county in Colorado. The county is located in the eastern part of the state, and is bordered by Lincoln County to the north, El Paso County to the south, Arapahoe County to the west, and Douglas County to the east.
The county is mostly flat, with some rolling hills in the western part of the county. The county is home to several rivers, including the South Platte River, the Arkansas River, and the Big Sandy Creek. The county is also home to several reservoirs, including the Aurora Reservoir, the Cherry Creek Reservoir, and the Chatfield Reservoir.
Economy
The economy of Elbert County is largely based on agriculture and ranching. The county is home to several large farms and ranches, which produce a variety of crops, including corn, wheat, hay, and alfalfa. The county is also home to several large cattle ranches, which produce beef and dairy products.
The county is also home to several oil and gas operations, which produce natural gas and oil. The county is also home to several manufacturing operations, which produce a variety of products, including furniture, clothing, and electronics.
Demographics
As of the 2010 census, Elbert County had a population of 23,086. The population was spread out, with 48.3% male and 51.7% female. The median age was 38.7 years.
The racial makeup of the county was 94.2% White, 0.7% African American, 0.7% Native American, 0.7% Asian, 0.1% Pacific Islander, 2.2% from other races, and 1.5% from two or more races. Hispanic or Latino of any race were 6.2% of the population.
The median income for a household in the county was $60,945, and the median income for a family was $68,945. The per capita income for the county was $27,945. About 6.2% of families and 8.2% of the population were below the poverty line, including 10.2% of those under age 18 and 6.2% of those age 65 or over.
Common Questions
What is the Total Population of Elbert County?
Total Population of Elbert County is 26,457.
What is the Total Male Population of Elbert County?
Total Male Population of Elbert County is 13,448.
What is the Total Female Population of Elbert County?
Total Female Population of Elbert County is 13,009.
What is the Ratio of Males per 100 Females in Elbert County?
There are 103.37 Males per 100 Females in Elbert County.
What is the Ratio of Females per 100 Males in Elbert County?
There are 96.74 Females per 100 Males in Elbert County.
What is the Median Population Age in Elbert County?
Median Population Age in Elbert County is 45.6 Years.
What is the Average Family Size in Elbert County
Average Family Size in Elbert County is 3.0 People.
What is the Average Household Size in Elbert County
Average Household Size in Elbert County is 2.8 People.
What is Per Capita Income in Elbert County?
Per Capita income in Elbert County is $55,535.
What is the Median Family Income in Elbert County?
Median Family Income in Elbert County is $136,020.
What is the Median Household income in Elbert County?
Median Household Income in Elbert County is $124,360.
What is Income or Wage Gap in Elbert County?
Income or Wage Gap in Elbert County is 32.8%.
Women in Elbert County earn 67.2 cents for every dollar earned by a man.
What is Family Income Deficit in Elbert County?
Family Income Deficit in Elbert County is $9,456.
Families that are below poverty line in Elbert County earn $9,456 less on average than the poverty threshold level.
What is Inequality or Gini Index in Elbert County?
Inequality or Gini Index in Elbert County is 0.41.
How Large is the Labor Force in Elbert County?
There are 14,529 People in the Labor Forcein in Elbert County.
What is the Percentage of People in the Labor Force in Elbert County?
66.4% of People are in the Labor Force in Elbert County.
What is the Unemployment Rate in Elbert County?
Unemployment Rate in Elbert County is 2.3%.