El Paso County, CO
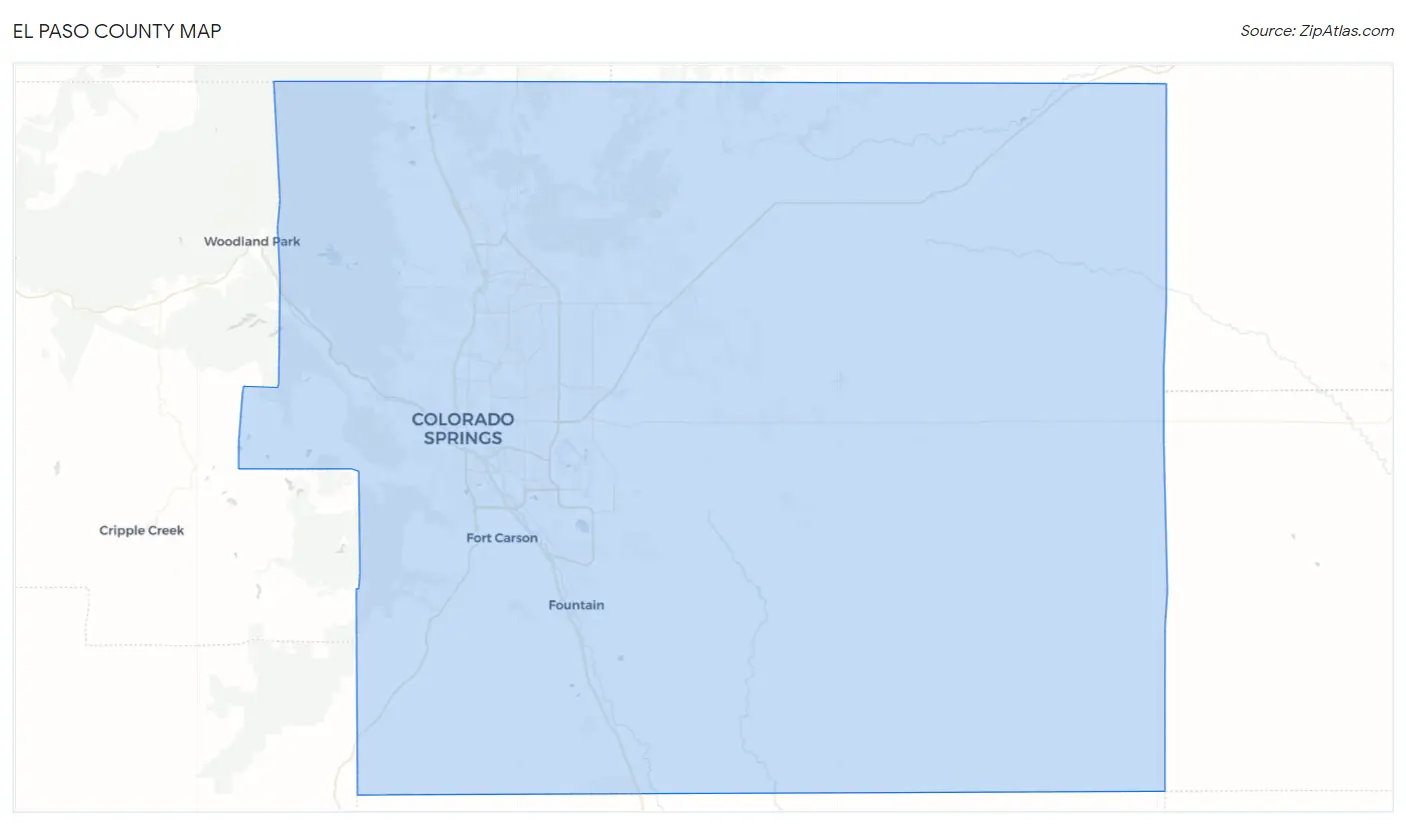
El Paso County Map
El Paso County Overview
730,323
TOTAL POPULATION
372,145
MALE POPULATION
358,178
FEMALE POPULATION
103.90
MALES / 100 FEMALES
96.25
FEMALES / 100 MALES
34.7
MEDIAN AGE
3.1
AVG FAMILY SIZE
2.6
AVG HOUSEHOLD SIZE
$41,444
PER CAPITA INCOME
$98,645
AVG FAMILY INCOME
$82,748
AVG HOUSEHOLD INCOME
28.3%
WAGE / INCOME GAP [ % ]
71.7¢/ $1
WAGE / INCOME GAP [ $ ]
$11,941
FAMILY INCOME DEFICIT
0.43
INEQUALITY / GINI INDEX
395,919
LABOR FORCE [ PEOPLE ]
68.6%
PERCENT IN LABOR FORCE
5.7%
UNEMPLOYMENT RATE
El Paso County Area Codes
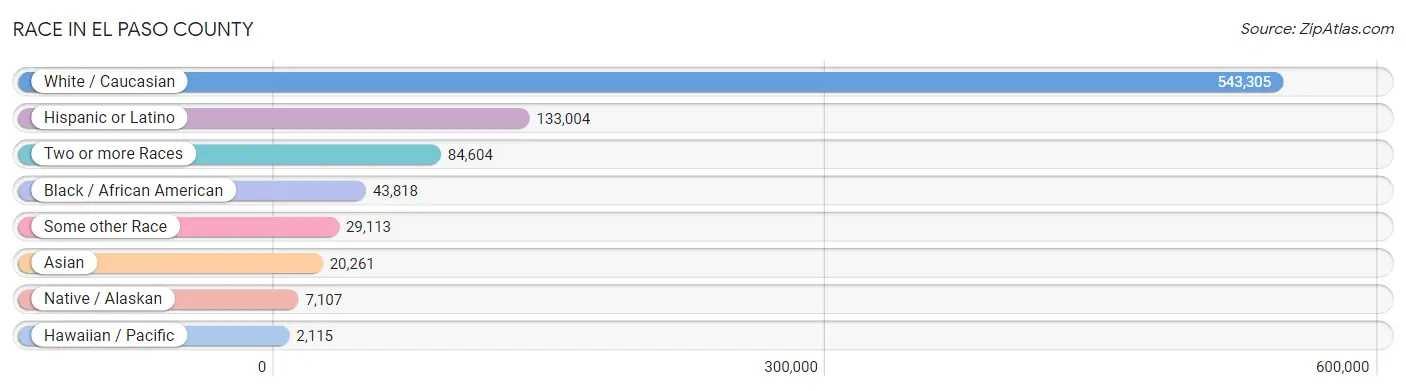
Race in El Paso County
The most populous races in El Paso County are White / Caucasian (543,305 | 74.4%), Hispanic or Latino (133,004 | 18.2%), and Two or more Races (84,604 | 11.6%).
| Race | # Population | % Population |
| Asian | 20,261 | 2.8% |
| Black / African American | 43,818 | 6.0% |
| Hawaiian / Pacific | 2,115 | 0.3% |
| Hispanic or Latino | 133,004 | 18.2% |
| Native / Alaskan | 7,107 | 1.0% |
| White / Caucasian | 543,305 | 74.4% |
| Two or more Races | 84,604 | 11.6% |
| Some other Race | 29,113 | 4.0% |
| Total | 730,323 | 100.0% |
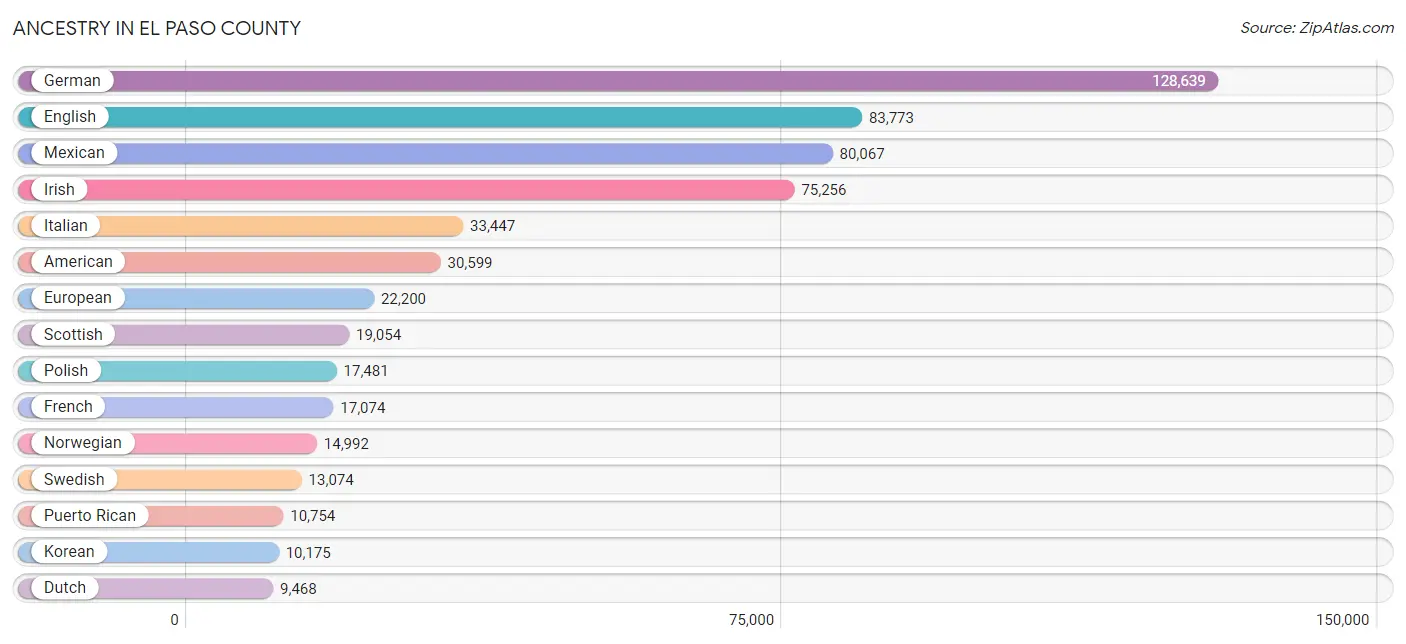
Ancestry in El Paso County
The most populous ancestries reported in El Paso County are German (128,639 | 17.6%), English (83,773 | 11.5%), Mexican (80,067 | 11.0%), Irish (75,256 | 10.3%), and Italian (33,447 | 4.6%), together accounting for 54.9% of all El Paso County residents.
| Ancestry | # Population | % Population |
| Afghan | 77 | 0.0% |
| African | 3,691 | 0.5% |
| Alaska Native | 4 | 0.0% |
| Alaskan Athabascan | 69 | 0.0% |
| Albanian | 86 | 0.0% |
| Aleut | 29 | 0.0% |
| Alsatian | 32 | 0.0% |
| American | 30,599 | 4.2% |
| Apache | 1,408 | 0.2% |
| Arab | 1,523 | 0.2% |
| Arapaho | 49 | 0.0% |
| Argentinean | 538 | 0.1% |
| Armenian | 346 | 0.1% |
| Assyrian / Chaldean / Syriac | 11 | 0.0% |
| Australian | 316 | 0.0% |
| Austrian | 1,485 | 0.2% |
| Bangladeshi | 148 | 0.0% |
| Barbadian | 80 | 0.0% |
| Basque | 310 | 0.0% |
| Belgian | 634 | 0.1% |
| Belizean | 261 | 0.0% |
| Bermudan | 20 | 0.0% |
| Bhutanese | 4,875 | 0.7% |
| Blackfeet | 665 | 0.1% |
| Bolivian | 91 | 0.0% |
| Brazilian | 541 | 0.1% |
| British | 5,541 | 0.8% |
| British West Indian | 76 | 0.0% |
| Bulgarian | 210 | 0.0% |
| Burmese | 8,201 | 1.1% |
| Cajun | 201 | 0.0% |
| Cambodian | 130 | 0.0% |
| Canadian | 1,212 | 0.2% |
| Cape Verdean | 88 | 0.0% |
| Carpatho Rusyn | 70 | 0.0% |
| Celtic | 251 | 0.0% |
| Central American | 6,141 | 0.8% |
| Central American Indian | 1,056 | 0.1% |
| Cherokee | 3,731 | 0.5% |
| Cheyenne | 65 | 0.0% |
| Chickasaw | 259 | 0.0% |
| Chilean | 428 | 0.1% |
| Chinese | 32 | 0.0% |
| Chippewa | 340 | 0.1% |
| Choctaw | 522 | 0.1% |
| Colombian | 1,679 | 0.2% |
| Comanche | 171 | 0.0% |
| Costa Rican | 156 | 0.0% |
| Cree | 134 | 0.0% |
| Creek | 34 | 0.0% |
| Croatian | 667 | 0.1% |
| Crow | 19 | 0.0% |
| Cuban | 2,592 | 0.4% |
| Czech | 3,838 | 0.5% |
| Czechoslovakian | 740 | 0.1% |
| Danish | 4,244 | 0.6% |
| Delaware | 95 | 0.0% |
| Dominican | 1,260 | 0.2% |
| Dutch | 9,468 | 1.3% |
| Dutch West Indian | 10 | 0.0% |
| Eastern European | 1,965 | 0.3% |
| Ecuadorian | 396 | 0.1% |
| Egyptian | 118 | 0.0% |
| English | 83,773 | 11.5% |
| Estonian | 203 | 0.0% |
| Ethiopian | 313 | 0.0% |
| European | 22,200 | 3.0% |
| Fijian | 5 | 0.0% |
| Filipino | 266 | 0.0% |
| Finnish | 1,351 | 0.2% |
| French | 17,074 | 2.3% |
| French American Indian | 6 | 0.0% |
| French Canadian | 3,589 | 0.5% |
| German | 128,639 | 17.6% |
| German Russian | 212 | 0.0% |
| Ghanaian | 192 | 0.0% |
| Greek | 1,471 | 0.2% |
| Guamanian / Chamorro | 1,490 | 0.2% |
| Guatemalan | 1,224 | 0.2% |
| Guyanese | 62 | 0.0% |
| Haitian | 435 | 0.1% |
| Honduran | 1,391 | 0.2% |
| Hopi | 36 | 0.0% |
| Houma | 87 | 0.0% |
| Hungarian | 3,216 | 0.4% |
| Icelander | 110 | 0.0% |
| Indian (Asian) | 5,276 | 0.7% |
| Indonesian | 153 | 0.0% |
| Inupiat | 69 | 0.0% |
| Iranian | 652 | 0.1% |
| Iraqi | 128 | 0.0% |
| Irish | 75,256 | 10.3% |
| Iroquois | 304 | 0.0% |
| Israeli | 159 | 0.0% |
| Italian | 33,447 | 4.6% |
| Jamaican | 1,538 | 0.2% |
| Japanese | 91 | 0.0% |
| Jordanian | 37 | 0.0% |
| Kenyan | 197 | 0.0% |
| Kiowa | 15 | 0.0% |
| Korean | 10,175 | 1.4% |
| Laotian | 271 | 0.0% |
| Latvian | 178 | 0.0% |
| Lebanese | 523 | 0.1% |
| Liberian | 96 | 0.0% |
| Lithuanian | 1,664 | 0.2% |
| Lumbee | 15 | 0.0% |
| Luxembourger | 284 | 0.0% |
| Macedonian | 74 | 0.0% |
| Malaysian | 353 | 0.1% |
| Maltese | 65 | 0.0% |
| Mexican | 80,067 | 11.0% |
| Mexican American Indian | 1,429 | 0.2% |
| Moroccan | 8 | 0.0% |
| Native Hawaiian | 2,496 | 0.3% |
| Navajo | 1,763 | 0.2% |
| New Zealander | 160 | 0.0% |
| Nicaraguan | 579 | 0.1% |
| Nigerian | 940 | 0.1% |
| Northern European | 1,793 | 0.3% |
| Norwegian | 14,992 | 2.1% |
| Okinawan | 19 | 0.0% |
| Osage | 14 | 0.0% |
| Pakistani | 1,175 | 0.2% |
| Palestinian | 48 | 0.0% |
| Panamanian | 1,333 | 0.2% |
| Paraguayan | 1 | 0.0% |
| Pennsylvania German | 95 | 0.0% |
| Peruvian | 1,148 | 0.2% |
| Pima | 12 | 0.0% |
| Polish | 17,481 | 2.4% |
| Portuguese | 1,693 | 0.2% |
| Potawatomi | 156 | 0.0% |
| Pueblo | 402 | 0.1% |
| Puerto Rican | 10,754 | 1.5% |
| Romanian | 604 | 0.1% |
| Russian | 4,392 | 0.6% |
| Salvadoran | 1,365 | 0.2% |
| Samoan | 1,187 | 0.2% |
| Scandinavian | 3,661 | 0.5% |
| Scotch-Irish | 9,070 | 1.2% |
| Scottish | 19,054 | 2.6% |
| Seminole | 41 | 0.0% |
| Serbian | 630 | 0.1% |
| Shoshone | 10 | 0.0% |
| Sioux | 836 | 0.1% |
| Slavic | 265 | 0.0% |
| Slovak | 1,040 | 0.1% |
| Slovene | 633 | 0.1% |
| Somali | 73 | 0.0% |
| South African | 122 | 0.0% |
| South American | 4,754 | 0.6% |
| South American Indian | 40 | 0.0% |
| Spaniard | 5,713 | 0.8% |
| Spanish | 8,298 | 1.1% |
| Spanish American | 986 | 0.1% |
| Spanish American Indian | 246 | 0.0% |
| Sri Lankan | 2,785 | 0.4% |
| Subsaharan African | 6,274 | 0.9% |
| Sudanese | 90 | 0.0% |
| Swedish | 13,074 | 1.8% |
| Swiss | 2,031 | 0.3% |
| Syrian | 55 | 0.0% |
| Thai | 2,695 | 0.4% |
| Tlingit-Haida | 8 | 0.0% |
| Tohono O'Odham | 66 | 0.0% |
| Trinidadian and Tobagonian | 147 | 0.0% |
| Tsimshian | 9 | 0.0% |
| Turkish | 216 | 0.0% |
| U.S. Virgin Islander | 25 | 0.0% |
| Ugandan | 108 | 0.0% |
| Ukrainian | 1,750 | 0.2% |
| Uruguayan | 8 | 0.0% |
| Ute | 444 | 0.1% |
| Venezuelan | 465 | 0.1% |
| Vietnamese | 39 | 0.0% |
| Welsh | 6,094 | 0.8% |
| West Indian | 208 | 0.0% |
| Yakama | 121 | 0.0% |
| Yaqui | 29 | 0.0% |
| Yugoslavian | 314 | 0.0% |
| Yuman | 1 | 0.0% |
| Yup'ik | 41 | 0.0% | View All 183 Rows |
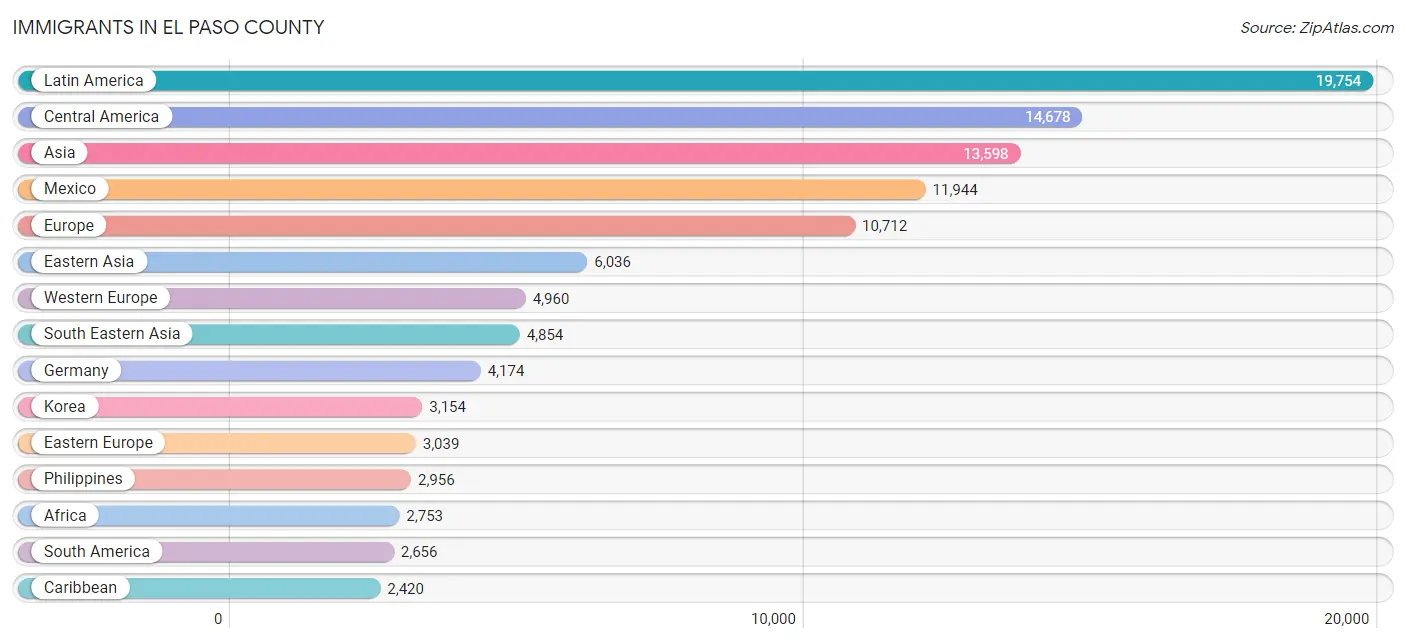
Immigrants in El Paso County
The most numerous immigrant groups reported in El Paso County came from Latin America (19,754 | 2.7%), Central America (14,678 | 2.0%), Asia (13,598 | 1.9%), Mexico (11,944 | 1.6%), and Europe (10,712 | 1.5%), together accounting for 9.7% of all El Paso County residents.
| Immigration Origin | # Population | % Population |
| Afghanistan | 58 | 0.0% |
| Africa | 2,753 | 0.4% |
| Argentina | 359 | 0.1% |
| Armenia | 27 | 0.0% |
| Asia | 13,598 | 1.9% |
| Australia | 257 | 0.0% |
| Austria | 112 | 0.0% |
| Bahamas | 70 | 0.0% |
| Bangladesh | 61 | 0.0% |
| Barbados | 19 | 0.0% |
| Belarus | 117 | 0.0% |
| Belgium | 9 | 0.0% |
| Belize | 52 | 0.0% |
| Bolivia | 91 | 0.0% |
| Bosnia and Herzegovina | 63 | 0.0% |
| Brazil | 597 | 0.1% |
| Bulgaria | 77 | 0.0% |
| Cambodia | 82 | 0.0% |
| Cameroon | 168 | 0.0% |
| Canada | 2,128 | 0.3% |
| Caribbean | 2,420 | 0.3% |
| Central America | 14,678 | 2.0% |
| Chile | 209 | 0.0% |
| China | 1,871 | 0.3% |
| Colombia | 634 | 0.1% |
| Costa Rica | 50 | 0.0% |
| Croatia | 111 | 0.0% |
| Cuba | 685 | 0.1% |
| Czechoslovakia | 233 | 0.0% |
| Denmark | 56 | 0.0% |
| Dominica | 10 | 0.0% |
| Dominican Republic | 479 | 0.1% |
| Eastern Africa | 1,328 | 0.2% |
| Eastern Asia | 6,036 | 0.8% |
| Eastern Europe | 3,039 | 0.4% |
| Ecuador | 253 | 0.0% |
| Egypt | 61 | 0.0% |
| El Salvador | 561 | 0.1% |
| England | 738 | 0.1% |
| Eritrea | 23 | 0.0% |
| Ethiopia | 357 | 0.1% |
| Europe | 10,712 | 1.5% |
| Fiji | 56 | 0.0% |
| France | 108 | 0.0% |
| Germany | 4,174 | 0.6% |
| Ghana | 249 | 0.0% |
| Greece | 2 | 0.0% |
| Guatemala | 689 | 0.1% |
| Guyana | 95 | 0.0% |
| Haiti | 186 | 0.0% |
| Honduras | 848 | 0.1% |
| Hong Kong | 62 | 0.0% |
| Hungary | 132 | 0.0% |
| India | 1,055 | 0.1% |
| Indonesia | 64 | 0.0% |
| Iran | 280 | 0.0% |
| Iraq | 158 | 0.0% |
| Ireland | 164 | 0.0% |
| Israel | 86 | 0.0% |
| Italy | 279 | 0.0% |
| Jamaica | 800 | 0.1% |
| Japan | 981 | 0.1% |
| Jordan | 30 | 0.0% |
| Kazakhstan | 25 | 0.0% |
| Kenya | 600 | 0.1% |
| Korea | 3,154 | 0.4% |
| Kuwait | 25 | 0.0% |
| Laos | 61 | 0.0% |
| Latin America | 19,754 | 2.7% |
| Latvia | 59 | 0.0% |
| Lebanon | 19 | 0.0% |
| Liberia | 150 | 0.0% |
| Lithuania | 85 | 0.0% |
| Malaysia | 31 | 0.0% |
| Mexico | 11,944 | 1.6% |
| Middle Africa | 268 | 0.0% |
| Moldova | 42 | 0.0% |
| Morocco | 10 | 0.0% |
| Nepal | 358 | 0.1% |
| Netherlands | 195 | 0.0% |
| Nicaragua | 79 | 0.0% |
| Nigeria | 147 | 0.0% |
| North Macedonia | 34 | 0.0% |
| Northern Africa | 123 | 0.0% |
| Northern Europe | 2,048 | 0.3% |
| Norway | 49 | 0.0% |
| Oceania | 510 | 0.1% |
| Pakistan | 193 | 0.0% |
| Panama | 362 | 0.1% |
| Peru | 250 | 0.0% |
| Philippines | 2,956 | 0.4% |
| Poland | 506 | 0.1% |
| Romania | 125 | 0.0% |
| Russia | 677 | 0.1% |
| Scotland | 120 | 0.0% |
| Serbia | 9 | 0.0% |
| Sierra Leone | 73 | 0.0% |
| Singapore | 43 | 0.0% |
| Somalia | 37 | 0.0% |
| South Africa | 250 | 0.0% |
| South America | 2,656 | 0.4% |
| South Central Asia | 2,058 | 0.3% |
| South Eastern Asia | 4,854 | 0.7% |
| Southern Europe | 665 | 0.1% |
| Spain | 384 | 0.1% |
| St. Vincent and the Grenadines | 43 | 0.0% |
| Sudan | 23 | 0.0% |
| Sweden | 70 | 0.0% |
| Switzerland | 319 | 0.0% |
| Syria | 30 | 0.0% |
| Taiwan | 284 | 0.0% |
| Thailand | 407 | 0.1% |
| Trinidad and Tobago | 80 | 0.0% |
| Turkey | 223 | 0.0% |
| Uganda | 107 | 0.0% |
| Ukraine | 511 | 0.1% |
| Uzbekistan | 8 | 0.0% |
| Venezuela | 167 | 0.0% |
| Vietnam | 1,161 | 0.2% |
| West Indies | 31 | 0.0% |
| Western Africa | 701 | 0.1% |
| Western Asia | 650 | 0.1% |
| Western Europe | 4,960 | 0.7% |
| Zaire | 74 | 0.0% |
| Zimbabwe | 86 | 0.0% | View All 125 Rows |
Sex and Age in El Paso County
Sex and Age in El Paso County
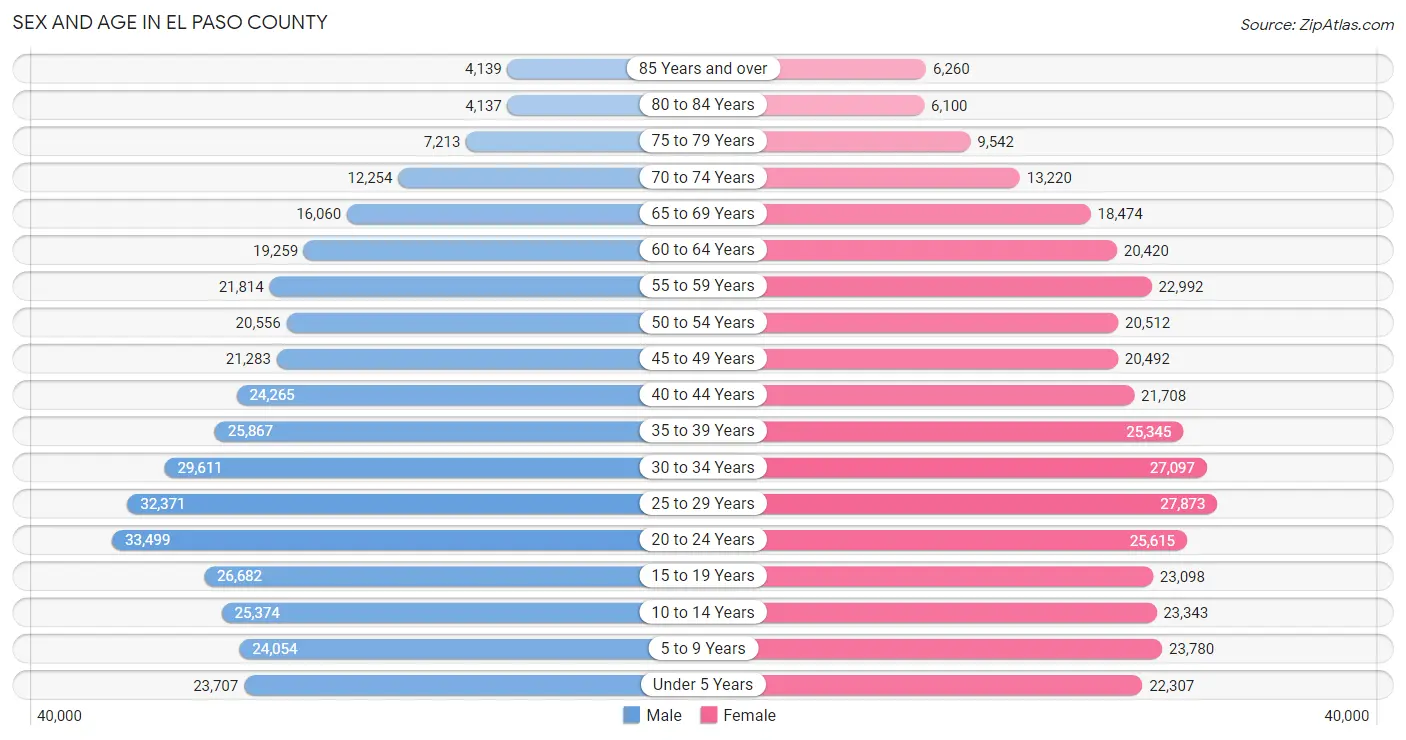
The most populous age groups in El Paso County are 20 to 24 Years (33,499 | 9.0%) for men and 25 to 29 Years (27,873 | 7.8%) for women.
| Age Bracket | Male | Female |
| Under 5 Years | 23,707 (6.4%) | 22,307 (6.2%) |
| 5 to 9 Years | 24,054 (6.5%) | 23,780 (6.6%) |
| 10 to 14 Years | 25,374 (6.8%) | 23,343 (6.5%) |
| 15 to 19 Years | 26,682 (7.2%) | 23,098 (6.5%) |
| 20 to 24 Years | 33,499 (9.0%) | 25,615 (7.1%) |
| 25 to 29 Years | 32,371 (8.7%) | 27,873 (7.8%) |
| 30 to 34 Years | 29,611 (8.0%) | 27,097 (7.6%) |
| 35 to 39 Years | 25,867 (7.0%) | 25,345 (7.1%) |
| 40 to 44 Years | 24,265 (6.5%) | 21,708 (6.1%) |
| 45 to 49 Years | 21,283 (5.7%) | 20,492 (5.7%) |
| 50 to 54 Years | 20,556 (5.5%) | 20,512 (5.7%) |
| 55 to 59 Years | 21,814 (5.9%) | 22,992 (6.4%) |
| 60 to 64 Years | 19,259 (5.2%) | 20,420 (5.7%) |
| 65 to 69 Years | 16,060 (4.3%) | 18,474 (5.2%) |
| 70 to 74 Years | 12,254 (3.3%) | 13,220 (3.7%) |
| 75 to 79 Years | 7,213 (1.9%) | 9,542 (2.7%) |
| 80 to 84 Years | 4,137 (1.1%) | 6,100 (1.7%) |
| 85 Years and over | 4,139 (1.1%) | 6,260 (1.8%) |
| Total | 372,145 (100.0%) | 358,178 (100.0%) |
Families and Households in El Paso County
Median Family Size in El Paso County
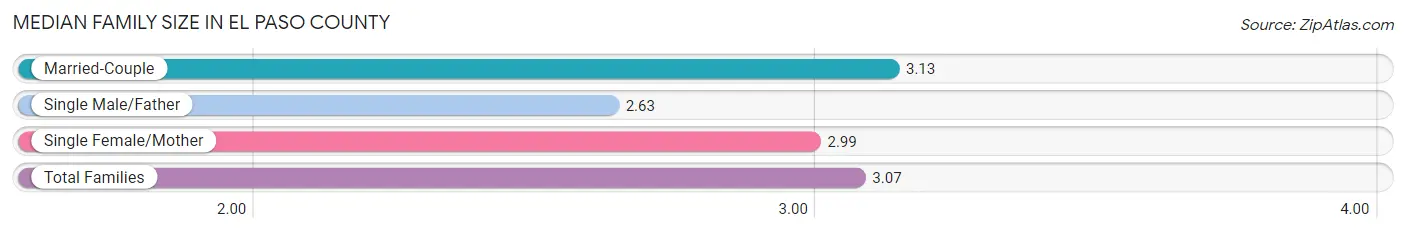
The median family size in El Paso County is 3.07 persons per family, with married-couple families (146,588 | 78.5%) accounting for the largest median family size of 3.13 persons per family. On the other hand, single male/father families (13,204 | 7.1%) represent the smallest median family size with 2.63 persons per family.
| Family Type | # Families | Family Size |
| Married-Couple | 146,588 (78.5%) | 3.13 |
| Single Male/Father | 13,204 (7.1%) | 2.63 |
| Single Female/Mother | 26,906 (14.4%) | 2.99 |
| Total Families | 186,698 (100.0%) | 3.07 |
Median Household Size in El Paso County
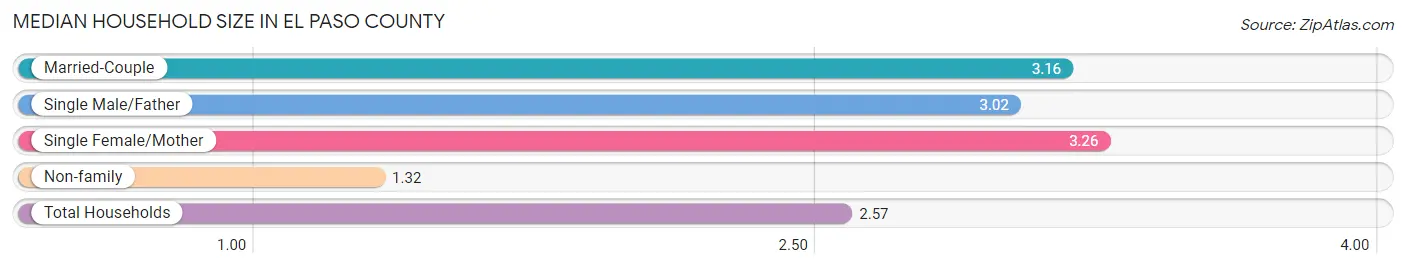
The median household size in El Paso County is 2.57 persons per household, with single female/mother households (26,906 | 9.7%) accounting for the largest median household size of 3.26 persons per household. non-family households (89,673 | 32.5%) represent the smallest median household size with 1.32 persons per household.
| Household Type | # Households | Household Size |
| Married-Couple | 146,588 (53.0%) | 3.16 |
| Single Male/Father | 13,204 (4.8%) | 3.02 |
| Single Female/Mother | 26,906 (9.7%) | 3.26 |
| Non-family | 89,673 (32.5%) | 1.32 |
| Total Households | 276,371 (100.0%) | 2.57 |
Household Size by Marriage Status in El Paso County
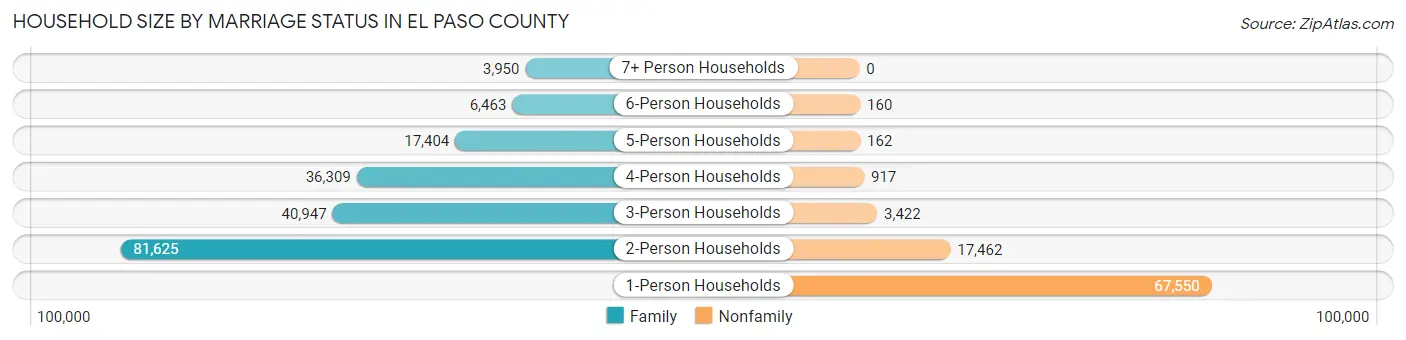
Out of a total of 276,371 households in El Paso County, 186,698 (67.5%) are family households, while 89,673 (32.5%) are nonfamily households. The most numerous type of family households are 2-person households, comprising 81,625, and the most common type of nonfamily households are 1-person households, comprising 67,550.
| Household Size | Family Households | Nonfamily Households |
| 1-Person Households | - | 67,550 (24.4%) |
| 2-Person Households | 81,625 (29.5%) | 17,462 (6.3%) |
| 3-Person Households | 40,947 (14.8%) | 3,422 (1.2%) |
| 4-Person Households | 36,309 (13.1%) | 917 (0.3%) |
| 5-Person Households | 17,404 (6.3%) | 162 (0.1%) |
| 6-Person Households | 6,463 (2.3%) | 160 (0.1%) |
| 7+ Person Households | 3,950 (1.4%) | 0 (0.0%) |
| Total | 186,698 (67.5%) | 89,673 (32.5%) |
Female Fertility in El Paso County
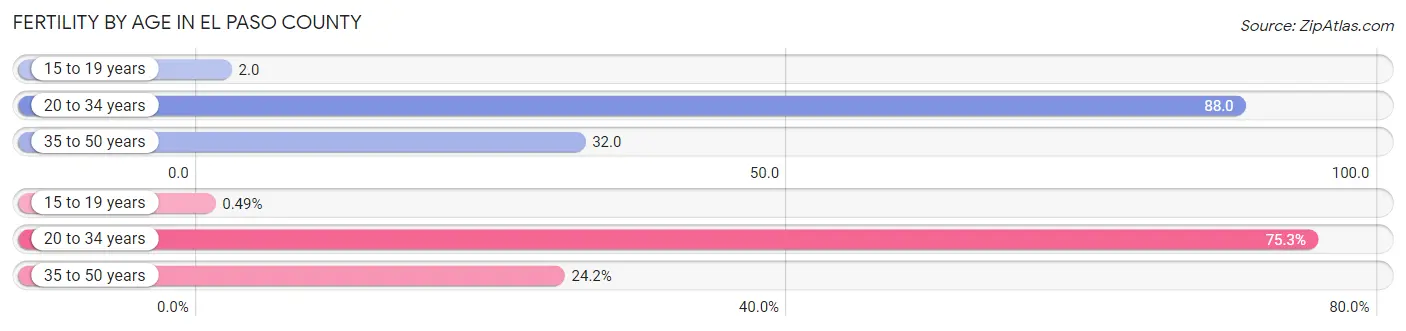
Fertility by Age in El Paso County
Average fertility rate in El Paso County is 54.0 births per 1,000 women. Women in the age bracket of 20 to 34 years have the highest fertility rate with 88.0 births per 1,000 women. Women in the age bracket of 20 to 34 years acount for 75.3% of all women with births.
| Age Bracket | Women with Births | Births / 1,000 Women |
| 15 to 19 years | 46 (0.5%) | 2.0 |
| 20 to 34 years | 7,072 (75.3%) | 88.0 |
| 35 to 50 years | 2,272 (24.2%) | 32.0 |
| Total | 9,390 (100.0%) | 54.0 |
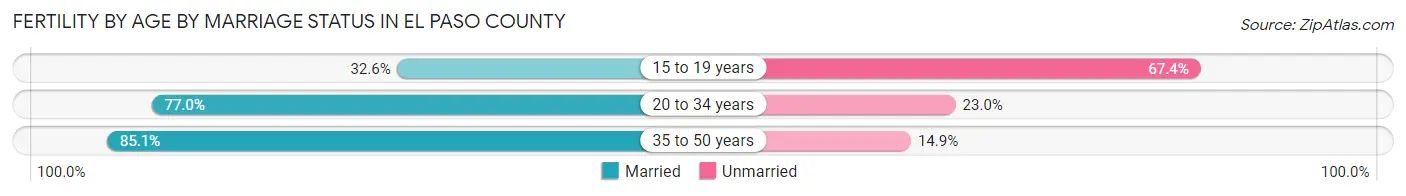
Fertility by Age by Marriage Status in El Paso County
78.7% of women with births (9,390) in El Paso County are married. The highest percentage of unmarried women with births falls into 15 to 19 years age bracket with 67.4% of them unmarried at the time of birth, while the lowest percentage of unmarried women with births belong to 35 to 50 years age bracket with 14.9% of them unmarried.
| Age Bracket | Married | Unmarried |
| 15 to 19 years | 15 (32.6%) | 31 (67.4%) |
| 20 to 34 years | 5,445 (77.0%) | 1,627 (23.0%) |
| 35 to 50 years | 1,933 (85.1%) | 339 (14.9%) |
| Total | 7,390 (78.7%) | 2,000 (21.3%) |
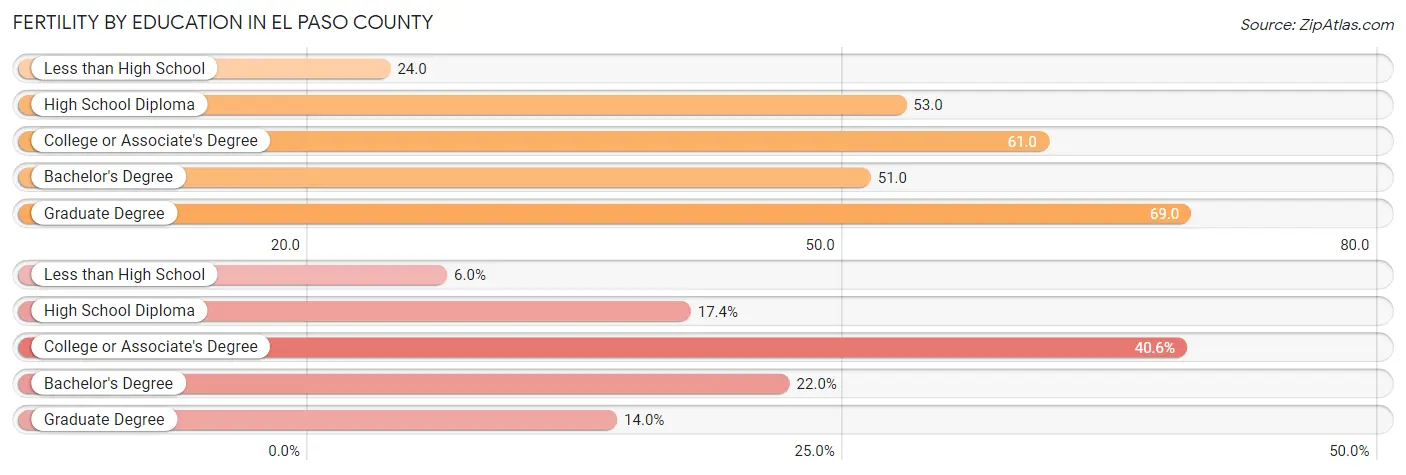
Fertility by Education in El Paso County
Average fertility rate in El Paso County is 54.0 births per 1,000 women. Women with the education attainment of graduate degree have the highest fertility rate of 69.0 births per 1,000 women, while women with the education attainment of less than high school have the lowest fertility at 24.0 births per 1,000 women. Women with the education attainment of college or associate's degree represent 40.6% of all women with births.
| Educational Attainment | Women with Births | Births / 1,000 Women |
| Less than High School | 562 (6.0%) | 24.0 |
| High School Diploma | 1,634 (17.4%) | 53.0 |
| College or Associate's Degree | 3,815 (40.6%) | 61.0 |
| Bachelor's Degree | 2,069 (22.0%) | 51.0 |
| Graduate Degree | 1,310 (14.0%) | 69.0 |
| Total | 9,390 (100.0%) | 54.0 |
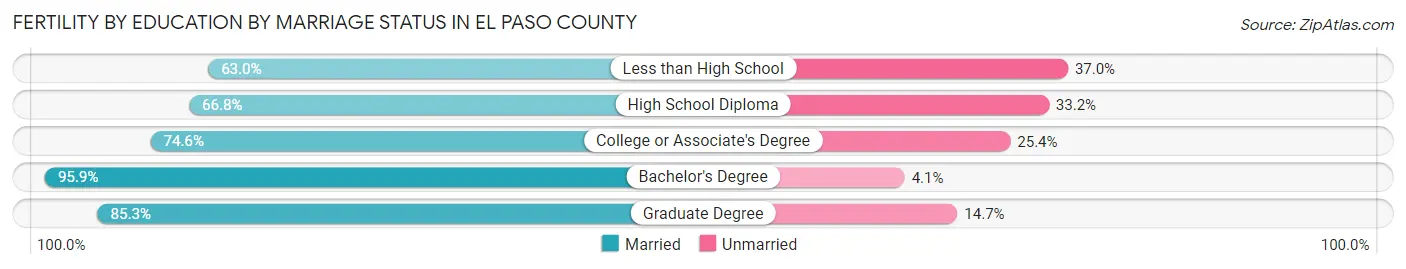
Fertility by Education by Marriage Status in El Paso County
21.3% of women with births in El Paso County are unmarried. Women with the educational attainment of bachelor's degree are most likely to be married with 95.9% of them married at childbirth, while women with the educational attainment of less than high school are least likely to be married with 37.0% of them unmarried at childbirth.
| Educational Attainment | Married | Unmarried |
| Less than High School | 354 (63.0%) | 208 (37.0%) |
| High School Diploma | 1,092 (66.8%) | 542 (33.2%) |
| College or Associate's Degree | 2,846 (74.6%) | 969 (25.4%) |
| Bachelor's Degree | 1,984 (95.9%) | 85 (4.1%) |
| Graduate Degree | 1,117 (85.3%) | 193 (14.7%) |
| Total | 7,390 (78.7%) | 2,000 (21.3%) |
Income in El Paso County
Income Overview in El Paso County
Per Capita Income in El Paso County is $41,444, while median incomes of families and households are $98,645 and $82,748 respectively.
| Characteristic | Number | Measure |
| Per Capita Income | 730,323 | $41,444 |
| Median Family Income | 186,698 | $98,645 |
| Mean Family Income | 186,698 | $122,581 |
| Median Household Income | 276,371 | $82,748 |
| Mean Household Income | 276,371 | $106,872 |
| Income Deficit | 186,698 | $11,941 |
| Wage / Income Gap (%) | 730,323 | 28.32% |
| Wage / Income Gap ($) | 730,323 | 71.68¢ per $1 |
| Gini / Inequality Index | 730,323 | 0.43 |
Earnings by Sex in El Paso County
Average Earnings in El Paso County are $42,114, $49,340 for men and $35,365 for women, a difference of 28.3%.
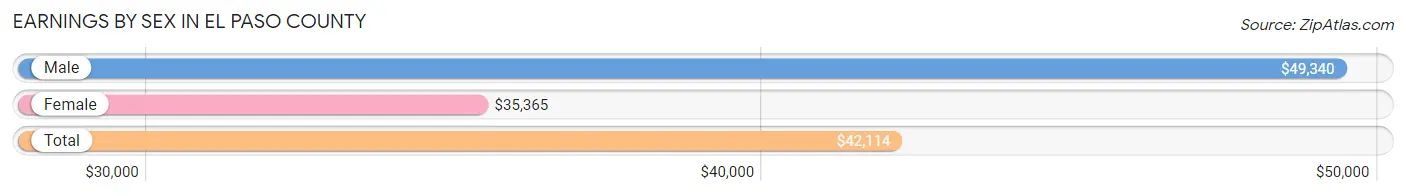
| Sex | Number | Average Earnings |
| Male | 228,007 (55.7%) | $49,340 |
| Female | 181,620 (44.3%) | $35,365 |
| Total | 409,627 (100.0%) | $42,114 |
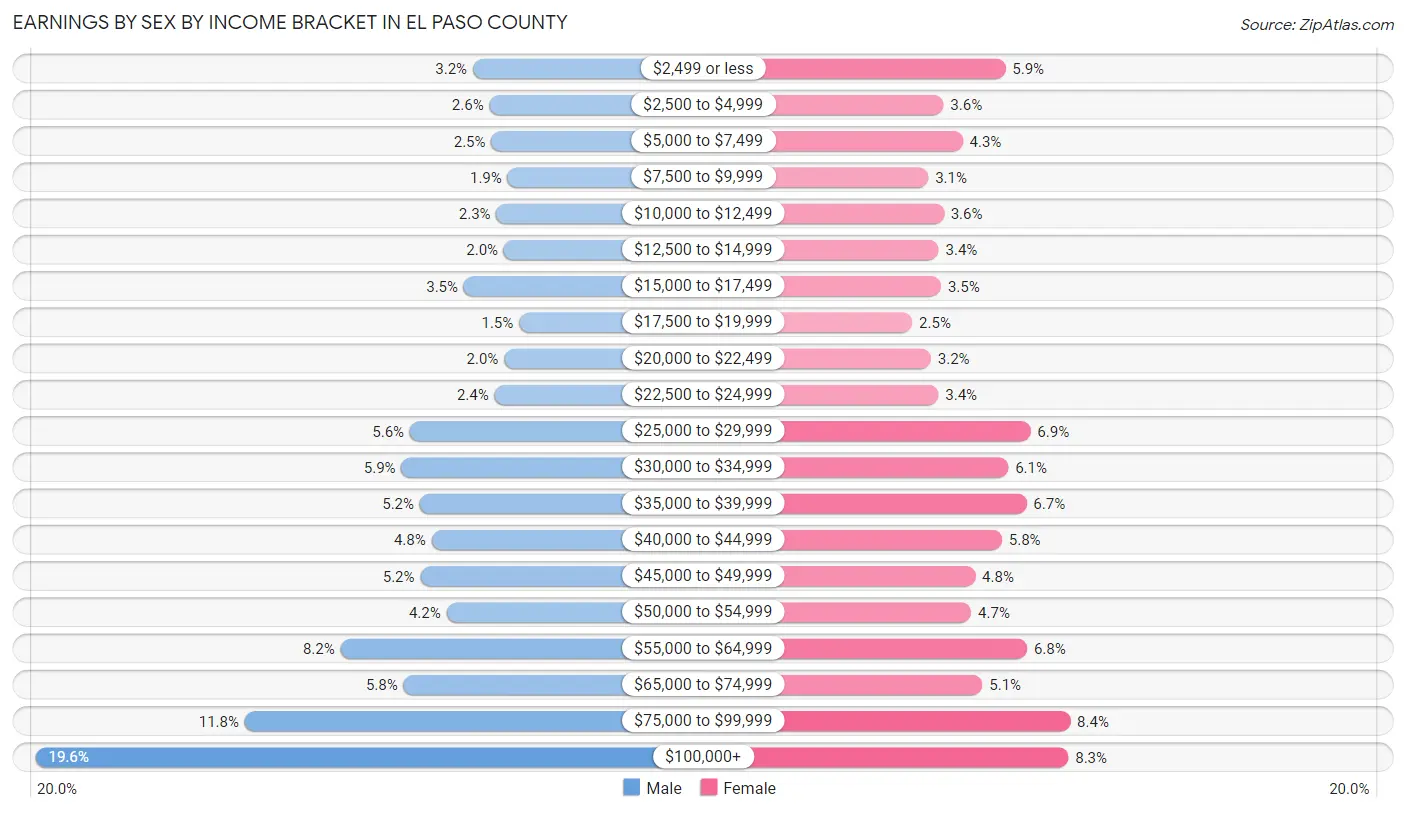
Earnings by Sex by Income Bracket in El Paso County
The most common earnings brackets in El Paso County are $100,000+ for men (44,659 | 19.6%) and $75,000 to $99,999 for women (15,197 | 8.4%).
| Income | Male | Female |
| $2,499 or less | 7,300 (3.2%) | 10,788 (5.9%) |
| $2,500 to $4,999 | 5,891 (2.6%) | 6,566 (3.6%) |
| $5,000 to $7,499 | 5,722 (2.5%) | 7,878 (4.3%) |
| $7,500 to $9,999 | 4,326 (1.9%) | 5,531 (3.0%) |
| $10,000 to $12,499 | 5,289 (2.3%) | 6,590 (3.6%) |
| $12,500 to $14,999 | 4,640 (2.0%) | 6,243 (3.4%) |
| $15,000 to $17,499 | 8,062 (3.5%) | 6,416 (3.5%) |
| $17,500 to $19,999 | 3,348 (1.5%) | 4,451 (2.5%) |
| $20,000 to $22,499 | 4,625 (2.0%) | 5,718 (3.2%) |
| $22,500 to $24,999 | 5,445 (2.4%) | 6,224 (3.4%) |
| $25,000 to $29,999 | 12,683 (5.6%) | 12,502 (6.9%) |
| $30,000 to $34,999 | 13,414 (5.9%) | 10,987 (6.0%) |
| $35,000 to $39,999 | 11,826 (5.2%) | 12,219 (6.7%) |
| $40,000 to $44,999 | 10,831 (4.8%) | 10,546 (5.8%) |
| $45,000 to $49,999 | 11,779 (5.2%) | 8,737 (4.8%) |
| $50,000 to $54,999 | 9,553 (4.2%) | 8,466 (4.7%) |
| $55,000 to $64,999 | 18,604 (8.2%) | 12,251 (6.8%) |
| $65,000 to $74,999 | 13,228 (5.8%) | 9,234 (5.1%) |
| $75,000 to $99,999 | 26,782 (11.7%) | 15,197 (8.4%) |
| $100,000+ | 44,659 (19.6%) | 15,076 (8.3%) |
| Total | 228,007 (100.0%) | 181,620 (100.0%) |
Earnings by Sex by Educational Attainment in El Paso County
Average earnings in El Paso County are $59,007 for men and $40,825 for women, a difference of 30.8%. Men with an educational attainment of graduate degree enjoy the highest average annual earnings of $103,818, while those with less than high school education earn the least with $37,478. Women with an educational attainment of graduate degree earn the most with the average annual earnings of $61,777, while those with less than high school education have the smallest earnings of $25,391.
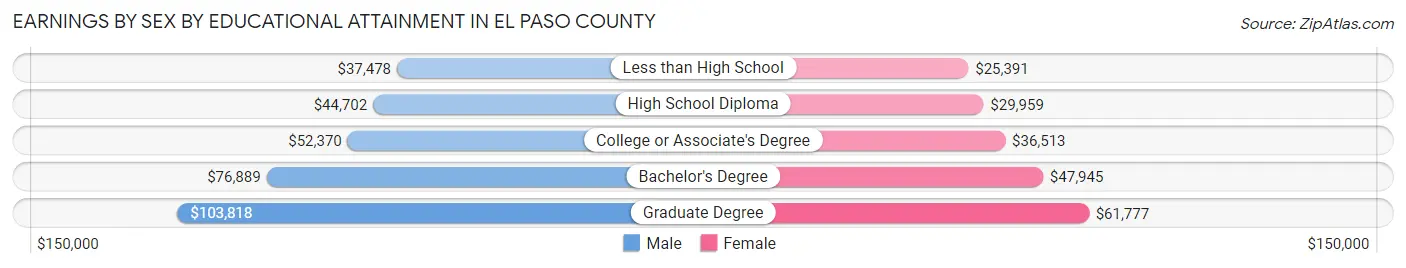
| Educational Attainment | Male Income | Female Income |
| Less than High School | $37,478 | $25,391 |
| High School Diploma | $44,702 | $29,959 |
| College or Associate's Degree | $52,370 | $36,513 |
| Bachelor's Degree | $76,889 | $47,945 |
| Graduate Degree | $103,818 | $61,777 |
| Total | $59,007 | $40,825 |
Family Income in El Paso County
Family Income Brackets in El Paso County
According to the El Paso County family income data, there are 42,194 families falling into the $100,000 to $149,999 income range, which is the most common income bracket and makes up 22.6% of all families. Conversely, the $10,000 to $14,999 income bracket is the least frequent group with only 2,054 families (1.1%) belonging to this category.
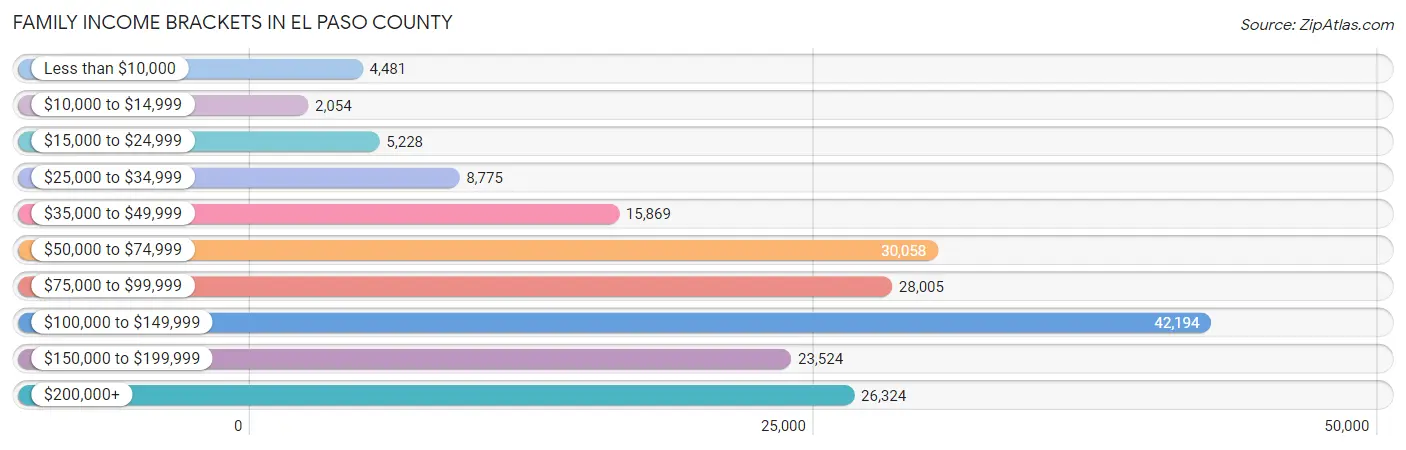
| Income Bracket | # Families | % Families |
| Less than $10,000 | 4,481 | 2.4% |
| $10,000 to $14,999 | 2,054 | 1.1% |
| $15,000 to $24,999 | 5,228 | 2.8% |
| $25,000 to $34,999 | 8,775 | 4.7% |
| $35,000 to $49,999 | 15,869 | 8.5% |
| $50,000 to $74,999 | 30,058 | 16.1% |
| $75,000 to $99,999 | 28,005 | 15.0% |
| $100,000 to $149,999 | 42,194 | 22.6% |
| $150,000 to $199,999 | 23,524 | 12.6% |
| $200,000+ | 26,324 | 14.1% |
Family Income by Famaliy Size in El Paso County
6-person families (5,616 | 3.0%) account for the highest median family income in El Paso County with $122,718 per family, while 2-person families (87,722 | 47.0%) have the highest median income of $44,594 per family member.
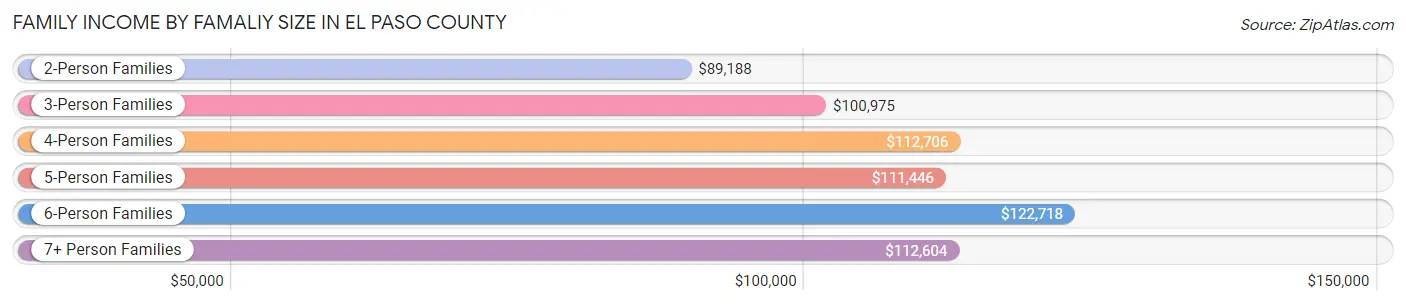
| Income Bracket | # Families | Median Income |
| 2-Person Families | 87,722 (47.0%) | $89,188 |
| 3-Person Families | 39,610 (21.2%) | $100,975 |
| 4-Person Families | 33,985 (18.2%) | $112,706 |
| 5-Person Families | 16,697 (8.9%) | $111,446 |
| 6-Person Families | 5,616 (3.0%) | $122,718 |
| 7+ Person Families | 3,068 (1.6%) | $112,604 |
| Total | 186,698 (100.0%) | $98,645 |
Family Income by Number of Earners in El Paso County
The median family income in El Paso County is $98,645, with families comprising 3+ earners (20,036) having the highest median family income of $147,907, while families with no earners (23,140) have the lowest median family income of $65,000, accounting for 10.7% and 12.4% of families, respectively.
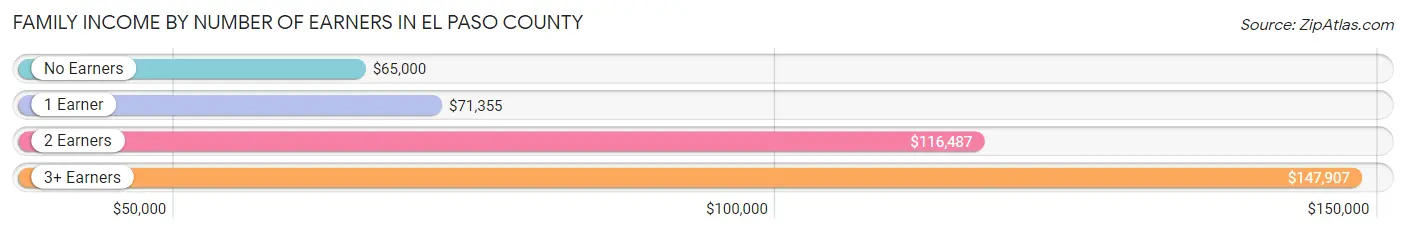
| Number of Earners | # Families | Median Income |
| No Earners | 23,140 (12.4%) | $65,000 |
| 1 Earner | 59,400 (31.8%) | $71,355 |
| 2 Earners | 84,122 (45.1%) | $116,487 |
| 3+ Earners | 20,036 (10.7%) | $147,907 |
| Total | 186,698 (100.0%) | $98,645 |
Household Income in El Paso County
Household Income Brackets in El Paso County
With 53,892 households falling in the category, the $100,000 to $149,999 income range is the most frequent in El Paso County, accounting for 19.5% of all households. In contrast, only 6,633 households (2.4%) fall into the $10,000 to $14,999 income bracket, making it the least populous group.
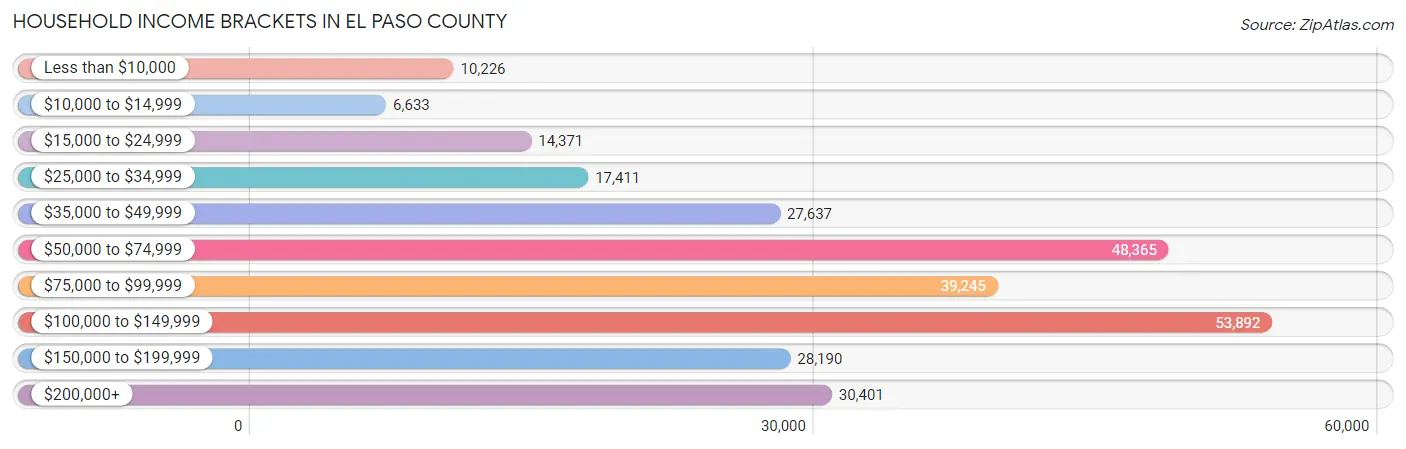
| Income Bracket | # Households | % Households |
| Less than $10,000 | 10,226 | 3.7% |
| $10,000 to $14,999 | 6,633 | 2.4% |
| $15,000 to $24,999 | 14,371 | 5.2% |
| $25,000 to $34,999 | 17,411 | 6.3% |
| $35,000 to $49,999 | 27,637 | 10.0% |
| $50,000 to $74,999 | 48,365 | 17.5% |
| $75,000 to $99,999 | 39,245 | 14.2% |
| $100,000 to $149,999 | 53,892 | 19.5% |
| $150,000 to $199,999 | 28,190 | 10.2% |
| $200,000+ | 30,401 | 11.0% |
Household Income by Householder Age in El Paso County
The median household income in El Paso County is $82,748, with the highest median household income of $103,096 found in the 45 to 64 years age bracket for the primary householder. A total of 94,738 households (34.3%) fall into this category. Meanwhile, the 15 to 24 years age bracket for the primary householder has the lowest median household income of $51,471, with 15,525 households (5.6%) in this group.
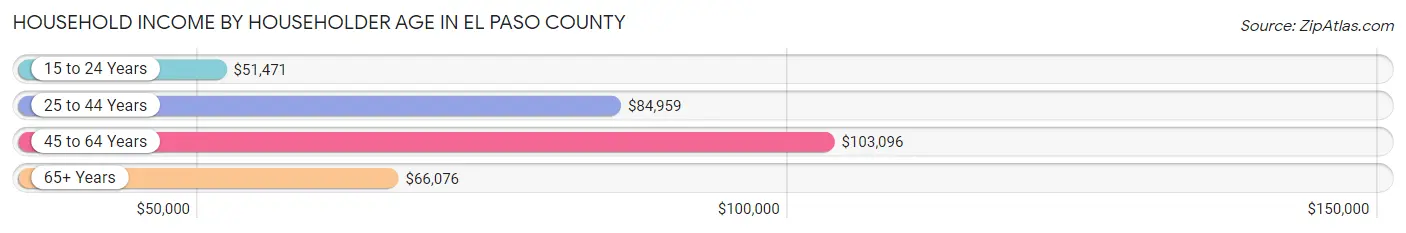
| Income Bracket | # Households | Median Income |
| 15 to 24 Years | 15,525 (5.6%) | $51,471 |
| 25 to 44 Years | 106,085 (38.4%) | $84,959 |
| 45 to 64 Years | 94,738 (34.3%) | $103,096 |
| 65+ Years | 60,023 (21.7%) | $66,076 |
| Total | 276,371 (100.0%) | $82,748 |
Poverty in El Paso County
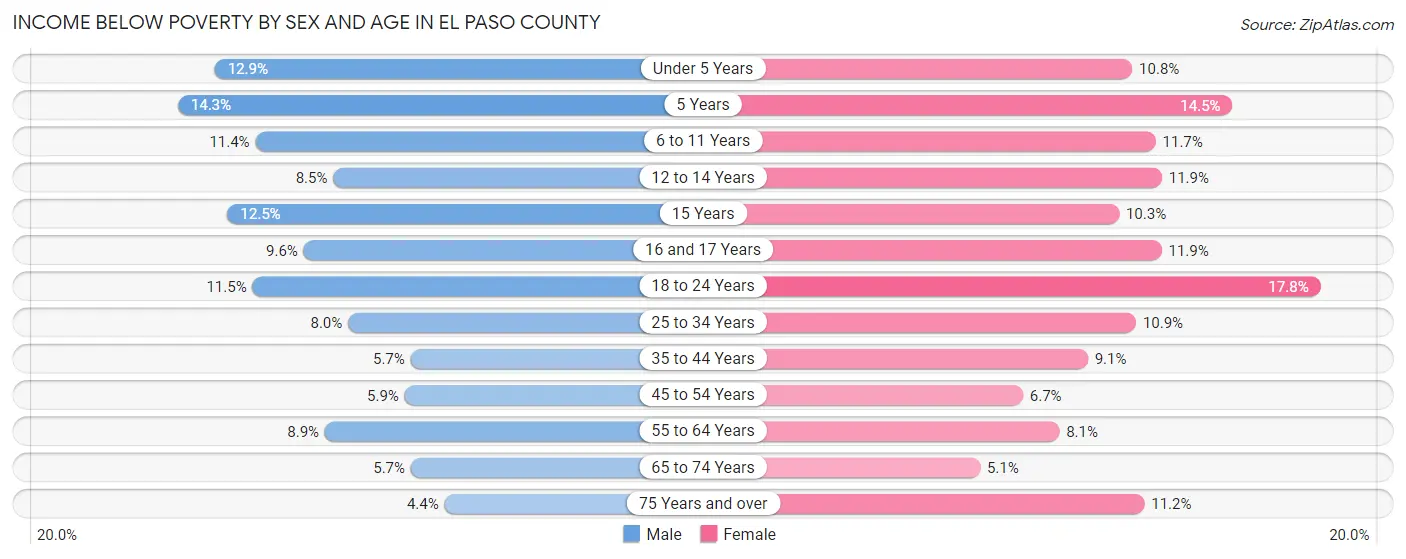
Income Below Poverty by Sex and Age in El Paso County
With 8.4% poverty level for males and 10.1% for females among the residents of El Paso County, 5 year old males and 18 to 24 year old females are the most vulnerable to poverty, with 602 males (14.3%) and 5,446 females (17.8%) in their respective age groups living below the poverty level.
| Age Bracket | Male | Female |
| Under 5 Years | 3,020 (12.9%) | 2,383 (10.8%) |
| 5 Years | 602 (14.3%) | 632 (14.5%) |
| 6 to 11 Years | 3,391 (11.4%) | 3,303 (11.7%) |
| 12 to 14 Years | 1,247 (8.5%) | 1,619 (11.9%) |
| 15 Years | 630 (12.5%) | 571 (10.3%) |
| 16 and 17 Years | 953 (9.6%) | 1,027 (11.9%) |
| 18 to 24 Years | 4,045 (11.5%) | 5,446 (17.8%) |
| 25 to 34 Years | 4,829 (8.0%) | 5,991 (10.9%) |
| 35 to 44 Years | 2,824 (5.7%) | 4,289 (9.1%) |
| 45 to 54 Years | 2,448 (5.9%) | 2,747 (6.7%) |
| 55 to 64 Years | 3,613 (8.8%) | 3,487 (8.1%) |
| 65 to 74 Years | 1,586 (5.7%) | 1,618 (5.1%) |
| 75 Years and over | 668 (4.4%) | 2,356 (11.2%) |
| Total | 29,856 (8.4%) | 35,469 (10.1%) |
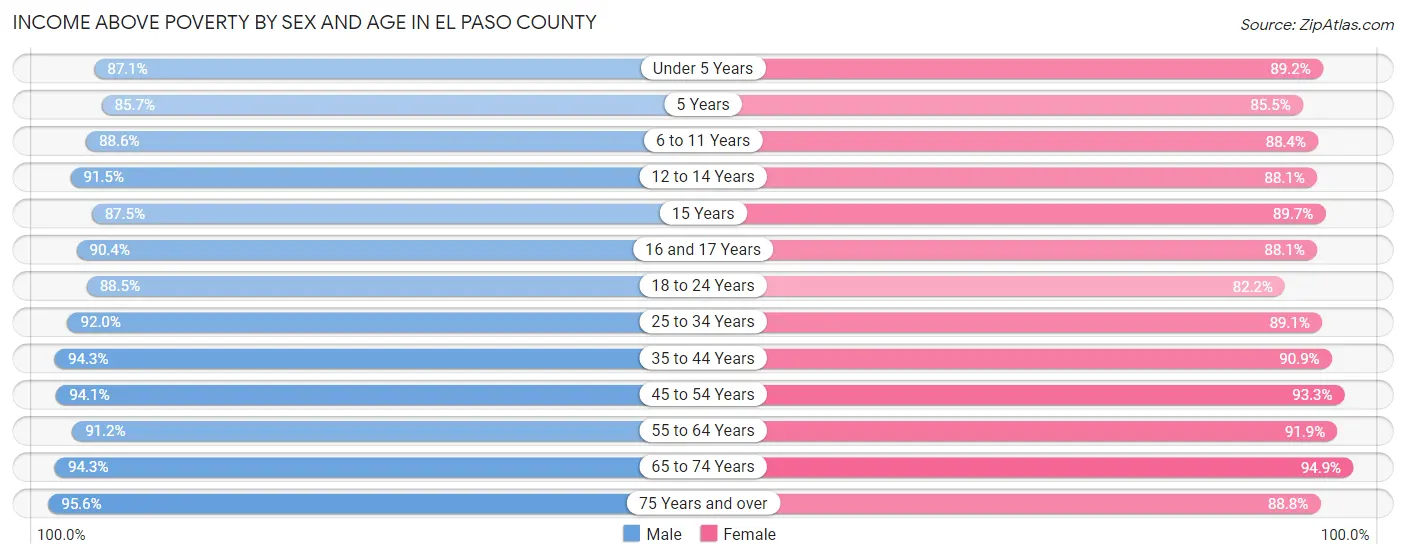
Income Above Poverty by Sex and Age in El Paso County
According to the poverty statistics in El Paso County, males aged 75 years and over and females aged 65 to 74 years are the age groups that are most secure financially, with 95.6% of males and 94.9% of females in these age groups living above the poverty line.
| Age Bracket | Male | Female |
| Under 5 Years | 20,318 (87.1%) | 19,715 (89.2%) |
| 5 Years | 3,604 (85.7%) | 3,728 (85.5%) |
| 6 to 11 Years | 26,282 (88.6%) | 25,059 (88.3%) |
| 12 to 14 Years | 13,363 (91.5%) | 12,014 (88.1%) |
| 15 Years | 4,424 (87.5%) | 4,980 (89.7%) |
| 16 and 17 Years | 8,932 (90.4%) | 7,623 (88.1%) |
| 18 to 24 Years | 31,002 (88.5%) | 25,200 (82.2%) |
| 25 to 34 Years | 55,637 (92.0%) | 48,855 (89.1%) |
| 35 to 44 Years | 46,983 (94.3%) | 42,669 (90.9%) |
| 45 to 54 Years | 39,145 (94.1%) | 38,127 (93.3%) |
| 55 to 64 Years | 37,194 (91.1%) | 39,738 (91.9%) |
| 65 to 74 Years | 26,451 (94.3%) | 29,927 (94.9%) |
| 75 Years and over | 14,482 (95.6%) | 18,631 (88.8%) |
| Total | 327,817 (91.6%) | 316,266 (89.9%) |
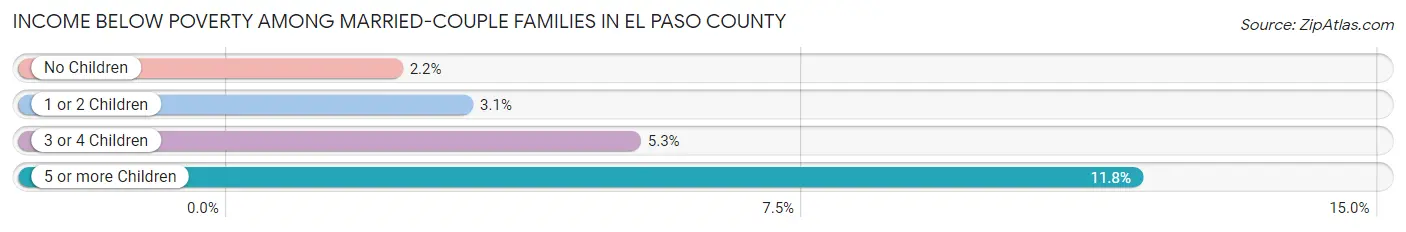
Income Below Poverty Among Married-Couple Families in El Paso County
The poverty statistics for married-couple families in El Paso County show that 2.8% or 4,141 of the total 146,588 families live below the poverty line. Families with 5 or more children have the highest poverty rate of 11.8%, comprising of 136 families. On the other hand, families with no children have the lowest poverty rate of 2.1%, which includes 1,776 families.
| Children | Above Poverty | Below Poverty |
| No Children | 80,746 (97.9%) | 1,776 (2.1%) |
| 1 or 2 Children | 47,915 (96.9%) | 1,520 (3.1%) |
| 3 or 4 Children | 12,770 (94.7%) | 709 (5.3%) |
| 5 or more Children | 1,016 (88.2%) | 136 (11.8%) |
| Total | 142,447 (97.2%) | 4,141 (2.8%) |
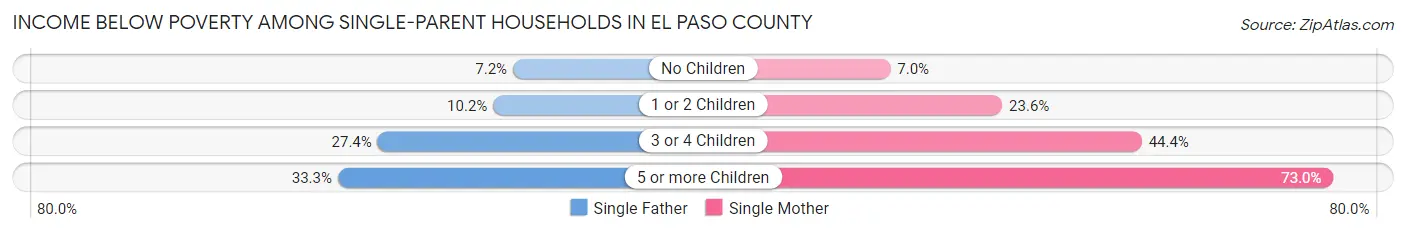
Income Below Poverty Among Single-Parent Households in El Paso County
According to the poverty data in El Paso County, 10.3% or 1,365 single-father households and 20.6% or 5,531 single-mother households are living below the poverty line. Among single-father households, those with 5 or more children have the highest poverty rate, with 5 households (33.3%) experiencing poverty. Likewise, among single-mother households, those with 5 or more children have the highest poverty rate, with 286 households (73.0%) falling below the poverty line.
| Children | Single Father | Single Mother |
| No Children | 415 (7.2%) | 695 (7.0%) |
| 1 or 2 Children | 648 (10.2%) | 3,172 (23.6%) |
| 3 or 4 Children | 297 (27.4%) | 1,378 (44.4%) |
| 5 or more Children | 5 (33.3%) | 286 (73.0%) |
| Total | 1,365 (10.3%) | 5,531 (20.6%) |
Income Below Poverty Among Married-Couple vs Single-Parent Households in El Paso County
The poverty data for El Paso County shows that 4,141 of the married-couple family households (2.8%) and 6,896 of the single-parent households (17.2%) are living below the poverty level. Within the married-couple family households, those with 5 or more children have the highest poverty rate, with 136 households (11.8%) falling below the poverty line. Among the single-parent households, those with 5 or more children have the highest poverty rate, with 291 household (71.5%) living below poverty.
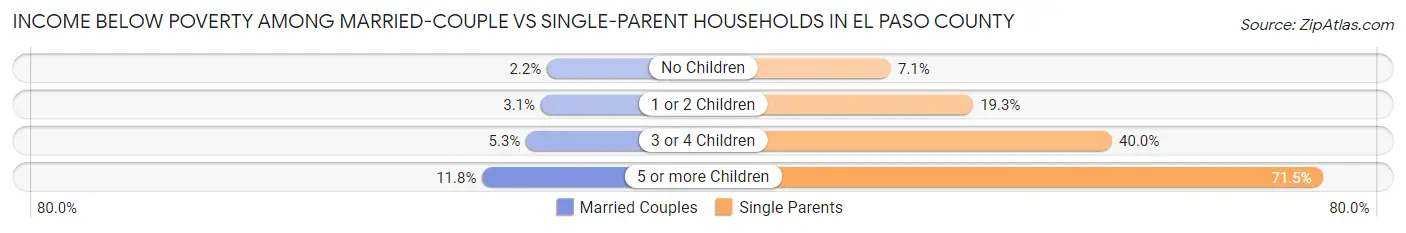
| Children | Married-Couple Families | Single-Parent Households |
| No Children | 1,776 (2.1%) | 1,110 (7.1%) |
| 1 or 2 Children | 1,520 (3.1%) | 3,820 (19.3%) |
| 3 or 4 Children | 709 (5.3%) | 1,675 (40.0%) |
| 5 or more Children | 136 (11.8%) | 291 (71.5%) |
| Total | 4,141 (2.8%) | 6,896 (17.2%) |
Employment Characteristics in El Paso County
Employment by Class of Employer in El Paso County
Among the 368,980 employed individuals in El Paso County, private company employees (213,985 | 58.0%), federal government employees (52,219 | 14.1%), and not-for-profit organizations (32,235 | 8.7%) make up the most common classes of employment.
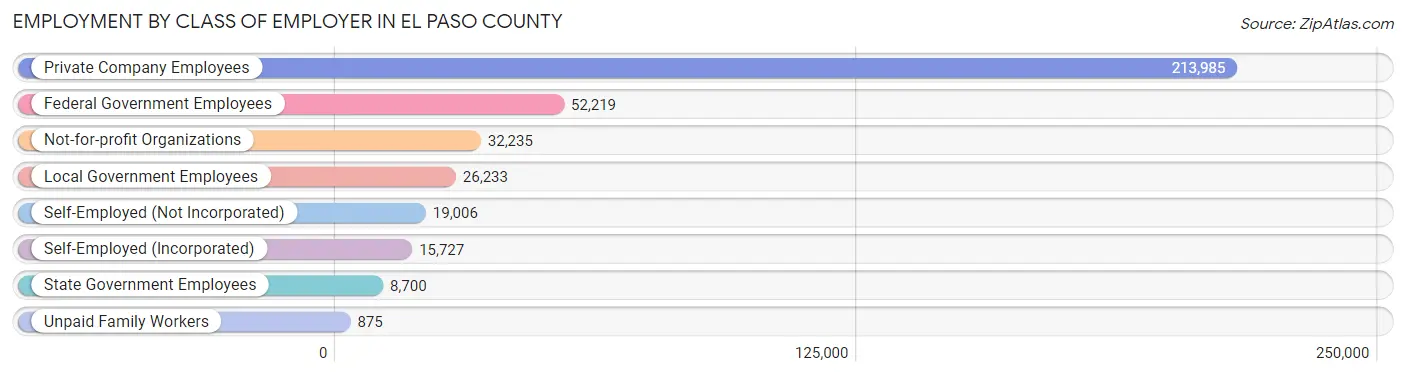
| Employer Class | # Employees | % Employees |
| Private Company Employees | 213,985 | 58.0% |
| Self-Employed (Incorporated) | 15,727 | 4.3% |
| Self-Employed (Not Incorporated) | 19,006 | 5.1% |
| Not-for-profit Organizations | 32,235 | 8.7% |
| Local Government Employees | 26,233 | 7.1% |
| State Government Employees | 8,700 | 2.4% |
| Federal Government Employees | 52,219 | 14.1% |
| Unpaid Family Workers | 875 | 0.2% |
| Total | 368,980 | 100.0% |
Employment Status by Age in El Paso County
According to the labor force statistics for El Paso County, out of the total population over 16 years of age (577,141), 68.6% or 395,919 individuals are in the labor force, with 5.7% or 22,567 of them unemployed. The age group with the highest labor force participation rate is 25 to 29 years, with 86.1% or 51,870 individuals in the labor force. Within the labor force, the 16 to 19 years age range has the highest percentage of unemployed individuals, with 17.8% or 3,451 of them being unemployed.
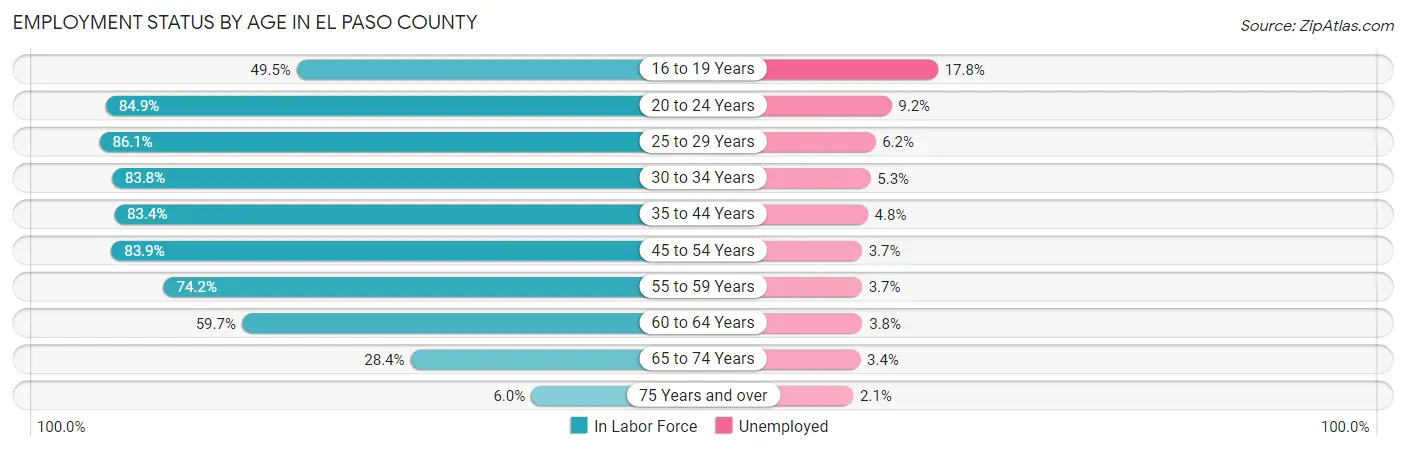
| Age Bracket | In Labor Force | Unemployed |
| 16 to 19 Years | 19,386 (49.5%) | 3,451 (17.8%) |
| 20 to 24 Years | 50,188 (84.9%) | 4,617 (9.2%) |
| 25 to 29 Years | 51,870 (86.1%) | 3,216 (6.2%) |
| 30 to 34 Years | 47,521 (83.8%) | 2,519 (5.3%) |
| 35 to 44 Years | 81,052 (83.4%) | 3,890 (4.8%) |
| 45 to 54 Years | 69,505 (83.9%) | 2,572 (3.7%) |
| 55 to 59 Years | 33,246 (74.2%) | 1,230 (3.7%) |
| 60 to 64 Years | 23,688 (59.7%) | 900 (3.8%) |
| 65 to 74 Years | 17,042 (28.4%) | 579 (3.4%) |
| 75 Years and over | 2,243 (6.0%) | 47 (2.1%) |
| Total | 395,919 (68.6%) | 22,567 (5.7%) |
Employment Status by Educational Attainment in El Paso County
According to labor force statistics for El Paso County, 80.4% of individuals (306,698) out of the total population between 25 and 64 years of age (381,465) are in the labor force, with 4.6% or 14,108 of them being unemployed. The group with the highest labor force participation rate are those with the educational attainment of bachelor's degree or higher, with 86.1% or 132,829 individuals in the labor force. Within the labor force, individuals with less than high school education have the highest percentage of unemployment, with 7.9% or 992 of them being unemployed.
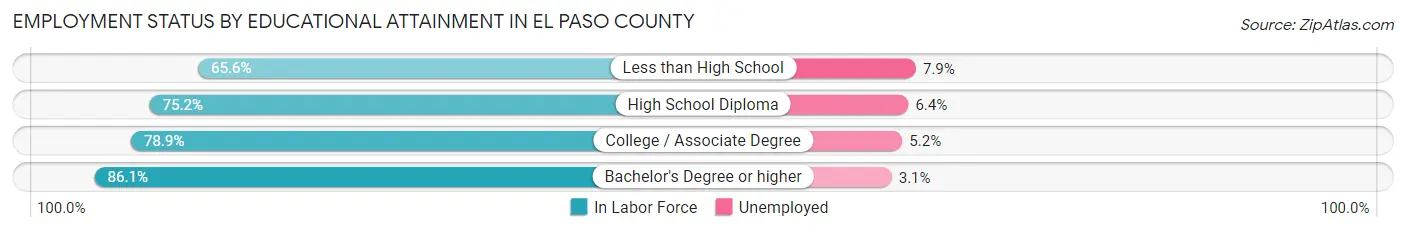
| Educational Attainment | In Labor Force | Unemployed |
| Less than High School | 12,559 (65.6%) | 1,512 (7.9%) |
| High School Diploma | 54,442 (75.2%) | 4,633 (6.4%) |
| College / Associate Degree | 107,029 (78.9%) | 7,054 (5.2%) |
| Bachelor's Degree or higher | 132,829 (86.1%) | 4,782 (3.1%) |
| Total | 306,698 (80.4%) | 17,547 (4.6%) |
Employment Occupations by Sex in El Paso County
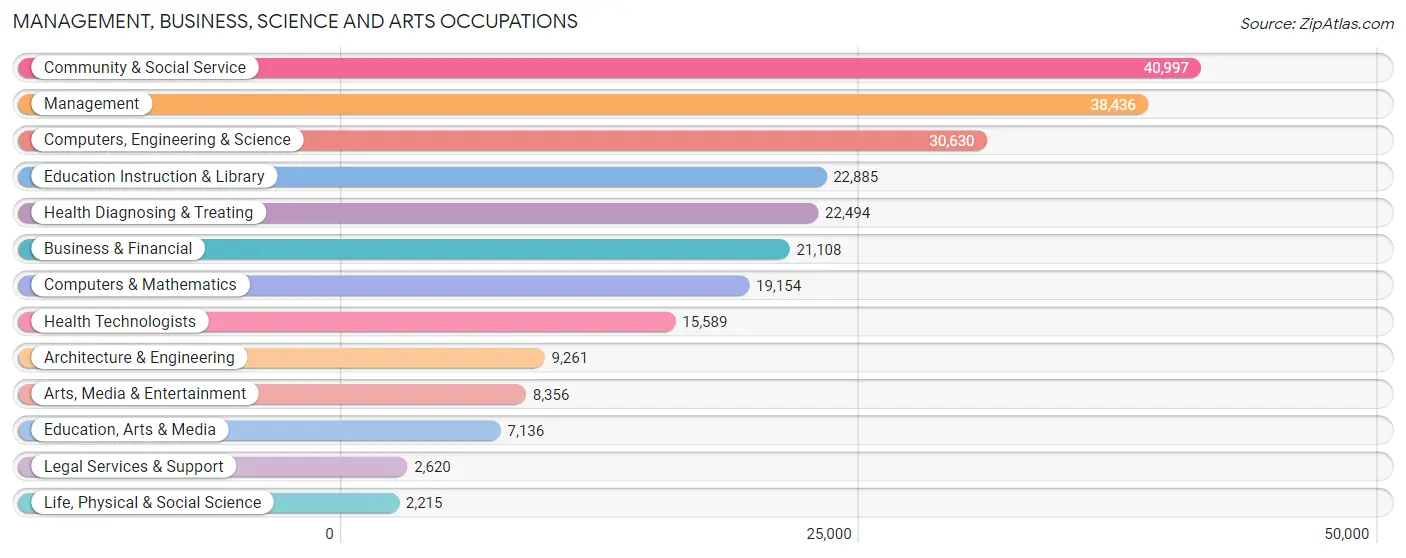
Management, Business, Science and Arts Occupations
The most common Management, Business, Science and Arts occupations in El Paso County are Community & Social Service (40,997 | 12.0%), Management (38,436 | 11.2%), Computers, Engineering & Science (30,630 | 8.9%), Education Instruction & Library (22,885 | 6.7%), and Health Diagnosing & Treating (22,494 | 6.6%).
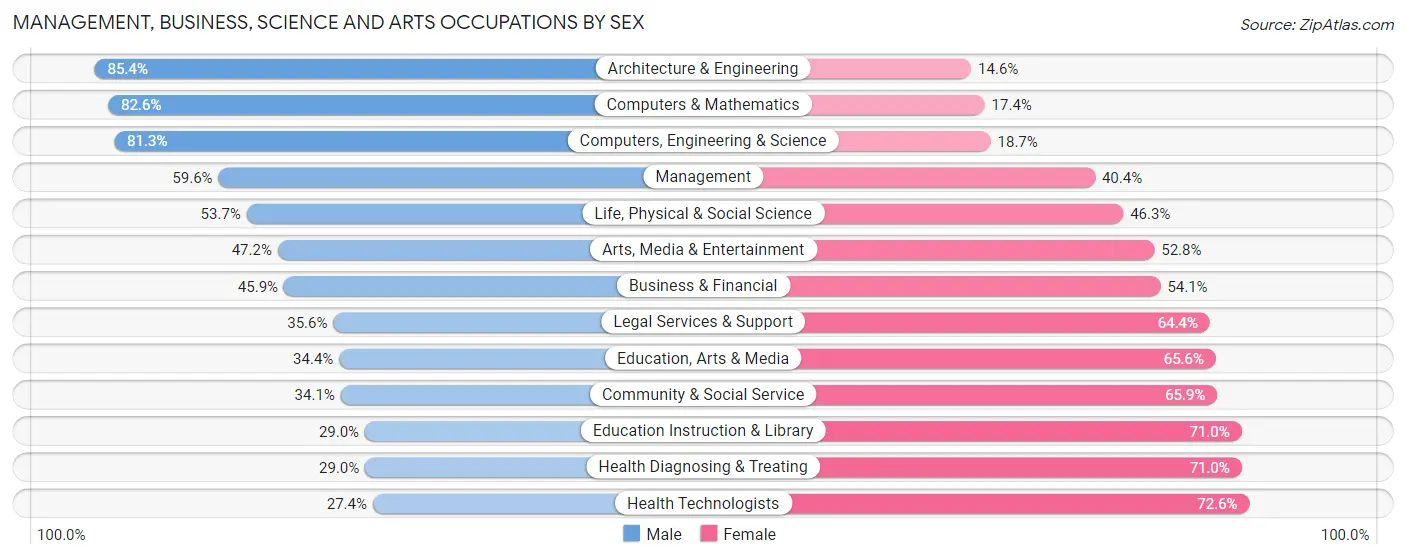
Management, Business, Science and Arts Occupations by Sex
Within the Management, Business, Science and Arts occupations in El Paso County, the most male-oriented occupations are Architecture & Engineering (85.4%), Computers & Mathematics (82.6%), and Computers, Engineering & Science (81.3%), while the most female-oriented occupations are Health Technologists (72.6%), Health Diagnosing & Treating (71.0%), and Education Instruction & Library (71.0%).
| Occupation | Male | Female |
| Management | 22,895 (59.6%) | 15,541 (40.4%) |
| Business & Financial | 9,691 (45.9%) | 11,417 (54.1%) |
| Computers, Engineering & Science | 24,915 (81.3%) | 5,715 (18.7%) |
| Computers & Mathematics | 15,817 (82.6%) | 3,337 (17.4%) |
| Architecture & Engineering | 7,909 (85.4%) | 1,352 (14.6%) |
| Life, Physical & Social Science | 1,189 (53.7%) | 1,026 (46.3%) |
| Community & Social Service | 13,966 (34.1%) | 27,031 (65.9%) |
| Education, Arts & Media | 2,453 (34.4%) | 4,683 (65.6%) |
| Legal Services & Support | 933 (35.6%) | 1,687 (64.4%) |
| Education Instruction & Library | 6,636 (29.0%) | 16,249 (71.0%) |
| Arts, Media & Entertainment | 3,944 (47.2%) | 4,412 (52.8%) |
| Health Diagnosing & Treating | 6,516 (29.0%) | 15,978 (71.0%) |
| Health Technologists | 4,265 (27.4%) | 11,324 (72.6%) |
| Total (Category) | 77,983 (50.7%) | 75,682 (49.2%) |
| Total (Overall) | 183,277 (53.5%) | 158,997 (46.5%) |
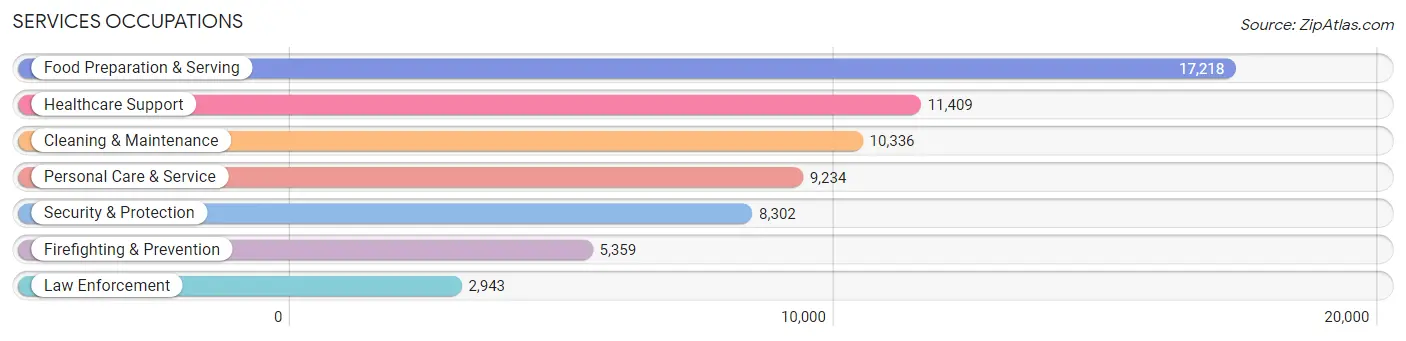
Services Occupations
The most common Services occupations in El Paso County are Food Preparation & Serving (17,218 | 5.0%), Healthcare Support (11,409 | 3.3%), Cleaning & Maintenance (10,336 | 3.0%), Personal Care & Service (9,234 | 2.7%), and Security & Protection (8,302 | 2.4%).
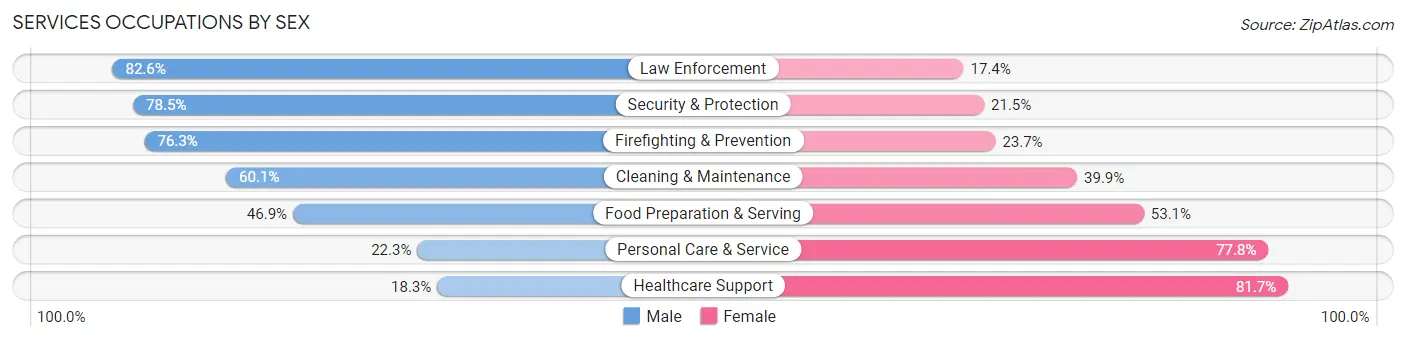
Services Occupations by Sex
Within the Services occupations in El Paso County, the most male-oriented occupations are Law Enforcement (82.6%), Security & Protection (78.5%), and Firefighting & Prevention (76.3%), while the most female-oriented occupations are Healthcare Support (81.7%), Personal Care & Service (77.7%), and Food Preparation & Serving (53.1%).
| Occupation | Male | Female |
| Healthcare Support | 2,090 (18.3%) | 9,319 (81.7%) |
| Security & Protection | 6,517 (78.5%) | 1,785 (21.5%) |
| Firefighting & Prevention | 4,087 (76.3%) | 1,272 (23.7%) |
| Law Enforcement | 2,430 (82.6%) | 513 (17.4%) |
| Food Preparation & Serving | 8,070 (46.9%) | 9,148 (53.1%) |
| Cleaning & Maintenance | 6,211 (60.1%) | 4,125 (39.9%) |
| Personal Care & Service | 2,055 (22.3%) | 7,179 (77.7%) |
| Total (Category) | 24,943 (44.2%) | 31,556 (55.8%) |
| Total (Overall) | 183,277 (53.5%) | 158,997 (46.5%) |
Sales and Office Occupations
The most common Sales and Office occupations in El Paso County are Office & Administration (37,811 | 11.1%), and Sales & Related (32,696 | 9.6%).

Sales and Office Occupations by Sex

| Occupation | Male | Female |
| Sales & Related | 17,617 (53.9%) | 15,079 (46.1%) |
| Office & Administration | 10,740 (28.4%) | 27,071 (71.6%) |
| Total (Category) | 28,357 (40.2%) | 42,150 (59.8%) |
| Total (Overall) | 183,277 (53.5%) | 158,997 (46.5%) |
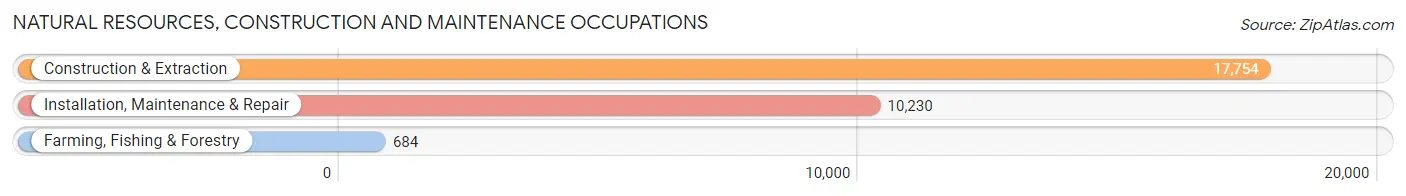
Natural Resources, Construction and Maintenance Occupations
The most common Natural Resources, Construction and Maintenance occupations in El Paso County are Construction & Extraction (17,754 | 5.2%), Installation, Maintenance & Repair (10,230 | 3.0%), and Farming, Fishing & Forestry (684 | 0.2%).
Natural Resources, Construction and Maintenance Occupations by Sex
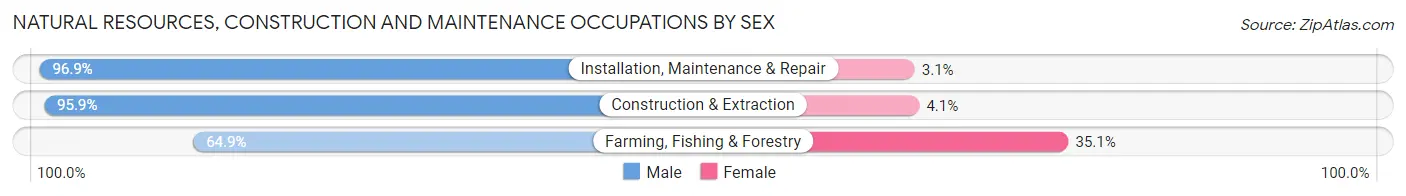
| Occupation | Male | Female |
| Farming, Fishing & Forestry | 444 (64.9%) | 240 (35.1%) |
| Construction & Extraction | 17,033 (95.9%) | 721 (4.1%) |
| Installation, Maintenance & Repair | 9,913 (96.9%) | 317 (3.1%) |
| Total (Category) | 27,390 (95.5%) | 1,278 (4.5%) |
| Total (Overall) | 183,277 (53.5%) | 158,997 (46.5%) |
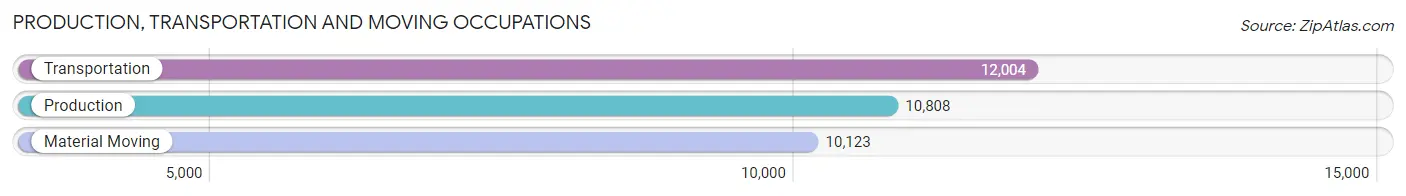
Production, Transportation and Moving Occupations
The most common Production, Transportation and Moving occupations in El Paso County are Transportation (12,004 | 3.5%), Production (10,808 | 3.2%), and Material Moving (10,123 | 3.0%).
Production, Transportation and Moving Occupations by Sex
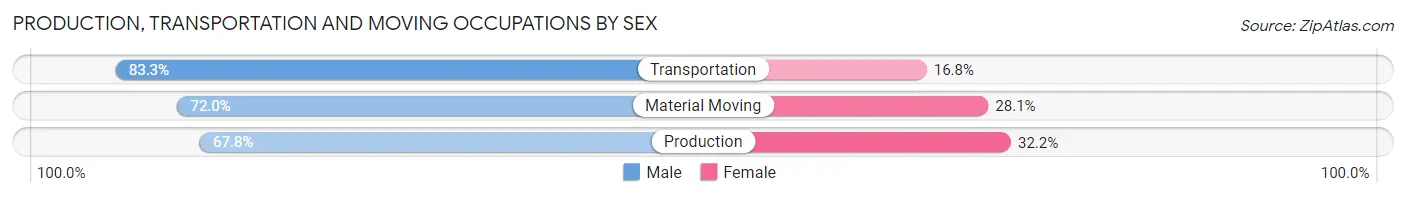
| Occupation | Male | Female |
| Production | 7,328 (67.8%) | 3,480 (32.2%) |
| Transportation | 9,993 (83.3%) | 2,011 (16.8%) |
| Material Moving | 7,283 (72.0%) | 2,840 (28.1%) |
| Total (Category) | 24,604 (74.7%) | 8,331 (25.3%) |
| Total (Overall) | 183,277 (53.5%) | 158,997 (46.5%) |
Employment Industries by Sex in El Paso County
Employment Industries in El Paso County
The major employment industries in El Paso County include Health Care & Social Assistance (47,898 | 14.0%), Retail Trade (38,370 | 11.2%), Professional & Scientific (33,984 | 9.9%), Educational Services (33,053 | 9.7%), and Construction (26,504 | 7.7%).

Employment Industries by Sex in El Paso County
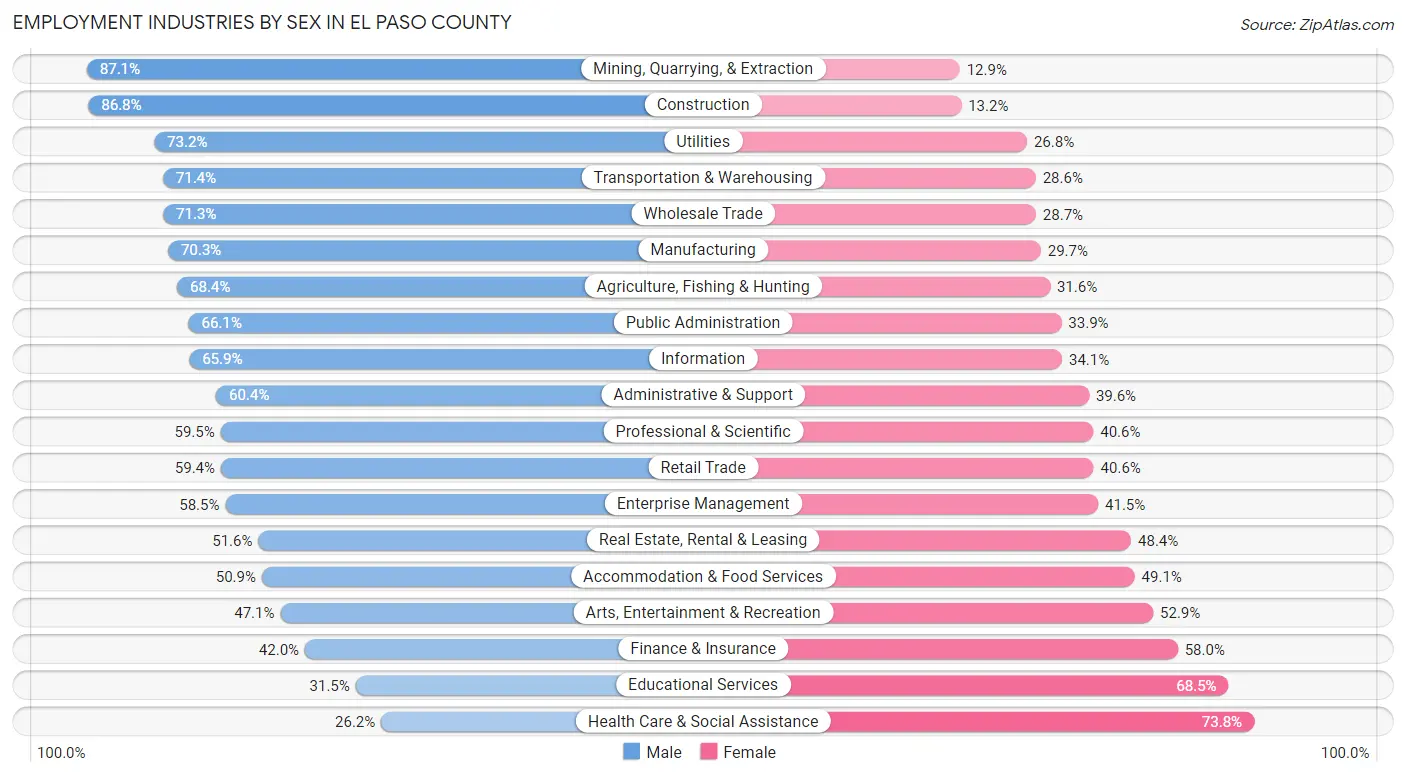
The El Paso County industries that see more men than women are Mining, Quarrying, & Extraction (87.1%), Construction (86.8%), and Utilities (73.2%), whereas the industries that tend to have a higher number of women are Health Care & Social Assistance (73.8%), Educational Services (68.5%), and Finance & Insurance (58.0%).
| Industry | Male | Female |
| Agriculture, Fishing & Hunting | 1,042 (68.4%) | 481 (31.6%) |
| Mining, Quarrying, & Extraction | 513 (87.1%) | 76 (12.9%) |
| Construction | 23,003 (86.8%) | 3,501 (13.2%) |
| Manufacturing | 14,288 (70.3%) | 6,031 (29.7%) |
| Wholesale Trade | 3,813 (71.3%) | 1,532 (28.7%) |
| Retail Trade | 22,784 (59.4%) | 15,586 (40.6%) |
| Transportation & Warehousing | 8,839 (71.4%) | 3,546 (28.6%) |
| Utilities | 2,139 (73.2%) | 784 (26.8%) |
| Information | 5,713 (65.9%) | 2,953 (34.1%) |
| Finance & Insurance | 7,682 (42.0%) | 10,616 (58.0%) |
| Real Estate, Rental & Leasing | 3,696 (51.6%) | 3,462 (48.4%) |
| Professional & Scientific | 20,205 (59.5%) | 13,779 (40.6%) |
| Enterprise Management | 197 (58.5%) | 140 (41.5%) |
| Administrative & Support | 9,447 (60.4%) | 6,203 (39.6%) |
| Educational Services | 10,408 (31.5%) | 22,645 (68.5%) |
| Health Care & Social Assistance | 12,552 (26.2%) | 35,346 (73.8%) |
| Arts, Entertainment & Recreation | 3,425 (47.1%) | 3,850 (52.9%) |
| Accommodation & Food Services | 12,289 (50.9%) | 11,855 (49.1%) |
| Public Administration | 12,192 (66.1%) | 6,265 (33.9%) |
| Total | 183,277 (53.5%) | 158,997 (46.5%) |
Education in El Paso County
School Enrollment in El Paso County
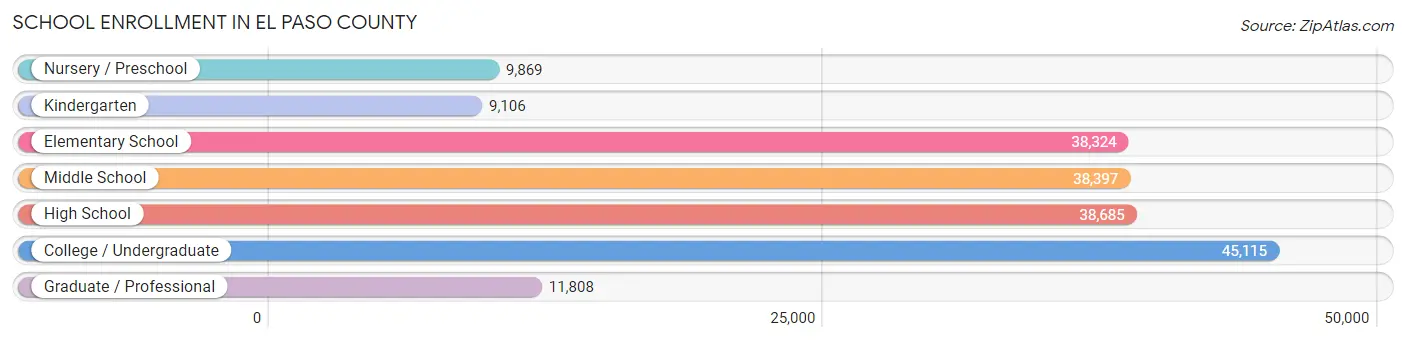
The most common levels of schooling among the 191,304 students in El Paso County are college / undergraduate (45,115 | 23.6%), high school (38,685 | 20.2%), and middle school (38,397 | 20.1%).
| School Level | # Students | % Students |
| Nursery / Preschool | 9,869 | 5.2% |
| Kindergarten | 9,106 | 4.8% |
| Elementary School | 38,324 | 20.0% |
| Middle School | 38,397 | 20.1% |
| High School | 38,685 | 20.2% |
| College / Undergraduate | 45,115 | 23.6% |
| Graduate / Professional | 11,808 | 6.2% |
| Total | 191,304 | 100.0% |
School Enrollment by Age by Funding Source in El Paso County
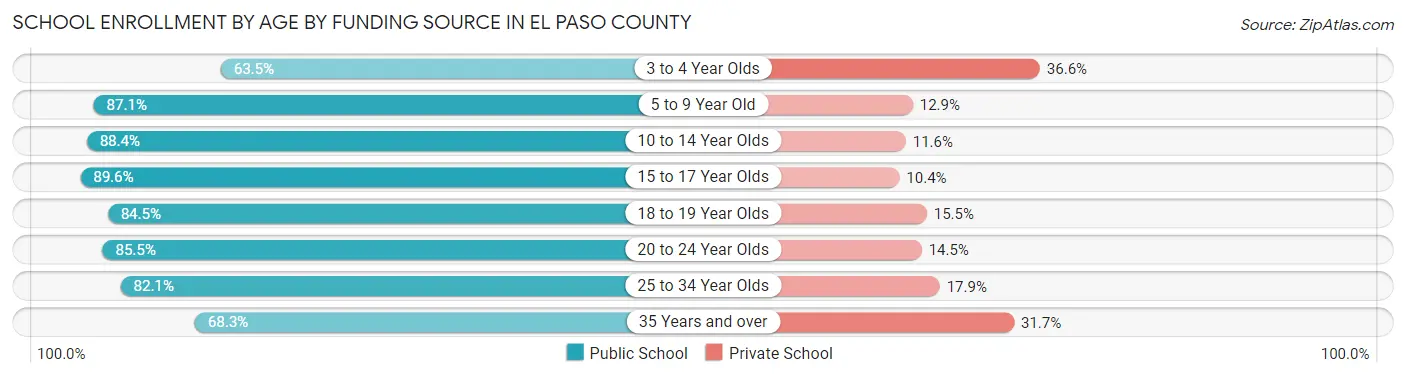
Out of a total of 191,304 students who are enrolled in schools in El Paso County, 29,078 (15.2%) attend a private institution, while the remaining 162,226 (84.8%) are enrolled in public schools. The age group of 3 to 4 year olds has the highest likelihood of being enrolled in private schools, with 2,934 (36.5% in the age bracket) enrolled. Conversely, the age group of 15 to 17 year olds has the lowest likelihood of being enrolled in a private school, with 25,420 (89.6% in the age bracket) attending a public institution.
| Age Bracket | Public School | Private School |
| 3 to 4 Year Olds | 5,094 (63.4%) | 2,934 (36.5%) |
| 5 to 9 Year Old | 39,090 (87.1%) | 5,772 (12.9%) |
| 10 to 14 Year Olds | 42,136 (88.4%) | 5,512 (11.6%) |
| 15 to 17 Year Olds | 25,420 (89.6%) | 2,945 (10.4%) |
| 18 to 19 Year Olds | 11,768 (84.5%) | 2,157 (15.5%) |
| 20 to 24 Year Olds | 16,652 (85.5%) | 2,830 (14.5%) |
| 25 to 34 Year Olds | 13,156 (82.1%) | 2,866 (17.9%) |
| 35 Years and over | 8,856 (68.3%) | 4,116 (31.7%) |
| Total | 162,226 (84.8%) | 29,078 (15.2%) |
Educational Attainment by Field of Study in El Paso County
Business (38,612 | 18.4%), education (19,575 | 9.3%), science & technology (19,240 | 9.2%), engineering (16,227 | 7.7%), and social sciences (15,992 | 7.6%) are the most common fields of study among 209,888 individuals in El Paso County who have obtained a bachelor's degree or higher.
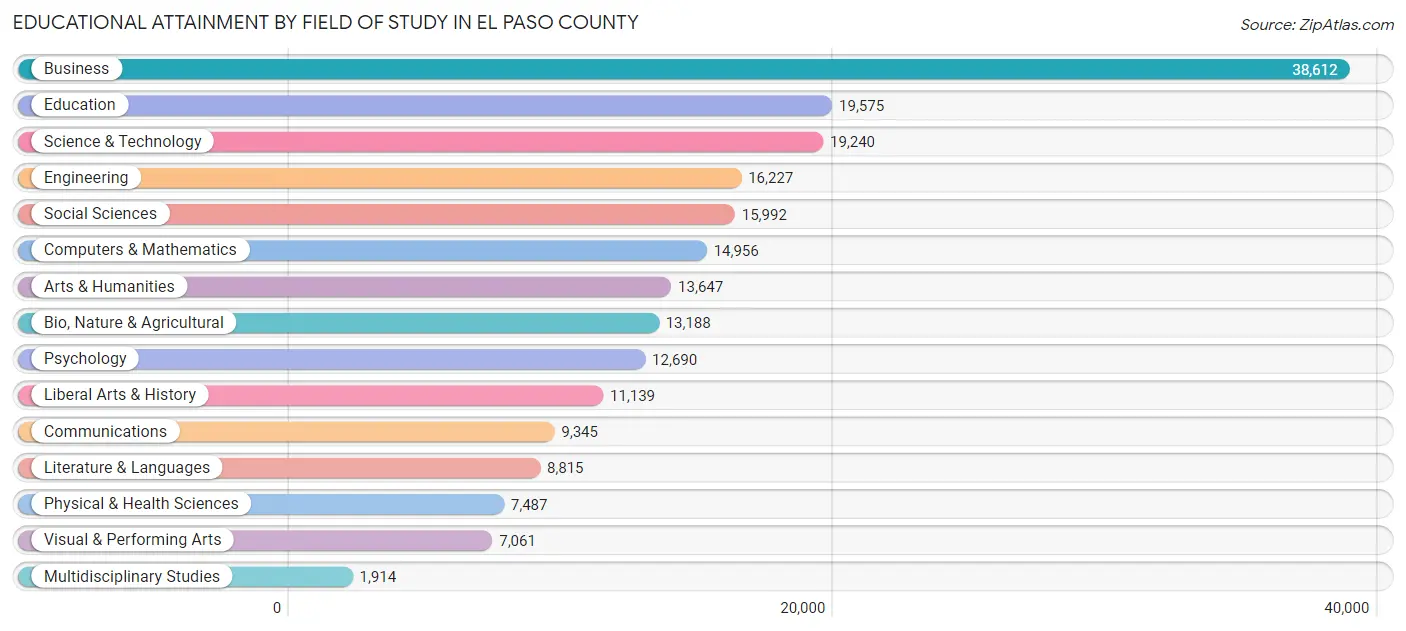
| Field of Study | # Graduates | % Graduates |
| Computers & Mathematics | 14,956 | 7.1% |
| Bio, Nature & Agricultural | 13,188 | 6.3% |
| Physical & Health Sciences | 7,487 | 3.6% |
| Psychology | 12,690 | 6.0% |
| Social Sciences | 15,992 | 7.6% |
| Engineering | 16,227 | 7.7% |
| Multidisciplinary Studies | 1,914 | 0.9% |
| Science & Technology | 19,240 | 9.2% |
| Business | 38,612 | 18.4% |
| Education | 19,575 | 9.3% |
| Literature & Languages | 8,815 | 4.2% |
| Liberal Arts & History | 11,139 | 5.3% |
| Visual & Performing Arts | 7,061 | 3.4% |
| Communications | 9,345 | 4.4% |
| Arts & Humanities | 13,647 | 6.5% |
| Total | 209,888 | 100.0% |
Transportation & Commute in El Paso County
Vehicle Availability by Sex in El Paso County
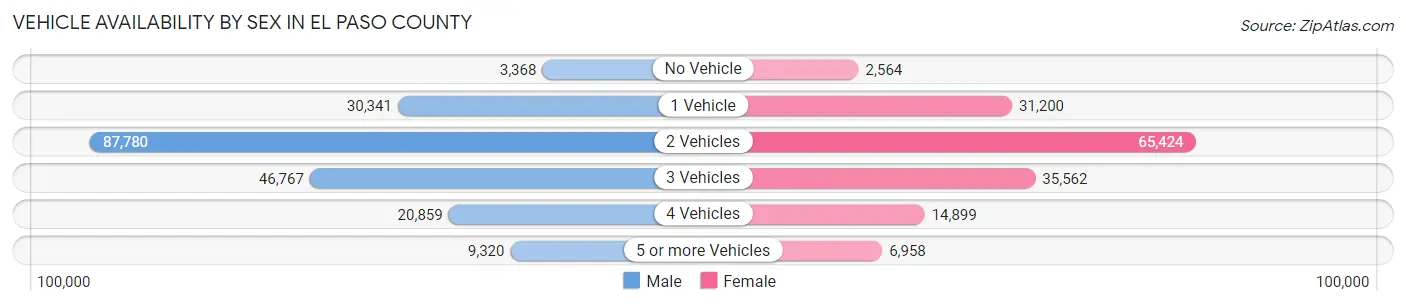
The most prevalent vehicle ownership categories in El Paso County are males with 2 vehicles (87,780, accounting for 44.2%) and females with 2 vehicles (65,424, making up 56.0%).
| Vehicles Available | Male | Female |
| No Vehicle | 3,368 (1.7%) | 2,564 (1.6%) |
| 1 Vehicle | 30,341 (15.3%) | 31,200 (19.9%) |
| 2 Vehicles | 87,780 (44.2%) | 65,424 (41.8%) |
| 3 Vehicles | 46,767 (23.6%) | 35,562 (22.7%) |
| 4 Vehicles | 20,859 (10.5%) | 14,899 (9.5%) |
| 5 or more Vehicles | 9,320 (4.7%) | 6,958 (4.4%) |
| Total | 198,435 (100.0%) | 156,607 (100.0%) |
Commute Time in El Paso County
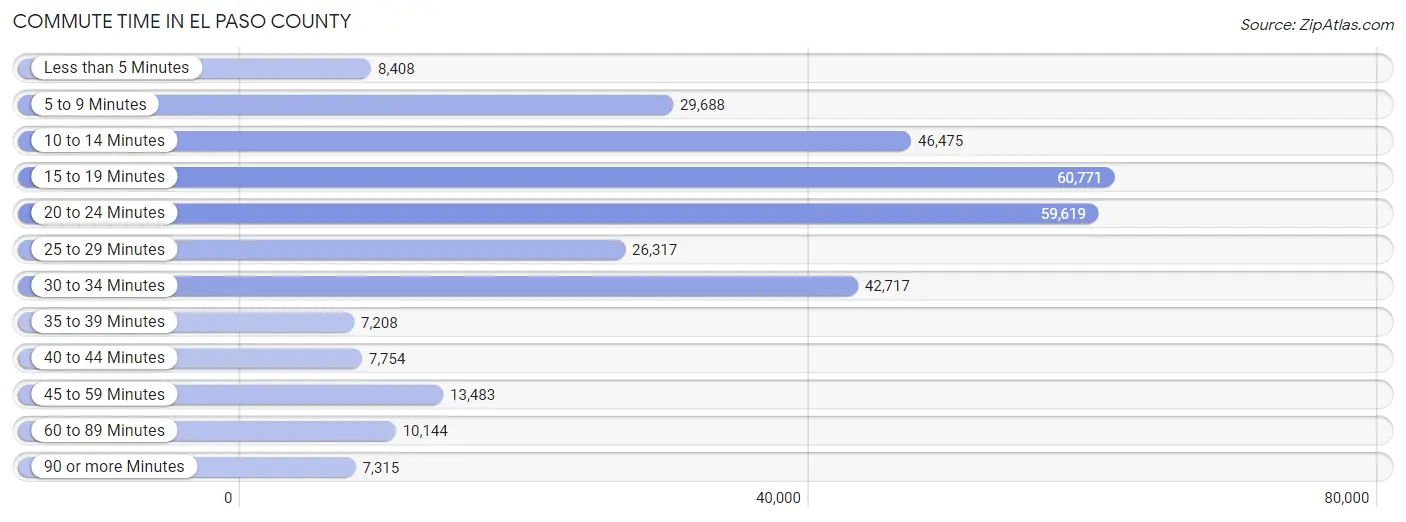
The most frequently occuring commute durations in El Paso County are 15 to 19 minutes (60,771 commuters, 19.0%), 20 to 24 minutes (59,619 commuters, 18.6%), and 10 to 14 minutes (46,475 commuters, 14.5%).
| Commute Time | # Commuters | % Commuters |
| Less than 5 Minutes | 8,408 | 2.6% |
| 5 to 9 Minutes | 29,688 | 9.3% |
| 10 to 14 Minutes | 46,475 | 14.5% |
| 15 to 19 Minutes | 60,771 | 19.0% |
| 20 to 24 Minutes | 59,619 | 18.6% |
| 25 to 29 Minutes | 26,317 | 8.2% |
| 30 to 34 Minutes | 42,717 | 13.4% |
| 35 to 39 Minutes | 7,208 | 2.2% |
| 40 to 44 Minutes | 7,754 | 2.4% |
| 45 to 59 Minutes | 13,483 | 4.2% |
| 60 to 89 Minutes | 10,144 | 3.2% |
| 90 or more Minutes | 7,315 | 2.3% |
Commute Time by Sex in El Paso County
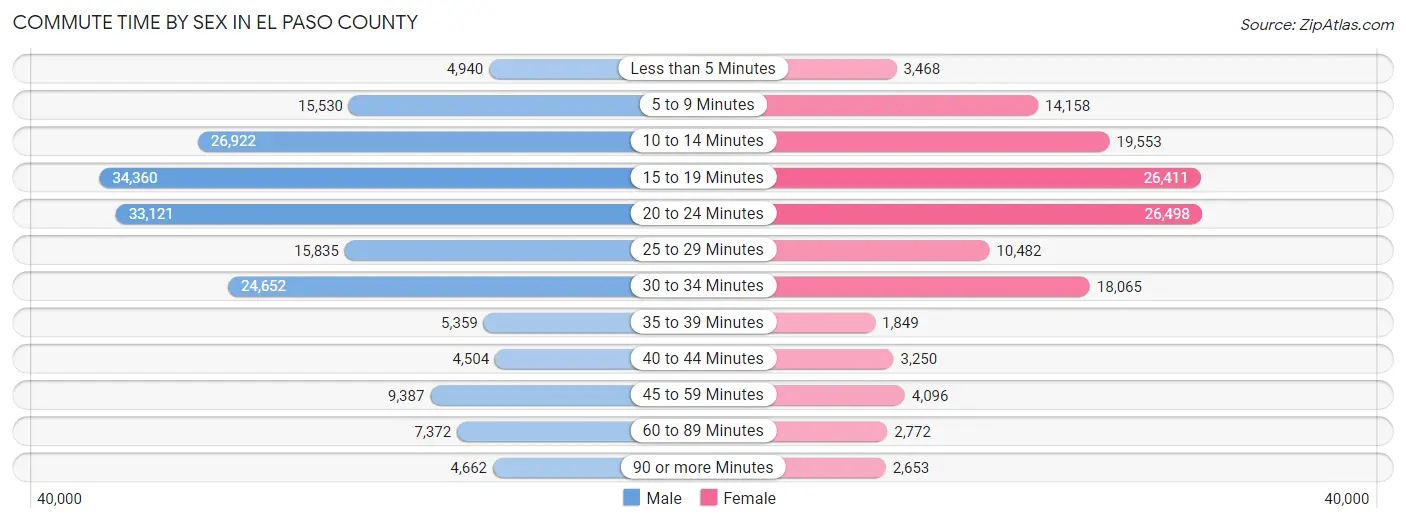
The most common commute times in El Paso County are 15 to 19 minutes (34,360 commuters, 18.4%) for males and 20 to 24 minutes (26,498 commuters, 19.9%) for females.
| Commute Time | Male | Female |
| Less than 5 Minutes | 4,940 (2.6%) | 3,468 (2.6%) |
| 5 to 9 Minutes | 15,530 (8.3%) | 14,158 (10.6%) |
| 10 to 14 Minutes | 26,922 (14.4%) | 19,553 (14.7%) |
| 15 to 19 Minutes | 34,360 (18.4%) | 26,411 (19.8%) |
| 20 to 24 Minutes | 33,121 (17.7%) | 26,498 (19.9%) |
| 25 to 29 Minutes | 15,835 (8.5%) | 10,482 (7.9%) |
| 30 to 34 Minutes | 24,652 (13.2%) | 18,065 (13.6%) |
| 35 to 39 Minutes | 5,359 (2.9%) | 1,849 (1.4%) |
| 40 to 44 Minutes | 4,504 (2.4%) | 3,250 (2.4%) |
| 45 to 59 Minutes | 9,387 (5.0%) | 4,096 (3.1%) |
| 60 to 89 Minutes | 7,372 (4.0%) | 2,772 (2.1%) |
| 90 or more Minutes | 4,662 (2.5%) | 2,653 (2.0%) |
Time of Departure to Work by Sex in El Paso County
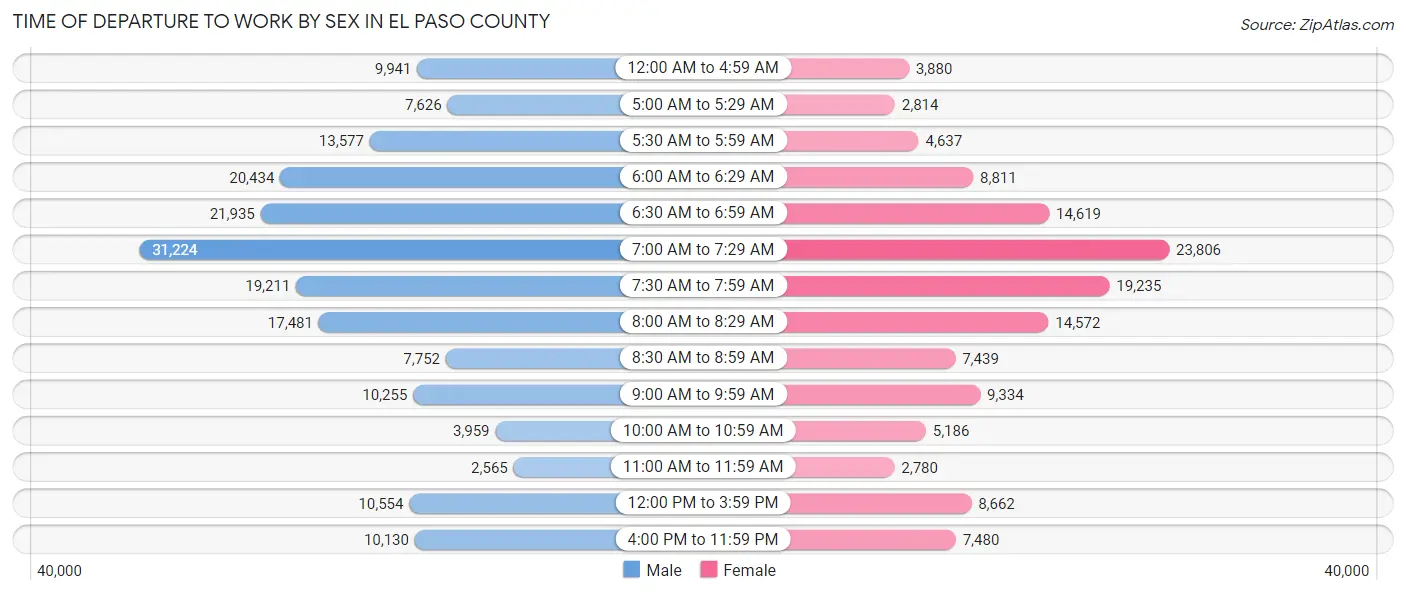
The most frequent times of departure to work in El Paso County are 7:00 AM to 7:29 AM (31,224, 16.7%) for males and 7:00 AM to 7:29 AM (23,806, 17.9%) for females.
| Time of Departure | Male | Female |
| 12:00 AM to 4:59 AM | 9,941 (5.3%) | 3,880 (2.9%) |
| 5:00 AM to 5:29 AM | 7,626 (4.1%) | 2,814 (2.1%) |
| 5:30 AM to 5:59 AM | 13,577 (7.3%) | 4,637 (3.5%) |
| 6:00 AM to 6:29 AM | 20,434 (11.0%) | 8,811 (6.6%) |
| 6:30 AM to 6:59 AM | 21,935 (11.7%) | 14,619 (11.0%) |
| 7:00 AM to 7:29 AM | 31,224 (16.7%) | 23,806 (17.9%) |
| 7:30 AM to 7:59 AM | 19,211 (10.3%) | 19,235 (14.4%) |
| 8:00 AM to 8:29 AM | 17,481 (9.4%) | 14,572 (10.9%) |
| 8:30 AM to 8:59 AM | 7,752 (4.2%) | 7,439 (5.6%) |
| 9:00 AM to 9:59 AM | 10,255 (5.5%) | 9,334 (7.0%) |
| 10:00 AM to 10:59 AM | 3,959 (2.1%) | 5,186 (3.9%) |
| 11:00 AM to 11:59 AM | 2,565 (1.4%) | 2,780 (2.1%) |
| 12:00 PM to 3:59 PM | 10,554 (5.7%) | 8,662 (6.5%) |
| 4:00 PM to 11:59 PM | 10,130 (5.4%) | 7,480 (5.6%) |
| Total | 186,644 (100.0%) | 133,255 (100.0%) |
Housing Occupancy in El Paso County
Occupancy by Ownership in El Paso County
Of the total 276,371 dwellings in El Paso County, owner-occupied units account for 183,106 (66.2%), while renter-occupied units make up 93,265 (33.8%).
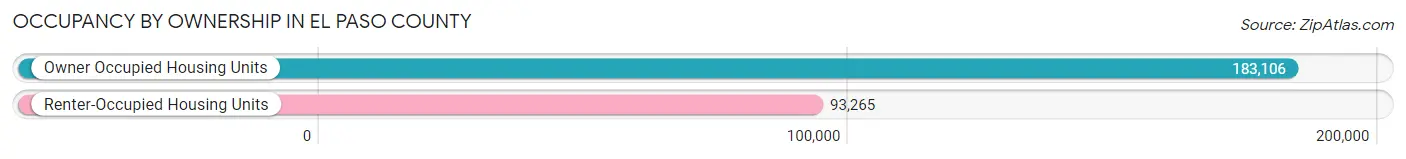
| Occupancy | # Housing Units | % Housing Units |
| Owner Occupied Housing Units | 183,106 | 66.2% |
| Renter-Occupied Housing Units | 93,265 | 33.8% |
| Total Occupied Housing Units | 276,371 | 100.0% |
Occupancy by Household Size in El Paso County
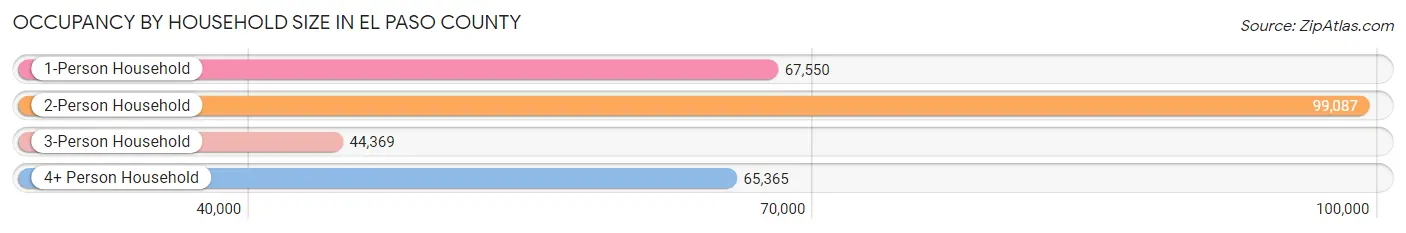
| Household Size | # Housing Units | % Housing Units |
| 1-Person Household | 67,550 | 24.4% |
| 2-Person Household | 99,087 | 35.8% |
| 3-Person Household | 44,369 | 16.1% |
| 4+ Person Household | 65,365 | 23.6% |
| Total Housing Units | 276,371 | 100.0% |
Occupancy by Ownership by Household Size in El Paso County
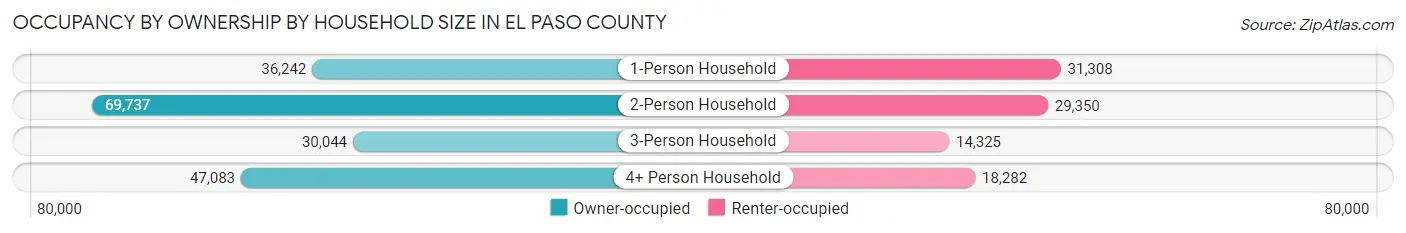
| Household Size | Owner-occupied | Renter-occupied |
| 1-Person Household | 36,242 (53.6%) | 31,308 (46.4%) |
| 2-Person Household | 69,737 (70.4%) | 29,350 (29.6%) |
| 3-Person Household | 30,044 (67.7%) | 14,325 (32.3%) |
| 4+ Person Household | 47,083 (72.0%) | 18,282 (28.0%) |
| Total Housing Units | 183,106 (66.2%) | 93,265 (33.8%) |
Occupancy by Educational Attainment in El Paso County
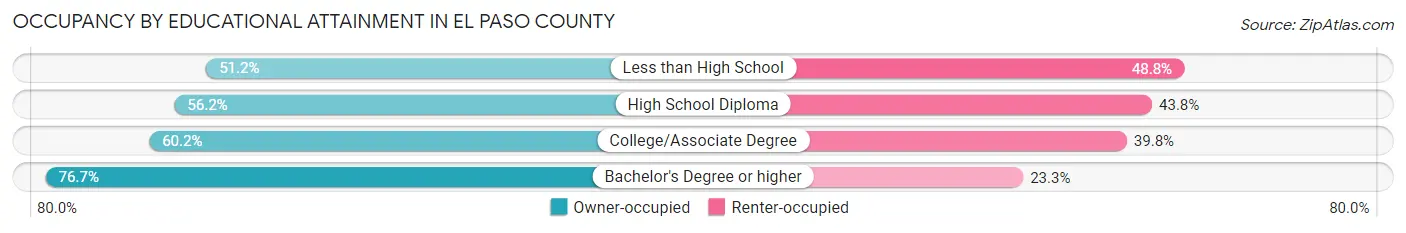
| Household Size | Owner-occupied | Renter-occupied |
| Less than High School | 5,560 (51.2%) | 5,302 (48.8%) |
| High School Diploma | 26,637 (56.2%) | 20,734 (43.8%) |
| College/Associate Degree | 59,852 (60.2%) | 39,523 (39.8%) |
| Bachelor's Degree or higher | 91,057 (76.7%) | 27,706 (23.3%) |
Occupancy by Age of Householder in El Paso County
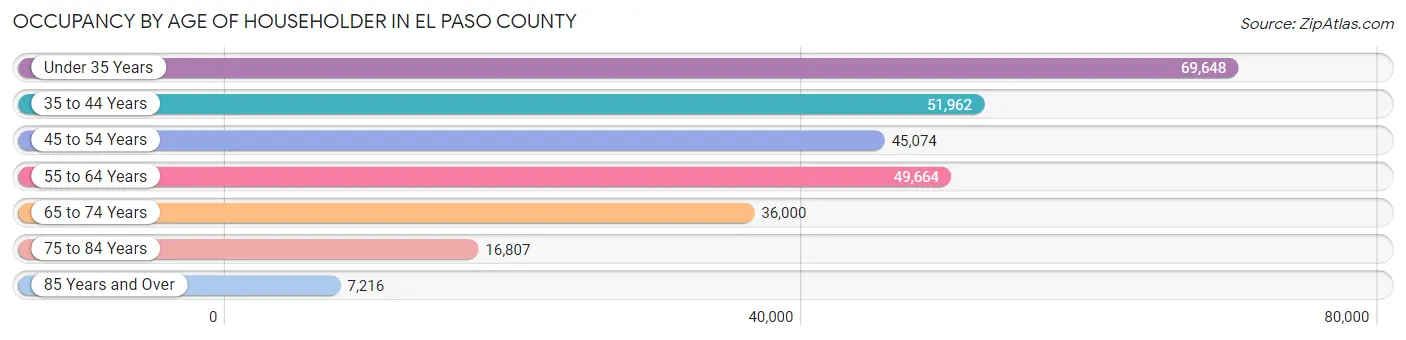
| Age Bracket | # Households | % Households |
| Under 35 Years | 69,648 | 25.2% |
| 35 to 44 Years | 51,962 | 18.8% |
| 45 to 54 Years | 45,074 | 16.3% |
| 55 to 64 Years | 49,664 | 18.0% |
| 65 to 74 Years | 36,000 | 13.0% |
| 75 to 84 Years | 16,807 | 6.1% |
| 85 Years and Over | 7,216 | 2.6% |
| Total | 276,371 | 100.0% |
Housing Finances in El Paso County
Median Income by Occupancy in El Paso County
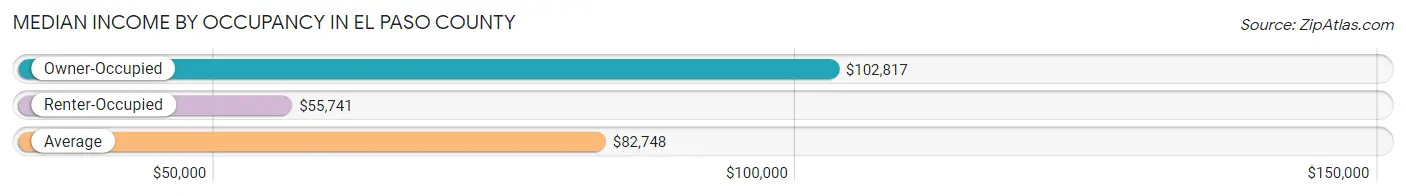
| Occupancy Type | # Households | Median Income |
| Owner-Occupied | 183,106 (66.2%) | $102,817 |
| Renter-Occupied | 93,265 (33.8%) | $55,741 |
| Average | 276,371 (100.0%) | $82,748 |
Occupancy by Householder Income Bracket in El Paso County

| Income Bracket | Owner-occupied | Renter-occupied |
| Less than $5,000 | 3,356 (1.8%) | 3,500 (3.7%) |
| $5,000 to $9,999 | 1,481 (0.8%) | 1,795 (1.9%) |
| $10,000 to $14,999 | 2,220 (1.2%) | 4,519 (4.9%) |
| $15,000 to $19,999 | 3,451 (1.9%) | 3,545 (3.8%) |
| $20,000 to $24,999 | 3,031 (1.7%) | 4,447 (4.8%) |
| $25,000 to $34,999 | 8,215 (4.5%) | 9,304 (10.0%) |
| $35,000 to $49,999 | 13,465 (7.3%) | 14,203 (15.2%) |
| $50,000 to $74,999 | 28,163 (15.4%) | 20,166 (21.6%) |
| $75,000 to $99,999 | 25,608 (14.0%) | 13,517 (14.5%) |
| $100,000 to $149,999 | 41,799 (22.8%) | 11,981 (12.9%) |
| $150,000 or more | 52,317 (28.6%) | 6,288 (6.7%) |
| Total | 183,106 (100.0%) | 93,265 (100.0%) |
Monthly Housing Cost Tiers in El Paso County
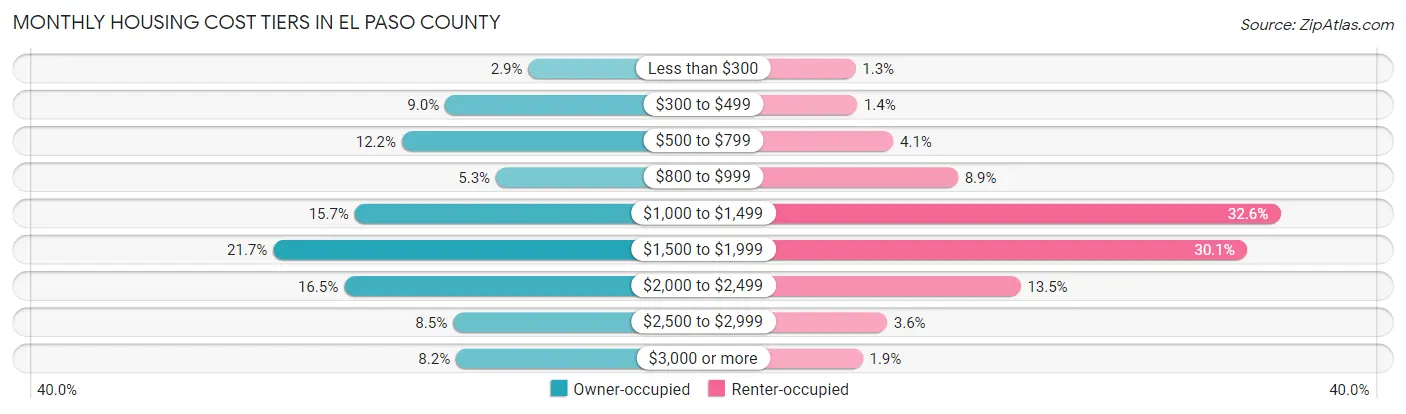
| Monthly Cost | Owner-occupied | Renter-occupied |
| Less than $300 | 5,305 (2.9%) | 1,229 (1.3%) |
| $300 to $499 | 16,553 (9.0%) | 1,341 (1.4%) |
| $500 to $799 | 22,378 (12.2%) | 3,821 (4.1%) |
| $800 to $999 | 9,681 (5.3%) | 8,260 (8.9%) |
| $1,000 to $1,499 | 28,737 (15.7%) | 30,406 (32.6%) |
| $1,500 to $1,999 | 39,730 (21.7%) | 28,103 (30.1%) |
| $2,000 to $2,499 | 30,177 (16.5%) | 12,571 (13.5%) |
| $2,500 to $2,999 | 15,476 (8.5%) | 3,396 (3.6%) |
| $3,000 or more | 15,069 (8.2%) | 1,722 (1.8%) |
| Total | 183,106 (100.0%) | 93,265 (100.0%) |
Physical Housing Characteristics in El Paso County
Housing Structures in El Paso County
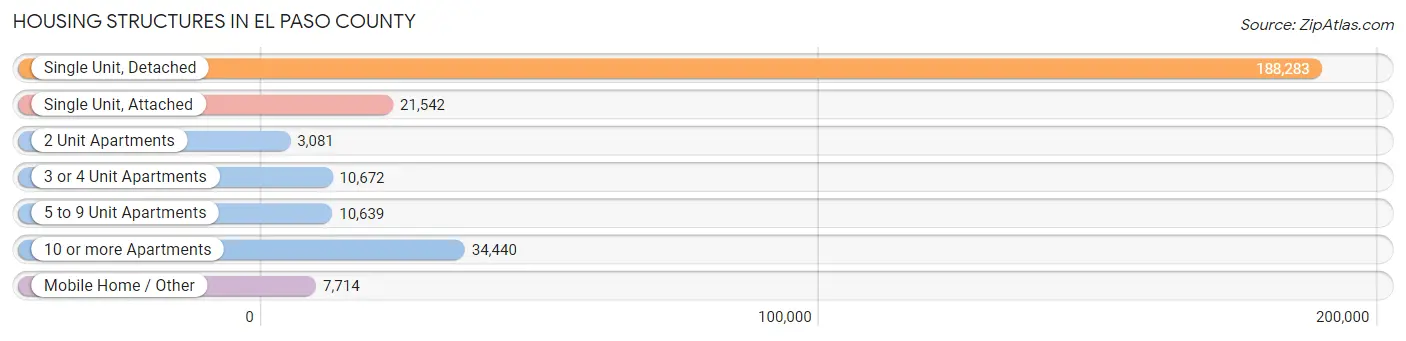
| Structure Type | # Housing Units | % Housing Units |
| Single Unit, Detached | 188,283 | 68.1% |
| Single Unit, Attached | 21,542 | 7.8% |
| 2 Unit Apartments | 3,081 | 1.1% |
| 3 or 4 Unit Apartments | 10,672 | 3.9% |
| 5 to 9 Unit Apartments | 10,639 | 3.8% |
| 10 or more Apartments | 34,440 | 12.5% |
| Mobile Home / Other | 7,714 | 2.8% |
| Total | 276,371 | 100.0% |
Housing Structures by Occupancy in El Paso County
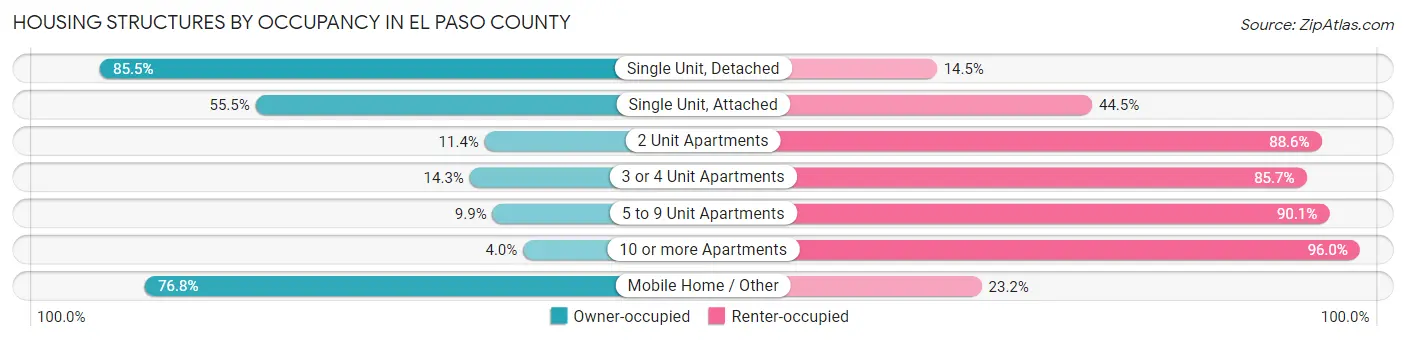
| Structure Type | Owner-occupied | Renter-occupied |
| Single Unit, Detached | 160,898 (85.5%) | 27,385 (14.5%) |
| Single Unit, Attached | 11,965 (55.5%) | 9,577 (44.5%) |
| 2 Unit Apartments | 352 (11.4%) | 2,729 (88.6%) |
| 3 or 4 Unit Apartments | 1,527 (14.3%) | 9,145 (85.7%) |
| 5 to 9 Unit Apartments | 1,054 (9.9%) | 9,585 (90.1%) |
| 10 or more Apartments | 1,385 (4.0%) | 33,055 (96.0%) |
| Mobile Home / Other | 5,925 (76.8%) | 1,789 (23.2%) |
| Total | 183,106 (66.2%) | 93,265 (33.8%) |
Housing Structures by Number of Rooms in El Paso County
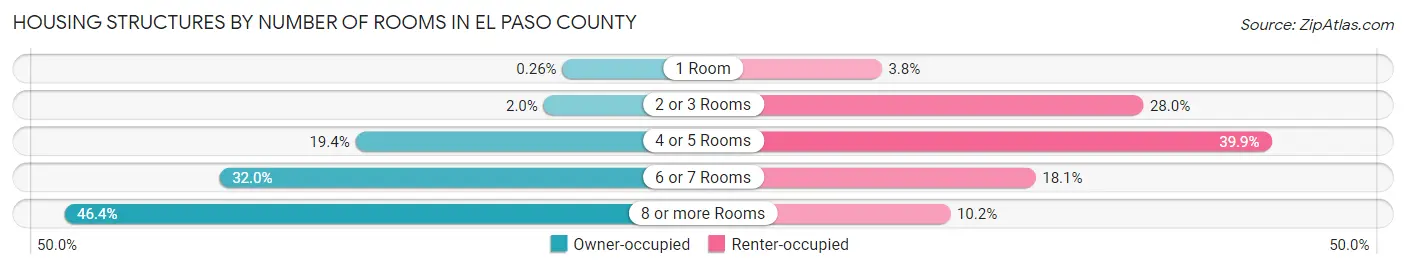
| Number of Rooms | Owner-occupied | Renter-occupied |
| 1 Room | 469 (0.3%) | 3,580 (3.8%) |
| 2 or 3 Rooms | 3,660 (2.0%) | 26,139 (28.0%) |
| 4 or 5 Rooms | 35,526 (19.4%) | 37,204 (39.9%) |
| 6 or 7 Rooms | 58,590 (32.0%) | 16,849 (18.1%) |
| 8 or more Rooms | 84,861 (46.4%) | 9,493 (10.2%) |
| Total | 183,106 (100.0%) | 93,265 (100.0%) |
Housing Structure by Heating Type in El Paso County
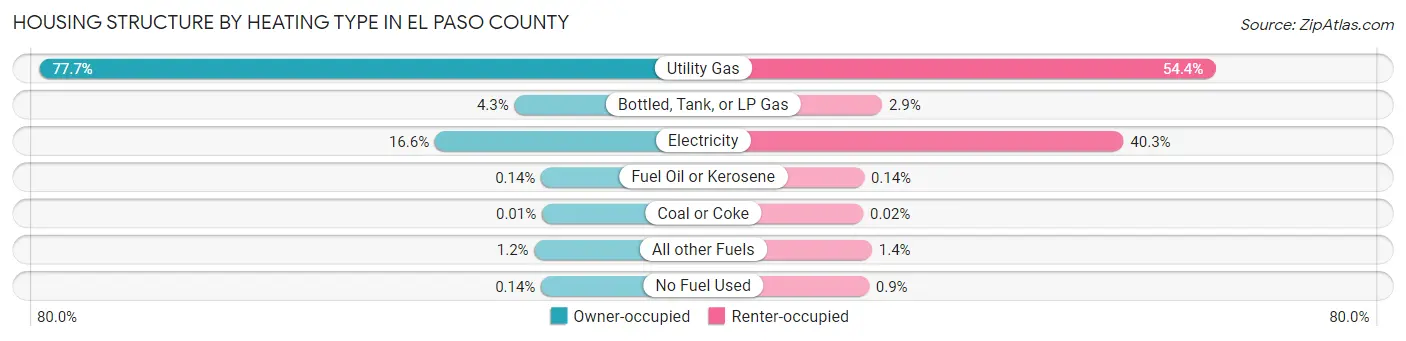
| Heating Type | Owner-occupied | Renter-occupied |
| Utility Gas | 142,281 (77.7%) | 50,752 (54.4%) |
| Bottled, Tank, or LP Gas | 7,801 (4.3%) | 2,725 (2.9%) |
| Electricity | 30,319 (16.6%) | 37,537 (40.3%) |
| Fuel Oil or Kerosene | 259 (0.1%) | 129 (0.1%) |
| Coal or Coke | 22 (0.0%) | 14 (0.0%) |
| All other Fuels | 2,171 (1.2%) | 1,264 (1.4%) |
| No Fuel Used | 253 (0.1%) | 844 (0.9%) |
| Total | 183,106 (100.0%) | 93,265 (100.0%) |
Household Vehicle Usage in El Paso County
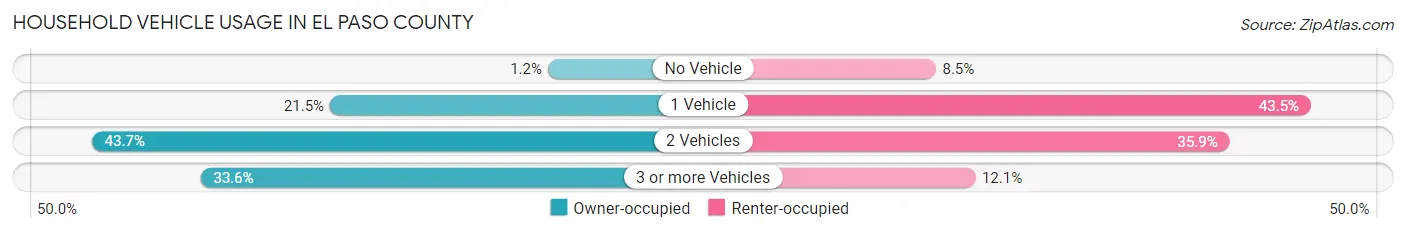
| Vehicles per Household | Owner-occupied | Renter-occupied |
| No Vehicle | 2,123 (1.2%) | 7,890 (8.5%) |
| 1 Vehicle | 39,376 (21.5%) | 40,568 (43.5%) |
| 2 Vehicles | 80,088 (43.7%) | 33,480 (35.9%) |
| 3 or more Vehicles | 61,519 (33.6%) | 11,327 (12.1%) |
| Total | 183,106 (100.0%) | 93,265 (100.0%) |
Real Estate & Mortgages in El Paso County
Real Estate and Mortgage Overview in El Paso County
| Characteristic | Without Mortgage | With Mortgage |
| Housing Units | 50,040 | 133,066 |
| Median Property Value | $379,000 | $393,700 |
| Median Household Income | $76,536 | $42,004 |
| Monthly Housing Costs | $548 | $14,957 |
| Real Estate Taxes | $1,465 | $2,783 |
Property Value by Mortgage Status in El Paso County
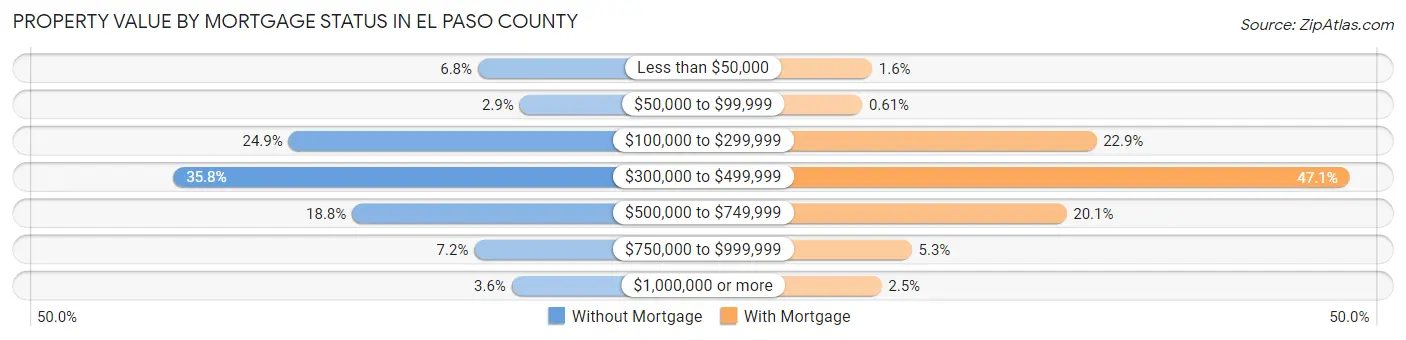
| Property Value | Without Mortgage | With Mortgage |
| Less than $50,000 | 3,419 (6.8%) | 2,065 (1.5%) |
| $50,000 to $99,999 | 1,429 (2.9%) | 811 (0.6%) |
| $100,000 to $299,999 | 12,442 (24.9%) | 30,504 (22.9%) |
| $300,000 to $499,999 | 17,936 (35.8%) | 62,606 (47.0%) |
| $500,000 to $749,999 | 9,415 (18.8%) | 26,711 (20.1%) |
| $750,000 to $999,999 | 3,594 (7.2%) | 7,100 (5.3%) |
| $1,000,000 or more | 1,805 (3.6%) | 3,269 (2.5%) |
| Total | 50,040 (100.0%) | 133,066 (100.0%) |
Household Income by Mortgage Status in El Paso County
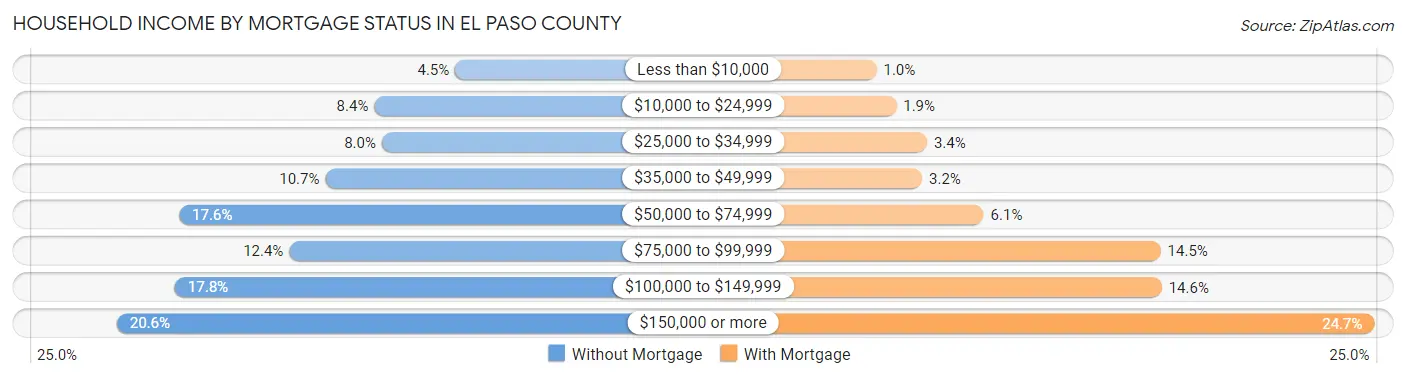
| Household Income | Without Mortgage | With Mortgage |
| Less than $10,000 | 2,251 (4.5%) | 1,327 (1.0%) |
| $10,000 to $24,999 | 4,177 (8.4%) | 2,586 (1.9%) |
| $25,000 to $34,999 | 3,997 (8.0%) | 4,525 (3.4%) |
| $35,000 to $49,999 | 5,343 (10.7%) | 4,218 (3.2%) |
| $50,000 to $74,999 | 8,825 (17.6%) | 8,122 (6.1%) |
| $75,000 to $99,999 | 6,207 (12.4%) | 19,338 (14.5%) |
| $100,000 to $149,999 | 8,927 (17.8%) | 19,401 (14.6%) |
| $150,000 or more | 10,313 (20.6%) | 32,872 (24.7%) |
| Total | 50,040 (100.0%) | 133,066 (100.0%) |
Property Value to Household Income Ratio in El Paso County
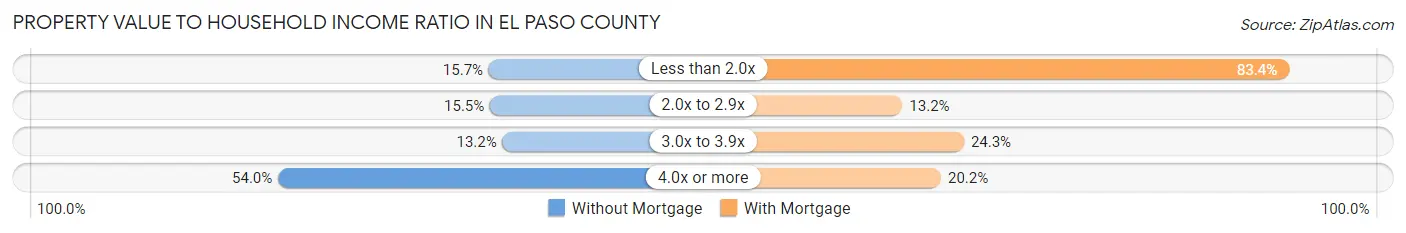
| Value-to-Income Ratio | Without Mortgage | With Mortgage |
| Less than 2.0x | 7,845 (15.7%) | 110,964 (83.4%) |
| 2.0x to 2.9x | 7,738 (15.5%) | 17,508 (13.2%) |
| 3.0x to 3.9x | 6,605 (13.2%) | 32,384 (24.3%) |
| 4.0x or more | 27,001 (54.0%) | 26,864 (20.2%) |
| Total | 50,040 (100.0%) | 133,066 (100.0%) |
Real Estate Taxes by Mortgage Status in El Paso County
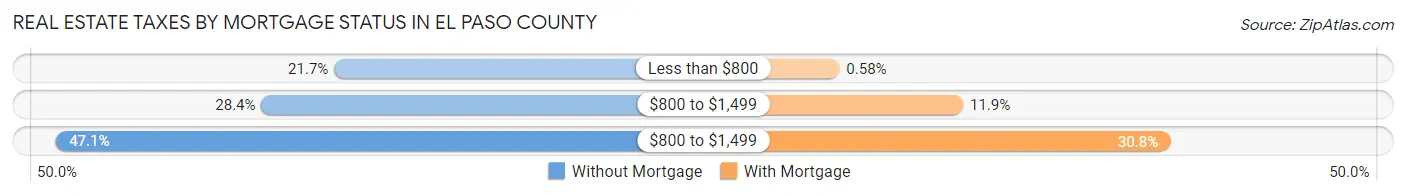
| Property Taxes | Without Mortgage | With Mortgage |
| Less than $800 | 10,875 (21.7%) | 778 (0.6%) |
| $800 to $1,499 | 14,201 (28.4%) | 15,797 (11.9%) |
| $800 to $1,499 | 23,574 (47.1%) | 40,955 (30.8%) |
| Total | 50,040 (100.0%) | 133,066 (100.0%) |
Health & Disability in El Paso County
Health Insurance Coverage by Age in El Paso County
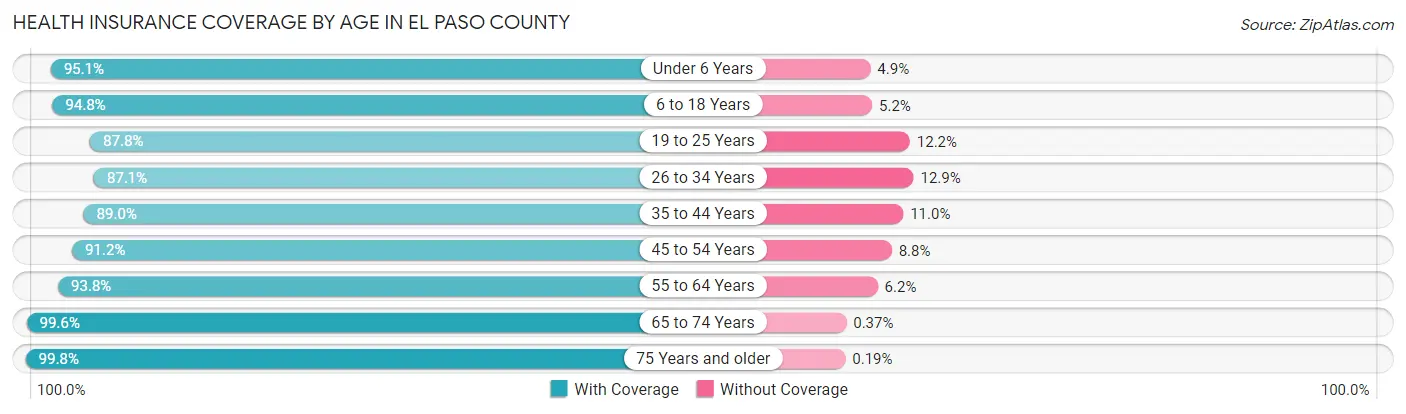
| Age Bracket | With Coverage | Without Coverage |
| Under 6 Years | 52,217 (95.1%) | 2,674 (4.9%) |
| 6 to 18 Years | 119,424 (94.8%) | 6,536 (5.2%) |
| 19 to 25 Years | 58,719 (87.8%) | 8,184 (12.2%) |
| 26 to 34 Years | 81,780 (87.1%) | 12,129 (12.9%) |
| 35 to 44 Years | 81,077 (89.0%) | 10,012 (11.0%) |
| 45 to 54 Years | 73,923 (91.2%) | 7,172 (8.8%) |
| 55 to 64 Years | 78,720 (93.8%) | 5,225 (6.2%) |
| 65 to 74 Years | 59,363 (99.6%) | 219 (0.4%) |
| 75 Years and older | 36,069 (99.8%) | 68 (0.2%) |
| Total | 641,292 (92.5%) | 52,219 (7.5%) |
Health Insurance Coverage by Citizenship Status in El Paso County
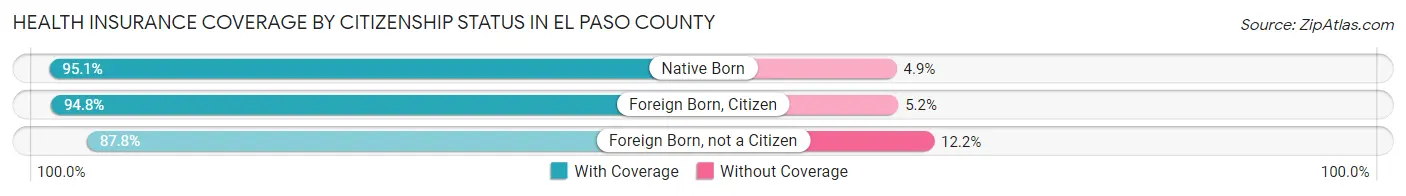
| Citizenship Status | With Coverage | Without Coverage |
| Native Born | 52,217 (95.1%) | 2,674 (4.9%) |
| Foreign Born, Citizen | 119,424 (94.8%) | 6,536 (5.2%) |
| Foreign Born, not a Citizen | 58,719 (87.8%) | 8,184 (12.2%) |
Health Insurance Coverage by Household Income in El Paso County
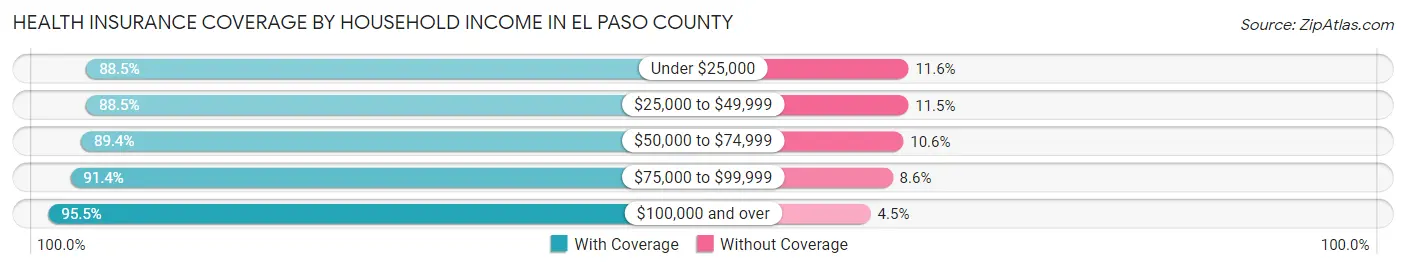
| Household Income | With Coverage | Without Coverage |
| Under $25,000 | 47,370 (88.4%) | 6,183 (11.6%) |
| $25,000 to $49,999 | 80,809 (88.5%) | 10,518 (11.5%) |
| $50,000 to $74,999 | 96,663 (89.4%) | 11,434 (10.6%) |
| $75,000 to $99,999 | 91,064 (91.4%) | 8,558 (8.6%) |
| $100,000 and over | 320,377 (95.5%) | 14,983 (4.5%) |
Public vs Private Health Insurance Coverage by Age in El Paso County
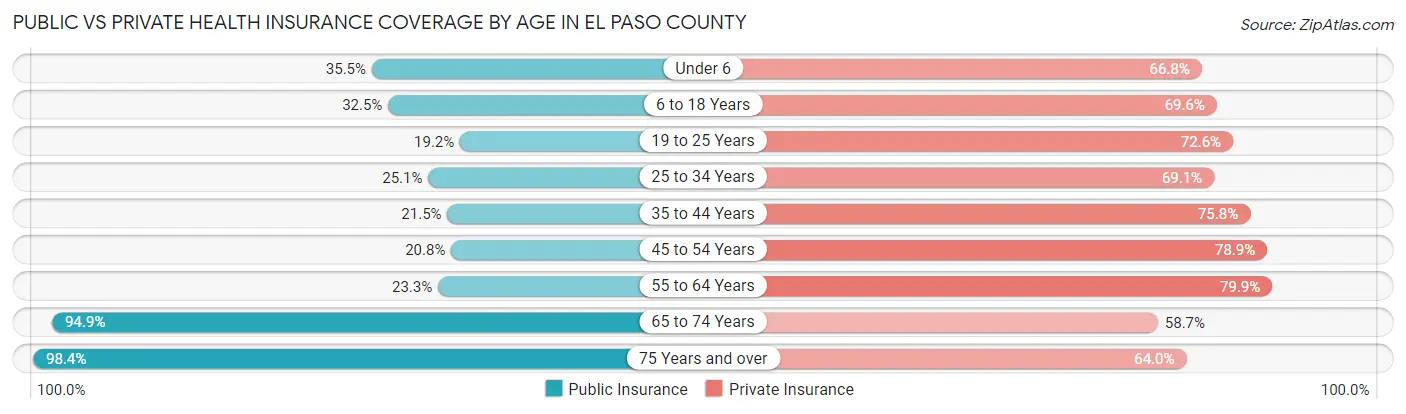
| Age Bracket | Public Insurance | Private Insurance |
| Under 6 | 19,510 (35.5%) | 36,663 (66.8%) |
| 6 to 18 Years | 40,945 (32.5%) | 87,648 (69.6%) |
| 19 to 25 Years | 12,821 (19.2%) | 48,568 (72.6%) |
| 25 to 34 Years | 23,547 (25.1%) | 64,864 (69.1%) |
| 35 to 44 Years | 19,606 (21.5%) | 69,011 (75.8%) |
| 45 to 54 Years | 16,879 (20.8%) | 64,009 (78.9%) |
| 55 to 64 Years | 19,529 (23.3%) | 67,050 (79.9%) |
| 65 to 74 Years | 56,552 (94.9%) | 34,956 (58.7%) |
| 75 Years and over | 35,565 (98.4%) | 23,108 (63.9%) |
| Total | 244,954 (35.3%) | 495,877 (71.5%) |
Disability Status by Sex by Age in El Paso County
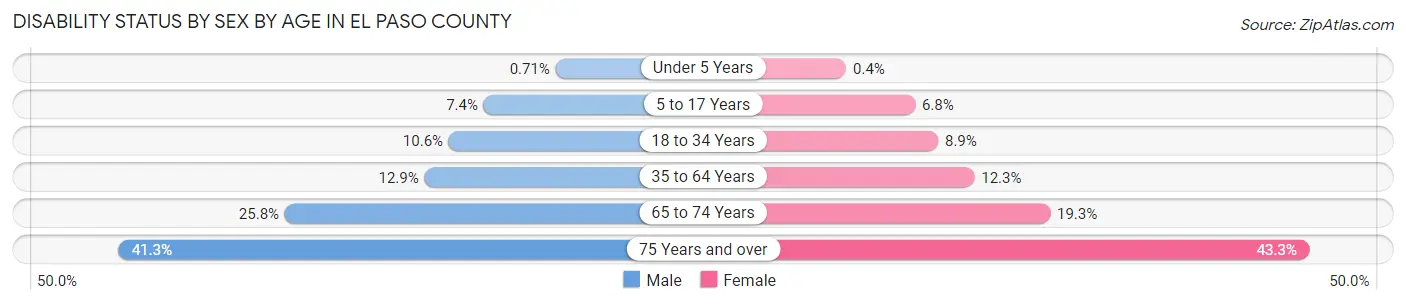
| Age Bracket | Male | Female |
| Under 5 Years | 168 (0.7%) | 90 (0.4%) |
| 5 to 17 Years | 4,747 (7.4%) | 4,163 (6.8%) |
| 18 to 34 Years | 8,950 (10.6%) | 7,652 (8.9%) |
| 35 to 64 Years | 16,210 (12.9%) | 16,023 (12.3%) |
| 65 to 74 Years | 7,245 (25.8%) | 6,098 (19.3%) |
| 75 Years and over | 6,251 (41.3%) | 9,093 (43.3%) |
Disability Class by Sex by Age in El Paso County
Disability Class: Hearing Difficulty
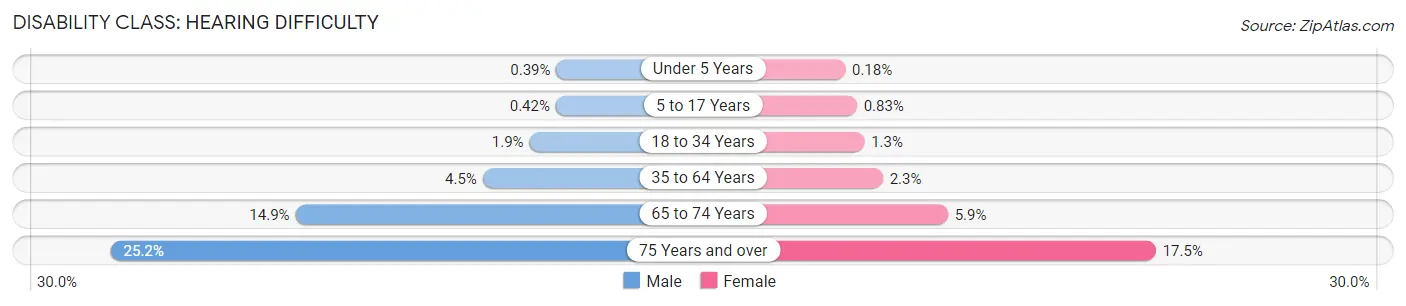
| Age Bracket | Male | Female |
| Under 5 Years | 92 (0.4%) | 40 (0.2%) |
| 5 to 17 Years | 270 (0.4%) | 511 (0.8%) |
| 18 to 34 Years | 1,595 (1.9%) | 1,070 (1.3%) |
| 35 to 64 Years | 5,653 (4.5%) | 2,967 (2.3%) |
| 65 to 74 Years | 4,183 (14.9%) | 1,862 (5.9%) |
| 75 Years and over | 3,820 (25.2%) | 3,669 (17.5%) |
Disability Class: Vision Difficulty
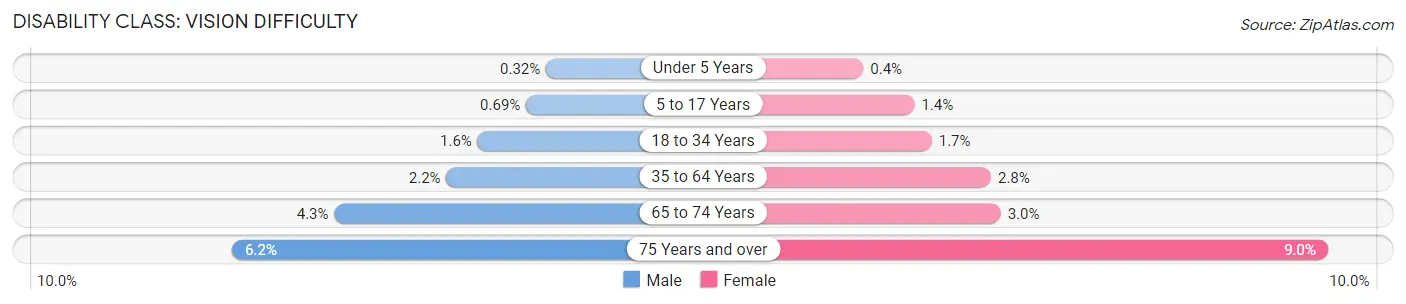
| Age Bracket | Male | Female |
| Under 5 Years | 76 (0.3%) | 90 (0.4%) |
| 5 to 17 Years | 444 (0.7%) | 829 (1.3%) |
| 18 to 34 Years | 1,337 (1.6%) | 1,430 (1.7%) |
| 35 to 64 Years | 2,731 (2.2%) | 3,610 (2.8%) |
| 65 to 74 Years | 1,192 (4.3%) | 931 (2.9%) |
| 75 Years and over | 931 (6.1%) | 1,893 (9.0%) |
Disability Class: Cognitive Difficulty
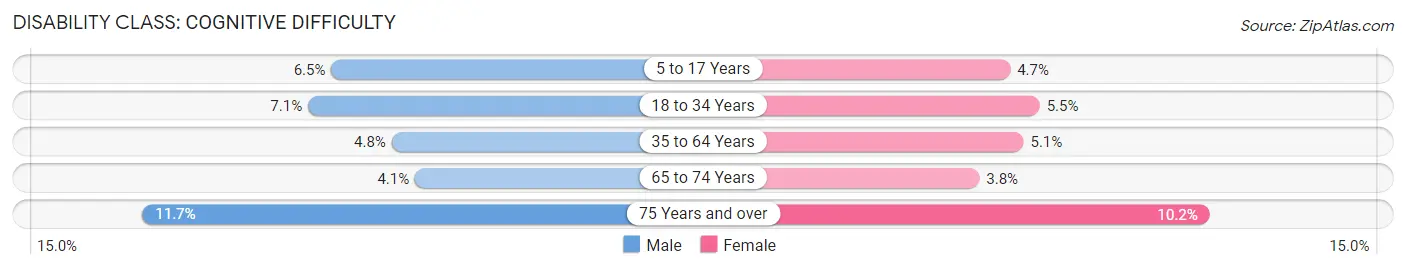
| Age Bracket | Male | Female |
| 5 to 17 Years | 4,158 (6.5%) | 2,877 (4.7%) |
| 18 to 34 Years | 5,994 (7.1%) | 4,724 (5.5%) |
| 35 to 64 Years | 6,011 (4.8%) | 6,594 (5.1%) |
| 65 to 74 Years | 1,158 (4.1%) | 1,207 (3.8%) |
| 75 Years and over | 1,775 (11.7%) | 2,149 (10.2%) |
Disability Class: Ambulatory Difficulty
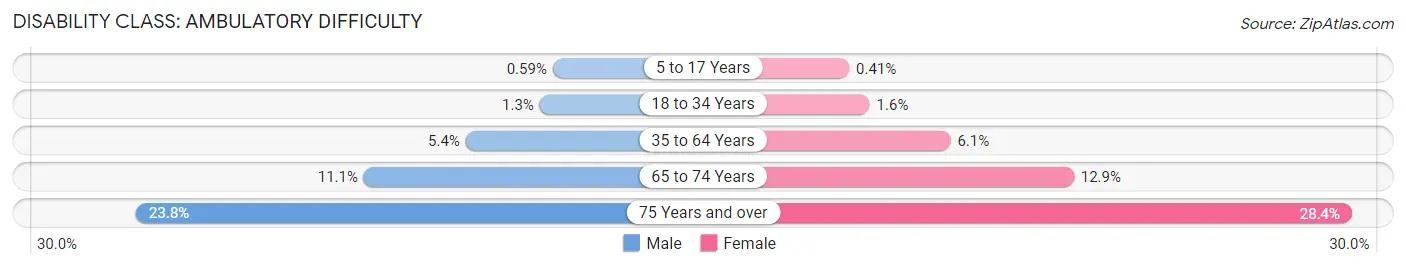
| Age Bracket | Male | Female |
| 5 to 17 Years | 377 (0.6%) | 252 (0.4%) |
| 18 to 34 Years | 1,111 (1.3%) | 1,328 (1.5%) |
| 35 to 64 Years | 6,841 (5.4%) | 7,875 (6.0%) |
| 65 to 74 Years | 3,115 (11.1%) | 4,076 (12.9%) |
| 75 Years and over | 3,606 (23.8%) | 5,960 (28.4%) |
Disability Class: Self-Care Difficulty
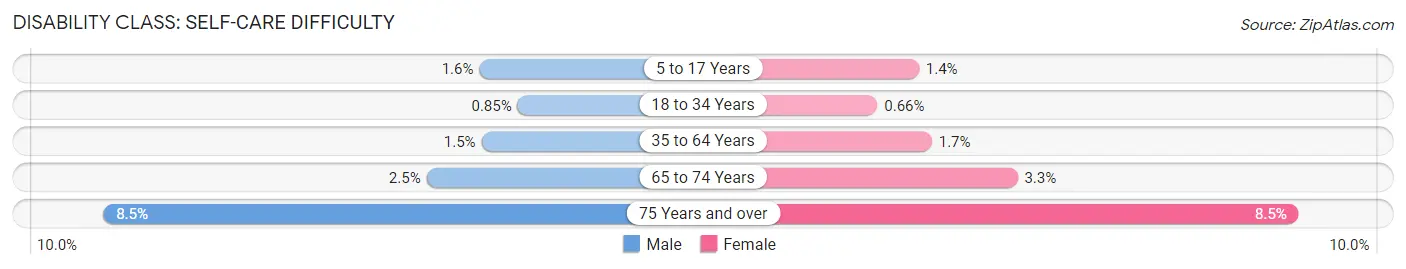
| Age Bracket | Male | Female |
| 5 to 17 Years | 1,005 (1.6%) | 880 (1.4%) |
| 18 to 34 Years | 716 (0.9%) | 565 (0.7%) |
| 35 to 64 Years | 1,908 (1.5%) | 2,176 (1.7%) |
| 65 to 74 Years | 713 (2.5%) | 1,028 (3.3%) |
| 75 Years and over | 1,294 (8.5%) | 1,780 (8.5%) |
Technology Access in El Paso County
Computing Device Access in El Paso County
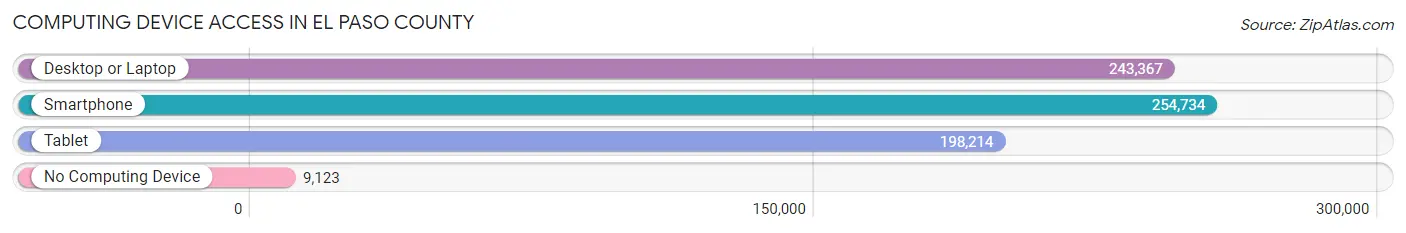
| Device Type | # Households | % Households |
| Desktop or Laptop | 243,367 | 88.1% |
| Smartphone | 254,734 | 92.2% |
| Tablet | 198,214 | 71.7% |
| No Computing Device | 9,123 | 3.3% |
| Total | 276,371 | 100.0% |
Internet Access in El Paso County
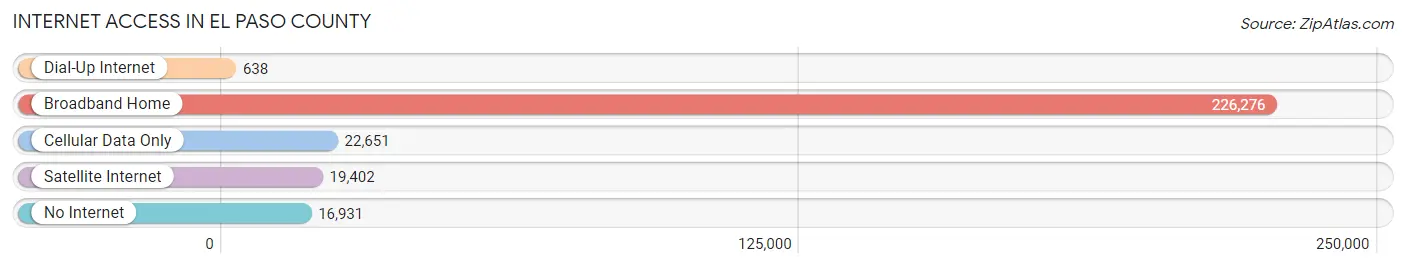
| Internet Type | # Households | % Households |
| Dial-Up Internet | 638 | 0.2% |
| Broadband Home | 226,276 | 81.9% |
| Cellular Data Only | 22,651 | 8.2% |
| Satellite Internet | 19,402 | 7.0% |
| No Internet | 16,931 | 6.1% |
| Total | 276,371 | 100.0% |
El Paso County Summary
El Paso County, Colorado is located in the south-central part of the state and is the most populous county in Colorado. It is bordered by the counties of Teller, Elbert, Douglas, Arapahoe, and Pueblo. The county seat is Colorado Springs, the second most populous city in the state. El Paso County covers an area of 2,130 square miles and has a population of 699,232 as of the 2020 census.
History
El Paso County was established in 1861 as part of the Colorado Territory. It was named after the Spanish name for the Rio Grande, El Paso del Norte. The county was originally part of the larger El Paso County, which included parts of present-day New Mexico and Texas. In 1873, El Paso County was split into two separate counties, El Paso County, Colorado and El Paso County, Texas.
The county was home to several Native American tribes, including the Ute, Apache, and Comanche. The first European settlers arrived in the area in the late 1700s, and the county was officially established in 1861.
The county was home to several important events in Colorado history. In 1859, the first gold discovery in the state was made in El Paso County. The county was also the site of the Battle of Glorieta Pass during the Civil War, which was a decisive victory for the Union.
Geography
El Paso County is located in the south-central part of Colorado and is bordered by the counties of Teller, Elbert, Douglas, Arapahoe, and Pueblo. The county covers an area of 2,130 square miles and has an elevation of 6,000 feet.
The county is located in the Rocky Mountains and is home to several mountain ranges, including the Sangre de Cristo Mountains, the Front Range, and the Rampart Range. The county is also home to several rivers, including the Arkansas River, the South Platte River, and the Rio Grande.
The county is home to several parks and recreation areas, including Garden of the Gods, Cheyenne Mountain State Park, and the Pikes Peak National Forest.
Economy
El Paso County has a diverse economy that is driven by the military, tourism, and technology. The county is home to several military installations, including Fort Carson, Peterson Air Force Base, and the United States Air Force Academy.
The county is also home to several major tourist attractions, including Garden of the Gods, Pikes Peak, and the United States Air Force Academy. The county is also home to several technology companies, including Hewlett Packard, Lockheed Martin, and Oracle.
Demographics
As of the 2020 census, El Paso County had a population of 699,232. The population is made up of a diverse mix of ethnicities, including White (77.2%), Hispanic or Latino (17.2%), Black or African American (3.2%), Asian (2.2%), and Native American (0.7%).
The median household income in El Paso County is $63,945, and the median home value is $269,400. The county has a poverty rate of 11.2%, and the unemployment rate is 4.2%.
El Paso County is home to several major cities, including Colorado Springs, Fountain, and Manitou Springs. The county is also home to several smaller towns, including Monument, Palmer Lake, and Woodland Park.
Common Questions
What is the Total Population of El Paso County?
Total Population of El Paso County is 730,323.
What is the Total Male Population of El Paso County?
Total Male Population of El Paso County is 372,145.
What is the Total Female Population of El Paso County?
Total Female Population of El Paso County is 358,178.
What is the Ratio of Males per 100 Females in El Paso County?
There are 103.90 Males per 100 Females in El Paso County.
What is the Ratio of Females per 100 Males in El Paso County?
There are 96.25 Females per 100 Males in El Paso County.
What is the Median Population Age in El Paso County?
Median Population Age in El Paso County is 34.7 Years.
What is the Average Family Size in El Paso County
Average Family Size in El Paso County is 3.1 People.
What is the Average Household Size in El Paso County
Average Household Size in El Paso County is 2.6 People.
What is Per Capita Income in El Paso County?
Per Capita income in El Paso County is $41,444.
What is the Median Family Income in El Paso County?
Median Family Income in El Paso County is $98,645.
What is the Median Household income in El Paso County?
Median Household Income in El Paso County is $82,748.
What is Income or Wage Gap in El Paso County?
Income or Wage Gap in El Paso County is 28.3%.
Women in El Paso County earn 71.7 cents for every dollar earned by a man.
What is Family Income Deficit in El Paso County?
Family Income Deficit in El Paso County is $11,941.
Families that are below poverty line in El Paso County earn $11,941 less on average than the poverty threshold level.
What is Inequality or Gini Index in El Paso County?
Inequality or Gini Index in El Paso County is 0.43.
How Large is the Labor Force in El Paso County?
There are 395,919 People in the Labor Forcein in El Paso County.
What is the Percentage of People in the Labor Force in El Paso County?
68.6% of People are in the Labor Force in El Paso County.
What is the Unemployment Rate in El Paso County?
Unemployment Rate in El Paso County is 5.7%.