Eagle County, CO
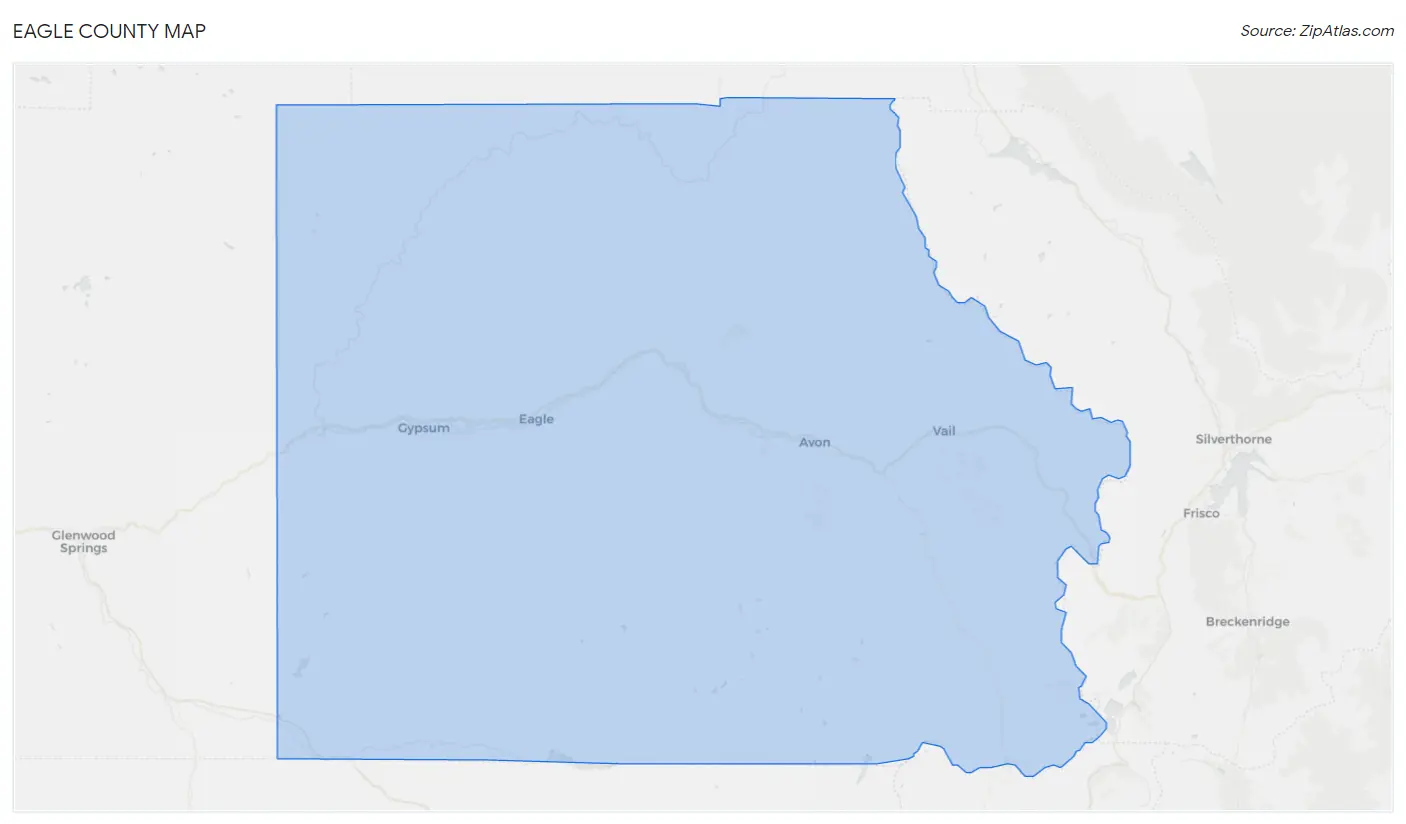
Eagle County Map
Eagle County Overview
55,650
TOTAL POPULATION
29,968
MALE POPULATION
25,682
FEMALE POPULATION
116.69
MALES / 100 FEMALES
85.70
FEMALES / 100 MALES
38.3
MEDIAN AGE
3.2
AVG FAMILY SIZE
2.8
AVG HOUSEHOLD SIZE
$55,007
PER CAPITA INCOME
$114,344
AVG FAMILY INCOME
$98,887
AVG HOUSEHOLD INCOME
17.2%
WAGE / INCOME GAP [ % ]
82.8¢/ $1
WAGE / INCOME GAP [ $ ]
0.49
INEQUALITY / GINI INDEX
33,687
LABOR FORCE [ PEOPLE ]
73.9%
PERCENT IN LABOR FORCE
4.4%
UNEMPLOYMENT RATE
Eagle County Area Codes
Race in Eagle County
The most populous races in Eagle County are White / Caucasian (43,224 | 77.7%), Hispanic or Latino (16,382 | 29.4%), and Two or more Races (8,866 | 15.9%).
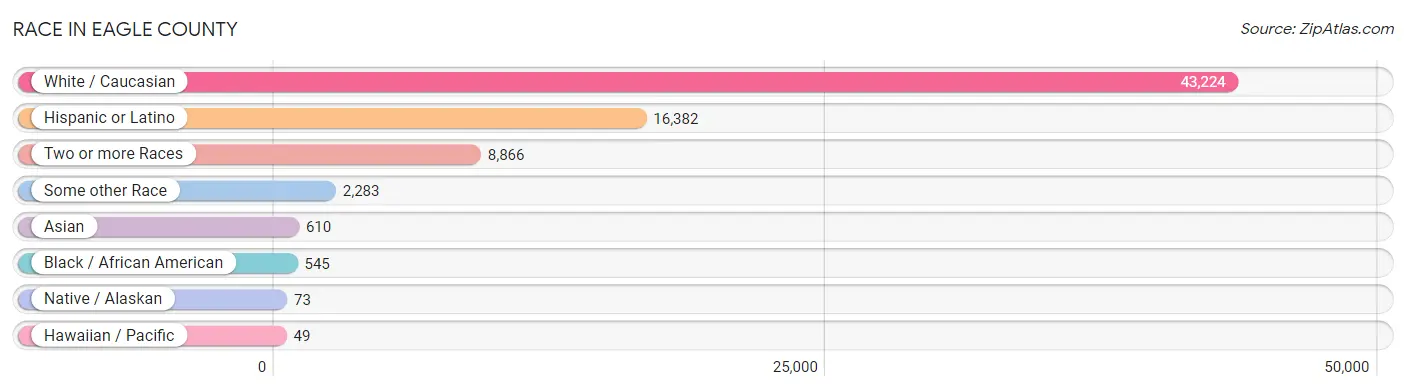
| Race | # Population | % Population |
| Asian | 610 | 1.1% |
| Black / African American | 545 | 1.0% |
| Hawaiian / Pacific | 49 | 0.1% |
| Hispanic or Latino | 16,382 | 29.4% |
| Native / Alaskan | 73 | 0.1% |
| White / Caucasian | 43,224 | 77.7% |
| Two or more Races | 8,866 | 15.9% |
| Some other Race | 2,283 | 4.1% |
| Total | 55,650 | 100.0% |
Ancestry in Eagle County
The most populous ancestries reported in Eagle County are Mexican (12,492 | 22.5%), German (6,865 | 12.3%), Irish (4,629 | 8.3%), English (4,618 | 8.3%), and Italian (2,990 | 5.4%), together accounting for 56.8% of all Eagle County residents.
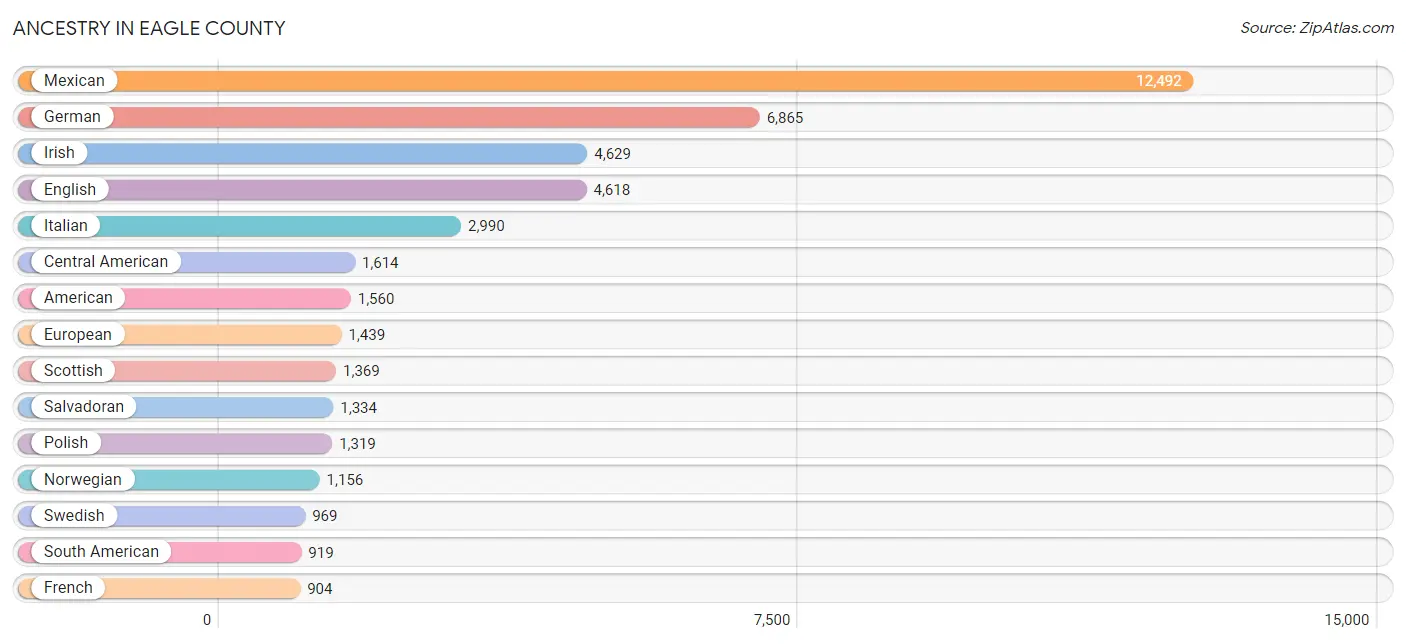
| Ancestry | # Population | % Population |
| African | 31 | 0.1% |
| Albanian | 6 | 0.0% |
| American | 1,560 | 2.8% |
| Arab | 114 | 0.2% |
| Argentinean | 100 | 0.2% |
| Armenian | 6 | 0.0% |
| Australian | 103 | 0.2% |
| Austrian | 116 | 0.2% |
| Belgian | 16 | 0.0% |
| Bhutanese | 31 | 0.1% |
| Bolivian | 23 | 0.0% |
| Brazilian | 52 | 0.1% |
| British | 729 | 1.3% |
| Burmese | 60 | 0.1% |
| Canadian | 105 | 0.2% |
| Celtic | 40 | 0.1% |
| Central American | 1,614 | 2.9% |
| Cherokee | 70 | 0.1% |
| Chilean | 171 | 0.3% |
| Colombian | 306 | 0.5% |
| Creek | 20 | 0.0% |
| Croatian | 38 | 0.1% |
| Cuban | 225 | 0.4% |
| Czech | 238 | 0.4% |
| Czechoslovakian | 44 | 0.1% |
| Danish | 168 | 0.3% |
| Dutch | 651 | 1.2% |
| Eastern European | 151 | 0.3% |
| English | 4,618 | 8.3% |
| Estonian | 10 | 0.0% |
| European | 1,439 | 2.6% |
| Finnish | 81 | 0.2% |
| French | 904 | 1.6% |
| French Canadian | 259 | 0.5% |
| German | 6,865 | 12.3% |
| Greek | 282 | 0.5% |
| Honduran | 270 | 0.5% |
| Hopi | 27 | 0.1% |
| Hungarian | 107 | 0.2% |
| Indian (Asian) | 103 | 0.2% |
| Iranian | 42 | 0.1% |
| Irish | 4,629 | 8.3% |
| Israeli | 77 | 0.1% |
| Italian | 2,990 | 5.4% |
| Jamaican | 81 | 0.2% |
| Korean | 100 | 0.2% |
| Latvian | 10 | 0.0% |
| Lebanese | 85 | 0.2% |
| Lithuanian | 110 | 0.2% |
| Mexican | 12,492 | 22.5% |
| Moroccan | 20 | 0.0% |
| New Zealander | 56 | 0.1% |
| Nicaraguan | 10 | 0.0% |
| Nigerian | 10 | 0.0% |
| Northern European | 187 | 0.3% |
| Norwegian | 1,156 | 2.1% |
| Peruvian | 319 | 0.6% |
| Polish | 1,319 | 2.4% |
| Portuguese | 80 | 0.1% |
| Puerto Rican | 7 | 0.0% |
| Romanian | 50 | 0.1% |
| Russian | 580 | 1.0% |
| Salvadoran | 1,334 | 2.4% |
| Samoan | 49 | 0.1% |
| Scandinavian | 88 | 0.2% |
| Scotch-Irish | 279 | 0.5% |
| Scottish | 1,369 | 2.5% |
| Slavic | 12 | 0.0% |
| Slovak | 193 | 0.4% |
| Slovene | 29 | 0.1% |
| South American | 919 | 1.7% |
| Spaniard | 746 | 1.3% |
| Spanish | 289 | 0.5% |
| Sri Lankan | 26 | 0.1% |
| Subsaharan African | 41 | 0.1% |
| Swedish | 969 | 1.7% |
| Swiss | 319 | 0.6% |
| Thai | 25 | 0.0% |
| Ukrainian | 276 | 0.5% |
| Welsh | 436 | 0.8% | View All 80 Rows |
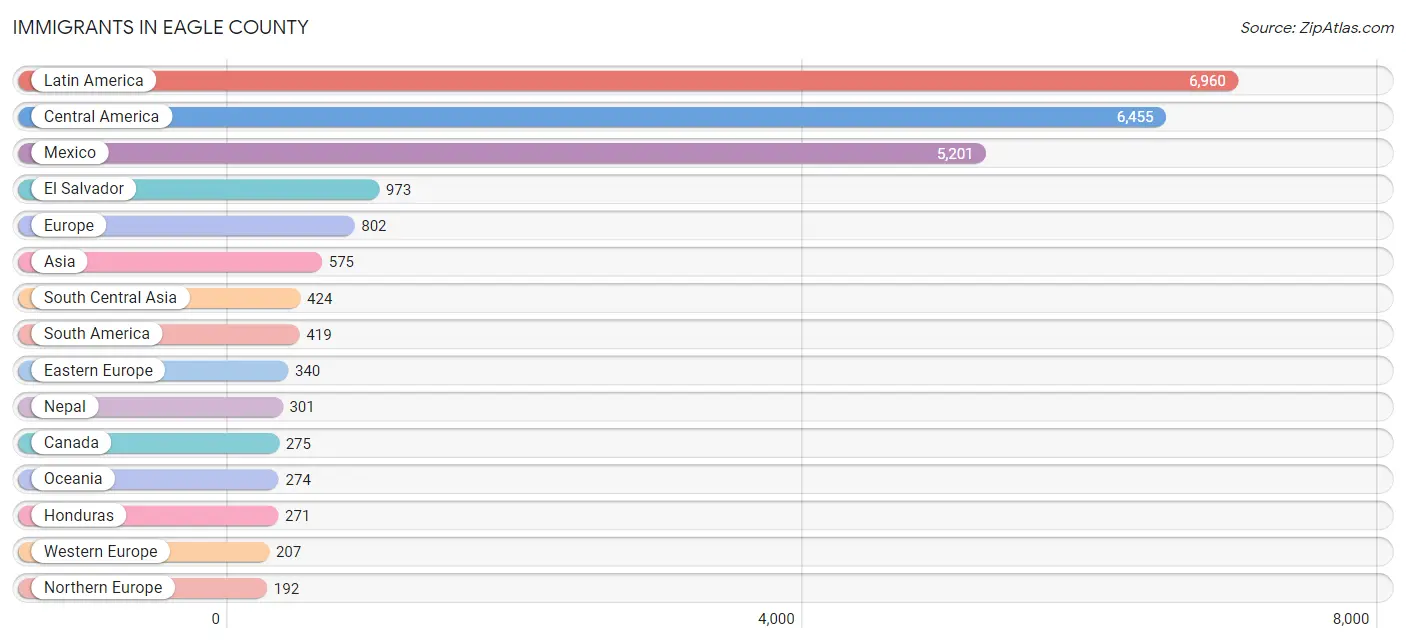
Immigrants in Eagle County
The most numerous immigrant groups reported in Eagle County came from Latin America (6,960 | 12.5%), Central America (6,455 | 11.6%), Mexico (5,201 | 9.3%), El Salvador (973 | 1.8%), and Europe (802 | 1.4%), together accounting for 36.7% of all Eagle County residents.
| Immigration Origin | # Population | % Population |
| Africa | 110 | 0.2% |
| Argentina | 122 | 0.2% |
| Asia | 575 | 1.0% |
| Australia | 115 | 0.2% |
| Belarus | 34 | 0.1% |
| Belgium | 16 | 0.0% |
| Canada | 275 | 0.5% |
| Caribbean | 86 | 0.2% |
| Central America | 6,455 | 11.6% |
| China | 36 | 0.1% |
| Colombia | 110 | 0.2% |
| Croatia | 10 | 0.0% |
| Cuba | 28 | 0.1% |
| Czechoslovakia | 78 | 0.1% |
| Eastern Asia | 89 | 0.2% |
| Eastern Europe | 340 | 0.6% |
| El Salvador | 973 | 1.8% |
| England | 109 | 0.2% |
| Europe | 802 | 1.4% |
| France | 14 | 0.0% |
| Germany | 136 | 0.2% |
| Honduras | 271 | 0.5% |
| India | 11 | 0.0% |
| Ireland | 7 | 0.0% |
| Israel | 34 | 0.1% |
| Italy | 4 | 0.0% |
| Jamaica | 58 | 0.1% |
| Japan | 14 | 0.0% |
| Korea | 39 | 0.1% |
| Latin America | 6,960 | 12.5% |
| Mexico | 5,201 | 9.3% |
| Morocco | 16 | 0.0% |
| Nepal | 301 | 0.5% |
| Netherlands | 18 | 0.0% |
| Nicaragua | 10 | 0.0% |
| Northern Africa | 16 | 0.0% |
| Northern Europe | 192 | 0.4% |
| Oceania | 274 | 0.5% |
| Peru | 187 | 0.3% |
| Philippines | 28 | 0.1% |
| Poland | 178 | 0.3% |
| Russia | 40 | 0.1% |
| Scotland | 32 | 0.1% |
| South Africa | 14 | 0.0% |
| South America | 419 | 0.7% |
| South Central Asia | 424 | 0.8% |
| South Eastern Asia | 28 | 0.1% |
| Southern Europe | 63 | 0.1% |
| Spain | 59 | 0.1% |
| Sweden | 44 | 0.1% |
| Switzerland | 23 | 0.0% |
| Taiwan | 3 | 0.0% |
| Uzbekistan | 112 | 0.2% |
| Western Asia | 34 | 0.1% |
| Western Europe | 207 | 0.4% | View All 55 Rows |
Sex and Age in Eagle County
Sex and Age in Eagle County
The most populous age groups in Eagle County are 35 to 39 Years (2,805 | 9.4%) for men and 35 to 39 Years (2,507 | 9.8%) for women.
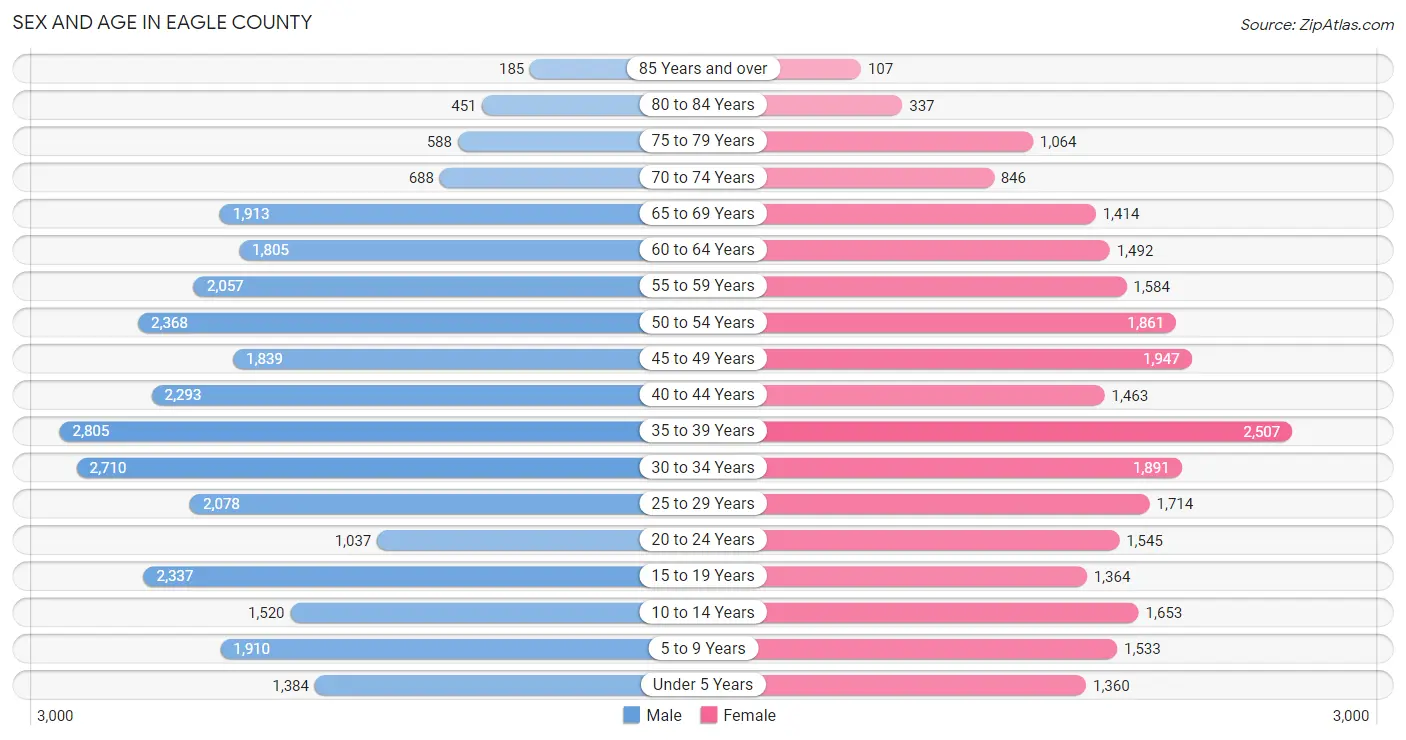
| Age Bracket | Male | Female |
| Under 5 Years | 1,384 (4.6%) | 1,360 (5.3%) |
| 5 to 9 Years | 1,910 (6.4%) | 1,533 (6.0%) |
| 10 to 14 Years | 1,520 (5.1%) | 1,653 (6.4%) |
| 15 to 19 Years | 2,337 (7.8%) | 1,364 (5.3%) |
| 20 to 24 Years | 1,037 (3.5%) | 1,545 (6.0%) |
| 25 to 29 Years | 2,078 (6.9%) | 1,714 (6.7%) |
| 30 to 34 Years | 2,710 (9.0%) | 1,891 (7.4%) |
| 35 to 39 Years | 2,805 (9.4%) | 2,507 (9.8%) |
| 40 to 44 Years | 2,293 (7.6%) | 1,463 (5.7%) |
| 45 to 49 Years | 1,839 (6.1%) | 1,947 (7.6%) |
| 50 to 54 Years | 2,368 (7.9%) | 1,861 (7.2%) |
| 55 to 59 Years | 2,057 (6.9%) | 1,584 (6.2%) |
| 60 to 64 Years | 1,805 (6.0%) | 1,492 (5.8%) |
| 65 to 69 Years | 1,913 (6.4%) | 1,414 (5.5%) |
| 70 to 74 Years | 688 (2.3%) | 846 (3.3%) |
| 75 to 79 Years | 588 (2.0%) | 1,064 (4.1%) |
| 80 to 84 Years | 451 (1.5%) | 337 (1.3%) |
| 85 Years and over | 185 (0.6%) | 107 (0.4%) |
| Total | 29,968 (100.0%) | 25,682 (100.0%) |
Families and Households in Eagle County
Median Family Size in Eagle County
The median family size in Eagle County is 3.20 persons per family, with single female/mother families (1,065 | 8.3%) accounting for the largest median family size of 3.7 persons per family. On the other hand, married-couple families (10,893 | 85.3%) represent the smallest median family size with 3.12 persons per family.
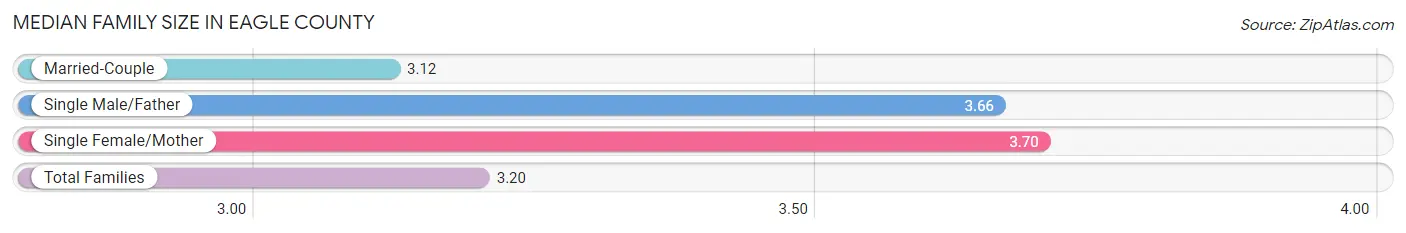
| Family Type | # Families | Family Size |
| Married-Couple | 10,893 (85.3%) | 3.12 |
| Single Male/Father | 809 (6.3%) | 3.66 |
| Single Female/Mother | 1,065 (8.3%) | 3.70 |
| Total Families | 12,767 (100.0%) | 3.20 |
Median Household Size in Eagle County
The median household size in Eagle County is 2.77 persons per household, with single male/father households (809 | 4.0%) accounting for the largest median household size of 4.1 persons per household. non-family households (7,317 | 36.4%) represent the smallest median household size with 1.84 persons per household.
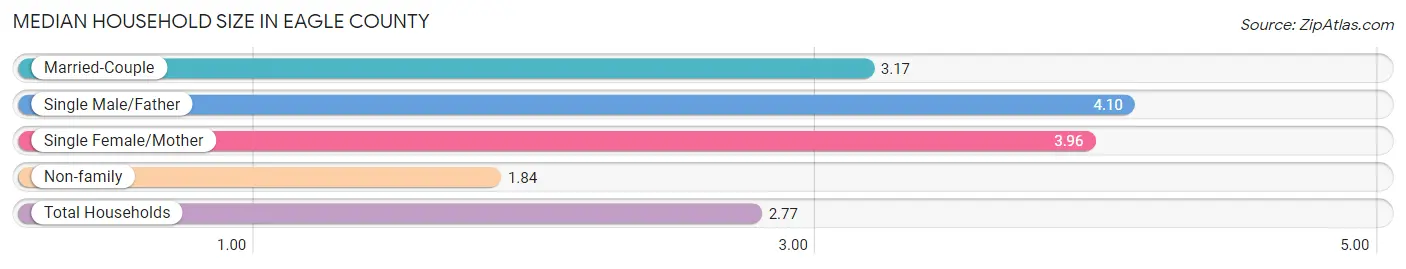
| Household Type | # Households | Household Size |
| Married-Couple | 10,893 (54.2%) | 3.17 |
| Single Male/Father | 809 (4.0%) | 4.10 |
| Single Female/Mother | 1,065 (5.3%) | 3.96 |
| Non-family | 7,317 (36.4%) | 1.84 |
| Total Households | 20,084 (100.0%) | 2.77 |
Household Size by Marriage Status in Eagle County
Out of a total of 20,084 households in Eagle County, 12,767 (63.6%) are family households, while 7,317 (36.4%) are nonfamily households. The most numerous type of family households are 2-person households, comprising 5,585, and the most common type of nonfamily households are 1-person households, comprising 5,128.
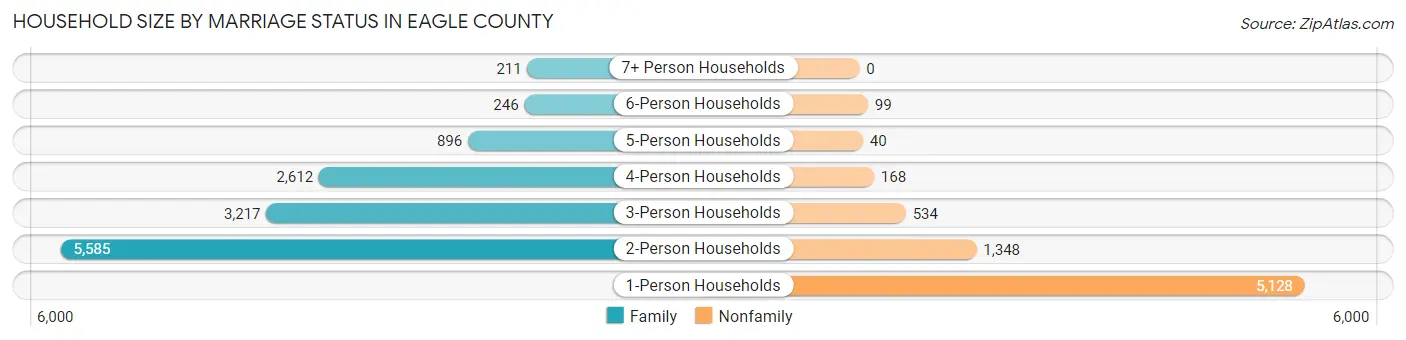
| Household Size | Family Households | Nonfamily Households |
| 1-Person Households | - | 5,128 (25.5%) |
| 2-Person Households | 5,585 (27.8%) | 1,348 (6.7%) |
| 3-Person Households | 3,217 (16.0%) | 534 (2.7%) |
| 4-Person Households | 2,612 (13.0%) | 168 (0.8%) |
| 5-Person Households | 896 (4.5%) | 40 (0.2%) |
| 6-Person Households | 246 (1.2%) | 99 (0.5%) |
| 7+ Person Households | 211 (1.1%) | 0 (0.0%) |
| Total | 12,767 (63.6%) | 7,317 (36.4%) |
Female Fertility in Eagle County
Fertility by Age in Eagle County
Average fertility rate in Eagle County is 50.0 births per 1,000 women. Women in the age bracket of 35 to 50 years have the highest fertility rate with 68.0 births per 1,000 women. Women in the age bracket of 35 to 50 years acount for 68.1% of all women with births.
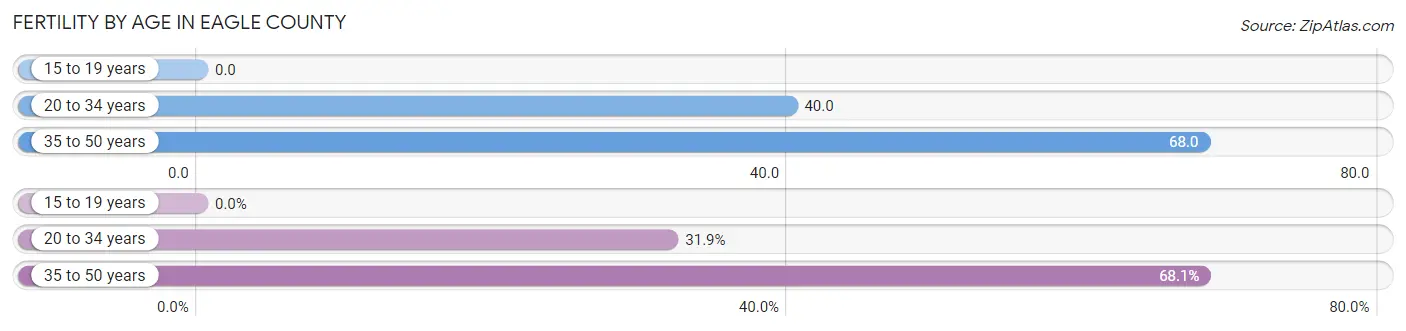
| Age Bracket | Women with Births | Births / 1,000 Women |
| 15 to 19 years | 0 (0.0%) | 0.0 |
| 20 to 34 years | 204 (31.9%) | 40.0 |
| 35 to 50 years | 435 (68.1%) | 68.0 |
| Total | 639 (100.0%) | 50.0 |
Fertility by Age by Marriage Status in Eagle County
93.7% of women with births (639) in Eagle County are married. The highest percentage of unmarried women with births falls into 20 to 34 years age bracket with 17.6% of them unmarried at the time of birth, while the lowest percentage of unmarried women with births belong to 35 to 50 years age bracket with 0.9% of them unmarried.
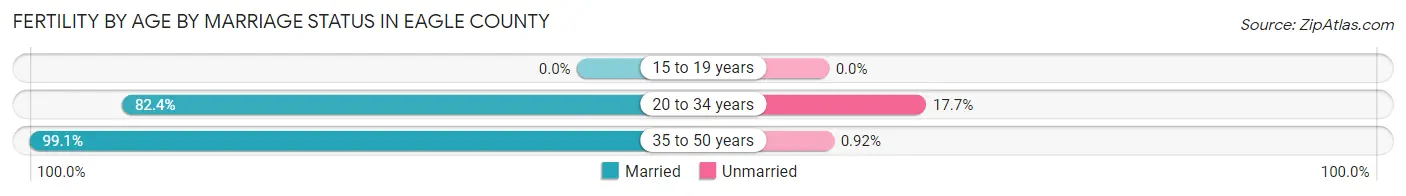
| Age Bracket | Married | Unmarried |
| 15 to 19 years | 0 (0.0%) | 0 (0.0%) |
| 20 to 34 years | 168 (82.4%) | 36 (17.6%) |
| 35 to 50 years | 431 (99.1%) | 4 (0.9%) |
| Total | 599 (93.7%) | 40 (6.3%) |
Fertility by Education in Eagle County
Average fertility rate in Eagle County is 50.0 births per 1,000 women. Women with the education attainment of graduate degree have the highest fertility rate of 156.0 births per 1,000 women, while women with the education attainment of less than high school have the lowest fertility at 16.0 births per 1,000 women. Women with the education attainment of graduate degree represent 46.8% of all women with births.
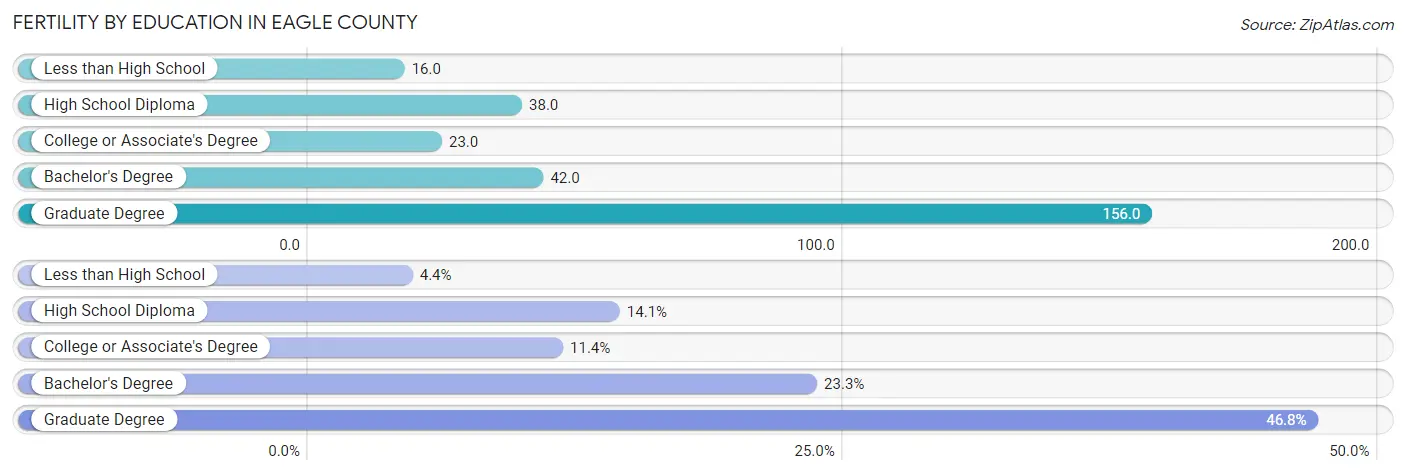
| Educational Attainment | Women with Births | Births / 1,000 Women |
| Less than High School | 28 (4.4%) | 16.0 |
| High School Diploma | 90 (14.1%) | 38.0 |
| College or Associate's Degree | 73 (11.4%) | 23.0 |
| Bachelor's Degree | 149 (23.3%) | 42.0 |
| Graduate Degree | 299 (46.8%) | 156.0 |
| Total | 639 (100.0%) | 50.0 |
Fertility by Education by Marriage Status in Eagle County
6.3% of women with births in Eagle County are unmarried. Women with the educational attainment of less than high school are most likely to be married with 100.0% of them married at childbirth, while women with the educational attainment of high school diploma are least likely to be married with 40.0% of them unmarried at childbirth.
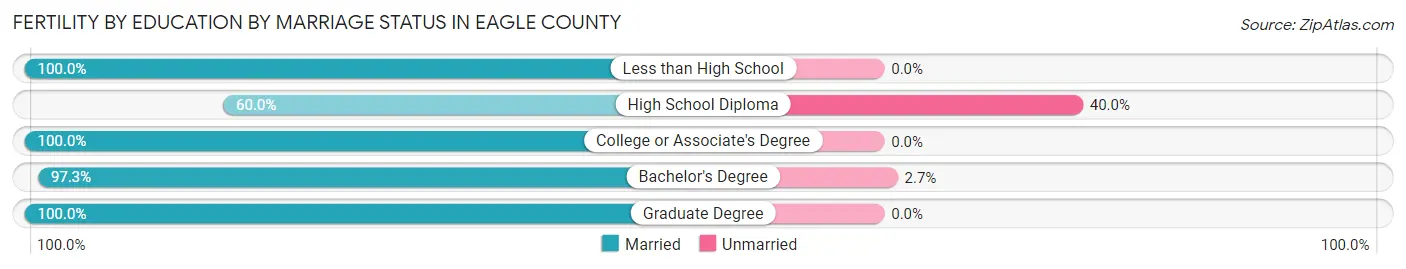
| Educational Attainment | Married | Unmarried |
| Less than High School | 28 (100.0%) | 0 (0.0%) |
| High School Diploma | 54 (60.0%) | 36 (40.0%) |
| College or Associate's Degree | 73 (100.0%) | 0 (0.0%) |
| Bachelor's Degree | 145 (97.3%) | 4 (2.7%) |
| Graduate Degree | 299 (100.0%) | 0 (0.0%) |
| Total | 599 (93.7%) | 40 (6.3%) |
Income in Eagle County
Income Overview in Eagle County
Per Capita Income in Eagle County is $55,007, while median incomes of families and households are $114,344 and $98,887 respectively.
| Characteristic | Number | Measure |
| Per Capita Income | 55,650 | $55,007 |
| Median Family Income | 12,767 | $114,344 |
| Mean Family Income | 12,767 | $166,369 |
| Median Household Income | 20,084 | $98,887 |
| Mean Household Income | 20,084 | $140,636 |
| Income Deficit | 12,767 | $0 |
| Wage / Income Gap (%) | 55,650 | 17.25% |
| Wage / Income Gap ($) | 55,650 | 82.75¢ per $1 |
| Gini / Inequality Index | 55,650 | 0.49 |
Earnings by Sex in Eagle County
Average Earnings in Eagle County are $46,602, $49,531 for men and $40,988 for women, a difference of 17.2%.
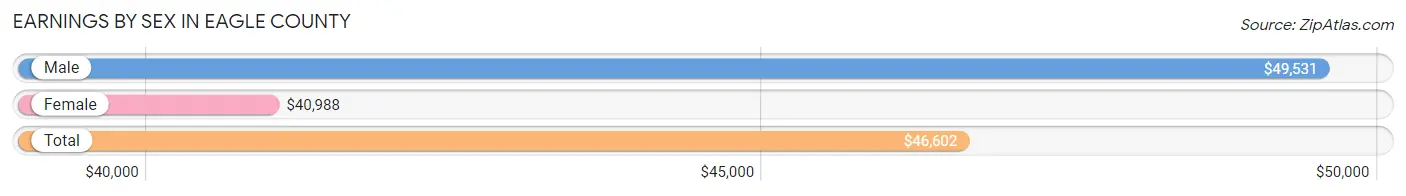
| Sex | Number | Average Earnings |
| Male | 20,123 (57.4%) | $49,531 |
| Female | 14,968 (42.6%) | $40,988 |
| Total | 35,091 (100.0%) | $46,602 |
Earnings by Sex by Income Bracket in Eagle County
The most common earnings brackets in Eagle County are $100,000+ for men (4,227 | 21.0%) and $100,000+ for women (1,607 | 10.7%).
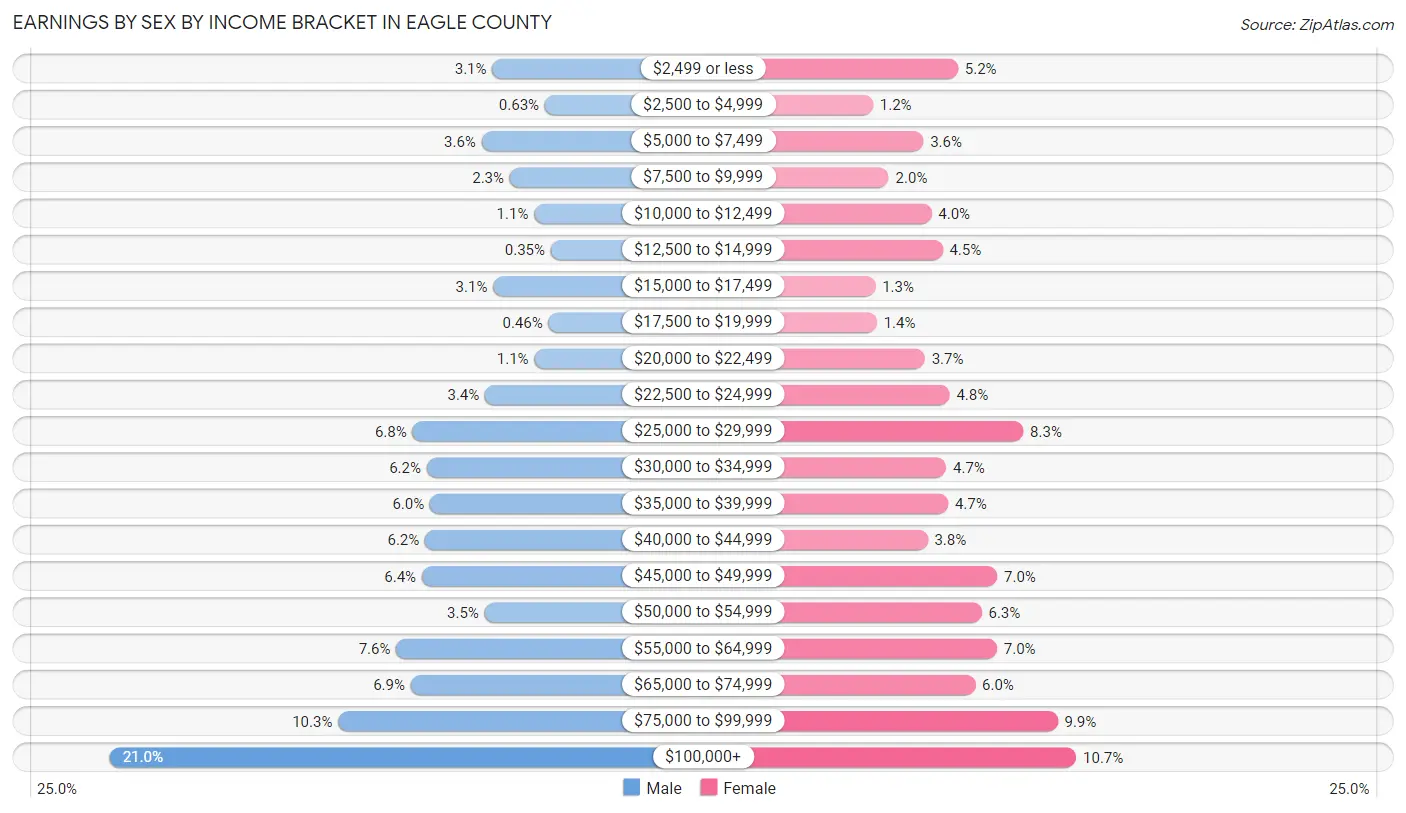
| Income | Male | Female |
| $2,499 or less | 621 (3.1%) | 778 (5.2%) |
| $2,500 to $4,999 | 127 (0.6%) | 182 (1.2%) |
| $5,000 to $7,499 | 722 (3.6%) | 536 (3.6%) |
| $7,500 to $9,999 | 456 (2.3%) | 293 (2.0%) |
| $10,000 to $12,499 | 227 (1.1%) | 593 (4.0%) |
| $12,500 to $14,999 | 71 (0.4%) | 670 (4.5%) |
| $15,000 to $17,499 | 614 (3.0%) | 199 (1.3%) |
| $17,500 to $19,999 | 92 (0.5%) | 209 (1.4%) |
| $20,000 to $22,499 | 225 (1.1%) | 547 (3.6%) |
| $22,500 to $24,999 | 691 (3.4%) | 720 (4.8%) |
| $25,000 to $29,999 | 1,374 (6.8%) | 1,236 (8.3%) |
| $30,000 to $34,999 | 1,240 (6.2%) | 696 (4.6%) |
| $35,000 to $39,999 | 1,209 (6.0%) | 710 (4.7%) |
| $40,000 to $44,999 | 1,255 (6.2%) | 566 (3.8%) |
| $45,000 to $49,999 | 1,286 (6.4%) | 1,053 (7.0%) |
| $50,000 to $54,999 | 695 (3.5%) | 945 (6.3%) |
| $55,000 to $64,999 | 1,527 (7.6%) | 1,052 (7.0%) |
| $65,000 to $74,999 | 1,390 (6.9%) | 899 (6.0%) |
| $75,000 to $99,999 | 2,074 (10.3%) | 1,477 (9.9%) |
| $100,000+ | 4,227 (21.0%) | 1,607 (10.7%) |
| Total | 20,123 (100.0%) | 14,968 (100.0%) |
Earnings by Sex by Educational Attainment in Eagle County
Average earnings in Eagle County are $55,483 for men and $46,474 for women, a difference of 16.2%. Men with an educational attainment of graduate degree enjoy the highest average annual earnings of $79,938, while those with less than high school education earn the least with $29,714. Women with an educational attainment of graduate degree earn the most with the average annual earnings of $57,890, while those with less than high school education have the smallest earnings of $25,184.
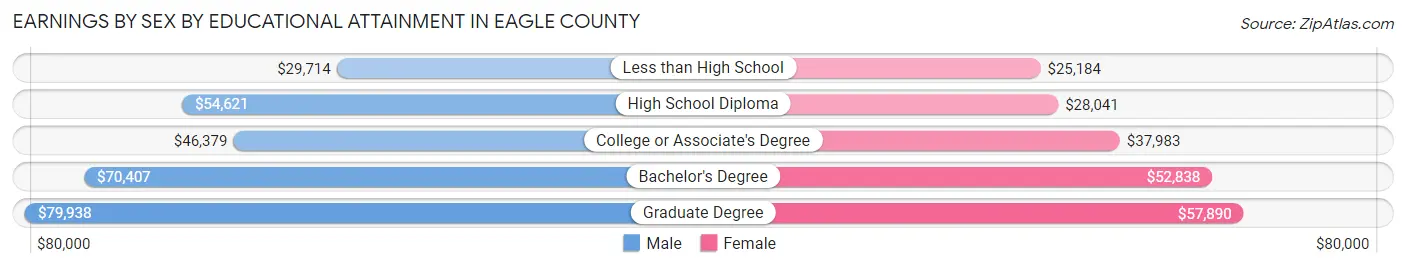
| Educational Attainment | Male Income | Female Income |
| Less than High School | $29,714 | $25,184 |
| High School Diploma | $54,621 | $28,041 |
| College or Associate's Degree | $46,379 | $37,983 |
| Bachelor's Degree | $70,407 | $52,838 |
| Graduate Degree | $79,938 | $57,890 |
| Total | $55,483 | $46,474 |
Family Income in Eagle County
Family Income Brackets in Eagle County
According to the Eagle County family income data, there are 2,809 families falling into the $100,000 to $149,999 income range, which is the most common income bracket and makes up 22.0% of all families. Conversely, the $10,000 to $14,999 income bracket is the least frequent group with only 64 families (0.5%) belonging to this category.
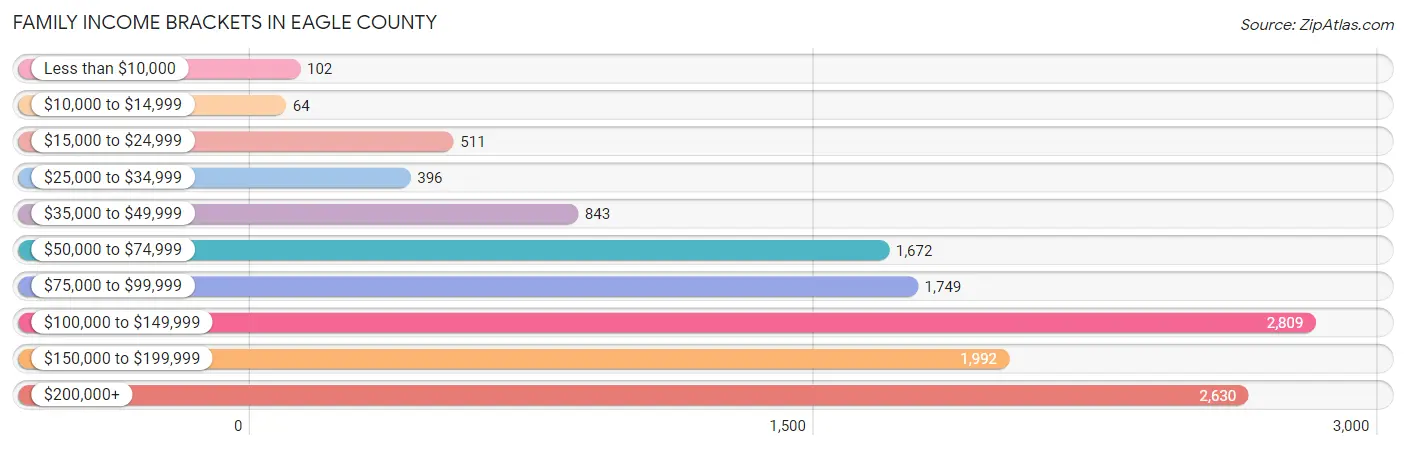
| Income Bracket | # Families | % Families |
| Less than $10,000 | 102 | 0.8% |
| $10,000 to $14,999 | 64 | 0.5% |
| $15,000 to $24,999 | 511 | 4.0% |
| $25,000 to $34,999 | 396 | 3.1% |
| $35,000 to $49,999 | 843 | 6.6% |
| $50,000 to $74,999 | 1,672 | 13.1% |
| $75,000 to $99,999 | 1,749 | 13.7% |
| $100,000 to $149,999 | 2,809 | 22.0% |
| $150,000 to $199,999 | 1,992 | 15.6% |
| $200,000+ | 2,630 | 20.6% |
Family Income by Famaliy Size in Eagle County
3-person families (2,965 | 23.2%) account for the highest median family income in Eagle County with $124,496 per family, while 2-person families (5,981 | 46.9%) have the highest median income of $59,930 per family member.
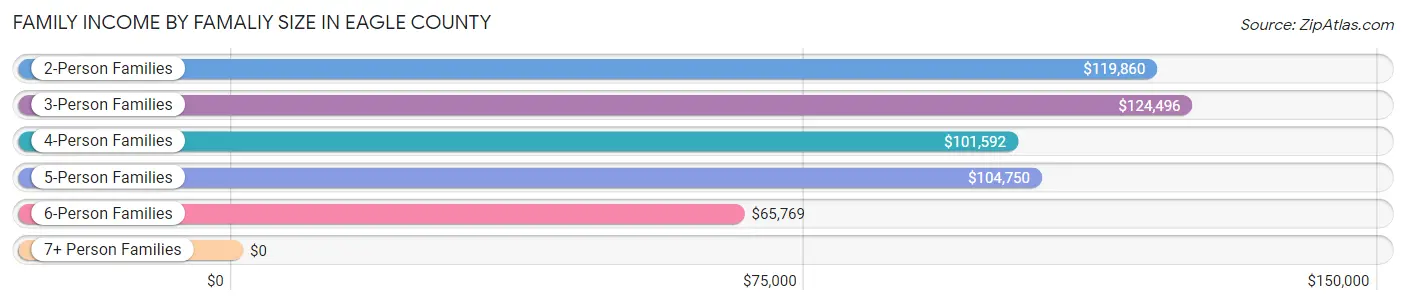
| Income Bracket | # Families | Median Income |
| 2-Person Families | 5,981 (46.9%) | $119,860 |
| 3-Person Families | 2,965 (23.2%) | $124,496 |
| 4-Person Families | 2,592 (20.3%) | $101,592 |
| 5-Person Families | 772 (6.0%) | $104,750 |
| 6-Person Families | 282 (2.2%) | $65,769 |
| 7+ Person Families | 175 (1.4%) | $0 |
| Total | 12,767 (100.0%) | $114,344 |
Family Income by Number of Earners in Eagle County
The median family income in Eagle County is $114,344, with families comprising 3+ earners (1,216) having the highest median family income of $169,655, while families with no earners (1,209) have the lowest median family income of $76,477, accounting for 9.5% and 9.5% of families, respectively.
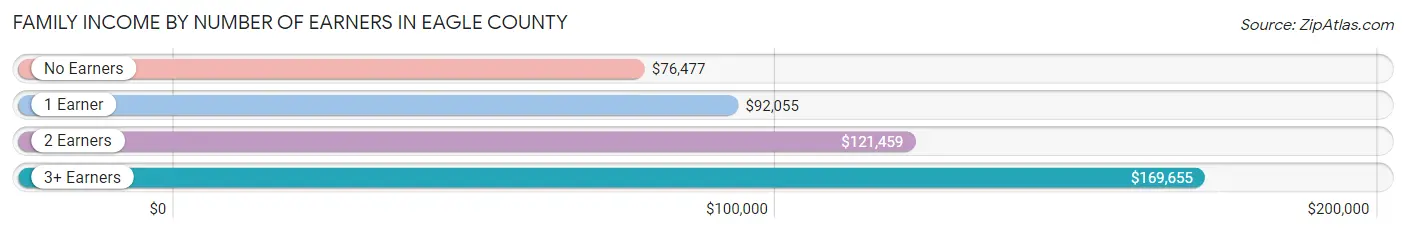
| Number of Earners | # Families | Median Income |
| No Earners | 1,209 (9.5%) | $76,477 |
| 1 Earner | 3,535 (27.7%) | $92,055 |
| 2 Earners | 6,807 (53.3%) | $121,459 |
| 3+ Earners | 1,216 (9.5%) | $169,655 |
| Total | 12,767 (100.0%) | $114,344 |
Household Income in Eagle County
Household Income Brackets in Eagle County
With 3,736 households falling in the category, the $100,000 to $149,999 income range is the most frequent in Eagle County, accounting for 18.6% of all households. In contrast, only 301 households (1.5%) fall into the $10,000 to $14,999 income bracket, making it the least populous group.
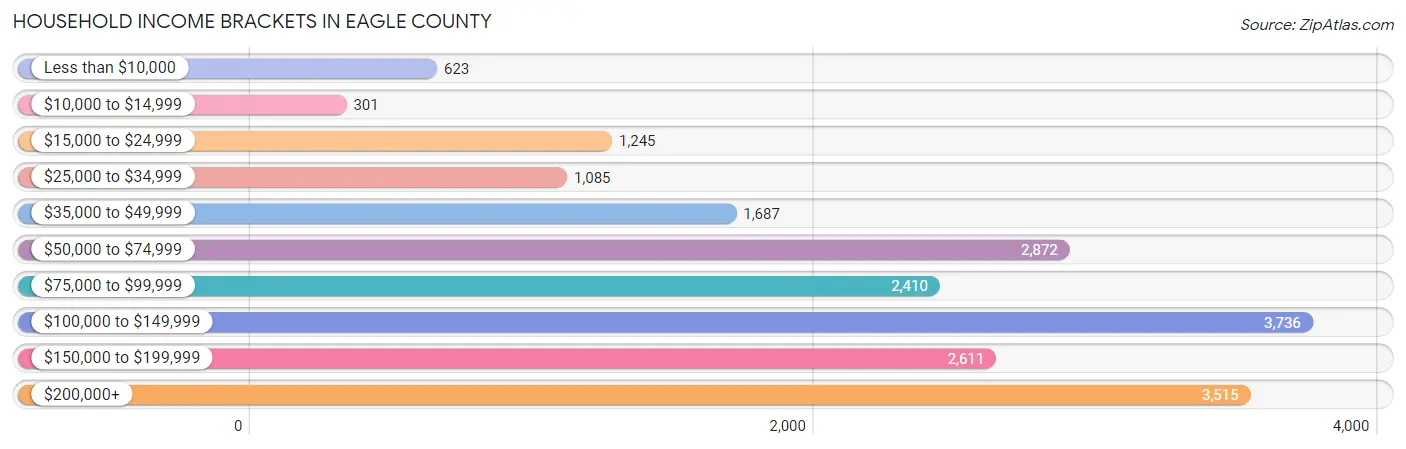
| Income Bracket | # Households | % Households |
| Less than $10,000 | 623 | 3.1% |
| $10,000 to $14,999 | 301 | 1.5% |
| $15,000 to $24,999 | 1,245 | 6.2% |
| $25,000 to $34,999 | 1,085 | 5.4% |
| $35,000 to $49,999 | 1,687 | 8.4% |
| $50,000 to $74,999 | 2,872 | 14.3% |
| $75,000 to $99,999 | 2,410 | 12.0% |
| $100,000 to $149,999 | 3,736 | 18.6% |
| $150,000 to $199,999 | 2,611 | 13.0% |
| $200,000+ | 3,515 | 17.5% |
Household Income by Householder Age in Eagle County
The median household income in Eagle County is $98,887, with the highest median household income of $119,137 found in the 45 to 64 years age bracket for the primary householder. A total of 8,340 households (41.5%) fall into this category. Meanwhile, the 15 to 24 years age bracket for the primary householder has the lowest median household income of $36,051, with 560 households (2.8%) in this group.
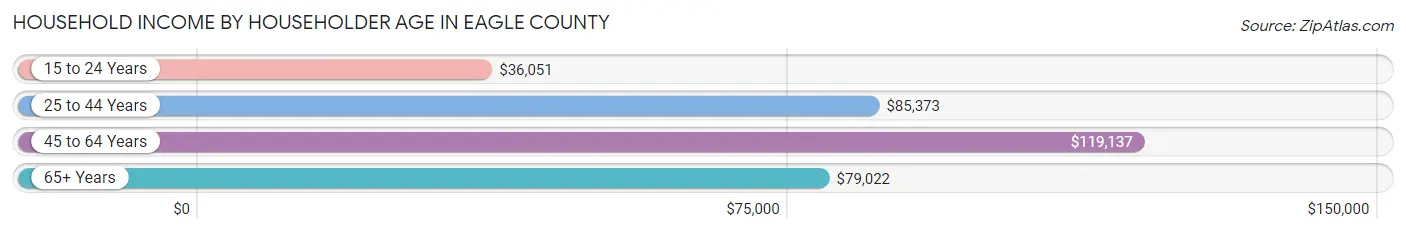
| Income Bracket | # Households | Median Income |
| 15 to 24 Years | 560 (2.8%) | $36,051 |
| 25 to 44 Years | 6,960 (34.6%) | $85,373 |
| 45 to 64 Years | 8,340 (41.5%) | $119,137 |
| 65+ Years | 4,224 (21.0%) | $79,022 |
| Total | 20,084 (100.0%) | $98,887 |
Poverty in Eagle County
Income Below Poverty by Sex and Age in Eagle County
With 6.3% poverty level for males and 10.1% for females among the residents of Eagle County, 25 to 34 year old males and 5 year old females are the most vulnerable to poverty, with 535 males (11.3%) and 69 females (26.2%) in their respective age groups living below the poverty level.
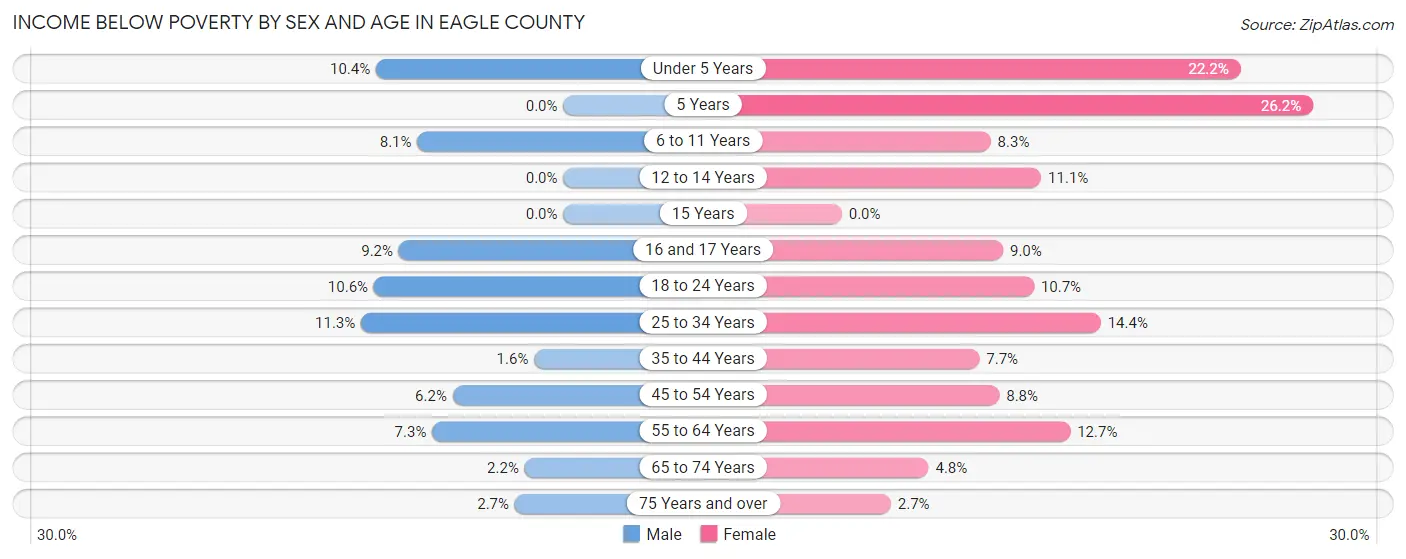
| Age Bracket | Male | Female |
| Under 5 Years | 142 (10.4%) | 287 (22.2%) |
| 5 Years | 0 (0.0%) | 69 (26.2%) |
| 6 to 11 Years | 179 (8.1%) | 157 (8.3%) |
| 12 to 14 Years | 0 (0.0%) | 108 (11.1%) |
| 15 Years | 0 (0.0%) | 0 (0.0%) |
| 16 and 17 Years | 82 (9.2%) | 51 (9.0%) |
| 18 to 24 Years | 221 (10.5%) | 215 (10.7%) |
| 25 to 34 Years | 535 (11.3%) | 520 (14.4%) |
| 35 to 44 Years | 82 (1.6%) | 304 (7.7%) |
| 45 to 54 Years | 259 (6.2%) | 334 (8.8%) |
| 55 to 64 Years | 282 (7.3%) | 391 (12.7%) |
| 65 to 74 Years | 56 (2.1%) | 109 (4.8%) |
| 75 Years and over | 33 (2.7%) | 41 (2.7%) |
| Total | 1,871 (6.3%) | 2,586 (10.1%) |
Income Above Poverty by Sex and Age in Eagle County
According to the poverty statistics in Eagle County, males aged 5 years and females aged 15 years are the age groups that are most secure financially, with 100.0% of males and 100.0% of females in these age groups living above the poverty line.
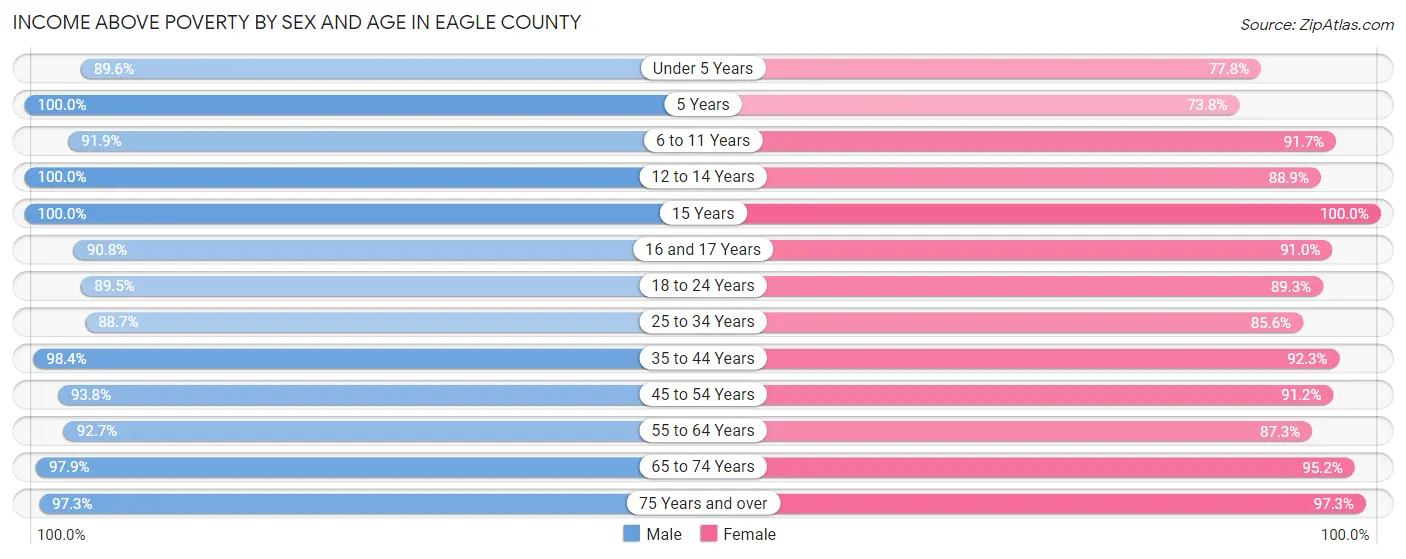
| Age Bracket | Male | Female |
| Under 5 Years | 1,219 (89.6%) | 1,006 (77.8%) |
| 5 Years | 223 (100.0%) | 194 (73.8%) |
| 6 to 11 Years | 2,024 (91.9%) | 1,737 (91.7%) |
| 12 to 14 Years | 971 (100.0%) | 865 (88.9%) |
| 15 Years | 373 (100.0%) | 332 (100.0%) |
| 16 and 17 Years | 813 (90.8%) | 517 (91.0%) |
| 18 to 24 Years | 1,873 (89.4%) | 1,794 (89.3%) |
| 25 to 34 Years | 4,216 (88.7%) | 3,085 (85.6%) |
| 35 to 44 Years | 4,989 (98.4%) | 3,665 (92.3%) |
| 45 to 54 Years | 3,948 (93.8%) | 3,474 (91.2%) |
| 55 to 64 Years | 3,580 (92.7%) | 2,684 (87.3%) |
| 65 to 74 Years | 2,545 (97.9%) | 2,149 (95.2%) |
| 75 Years and over | 1,191 (97.3%) | 1,461 (97.3%) |
| Total | 27,965 (93.7%) | 22,963 (89.9%) |
Income Below Poverty Among Married-Couple Families in Eagle County
The poverty statistics for married-couple families in Eagle County show that 3.2% or 348 of the total 10,893 families live below the poverty line. Families with 1 or 2 children have the highest poverty rate of 6.5%, comprising of 262 families. On the other hand, families with 3 or 4 children have the lowest poverty rate of 0.0%, which includes 0 families.
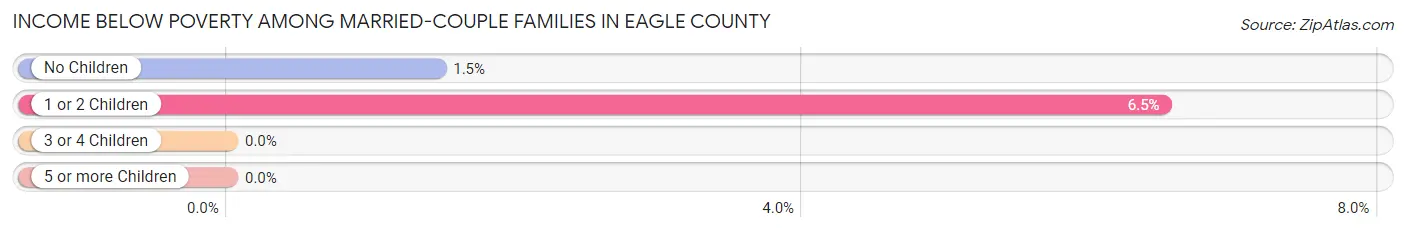
| Children | Above Poverty | Below Poverty |
| No Children | 5,858 (98.6%) | 86 (1.5%) |
| 1 or 2 Children | 3,771 (93.5%) | 262 (6.5%) |
| 3 or 4 Children | 916 (100.0%) | 0 (0.0%) |
| 5 or more Children | 0 (0.0%) | 0 (0.0%) |
| Total | 10,545 (96.8%) | 348 (3.2%) |
Income Below Poverty Among Single-Parent Households in Eagle County
According to the poverty data in Eagle County, 4.6% or 37 single-father households and 16.0% or 170 single-mother households are living below the poverty line. Among single-father households, those with 3 or 4 children have the highest poverty rate, with 31 households (55.4%) experiencing poverty. Likewise, among single-mother households, those with 5 or more children have the highest poverty rate, with 55 households (100.0%) falling below the poverty line.
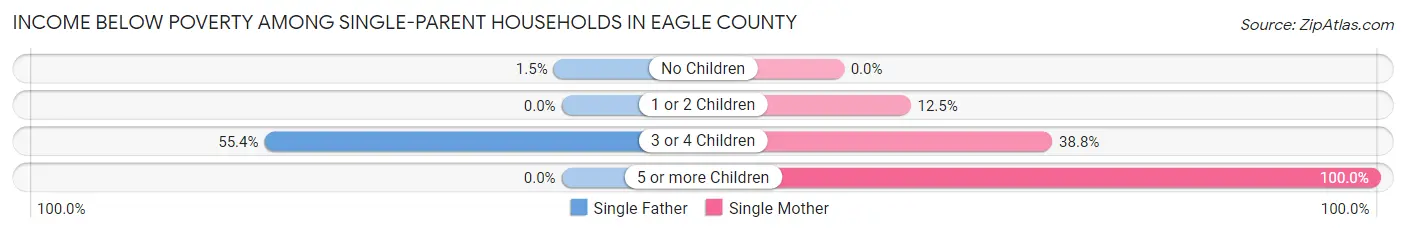
| Children | Single Father | Single Mother |
| No Children | 6 (1.5%) | 0 (0.0%) |
| 1 or 2 Children | 0 (0.0%) | 75 (12.5%) |
| 3 or 4 Children | 31 (55.4%) | 40 (38.8%) |
| 5 or more Children | 0 (0.0%) | 55 (100.0%) |
| Total | 37 (4.6%) | 170 (16.0%) |
Income Below Poverty Among Married-Couple vs Single-Parent Households in Eagle County
The poverty data for Eagle County shows that 348 of the married-couple family households (3.2%) and 207 of the single-parent households (11.1%) are living below the poverty level. Within the married-couple family households, those with 1 or 2 children have the highest poverty rate, with 262 households (6.5%) falling below the poverty line. Among the single-parent households, those with 5 or more children have the highest poverty rate, with 55 household (100.0%) living below poverty.
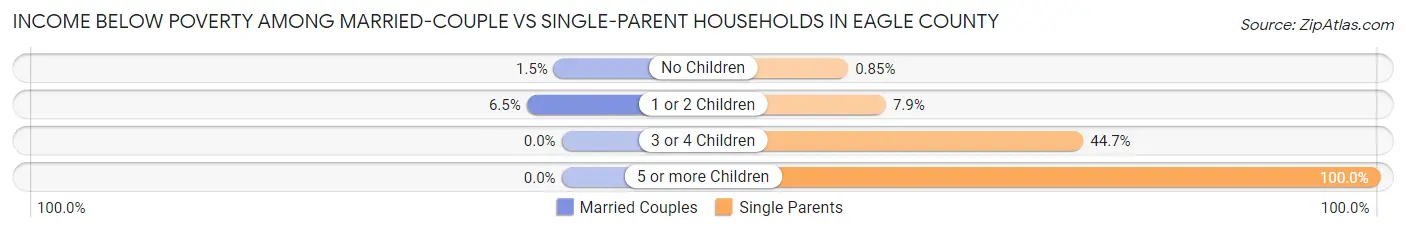
| Children | Married-Couple Families | Single-Parent Households |
| No Children | 86 (1.5%) | 6 (0.9%) |
| 1 or 2 Children | 262 (6.5%) | 75 (7.9%) |
| 3 or 4 Children | 0 (0.0%) | 71 (44.7%) |
| 5 or more Children | 0 (0.0%) | 55 (100.0%) |
| Total | 348 (3.2%) | 207 (11.1%) |
Employment Characteristics in Eagle County
Employment by Class of Employer in Eagle County
Among the 31,408 employed individuals in Eagle County, private company employees (20,490 | 65.2%), local government employees (2,928 | 9.3%), and self-employed (incorporated) (2,715 | 8.6%) make up the most common classes of employment.
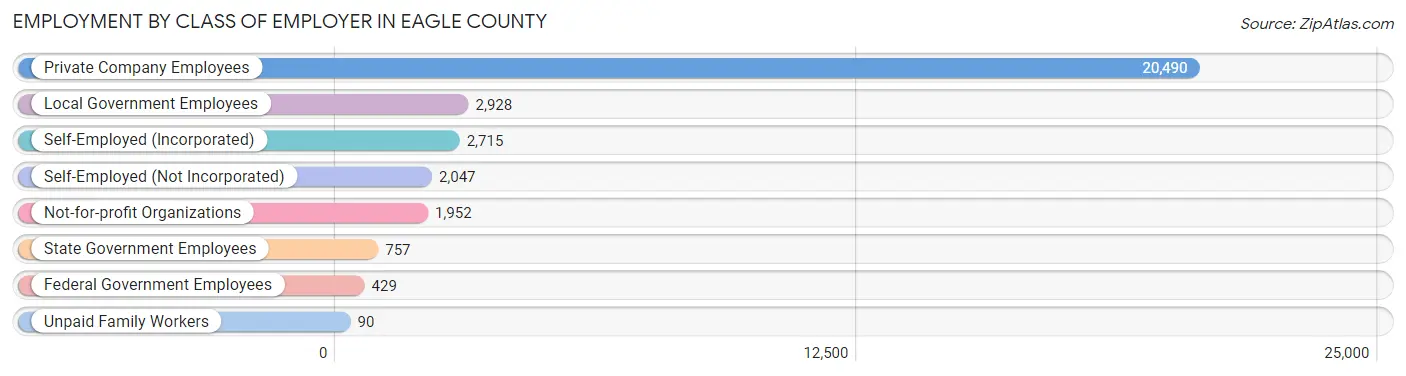
| Employer Class | # Employees | % Employees |
| Private Company Employees | 20,490 | 65.2% |
| Self-Employed (Incorporated) | 2,715 | 8.6% |
| Self-Employed (Not Incorporated) | 2,047 | 6.5% |
| Not-for-profit Organizations | 1,952 | 6.2% |
| Local Government Employees | 2,928 | 9.3% |
| State Government Employees | 757 | 2.4% |
| Federal Government Employees | 429 | 1.4% |
| Unpaid Family Workers | 90 | 0.3% |
| Total | 31,408 | 100.0% |
Employment Status by Age in Eagle County
According to the labor force statistics for Eagle County, out of the total population over 16 years of age (45,585), 73.9% or 33,687 individuals are in the labor force, with 4.4% or 1,482 of them unemployed. The age group with the highest labor force participation rate is 20 to 24 years, with 95.0% or 2,453 individuals in the labor force. Within the labor force, the 25 to 29 years age range has the highest percentage of unemployed individuals, with 15.9% or 534 of them being unemployed.
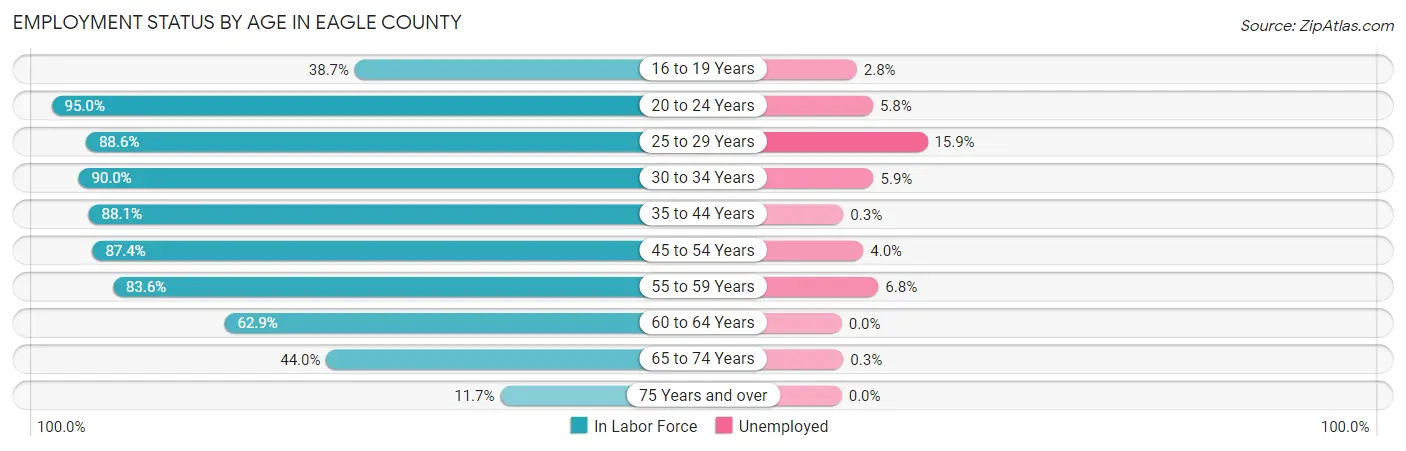
| Age Bracket | In Labor Force | Unemployed |
| 16 to 19 Years | 1,159 (38.7%) | 32 (2.8%) |
| 20 to 24 Years | 2,453 (95.0%) | 142 (5.8%) |
| 25 to 29 Years | 3,360 (88.6%) | 534 (15.9%) |
| 30 to 34 Years | 4,141 (90.0%) | 244 (5.9%) |
| 35 to 44 Years | 7,989 (88.1%) | 24 (0.3%) |
| 45 to 54 Years | 7,005 (87.4%) | 280 (4.0%) |
| 55 to 59 Years | 3,044 (83.6%) | 207 (6.8%) |
| 60 to 64 Years | 2,074 (62.9%) | 0 (0.0%) |
| 65 to 74 Years | 2,139 (44.0%) | 6 (0.3%) |
| 75 Years and over | 320 (11.7%) | 0 (0.0%) |
| Total | 33,687 (73.9%) | 1,482 (4.4%) |
Employment Status by Educational Attainment in Eagle County
According to labor force statistics for Eagle County, 85.2% of individuals (27,617) out of the total population between 25 and 64 years of age (32,414) are in the labor force, with 4.7% or 1,298 of them being unemployed. The group with the highest labor force participation rate are those with the educational attainment of college / associate degree, with 88.9% or 6,653 individuals in the labor force. Within the labor force, individuals with less than high school education have the highest percentage of unemployment, with 11.8% or 223 of them being unemployed.
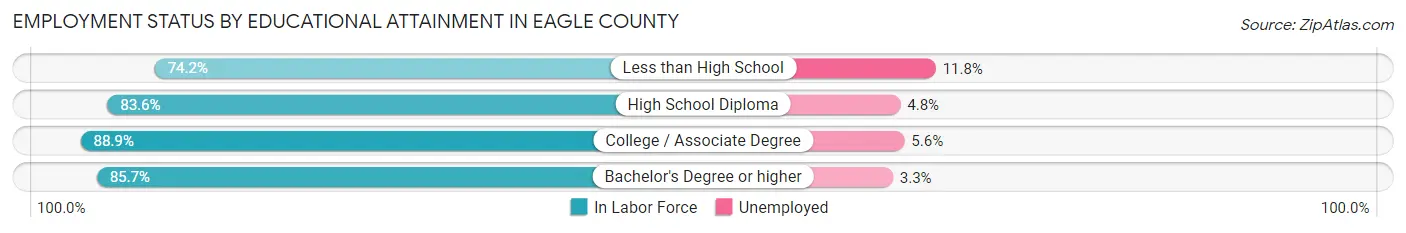
| Educational Attainment | In Labor Force | Unemployed |
| Less than High School | 1,894 (74.2%) | 301 (11.8%) |
| High School Diploma | 4,668 (83.6%) | 268 (4.8%) |
| College / Associate Degree | 6,653 (88.9%) | 419 (5.6%) |
| Bachelor's Degree or higher | 14,392 (85.7%) | 554 (3.3%) |
| Total | 27,617 (85.2%) | 1,523 (4.7%) |
Employment Occupations by Sex in Eagle County
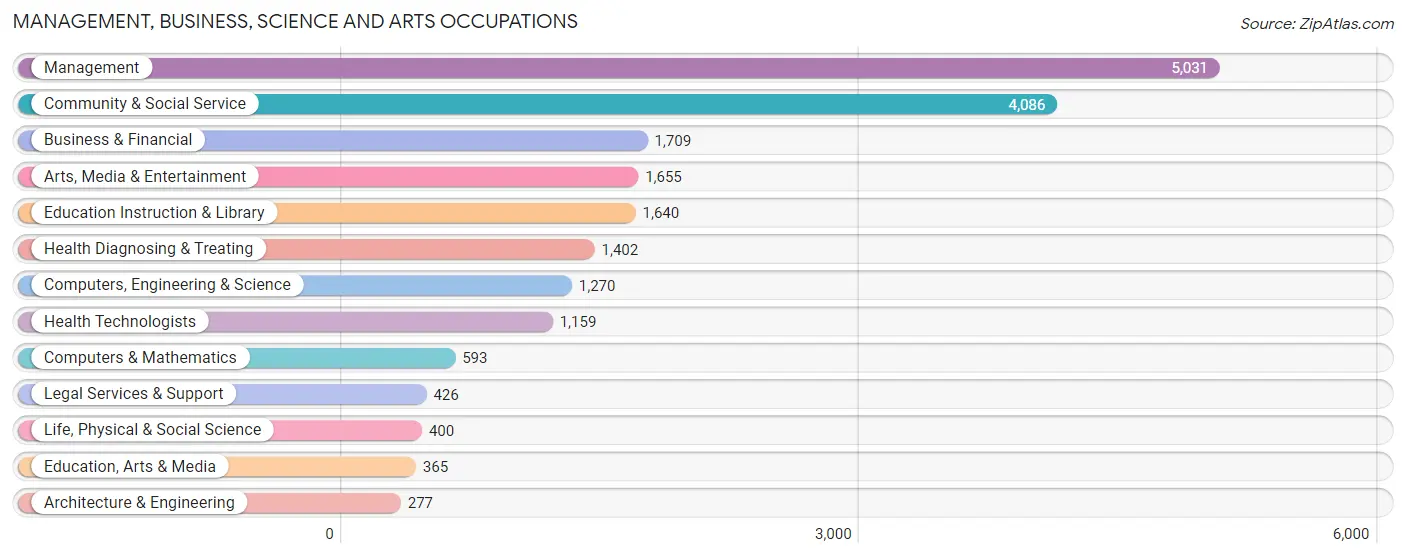
Management, Business, Science and Arts Occupations
The most common Management, Business, Science and Arts occupations in Eagle County are Management (5,031 | 15.7%), Community & Social Service (4,086 | 12.7%), Business & Financial (1,709 | 5.3%), Arts, Media & Entertainment (1,655 | 5.1%), and Education Instruction & Library (1,640 | 5.1%).
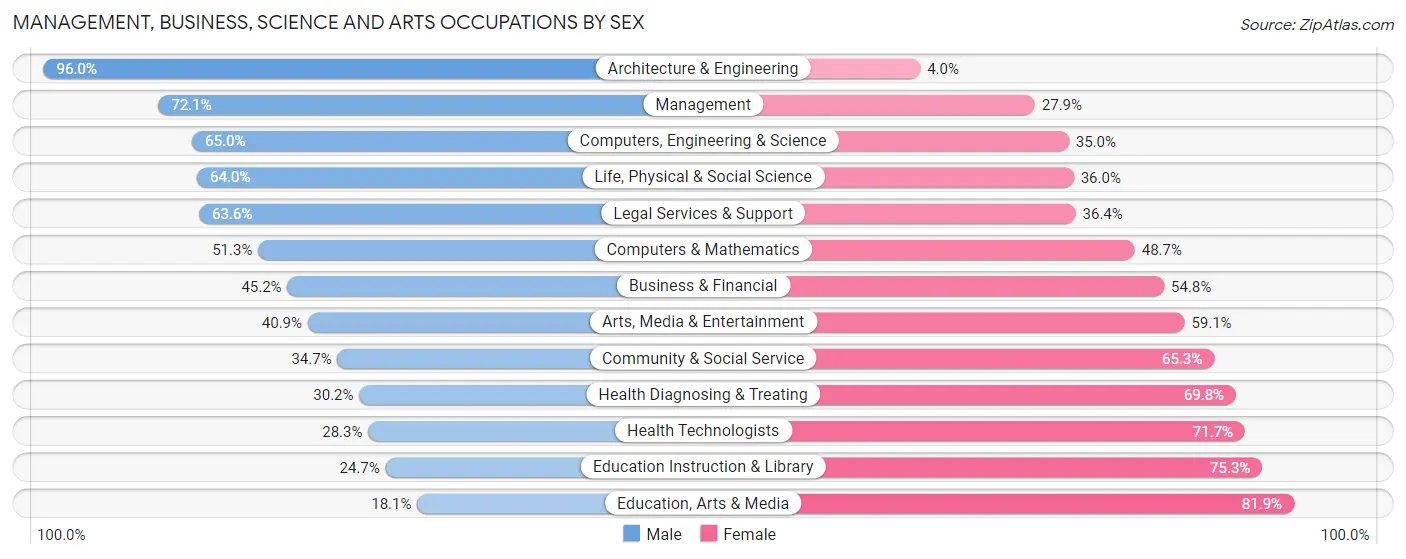
Management, Business, Science and Arts Occupations by Sex
Within the Management, Business, Science and Arts occupations in Eagle County, the most male-oriented occupations are Architecture & Engineering (96.0%), Management (72.1%), and Computers, Engineering & Science (65.0%), while the most female-oriented occupations are Education, Arts & Media (81.9%), Education Instruction & Library (75.3%), and Health Technologists (71.7%).
| Occupation | Male | Female |
| Management | 3,628 (72.1%) | 1,403 (27.9%) |
| Business & Financial | 772 (45.2%) | 937 (54.8%) |
| Computers, Engineering & Science | 826 (65.0%) | 444 (35.0%) |
| Computers & Mathematics | 304 (51.3%) | 289 (48.7%) |
| Architecture & Engineering | 266 (96.0%) | 11 (4.0%) |
| Life, Physical & Social Science | 256 (64.0%) | 144 (36.0%) |
| Community & Social Service | 1,419 (34.7%) | 2,667 (65.3%) |
| Education, Arts & Media | 66 (18.1%) | 299 (81.9%) |
| Legal Services & Support | 271 (63.6%) | 155 (36.4%) |
| Education Instruction & Library | 405 (24.7%) | 1,235 (75.3%) |
| Arts, Media & Entertainment | 677 (40.9%) | 978 (59.1%) |
| Health Diagnosing & Treating | 423 (30.2%) | 979 (69.8%) |
| Health Technologists | 328 (28.3%) | 831 (71.7%) |
| Total (Category) | 7,068 (52.4%) | 6,430 (47.6%) |
| Total (Overall) | 18,098 (56.3%) | 14,048 (43.7%) |
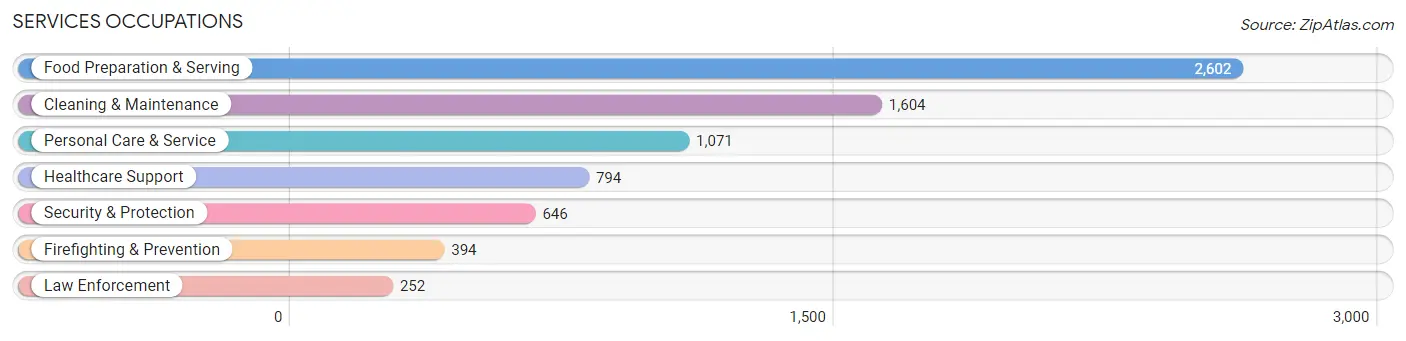
Services Occupations
The most common Services occupations in Eagle County are Food Preparation & Serving (2,602 | 8.1%), Cleaning & Maintenance (1,604 | 5.0%), Personal Care & Service (1,071 | 3.3%), Healthcare Support (794 | 2.5%), and Security & Protection (646 | 2.0%).
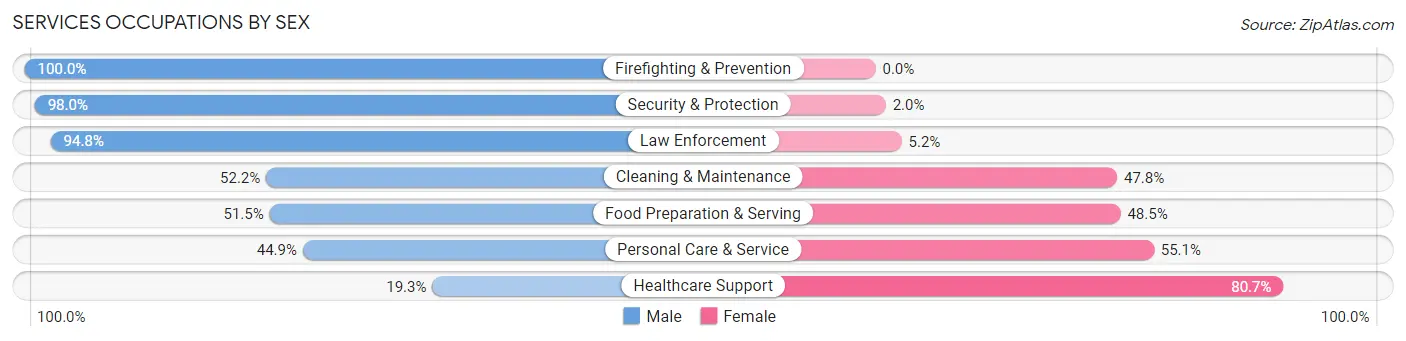
Services Occupations by Sex
Within the Services occupations in Eagle County, the most male-oriented occupations are Firefighting & Prevention (100.0%), Security & Protection (98.0%), and Law Enforcement (94.8%), while the most female-oriented occupations are Healthcare Support (80.7%), Personal Care & Service (55.1%), and Food Preparation & Serving (48.5%).
| Occupation | Male | Female |
| Healthcare Support | 153 (19.3%) | 641 (80.7%) |
| Security & Protection | 633 (98.0%) | 13 (2.0%) |
| Firefighting & Prevention | 394 (100.0%) | 0 (0.0%) |
| Law Enforcement | 239 (94.8%) | 13 (5.2%) |
| Food Preparation & Serving | 1,340 (51.5%) | 1,262 (48.5%) |
| Cleaning & Maintenance | 837 (52.2%) | 767 (47.8%) |
| Personal Care & Service | 481 (44.9%) | 590 (55.1%) |
| Total (Category) | 3,444 (51.3%) | 3,273 (48.7%) |
| Total (Overall) | 18,098 (56.3%) | 14,048 (43.7%) |
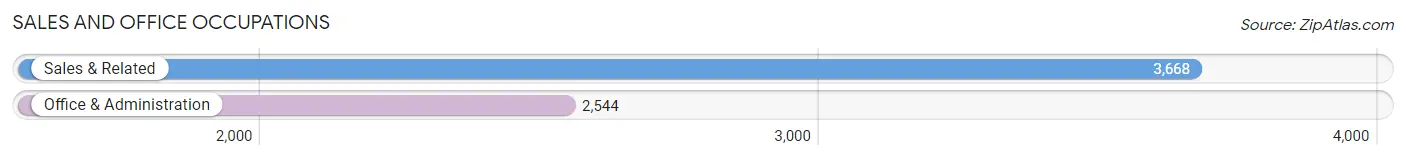
Sales and Office Occupations
The most common Sales and Office occupations in Eagle County are Sales & Related (3,668 | 11.4%), and Office & Administration (2,544 | 7.9%).
Sales and Office Occupations by Sex

| Occupation | Male | Female |
| Sales & Related | 1,909 (52.0%) | 1,759 (48.0%) |
| Office & Administration | 697 (27.4%) | 1,847 (72.6%) |
| Total (Category) | 2,606 (41.9%) | 3,606 (58.1%) |
| Total (Overall) | 18,098 (56.3%) | 14,048 (43.7%) |
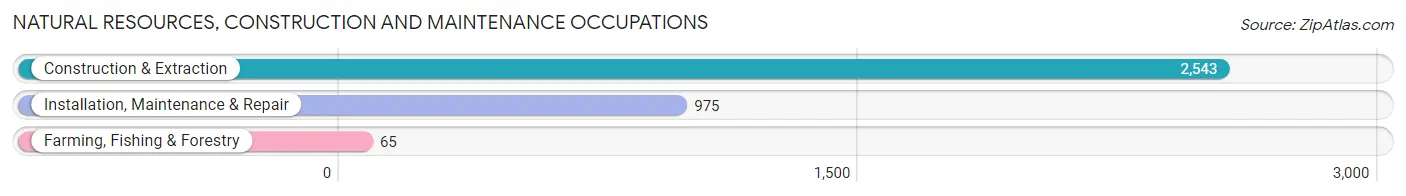
Natural Resources, Construction and Maintenance Occupations
The most common Natural Resources, Construction and Maintenance occupations in Eagle County are Construction & Extraction (2,543 | 7.9%), Installation, Maintenance & Repair (975 | 3.0%), and Farming, Fishing & Forestry (65 | 0.2%).
Natural Resources, Construction and Maintenance Occupations by Sex
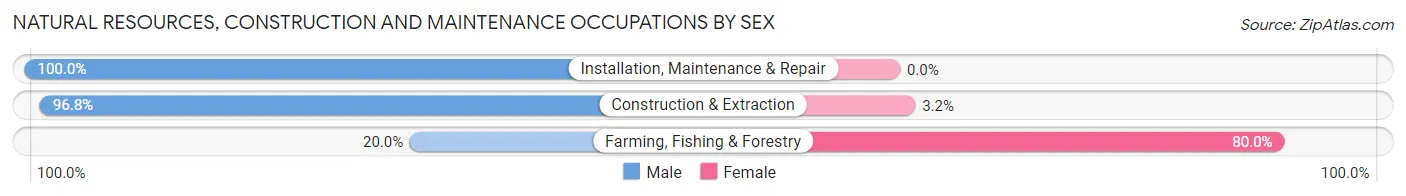
| Occupation | Male | Female |
| Farming, Fishing & Forestry | 13 (20.0%) | 52 (80.0%) |
| Construction & Extraction | 2,462 (96.8%) | 81 (3.2%) |
| Installation, Maintenance & Repair | 975 (100.0%) | 0 (0.0%) |
| Total (Category) | 3,450 (96.3%) | 133 (3.7%) |
| Total (Overall) | 18,098 (56.3%) | 14,048 (43.7%) |
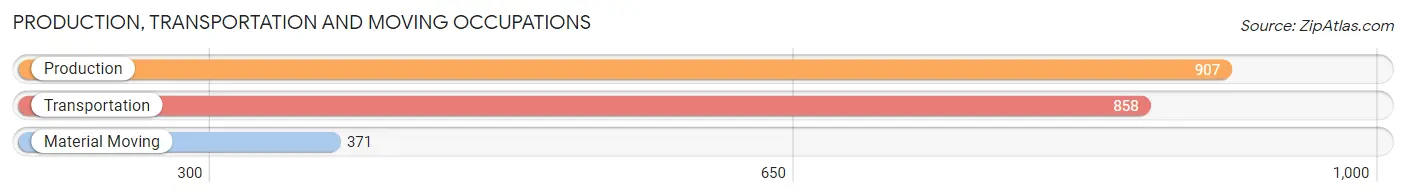
Production, Transportation and Moving Occupations
The most common Production, Transportation and Moving occupations in Eagle County are Production (907 | 2.8%), Transportation (858 | 2.7%), and Material Moving (371 | 1.1%).
Production, Transportation and Moving Occupations by Sex

| Occupation | Male | Female |
| Production | 640 (70.6%) | 267 (29.4%) |
| Transportation | 663 (77.3%) | 195 (22.7%) |
| Material Moving | 227 (61.2%) | 144 (38.8%) |
| Total (Category) | 1,530 (71.6%) | 606 (28.4%) |
| Total (Overall) | 18,098 (56.3%) | 14,048 (43.7%) |
Employment Industries by Sex in Eagle County
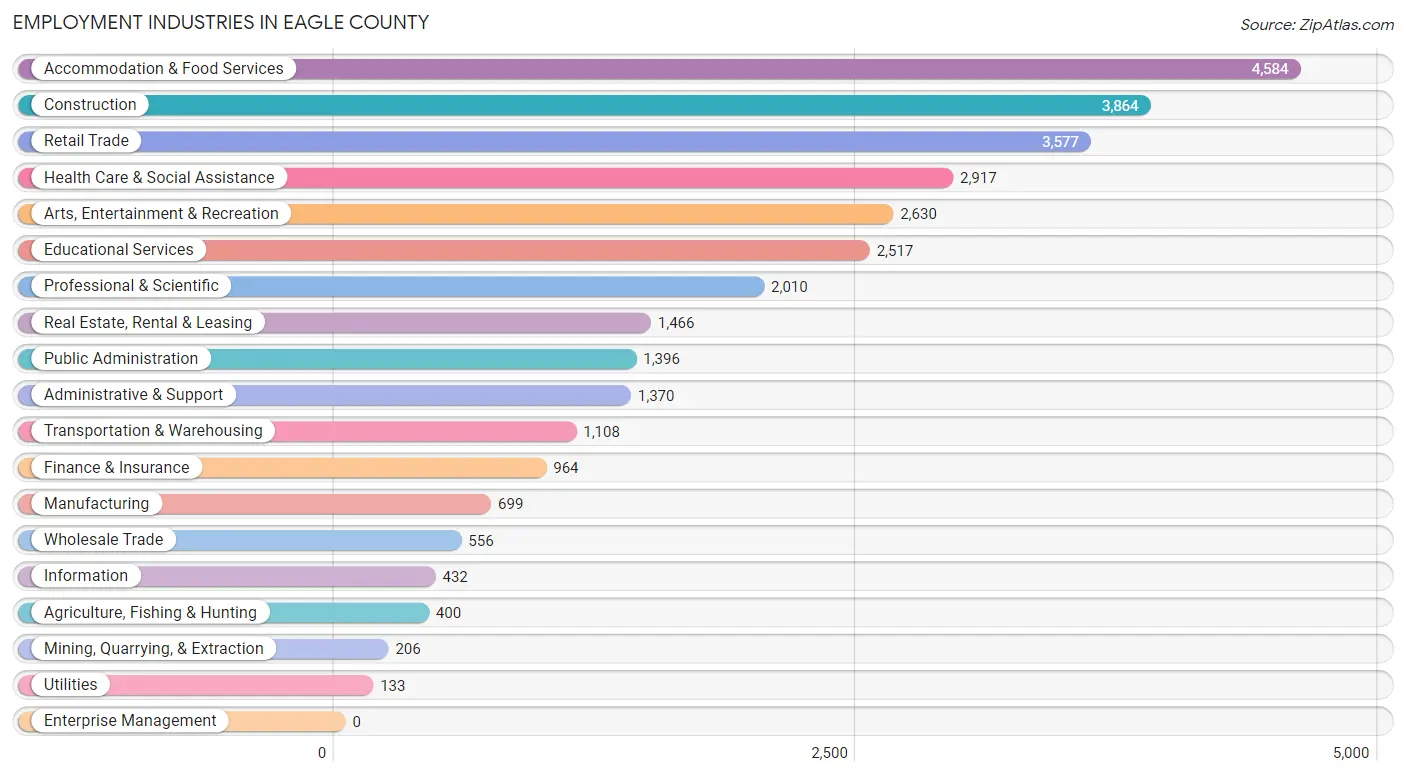
Employment Industries in Eagle County
The major employment industries in Eagle County include Accommodation & Food Services (4,584 | 14.3%), Construction (3,864 | 12.0%), Retail Trade (3,577 | 11.1%), Health Care & Social Assistance (2,917 | 9.1%), and Arts, Entertainment & Recreation (2,630 | 8.2%).
Employment Industries by Sex in Eagle County
The Eagle County industries that see more men than women are Mining, Quarrying, & Extraction (100.0%), Utilities (100.0%), and Construction (92.5%), whereas the industries that tend to have a higher number of women are Educational Services (74.7%), Health Care & Social Assistance (70.7%), and Manufacturing (50.9%).
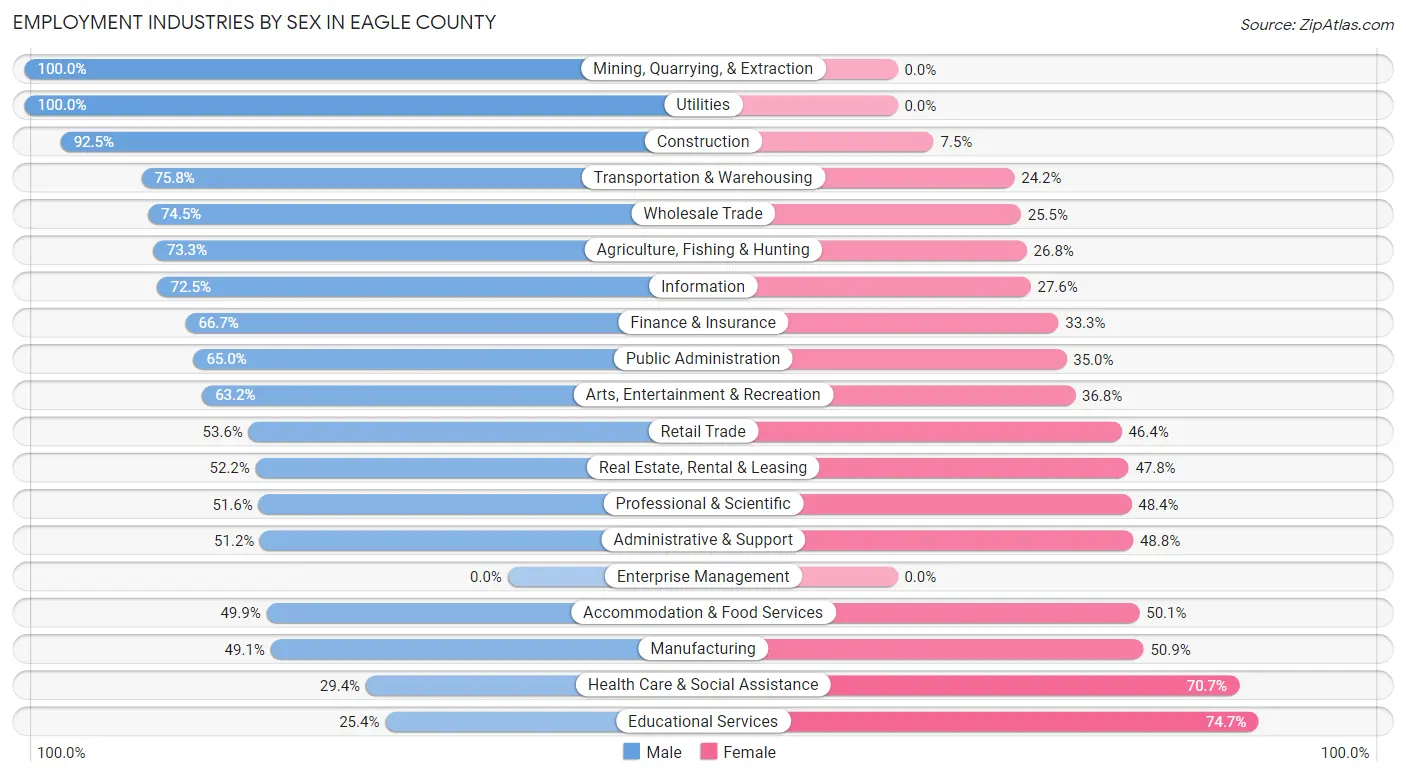
| Industry | Male | Female |
| Agriculture, Fishing & Hunting | 293 (73.3%) | 107 (26.8%) |
| Mining, Quarrying, & Extraction | 206 (100.0%) | 0 (0.0%) |
| Construction | 3,575 (92.5%) | 289 (7.5%) |
| Manufacturing | 343 (49.1%) | 356 (50.9%) |
| Wholesale Trade | 414 (74.5%) | 142 (25.5%) |
| Retail Trade | 1,918 (53.6%) | 1,659 (46.4%) |
| Transportation & Warehousing | 840 (75.8%) | 268 (24.2%) |
| Utilities | 133 (100.0%) | 0 (0.0%) |
| Information | 313 (72.5%) | 119 (27.6%) |
| Finance & Insurance | 643 (66.7%) | 321 (33.3%) |
| Real Estate, Rental & Leasing | 765 (52.2%) | 701 (47.8%) |
| Professional & Scientific | 1,037 (51.6%) | 973 (48.4%) |
| Enterprise Management | 0 (0.0%) | 0 (0.0%) |
| Administrative & Support | 702 (51.2%) | 668 (48.8%) |
| Educational Services | 638 (25.4%) | 1,879 (74.7%) |
| Health Care & Social Assistance | 856 (29.3%) | 2,061 (70.7%) |
| Arts, Entertainment & Recreation | 1,663 (63.2%) | 967 (36.8%) |
| Accommodation & Food Services | 2,289 (49.9%) | 2,295 (50.1%) |
| Public Administration | 908 (65.0%) | 488 (35.0%) |
| Total | 18,098 (56.3%) | 14,048 (43.7%) |
Education in Eagle County
School Enrollment in Eagle County
The most common levels of schooling among the 12,180 students in Eagle County are high school (3,031 | 24.9%), middle school (2,499 | 20.5%), and elementary school (2,416 | 19.8%).
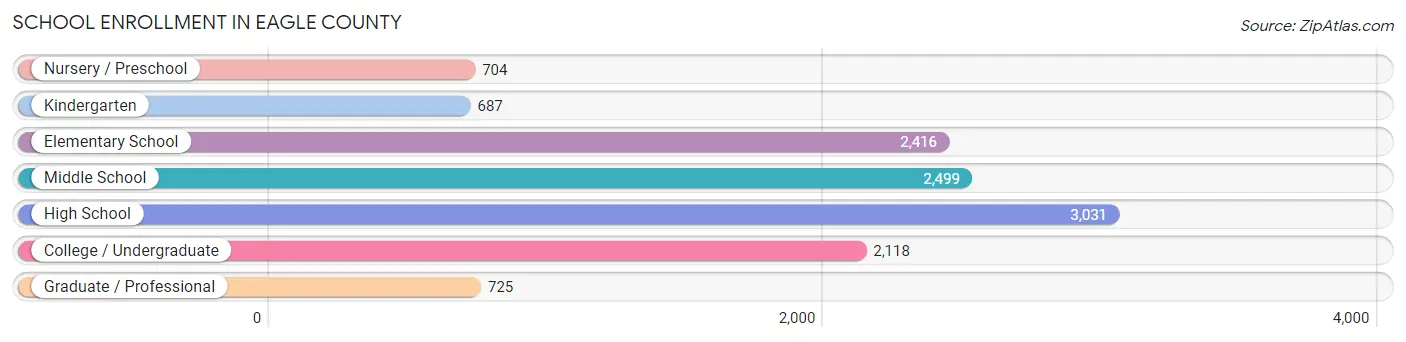
| School Level | # Students | % Students |
| Nursery / Preschool | 704 | 5.8% |
| Kindergarten | 687 | 5.6% |
| Elementary School | 2,416 | 19.8% |
| Middle School | 2,499 | 20.5% |
| High School | 3,031 | 24.9% |
| College / Undergraduate | 2,118 | 17.4% |
| Graduate / Professional | 725 | 5.9% |
| Total | 12,180 | 100.0% |
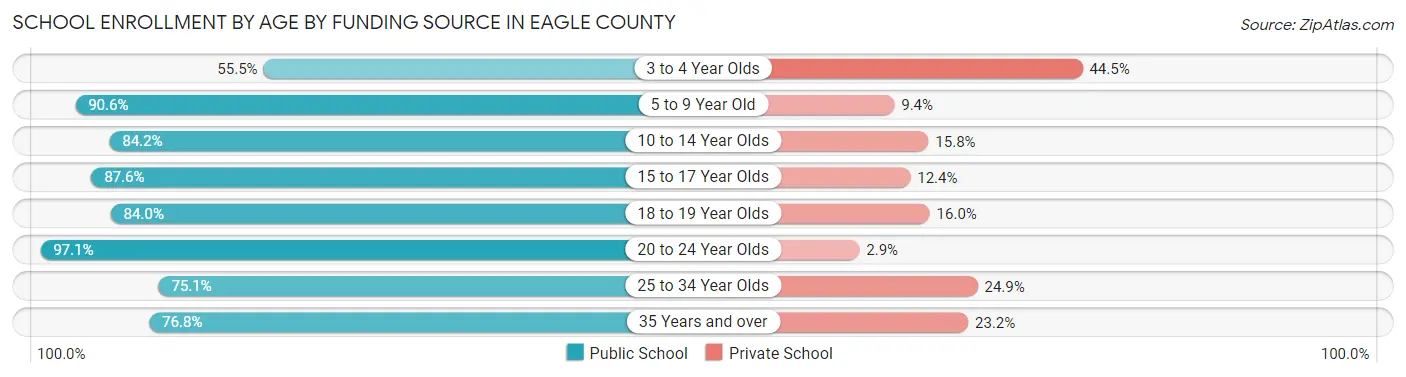
School Enrollment by Age by Funding Source in Eagle County
Out of a total of 12,180 students who are enrolled in schools in Eagle County, 1,864 (15.3%) attend a private institution, while the remaining 10,316 (84.7%) are enrolled in public schools. The age group of 3 to 4 year olds has the highest likelihood of being enrolled in private schools, with 274 (44.5% in the age bracket) enrolled. Conversely, the age group of 20 to 24 year olds has the lowest likelihood of being enrolled in a private school, with 698 (97.1% in the age bracket) attending a public institution.
| Age Bracket | Public School | Private School |
| 3 to 4 Year Olds | 342 (55.5%) | 274 (44.5%) |
| 5 to 9 Year Old | 2,594 (90.6%) | 270 (9.4%) |
| 10 to 14 Year Olds | 2,636 (84.2%) | 494 (15.8%) |
| 15 to 17 Year Olds | 1,899 (87.6%) | 269 (12.4%) |
| 18 to 19 Year Olds | 1,064 (84.0%) | 203 (16.0%) |
| 20 to 24 Year Olds | 698 (97.1%) | 21 (2.9%) |
| 25 to 34 Year Olds | 331 (75.1%) | 110 (24.9%) |
| 35 Years and over | 749 (76.8%) | 226 (23.2%) |
| Total | 10,316 (84.7%) | 1,864 (15.3%) |
Educational Attainment by Field of Study in Eagle County
Business (4,447 | 19.6%), social sciences (2,043 | 9.0%), education (1,965 | 8.7%), science & technology (1,752 | 7.7%), and psychology (1,681 | 7.4%) are the most common fields of study among 22,658 individuals in Eagle County who have obtained a bachelor's degree or higher.
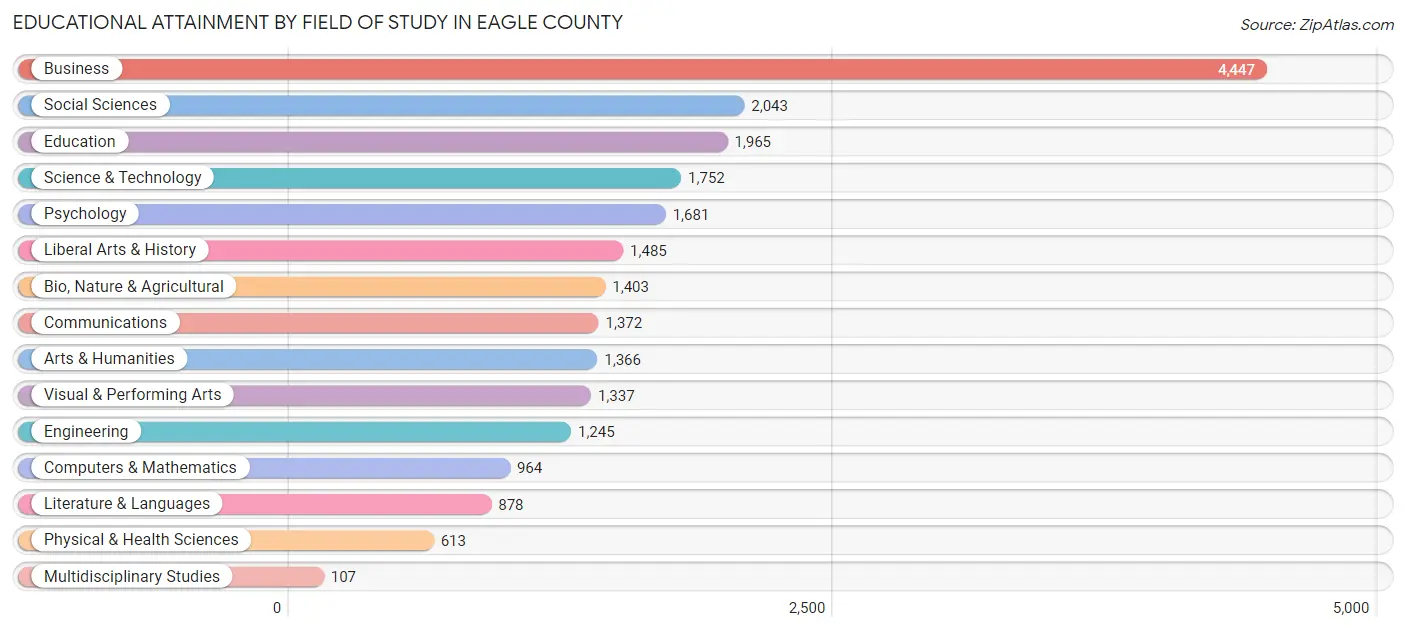
| Field of Study | # Graduates | % Graduates |
| Computers & Mathematics | 964 | 4.3% |
| Bio, Nature & Agricultural | 1,403 | 6.2% |
| Physical & Health Sciences | 613 | 2.7% |
| Psychology | 1,681 | 7.4% |
| Social Sciences | 2,043 | 9.0% |
| Engineering | 1,245 | 5.5% |
| Multidisciplinary Studies | 107 | 0.5% |
| Science & Technology | 1,752 | 7.7% |
| Business | 4,447 | 19.6% |
| Education | 1,965 | 8.7% |
| Literature & Languages | 878 | 3.9% |
| Liberal Arts & History | 1,485 | 6.6% |
| Visual & Performing Arts | 1,337 | 5.9% |
| Communications | 1,372 | 6.1% |
| Arts & Humanities | 1,366 | 6.0% |
| Total | 22,658 | 100.0% |
Transportation & Commute in Eagle County
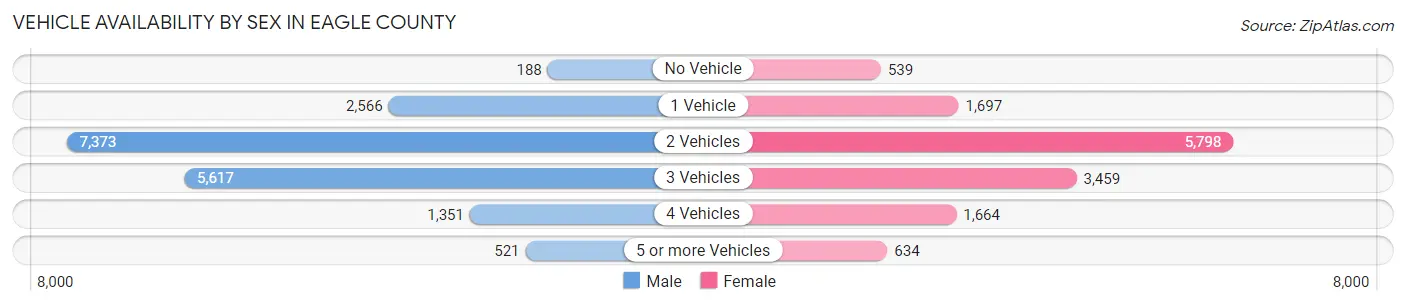
Vehicle Availability by Sex in Eagle County
The most prevalent vehicle ownership categories in Eagle County are males with 2 vehicles (7,373, accounting for 41.8%) and females with 2 vehicles (5,798, making up 53.5%).
| Vehicles Available | Male | Female |
| No Vehicle | 188 (1.1%) | 539 (3.9%) |
| 1 Vehicle | 2,566 (14.6%) | 1,697 (12.3%) |
| 2 Vehicles | 7,373 (41.8%) | 5,798 (42.0%) |
| 3 Vehicles | 5,617 (31.9%) | 3,459 (25.1%) |
| 4 Vehicles | 1,351 (7.7%) | 1,664 (12.1%) |
| 5 or more Vehicles | 521 (3.0%) | 634 (4.6%) |
| Total | 17,616 (100.0%) | 13,791 (100.0%) |
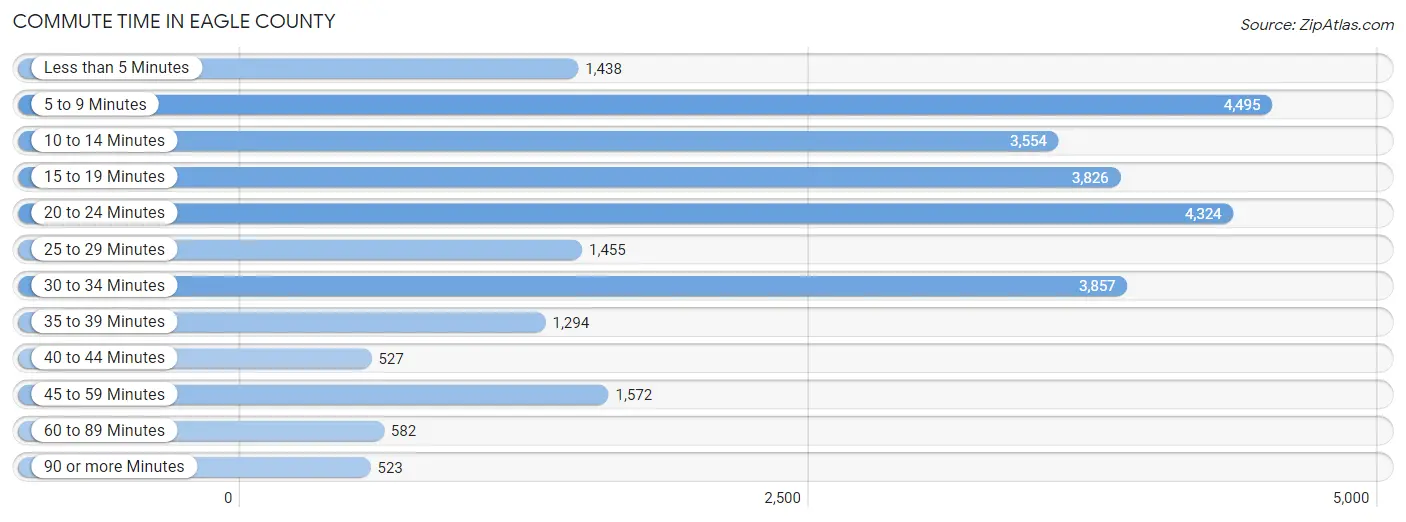
Commute Time in Eagle County
The most frequently occuring commute durations in Eagle County are 5 to 9 minutes (4,495 commuters, 16.4%), 20 to 24 minutes (4,324 commuters, 15.8%), and 30 to 34 minutes (3,857 commuters, 14.1%).
| Commute Time | # Commuters | % Commuters |
| Less than 5 Minutes | 1,438 | 5.2% |
| 5 to 9 Minutes | 4,495 | 16.4% |
| 10 to 14 Minutes | 3,554 | 13.0% |
| 15 to 19 Minutes | 3,826 | 13.9% |
| 20 to 24 Minutes | 4,324 | 15.8% |
| 25 to 29 Minutes | 1,455 | 5.3% |
| 30 to 34 Minutes | 3,857 | 14.1% |
| 35 to 39 Minutes | 1,294 | 4.7% |
| 40 to 44 Minutes | 527 | 1.9% |
| 45 to 59 Minutes | 1,572 | 5.7% |
| 60 to 89 Minutes | 582 | 2.1% |
| 90 or more Minutes | 523 | 1.9% |
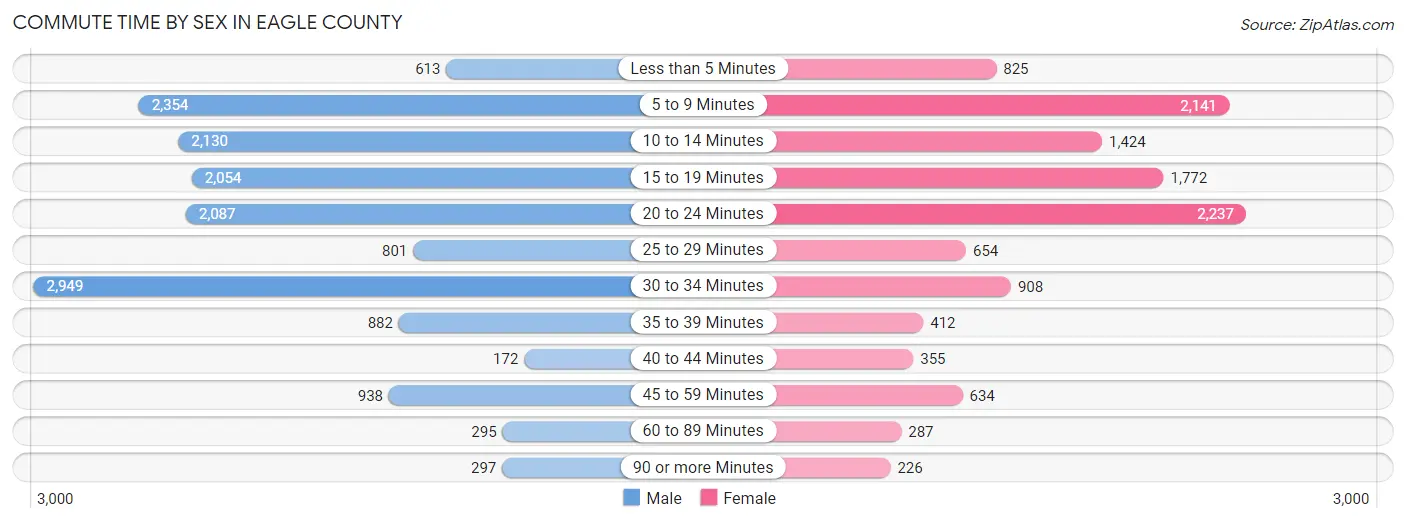
Commute Time by Sex in Eagle County
The most common commute times in Eagle County are 30 to 34 minutes (2,949 commuters, 18.9%) for males and 20 to 24 minutes (2,237 commuters, 18.8%) for females.
| Commute Time | Male | Female |
| Less than 5 Minutes | 613 (3.9%) | 825 (7.0%) |
| 5 to 9 Minutes | 2,354 (15.1%) | 2,141 (18.0%) |
| 10 to 14 Minutes | 2,130 (13.7%) | 1,424 (12.0%) |
| 15 to 19 Minutes | 2,054 (13.2%) | 1,772 (14.9%) |
| 20 to 24 Minutes | 2,087 (13.4%) | 2,237 (18.8%) |
| 25 to 29 Minutes | 801 (5.1%) | 654 (5.5%) |
| 30 to 34 Minutes | 2,949 (18.9%) | 908 (7.6%) |
| 35 to 39 Minutes | 882 (5.7%) | 412 (3.5%) |
| 40 to 44 Minutes | 172 (1.1%) | 355 (3.0%) |
| 45 to 59 Minutes | 938 (6.0%) | 634 (5.3%) |
| 60 to 89 Minutes | 295 (1.9%) | 287 (2.4%) |
| 90 or more Minutes | 297 (1.9%) | 226 (1.9%) |
Time of Departure to Work by Sex in Eagle County
The most frequent times of departure to work in Eagle County are 7:00 AM to 7:29 AM (2,764, 17.7%) for males and 7:30 AM to 7:59 AM (2,674, 22.5%) for females.
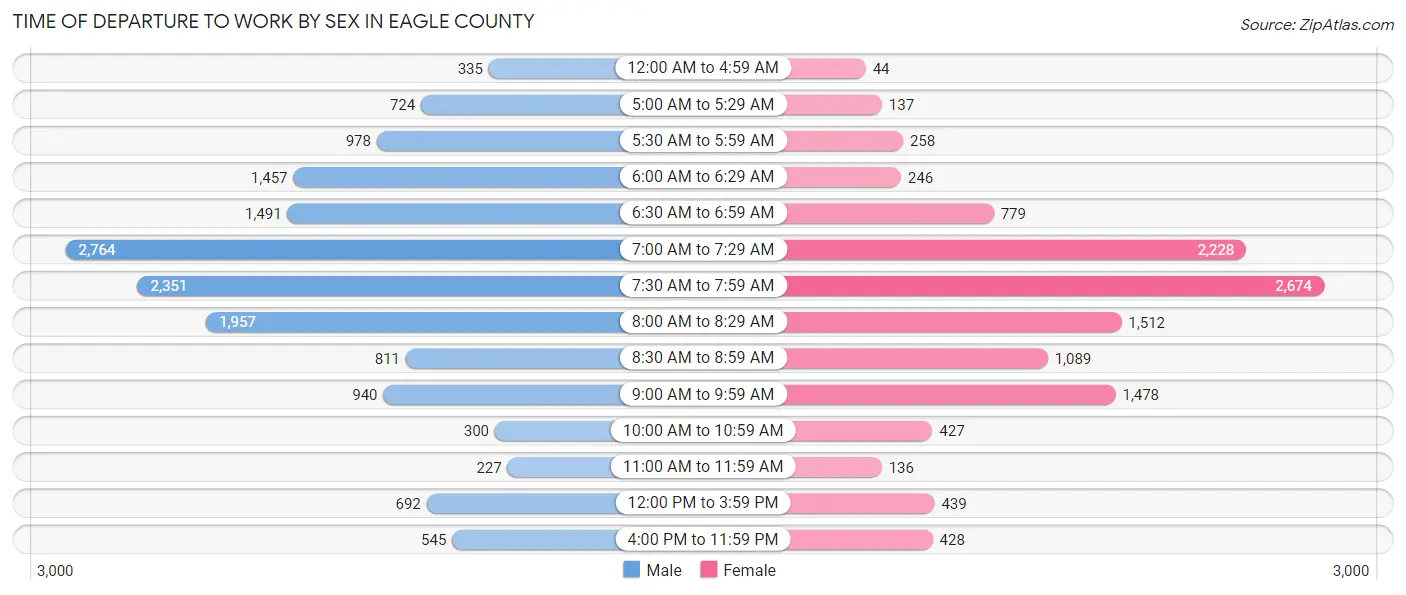
| Time of Departure | Male | Female |
| 12:00 AM to 4:59 AM | 335 (2.1%) | 44 (0.4%) |
| 5:00 AM to 5:29 AM | 724 (4.6%) | 137 (1.1%) |
| 5:30 AM to 5:59 AM | 978 (6.3%) | 258 (2.2%) |
| 6:00 AM to 6:29 AM | 1,457 (9.4%) | 246 (2.1%) |
| 6:30 AM to 6:59 AM | 1,491 (9.6%) | 779 (6.6%) |
| 7:00 AM to 7:29 AM | 2,764 (17.7%) | 2,228 (18.8%) |
| 7:30 AM to 7:59 AM | 2,351 (15.1%) | 2,674 (22.5%) |
| 8:00 AM to 8:29 AM | 1,957 (12.6%) | 1,512 (12.7%) |
| 8:30 AM to 8:59 AM | 811 (5.2%) | 1,089 (9.2%) |
| 9:00 AM to 9:59 AM | 940 (6.0%) | 1,478 (12.4%) |
| 10:00 AM to 10:59 AM | 300 (1.9%) | 427 (3.6%) |
| 11:00 AM to 11:59 AM | 227 (1.5%) | 136 (1.1%) |
| 12:00 PM to 3:59 PM | 692 (4.4%) | 439 (3.7%) |
| 4:00 PM to 11:59 PM | 545 (3.5%) | 428 (3.6%) |
| Total | 15,572 (100.0%) | 11,875 (100.0%) |
Housing Occupancy in Eagle County
Occupancy by Ownership in Eagle County
Of the total 20,084 dwellings in Eagle County, owner-occupied units account for 13,774 (68.6%), while renter-occupied units make up 6,310 (31.4%).
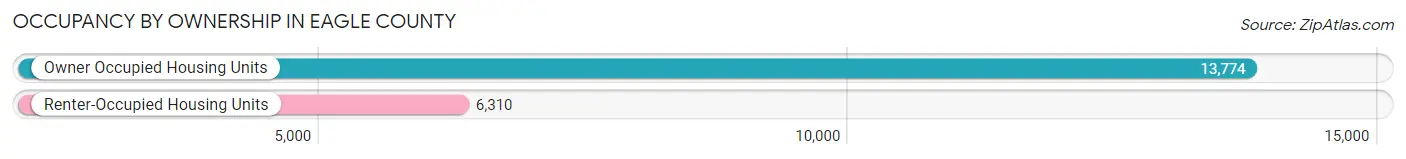
| Occupancy | # Housing Units | % Housing Units |
| Owner Occupied Housing Units | 13,774 | 68.6% |
| Renter-Occupied Housing Units | 6,310 | 31.4% |
| Total Occupied Housing Units | 20,084 | 100.0% |
Occupancy by Household Size in Eagle County
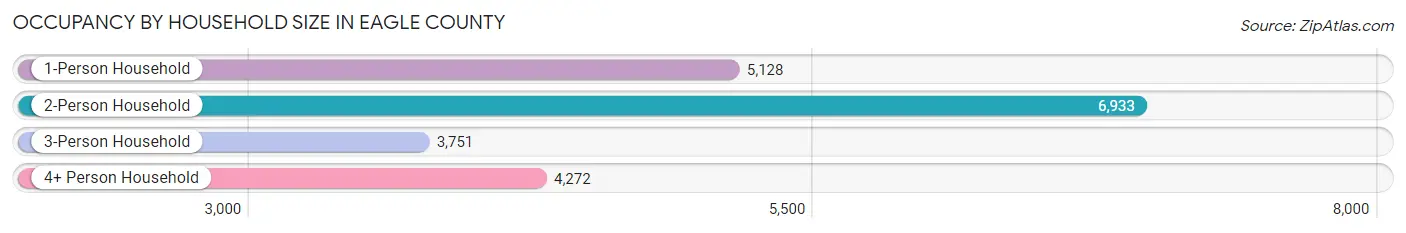
| Household Size | # Housing Units | % Housing Units |
| 1-Person Household | 5,128 | 25.5% |
| 2-Person Household | 6,933 | 34.5% |
| 3-Person Household | 3,751 | 18.7% |
| 4+ Person Household | 4,272 | 21.3% |
| Total Housing Units | 20,084 | 100.0% |
Occupancy by Ownership by Household Size in Eagle County
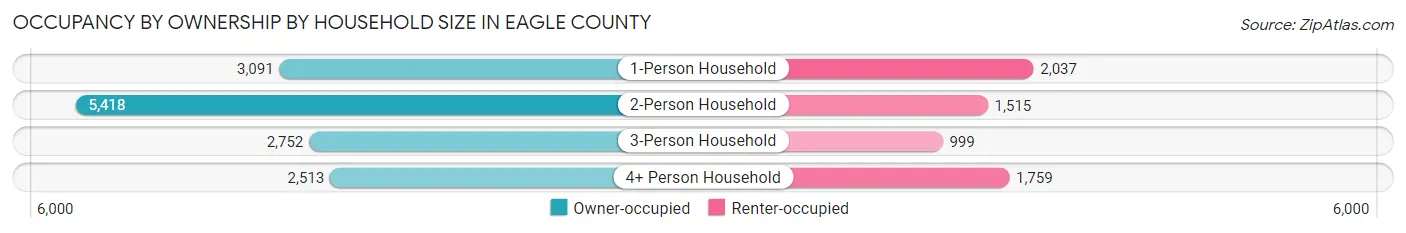
| Household Size | Owner-occupied | Renter-occupied |
| 1-Person Household | 3,091 (60.3%) | 2,037 (39.7%) |
| 2-Person Household | 5,418 (78.1%) | 1,515 (21.8%) |
| 3-Person Household | 2,752 (73.4%) | 999 (26.6%) |
| 4+ Person Household | 2,513 (58.8%) | 1,759 (41.2%) |
| Total Housing Units | 13,774 (68.6%) | 6,310 (31.4%) |
Occupancy by Educational Attainment in Eagle County
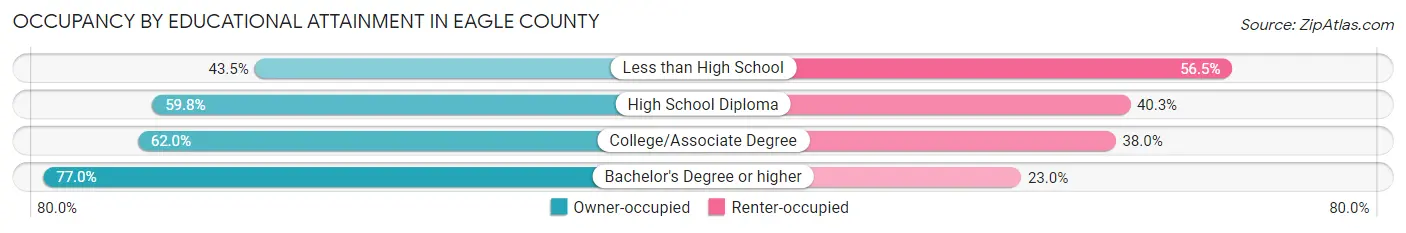
| Household Size | Owner-occupied | Renter-occupied |
| Less than High School | 515 (43.5%) | 668 (56.5%) |
| High School Diploma | 1,875 (59.8%) | 1,263 (40.3%) |
| College/Associate Degree | 3,138 (62.0%) | 1,920 (38.0%) |
| Bachelor's Degree or higher | 8,246 (77.0%) | 2,459 (23.0%) |
Occupancy by Age of Householder in Eagle County
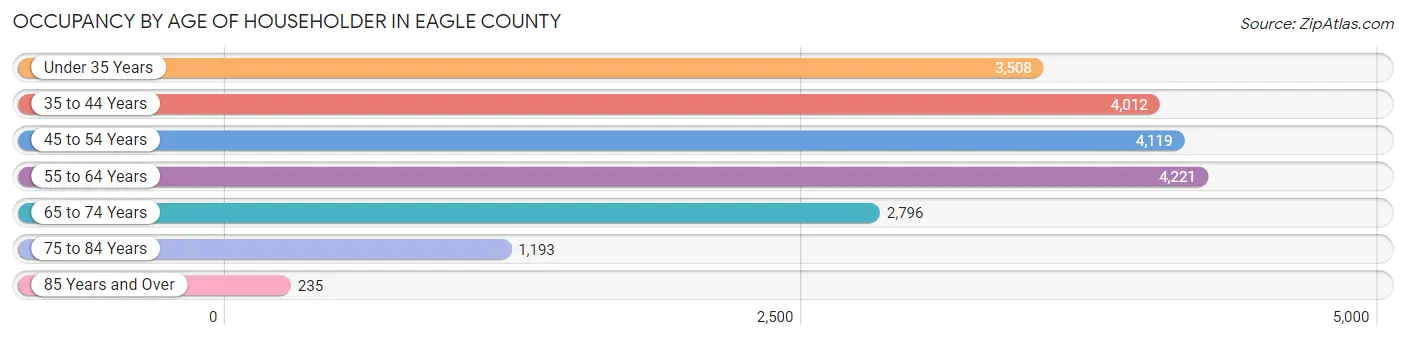
| Age Bracket | # Households | % Households |
| Under 35 Years | 3,508 | 17.5% |
| 35 to 44 Years | 4,012 | 20.0% |
| 45 to 54 Years | 4,119 | 20.5% |
| 55 to 64 Years | 4,221 | 21.0% |
| 65 to 74 Years | 2,796 | 13.9% |
| 75 to 84 Years | 1,193 | 5.9% |
| 85 Years and Over | 235 | 1.2% |
| Total | 20,084 | 100.0% |
Housing Finances in Eagle County
Median Income by Occupancy in Eagle County
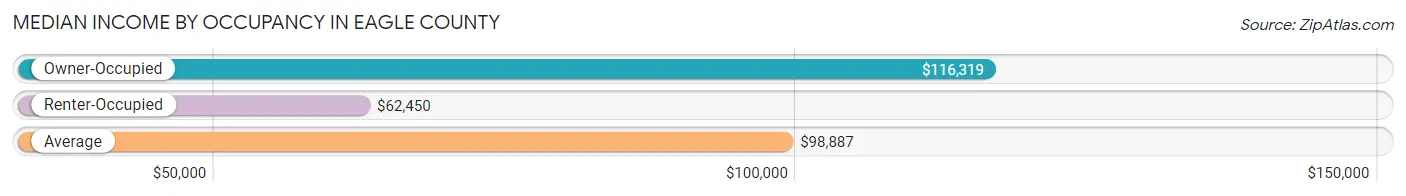
| Occupancy Type | # Households | Median Income |
| Owner-Occupied | 13,774 (68.6%) | $116,319 |
| Renter-Occupied | 6,310 (31.4%) | $62,450 |
| Average | 20,084 (100.0%) | $98,887 |
Occupancy by Householder Income Bracket in Eagle County
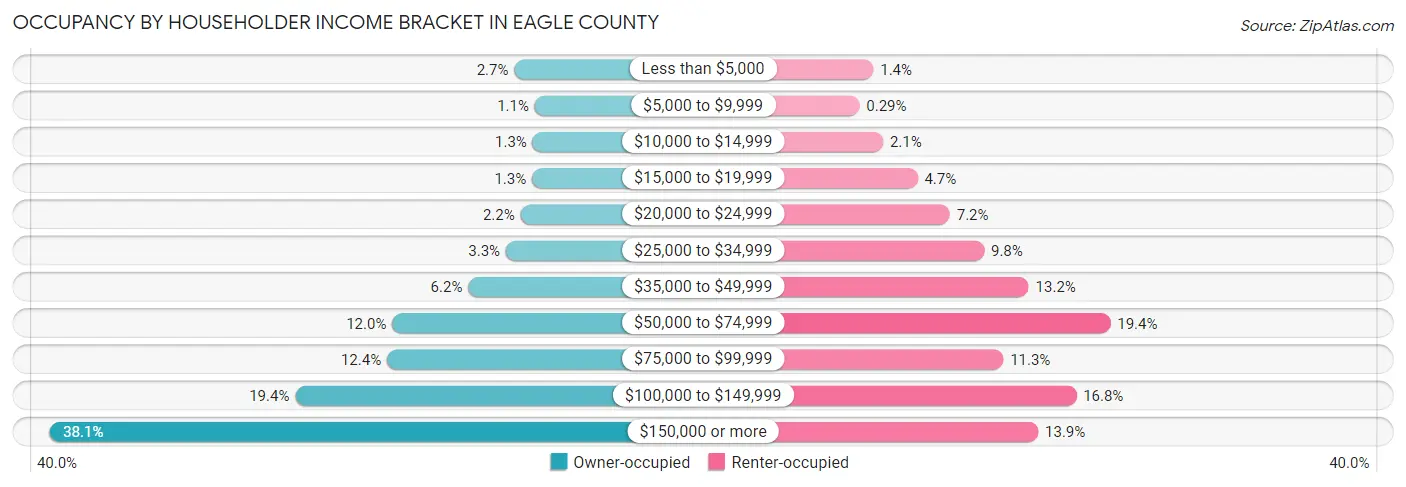
| Income Bracket | Owner-occupied | Renter-occupied |
| Less than $5,000 | 371 (2.7%) | 85 (1.3%) |
| $5,000 to $9,999 | 155 (1.1%) | 18 (0.3%) |
| $10,000 to $14,999 | 178 (1.3%) | 132 (2.1%) |
| $15,000 to $19,999 | 184 (1.3%) | 298 (4.7%) |
| $20,000 to $24,999 | 304 (2.2%) | 453 (7.2%) |
| $25,000 to $34,999 | 458 (3.3%) | 618 (9.8%) |
| $35,000 to $49,999 | 854 (6.2%) | 832 (13.2%) |
| $50,000 to $74,999 | 1,651 (12.0%) | 1,225 (19.4%) |
| $75,000 to $99,999 | 1,707 (12.4%) | 710 (11.3%) |
| $100,000 to $149,999 | 2,670 (19.4%) | 1,061 (16.8%) |
| $150,000 or more | 5,242 (38.1%) | 878 (13.9%) |
| Total | 13,774 (100.0%) | 6,310 (100.0%) |
Monthly Housing Cost Tiers in Eagle County
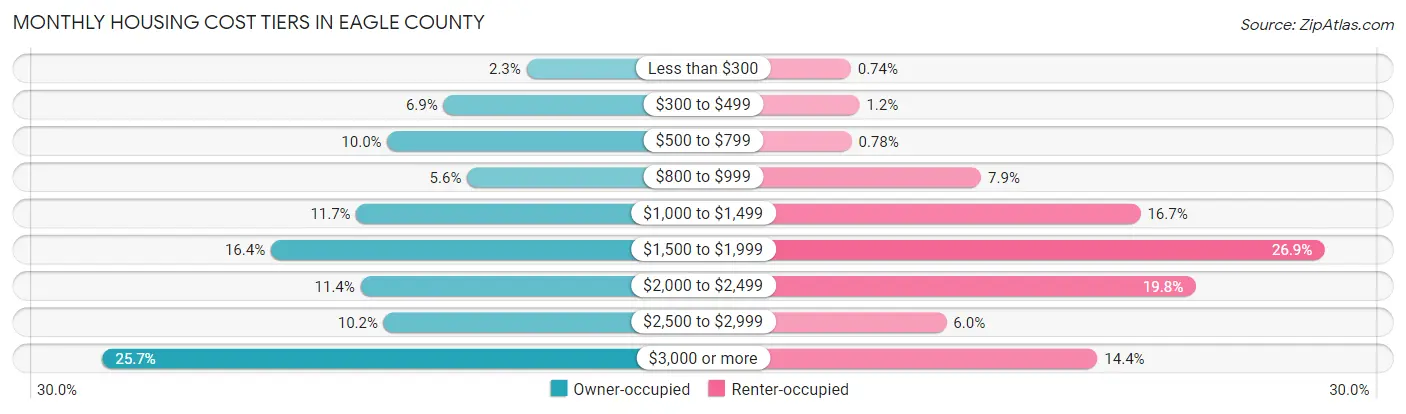
| Monthly Cost | Owner-occupied | Renter-occupied |
| Less than $300 | 313 (2.3%) | 47 (0.7%) |
| $300 to $499 | 945 (6.9%) | 77 (1.2%) |
| $500 to $799 | 1,372 (10.0%) | 49 (0.8%) |
| $800 to $999 | 764 (5.6%) | 501 (7.9%) |
| $1,000 to $1,499 | 1,607 (11.7%) | 1,056 (16.7%) |
| $1,500 to $1,999 | 2,258 (16.4%) | 1,696 (26.9%) |
| $2,000 to $2,499 | 1,576 (11.4%) | 1,246 (19.8%) |
| $2,500 to $2,999 | 1,399 (10.2%) | 380 (6.0%) |
| $3,000 or more | 3,540 (25.7%) | 906 (14.4%) |
| Total | 13,774 (100.0%) | 6,310 (100.0%) |
Physical Housing Characteristics in Eagle County
Housing Structures in Eagle County
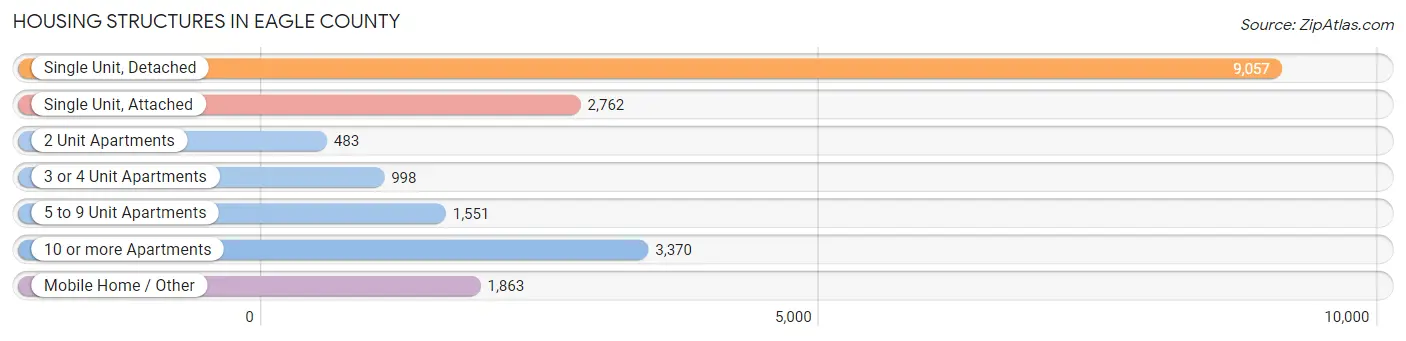
| Structure Type | # Housing Units | % Housing Units |
| Single Unit, Detached | 9,057 | 45.1% |
| Single Unit, Attached | 2,762 | 13.8% |
| 2 Unit Apartments | 483 | 2.4% |
| 3 or 4 Unit Apartments | 998 | 5.0% |
| 5 to 9 Unit Apartments | 1,551 | 7.7% |
| 10 or more Apartments | 3,370 | 16.8% |
| Mobile Home / Other | 1,863 | 9.3% |
| Total | 20,084 | 100.0% |
Housing Structures by Occupancy in Eagle County
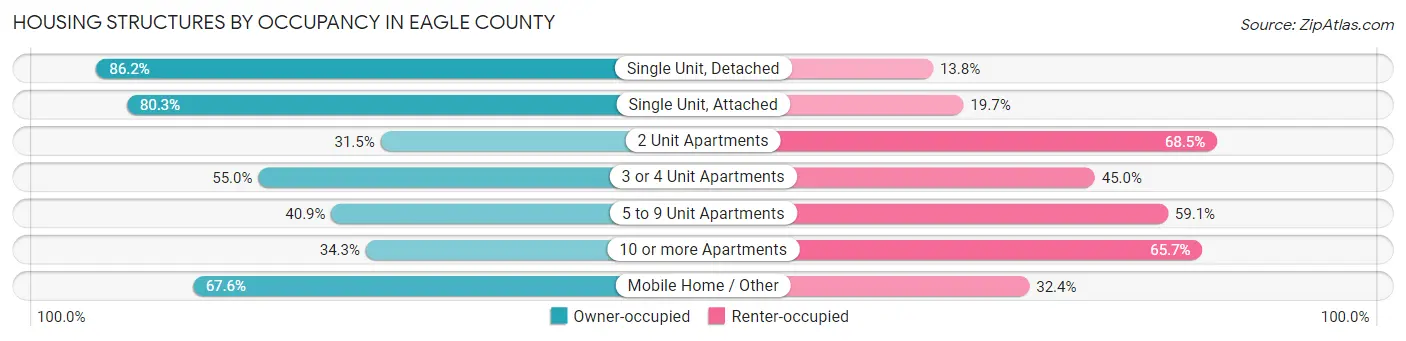
| Structure Type | Owner-occupied | Renter-occupied |
| Single Unit, Detached | 7,804 (86.2%) | 1,253 (13.8%) |
| Single Unit, Attached | 2,218 (80.3%) | 544 (19.7%) |
| 2 Unit Apartments | 152 (31.5%) | 331 (68.5%) |
| 3 or 4 Unit Apartments | 549 (55.0%) | 449 (45.0%) |
| 5 to 9 Unit Apartments | 635 (40.9%) | 916 (59.1%) |
| 10 or more Apartments | 1,156 (34.3%) | 2,214 (65.7%) |
| Mobile Home / Other | 1,260 (67.6%) | 603 (32.4%) |
| Total | 13,774 (68.6%) | 6,310 (31.4%) |
Housing Structures by Number of Rooms in Eagle County
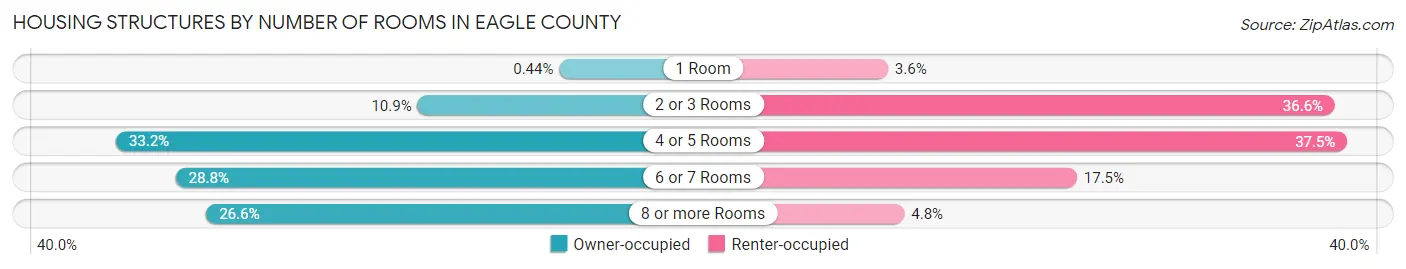
| Number of Rooms | Owner-occupied | Renter-occupied |
| 1 Room | 61 (0.4%) | 224 (3.5%) |
| 2 or 3 Rooms | 1,506 (10.9%) | 2,311 (36.6%) |
| 4 or 5 Rooms | 4,579 (33.2%) | 2,368 (37.5%) |
| 6 or 7 Rooms | 3,970 (28.8%) | 1,106 (17.5%) |
| 8 or more Rooms | 3,658 (26.6%) | 301 (4.8%) |
| Total | 13,774 (100.0%) | 6,310 (100.0%) |
Housing Structure by Heating Type in Eagle County
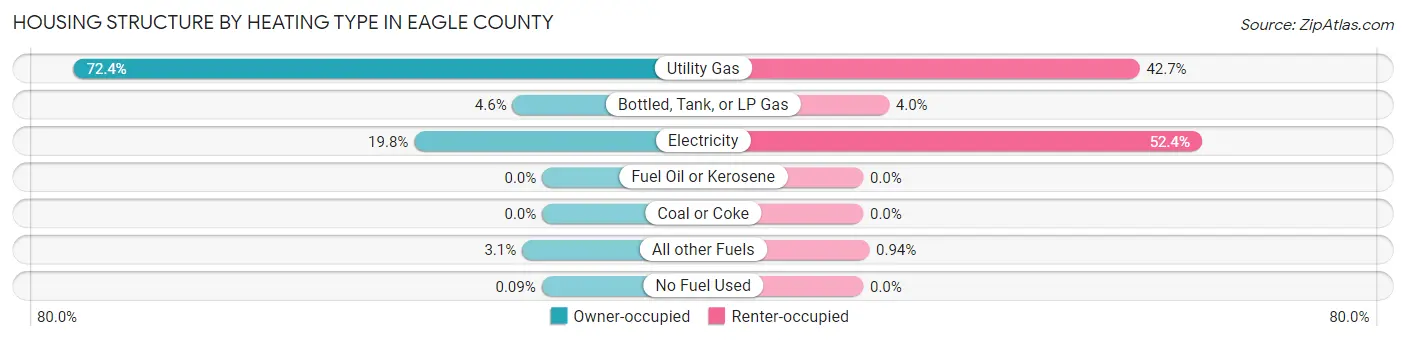
| Heating Type | Owner-occupied | Renter-occupied |
| Utility Gas | 9,978 (72.4%) | 2,696 (42.7%) |
| Bottled, Tank, or LP Gas | 631 (4.6%) | 252 (4.0%) |
| Electricity | 2,725 (19.8%) | 3,303 (52.3%) |
| Fuel Oil or Kerosene | 0 (0.0%) | 0 (0.0%) |
| Coal or Coke | 0 (0.0%) | 0 (0.0%) |
| All other Fuels | 427 (3.1%) | 59 (0.9%) |
| No Fuel Used | 13 (0.1%) | 0 (0.0%) |
| Total | 13,774 (100.0%) | 6,310 (100.0%) |
Household Vehicle Usage in Eagle County
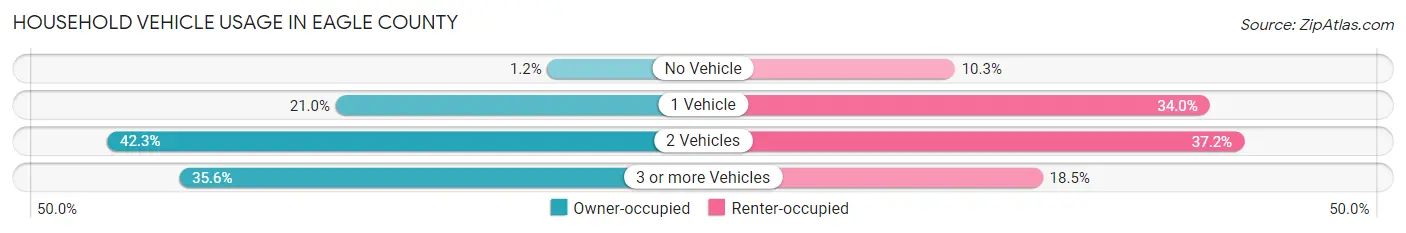
| Vehicles per Household | Owner-occupied | Renter-occupied |
| No Vehicle | 162 (1.2%) | 647 (10.2%) |
| 1 Vehicle | 2,885 (20.9%) | 2,148 (34.0%) |
| 2 Vehicles | 5,826 (42.3%) | 2,350 (37.2%) |
| 3 or more Vehicles | 4,901 (35.6%) | 1,165 (18.5%) |
| Total | 13,774 (100.0%) | 6,310 (100.0%) |
Real Estate & Mortgages in Eagle County
Real Estate and Mortgage Overview in Eagle County
| Characteristic | Without Mortgage | With Mortgage |
| Housing Units | 4,556 | 9,218 |
| Median Property Value | $788,000 | $709,700 |
| Median Household Income | $91,000 | $3,701 |
| Monthly Housing Costs | $770 | $3,437 |
| Real Estate Taxes | $2,756 | $132 |
Property Value by Mortgage Status in Eagle County
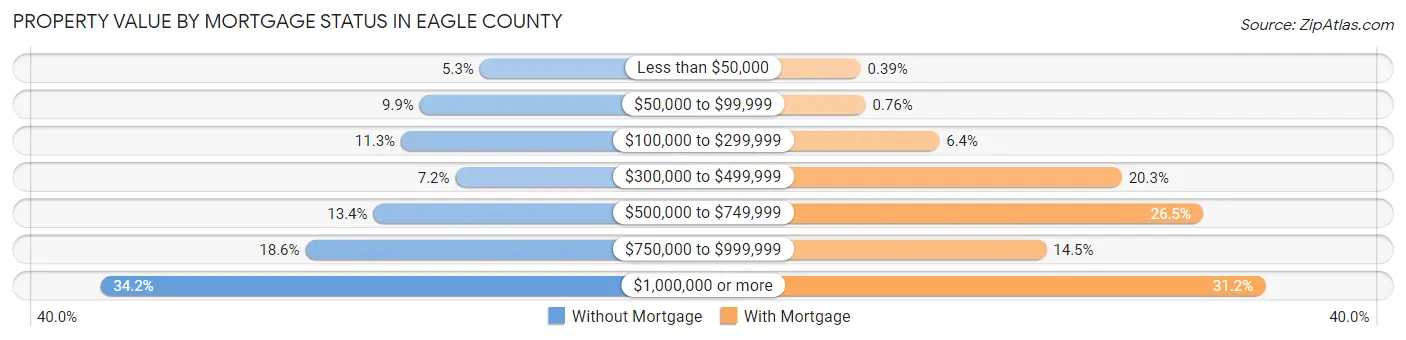
| Property Value | Without Mortgage | With Mortgage |
| Less than $50,000 | 243 (5.3%) | 36 (0.4%) |
| $50,000 to $99,999 | 451 (9.9%) | 70 (0.8%) |
| $100,000 to $299,999 | 516 (11.3%) | 588 (6.4%) |
| $300,000 to $499,999 | 327 (7.2%) | 1,869 (20.3%) |
| $500,000 to $749,999 | 612 (13.4%) | 2,439 (26.5%) |
| $750,000 to $999,999 | 848 (18.6%) | 1,340 (14.5%) |
| $1,000,000 or more | 1,559 (34.2%) | 2,876 (31.2%) |
| Total | 4,556 (100.0%) | 9,218 (100.0%) |
Household Income by Mortgage Status in Eagle County
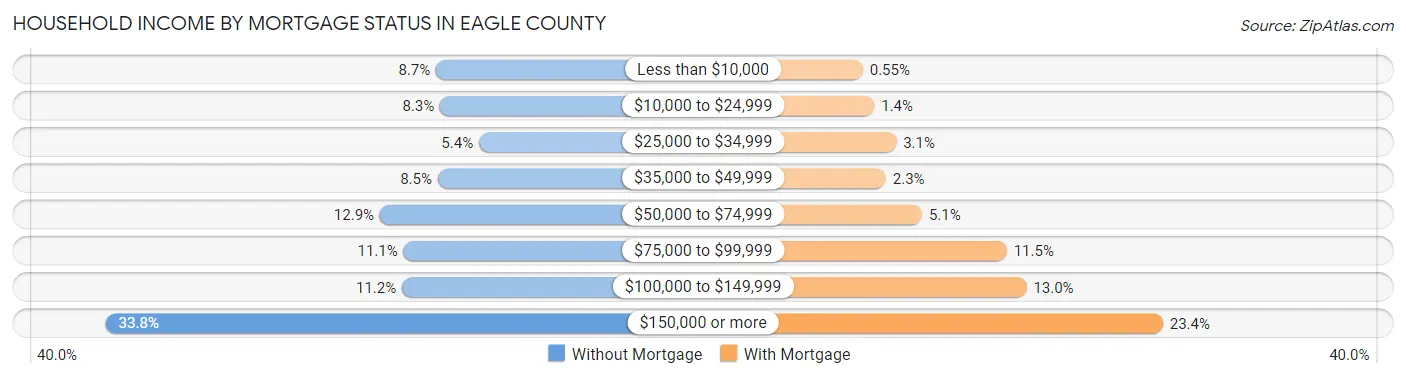
| Household Income | Without Mortgage | With Mortgage |
| Less than $10,000 | 394 (8.6%) | 51 (0.5%) |
| $10,000 to $24,999 | 380 (8.3%) | 132 (1.4%) |
| $25,000 to $34,999 | 245 (5.4%) | 286 (3.1%) |
| $35,000 to $49,999 | 388 (8.5%) | 213 (2.3%) |
| $50,000 to $74,999 | 589 (12.9%) | 466 (5.1%) |
| $75,000 to $99,999 | 507 (11.1%) | 1,062 (11.5%) |
| $100,000 to $149,999 | 512 (11.2%) | 1,200 (13.0%) |
| $150,000 or more | 1,541 (33.8%) | 2,158 (23.4%) |
| Total | 4,556 (100.0%) | 9,218 (100.0%) |
Property Value to Household Income Ratio in Eagle County
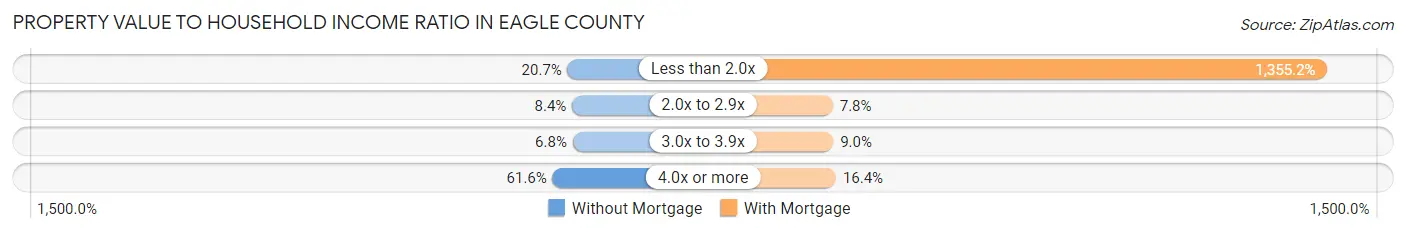
| Value-to-Income Ratio | Without Mortgage | With Mortgage |
| Less than 2.0x | 941 (20.6%) | 124,926 (1,355.2%) |
| 2.0x to 2.9x | 382 (8.4%) | 718 (7.8%) |
| 3.0x to 3.9x | 310 (6.8%) | 830 (9.0%) |
| 4.0x or more | 2,806 (61.6%) | 1,512 (16.4%) |
| Total | 4,556 (100.0%) | 9,218 (100.0%) |
Real Estate Taxes by Mortgage Status in Eagle County
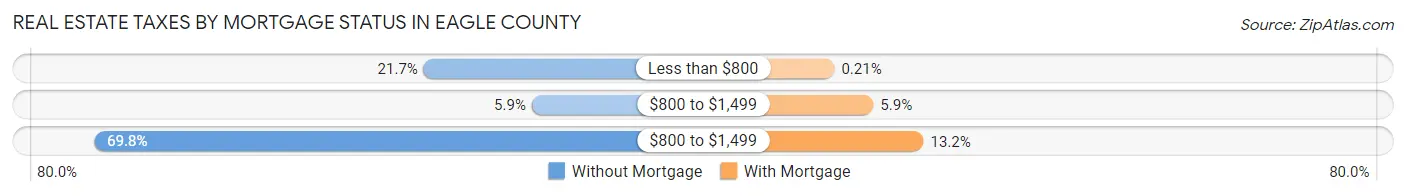
| Property Taxes | Without Mortgage | With Mortgage |
| Less than $800 | 988 (21.7%) | 19 (0.2%) |
| $800 to $1,499 | 269 (5.9%) | 544 (5.9%) |
| $800 to $1,499 | 3,182 (69.8%) | 1,220 (13.2%) |
| Total | 4,556 (100.0%) | 9,218 (100.0%) |
Health & Disability in Eagle County
Health Insurance Coverage by Age in Eagle County
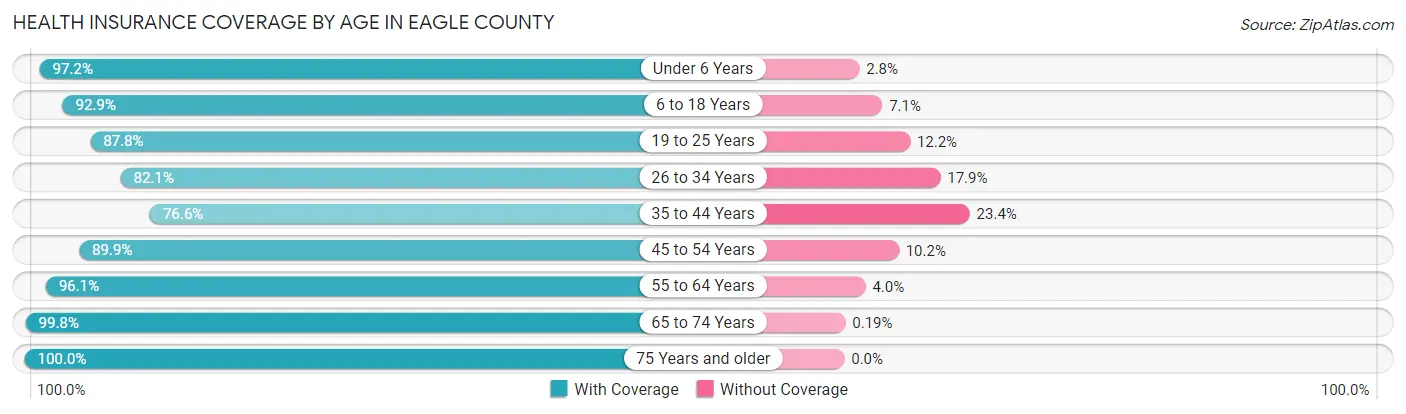
| Age Bracket | With Coverage | Without Coverage |
| Under 6 Years | 3,172 (97.2%) | 91 (2.8%) |
| 6 to 18 Years | 8,577 (92.9%) | 654 (7.1%) |
| 19 to 25 Years | 3,341 (87.8%) | 466 (12.2%) |
| 26 to 34 Years | 6,310 (82.1%) | 1,376 (17.9%) |
| 35 to 44 Years | 6,926 (76.6%) | 2,114 (23.4%) |
| 45 to 54 Years | 7,144 (89.8%) | 807 (10.2%) |
| 55 to 64 Years | 6,663 (96.1%) | 274 (4.0%) |
| 65 to 74 Years | 4,850 (99.8%) | 9 (0.2%) |
| 75 Years and older | 2,726 (100.0%) | 0 (0.0%) |
| Total | 49,709 (89.6%) | 5,791 (10.4%) |
Health Insurance Coverage by Citizenship Status in Eagle County
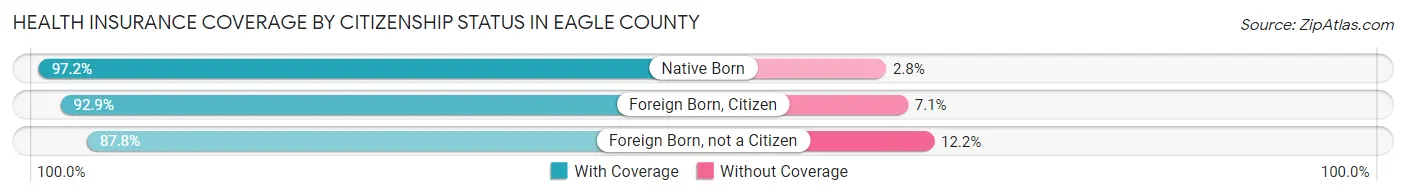
| Citizenship Status | With Coverage | Without Coverage |
| Native Born | 3,172 (97.2%) | 91 (2.8%) |
| Foreign Born, Citizen | 8,577 (92.9%) | 654 (7.1%) |
| Foreign Born, not a Citizen | 3,341 (87.8%) | 466 (12.2%) |
Health Insurance Coverage by Household Income in Eagle County
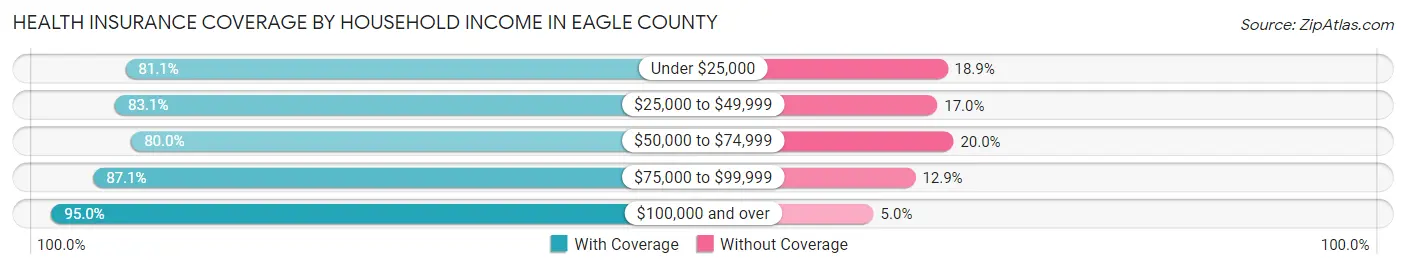
| Household Income | With Coverage | Without Coverage |
| Under $25,000 | 2,792 (81.1%) | 650 (18.9%) |
| $25,000 to $49,999 | 4,920 (83.1%) | 1,004 (17.0%) |
| $50,000 to $74,999 | 6,546 (80.0%) | 1,634 (20.0%) |
| $75,000 to $99,999 | 6,604 (87.1%) | 975 (12.9%) |
| $100,000 and over | 28,837 (95.0%) | 1,527 (5.0%) |
Public vs Private Health Insurance Coverage by Age in Eagle County
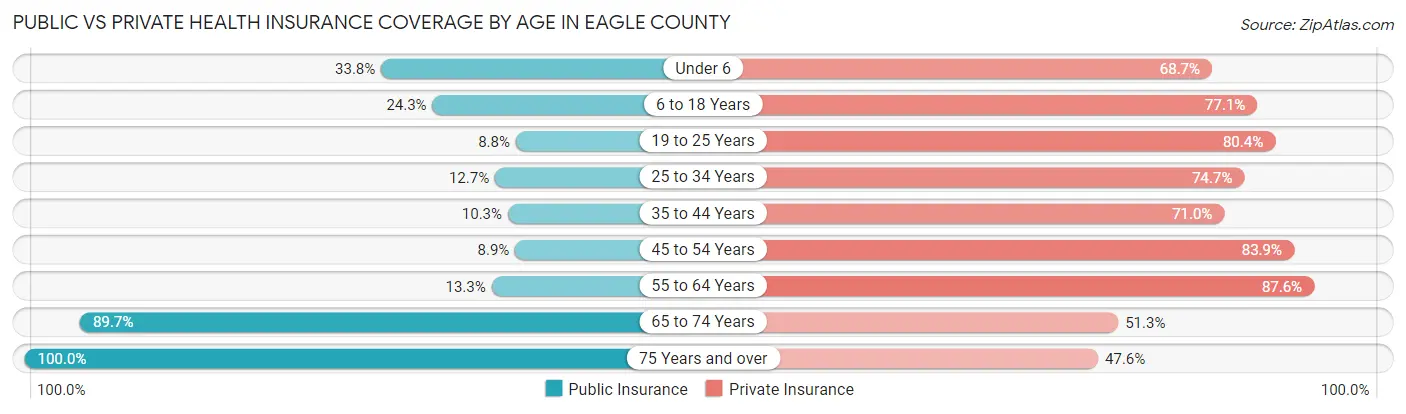
| Age Bracket | Public Insurance | Private Insurance |
| Under 6 | 1,104 (33.8%) | 2,241 (68.7%) |
| 6 to 18 Years | 2,243 (24.3%) | 7,116 (77.1%) |
| 19 to 25 Years | 336 (8.8%) | 3,061 (80.4%) |
| 25 to 34 Years | 975 (12.7%) | 5,741 (74.7%) |
| 35 to 44 Years | 931 (10.3%) | 6,416 (71.0%) |
| 45 to 54 Years | 711 (8.9%) | 6,670 (83.9%) |
| 55 to 64 Years | 925 (13.3%) | 6,079 (87.6%) |
| 65 to 74 Years | 4,359 (89.7%) | 2,493 (51.3%) |
| 75 Years and over | 2,726 (100.0%) | 1,297 (47.6%) |
| Total | 14,310 (25.8%) | 41,114 (74.1%) |
Disability Status by Sex by Age in Eagle County
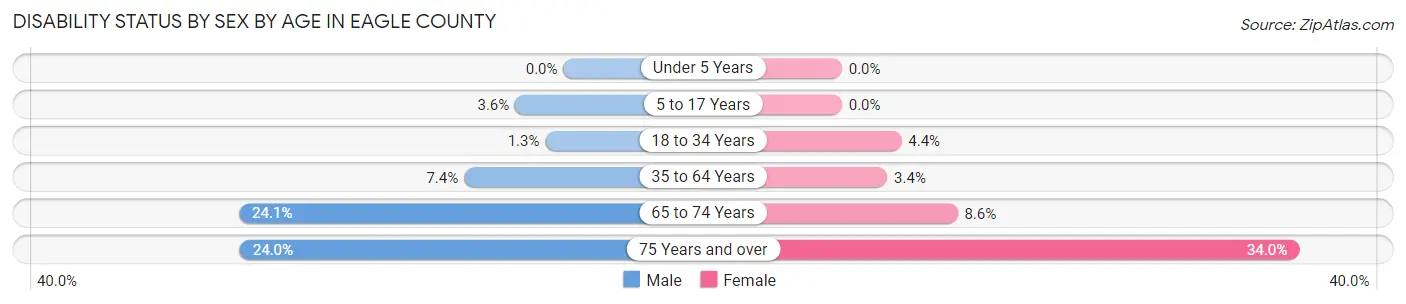
| Age Bracket | Male | Female |
| Under 5 Years | 0 (0.0%) | 0 (0.0%) |
| 5 to 17 Years | 168 (3.6%) | 0 (0.0%) |
| 18 to 34 Years | 92 (1.3%) | 248 (4.4%) |
| 35 to 64 Years | 964 (7.4%) | 366 (3.4%) |
| 65 to 74 Years | 626 (24.1%) | 194 (8.6%) |
| 75 Years and over | 294 (24.0%) | 510 (34.0%) |
Disability Class by Sex by Age in Eagle County
Disability Class: Hearing Difficulty
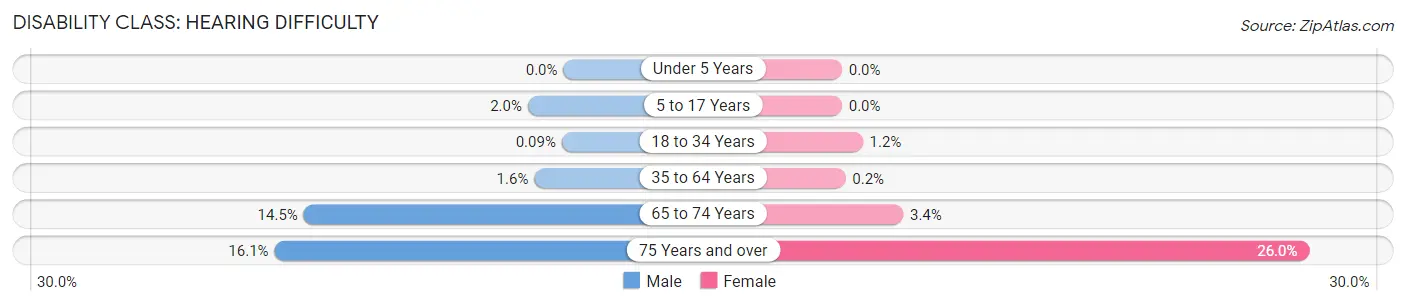
| Age Bracket | Male | Female |
| Under 5 Years | 0 (0.0%) | 0 (0.0%) |
| 5 to 17 Years | 93 (2.0%) | 0 (0.0%) |
| 18 to 34 Years | 6 (0.1%) | 65 (1.2%) |
| 35 to 64 Years | 212 (1.6%) | 22 (0.2%) |
| 65 to 74 Years | 376 (14.5%) | 77 (3.4%) |
| 75 Years and over | 197 (16.1%) | 391 (26.0%) |
Disability Class: Vision Difficulty
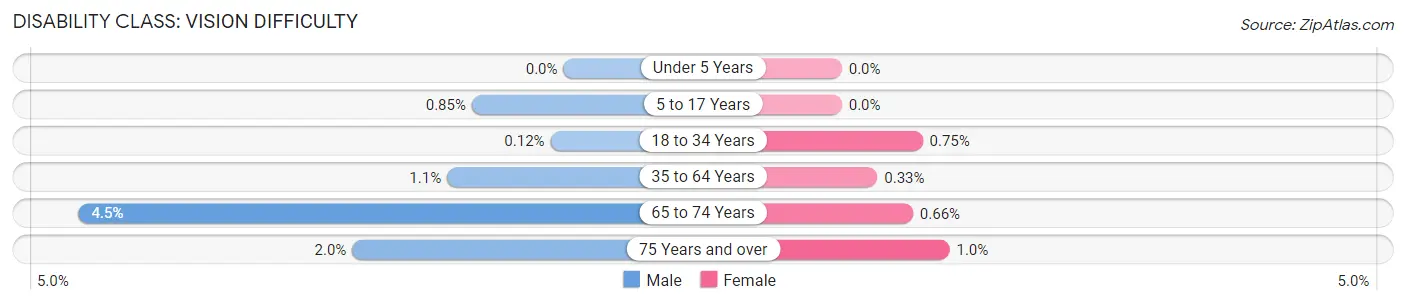
| Age Bracket | Male | Female |
| Under 5 Years | 0 (0.0%) | 0 (0.0%) |
| 5 to 17 Years | 40 (0.9%) | 0 (0.0%) |
| 18 to 34 Years | 8 (0.1%) | 42 (0.7%) |
| 35 to 64 Years | 141 (1.1%) | 36 (0.3%) |
| 65 to 74 Years | 117 (4.5%) | 15 (0.7%) |
| 75 Years and over | 24 (2.0%) | 15 (1.0%) |
Disability Class: Cognitive Difficulty
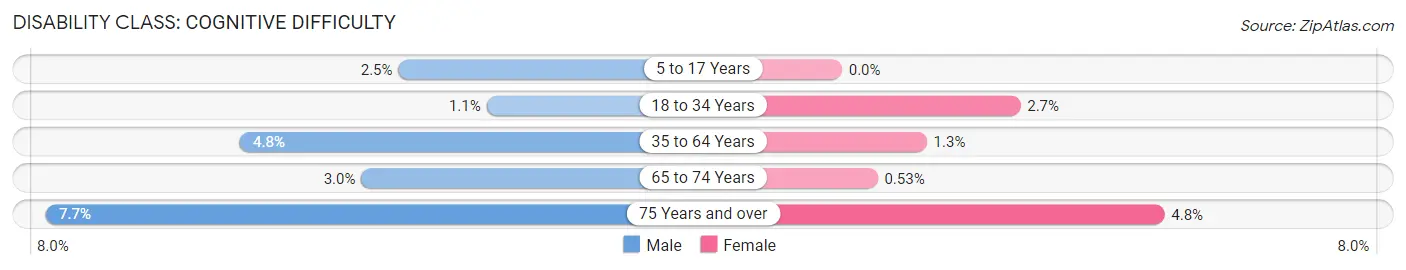
| Age Bracket | Male | Female |
| 5 to 17 Years | 115 (2.5%) | 0 (0.0%) |
| 18 to 34 Years | 78 (1.1%) | 149 (2.6%) |
| 35 to 64 Years | 628 (4.8%) | 137 (1.3%) |
| 65 to 74 Years | 78 (3.0%) | 12 (0.5%) |
| 75 Years and over | 94 (7.7%) | 72 (4.8%) |
Disability Class: Ambulatory Difficulty
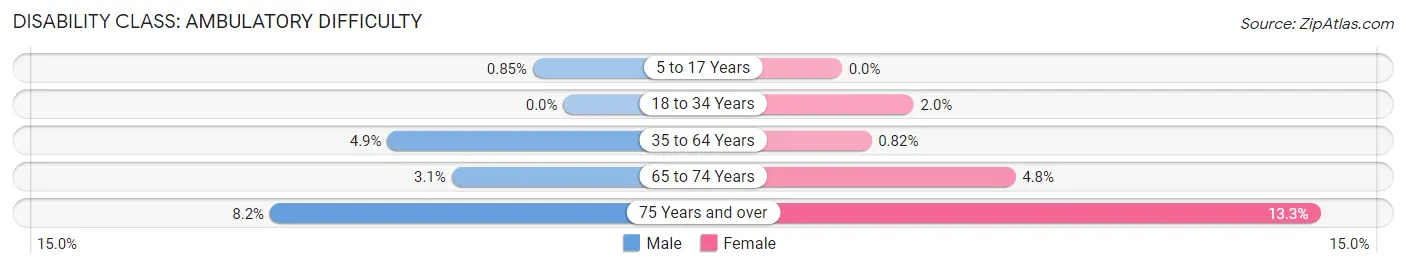
| Age Bracket | Male | Female |
| 5 to 17 Years | 40 (0.9%) | 0 (0.0%) |
| 18 to 34 Years | 0 (0.0%) | 112 (2.0%) |
| 35 to 64 Years | 641 (4.9%) | 89 (0.8%) |
| 65 to 74 Years | 81 (3.1%) | 109 (4.8%) |
| 75 Years and over | 100 (8.2%) | 200 (13.3%) |
Disability Class: Self-Care Difficulty
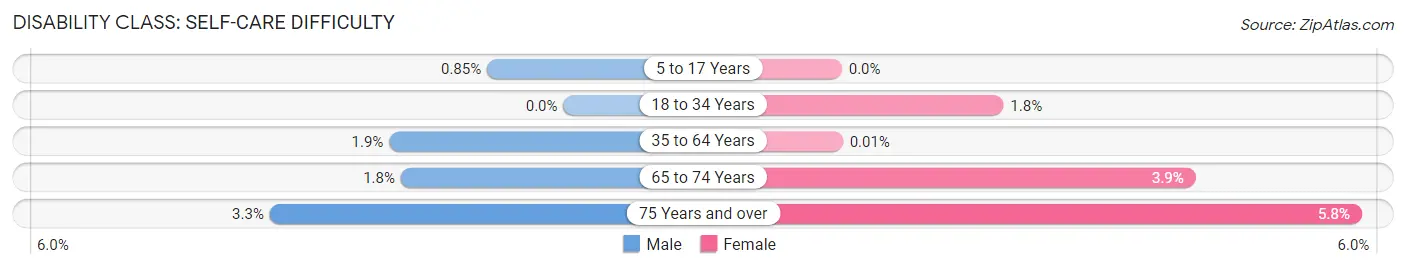
| Age Bracket | Male | Female |
| 5 to 17 Years | 40 (0.9%) | 0 (0.0%) |
| 18 to 34 Years | 0 (0.0%) | 101 (1.8%) |
| 35 to 64 Years | 254 (1.9%) | 1 (0.0%) |
| 65 to 74 Years | 47 (1.8%) | 89 (3.9%) |
| 75 Years and over | 40 (3.3%) | 87 (5.8%) |
Technology Access in Eagle County
Computing Device Access in Eagle County
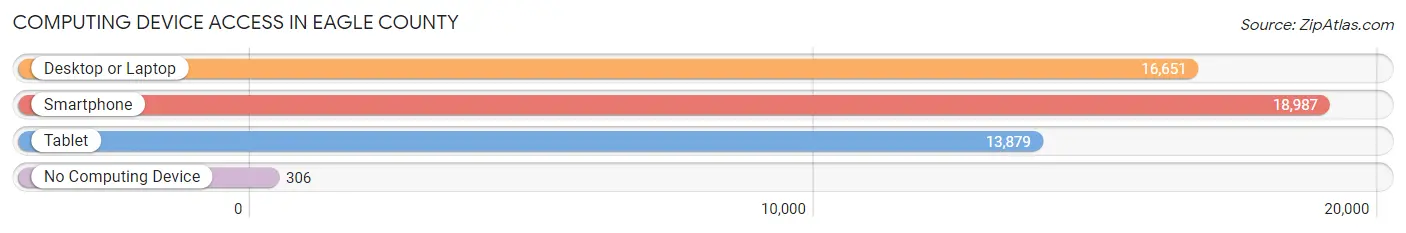
| Device Type | # Households | % Households |
| Desktop or Laptop | 16,651 | 82.9% |
| Smartphone | 18,987 | 94.5% |
| Tablet | 13,879 | 69.1% |
| No Computing Device | 306 | 1.5% |
| Total | 20,084 | 100.0% |
Internet Access in Eagle County
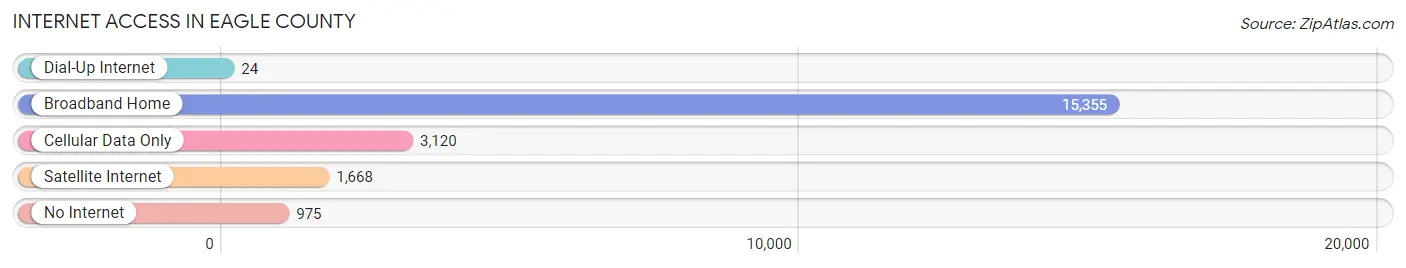
| Internet Type | # Households | % Households |
| Dial-Up Internet | 24 | 0.1% |
| Broadband Home | 15,355 | 76.4% |
| Cellular Data Only | 3,120 | 15.5% |
| Satellite Internet | 1,668 | 8.3% |
| No Internet | 975 | 4.9% |
| Total | 20,084 | 100.0% |
Eagle County Summary
Eagle County is located in the central Rocky Mountains of Colorado, and is the seventh most populous county in the state. It is bordered by Summit County to the north, Garfield County to the east, Pitkin County to the south, and Grand County to the west. The county seat is Eagle, and the largest city is Vail.
Geography
Eagle County covers an area of 2,541 square miles, making it the fourth largest county in Colorado. The county is located in the central Rocky Mountains, and is home to the Sawatch Range, the Gore Range, and the White River National Forest. The highest point in the county is Mount of the Holy Cross, which has an elevation of 14,005 feet. The county is also home to the Eagle River, which flows through the county from east to west.
The county is divided into two distinct regions: the high country and the valley. The high country is located in the northern and eastern parts of the county, and is characterized by rugged mountains and forests. The valley is located in the southern and western parts of the county, and is characterized by rolling hills and open meadows.
Climate
Eagle County has a semi-arid climate, with hot summers and cold winters. The average annual temperature is 44°F, and the average annual precipitation is 16.5 inches. The county receives an average of 300 days of sunshine per year.
Demographics
As of the 2010 census, Eagle County had a population of 52,197. The racial makeup of the county was 91.3% White, 0.7% African American, 0.7% Native American, 1.2% Asian, 0.1% Pacific Islander, 4.2% from other races, and 2.0% from two or more races. Hispanic or Latino of any race were 16.2% of the population.
Economy
Eagle County is home to a diverse economy, with a mix of industries including tourism, agriculture, manufacturing, and energy. The county is home to several ski resorts, including Vail, Beaver Creek, and Breckenridge, which attract millions of visitors each year. The county is also home to several agricultural operations, including cattle ranches, hay farms, and vineyards.
The county is home to several manufacturing companies, including a large paper mill in Gypsum, and several energy companies, including a wind farm in Eagle. The county is also home to several technology companies, including a software development firm in Avon.
History
Eagle County was established in 1883, and was named after the Eagle River, which flows through the county. The county was originally inhabited by the Ute Indians, who were later displaced by settlers in the late 19th century. The county was primarily an agricultural area until the 1950s, when the ski industry began to take off in the area.
In the 1960s, the county began to experience rapid growth, as the ski industry attracted more and more visitors to the area. The county has continued to experience growth in recent years, as the population has grown and the economy has diversified.
Common Questions
What is the Total Population of Eagle County?
Total Population of Eagle County is 55,650.
What is the Total Male Population of Eagle County?
Total Male Population of Eagle County is 29,968.
What is the Total Female Population of Eagle County?
Total Female Population of Eagle County is 25,682.
What is the Ratio of Males per 100 Females in Eagle County?
There are 116.69 Males per 100 Females in Eagle County.
What is the Ratio of Females per 100 Males in Eagle County?
There are 85.70 Females per 100 Males in Eagle County.
What is the Median Population Age in Eagle County?
Median Population Age in Eagle County is 38.3 Years.
What is the Average Family Size in Eagle County
Average Family Size in Eagle County is 3.2 People.
What is the Average Household Size in Eagle County
Average Household Size in Eagle County is 2.8 People.
What is Per Capita Income in Eagle County?
Per Capita income in Eagle County is $55,007.
What is the Median Family Income in Eagle County?
Median Family Income in Eagle County is $114,344.
What is the Median Household income in Eagle County?
Median Household Income in Eagle County is $98,887.
What is Income or Wage Gap in Eagle County?
Income or Wage Gap in Eagle County is 17.2%.
Women in Eagle County earn 82.8 cents for every dollar earned by a man.
What is Inequality or Gini Index in Eagle County?
Inequality or Gini Index in Eagle County is 0.49.
How Large is the Labor Force in Eagle County?
There are 33,687 People in the Labor Forcein in Eagle County.
What is the Percentage of People in the Labor Force in Eagle County?
73.9% of People are in the Labor Force in Eagle County.
What is the Unemployment Rate in Eagle County?
Unemployment Rate in Eagle County is 4.4%.