Delta County, CO
Delta County Map
Delta County Overview
31,173
TOTAL POPULATION
15,642
MALE POPULATION
15,531
FEMALE POPULATION
100.71
MALES / 100 FEMALES
99.29
FEMALES / 100 MALES
47.8
MEDIAN AGE
3.1
AVG FAMILY SIZE
2.5
AVG HOUSEHOLD SIZE
$33,055
PER CAPITA INCOME
$72,437
AVG FAMILY INCOME
$56,349
AVG HOUSEHOLD INCOME
40.1%
WAGE / INCOME GAP [ % ]
59.9¢/ $1
WAGE / INCOME GAP [ $ ]
$9,087
FAMILY INCOME DEFICIT
0.47
INEQUALITY / GINI INDEX
12,801
LABOR FORCE [ PEOPLE ]
49.6%
PERCENT IN LABOR FORCE
4.4%
UNEMPLOYMENT RATE
Delta County Area Codes
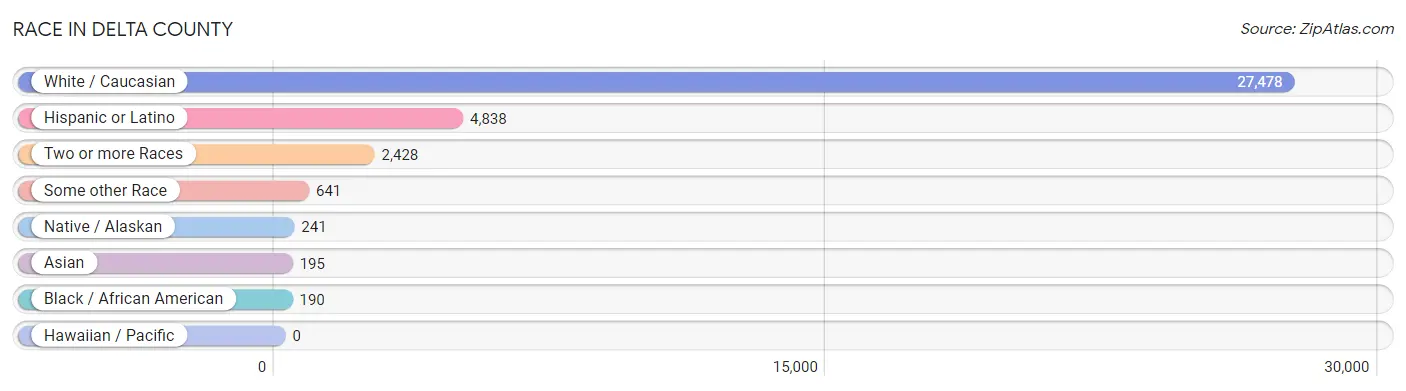
Race in Delta County
The most populous races in Delta County are White / Caucasian (27,478 | 88.1%), Hispanic or Latino (4,838 | 15.5%), and Two or more Races (2,428 | 7.8%).
| Race | # Population | % Population |
| Asian | 195 | 0.6% |
| Black / African American | 190 | 0.6% |
| Hawaiian / Pacific | 0 | 0.0% |
| Hispanic or Latino | 4,838 | 15.5% |
| Native / Alaskan | 241 | 0.8% |
| White / Caucasian | 27,478 | 88.1% |
| Two or more Races | 2,428 | 7.8% |
| Some other Race | 641 | 2.1% |
| Total | 31,173 | 100.0% |
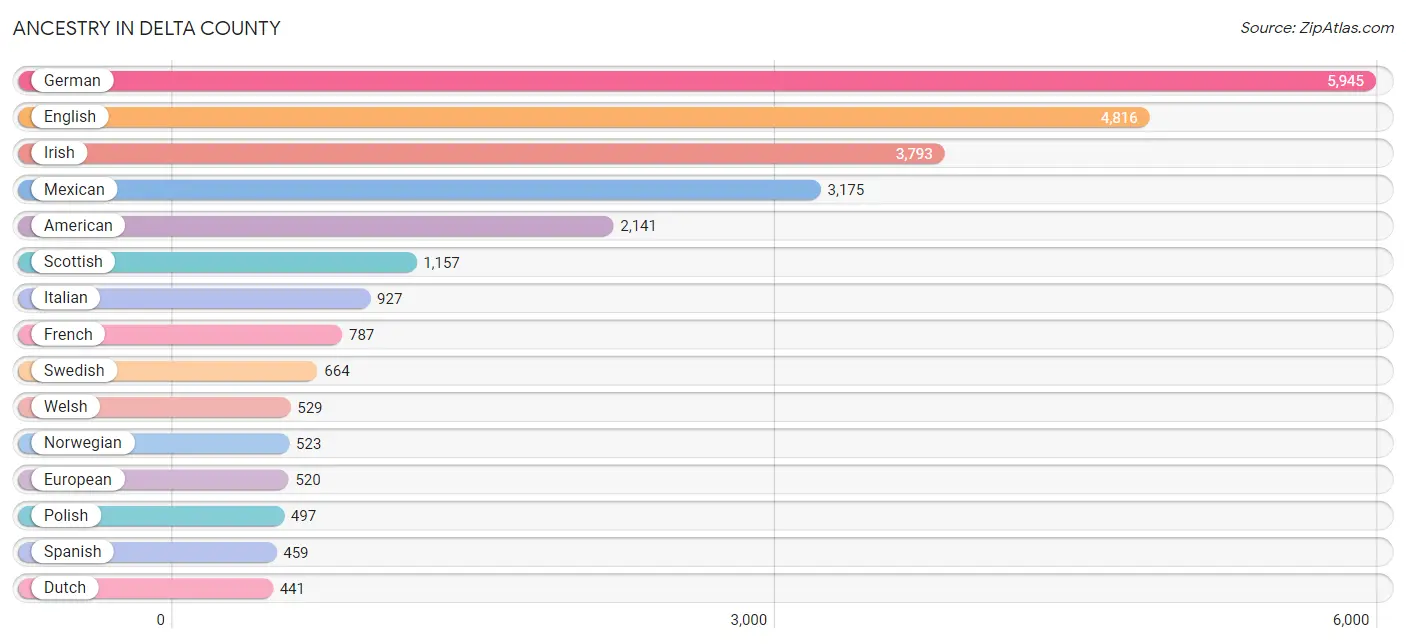
Ancestry in Delta County
The most populous ancestries reported in Delta County are German (5,945 | 19.1%), English (4,816 | 15.4%), Irish (3,793 | 12.2%), Mexican (3,175 | 10.2%), and American (2,141 | 6.9%), together accounting for 63.7% of all Delta County residents.
| Ancestry | # Population | % Population |
| African | 12 | 0.0% |
| American | 2,141 | 6.9% |
| Apache | 60 | 0.2% |
| Arab | 28 | 0.1% |
| Argentinean | 26 | 0.1% |
| Armenian | 6 | 0.0% |
| Australian | 12 | 0.0% |
| Austrian | 40 | 0.1% |
| Basque | 7 | 0.0% |
| Belgian | 20 | 0.1% |
| Bhutanese | 33 | 0.1% |
| British | 161 | 0.5% |
| Bulgarian | 4 | 0.0% |
| Canadian | 15 | 0.1% |
| Central American | 68 | 0.2% |
| Cherokee | 294 | 0.9% |
| Cheyenne | 1 | 0.0% |
| Chippewa | 26 | 0.1% |
| Choctaw | 50 | 0.2% |
| Croatian | 25 | 0.1% |
| Crow | 1 | 0.0% |
| Cuban | 43 | 0.1% |
| Czech | 51 | 0.2% |
| Czechoslovakian | 22 | 0.1% |
| Danish | 171 | 0.5% |
| Dutch | 441 | 1.4% |
| Eastern European | 23 | 0.1% |
| English | 4,816 | 15.4% |
| Estonian | 23 | 0.1% |
| European | 520 | 1.7% |
| Filipino | 30 | 0.1% |
| Finnish | 145 | 0.5% |
| French | 787 | 2.5% |
| French Canadian | 234 | 0.7% |
| German | 5,945 | 19.1% |
| Greek | 72 | 0.2% |
| Guatemalan | 67 | 0.2% |
| Hungarian | 59 | 0.2% |
| Icelander | 12 | 0.0% |
| Indian (Asian) | 1 | 0.0% |
| Indonesian | 85 | 0.3% |
| Iraqi | 26 | 0.1% |
| Irish | 3,793 | 12.2% |
| Italian | 927 | 3.0% |
| Korean | 133 | 0.4% |
| Latvian | 2 | 0.0% |
| Lithuanian | 25 | 0.1% |
| Luxembourger | 33 | 0.1% |
| Mexican | 3,175 | 10.2% |
| Native Hawaiian | 1 | 0.0% |
| Navajo | 71 | 0.2% |
| Northern European | 98 | 0.3% |
| Norwegian | 523 | 1.7% |
| Pakistani | 47 | 0.2% |
| Pennsylvania German | 50 | 0.2% |
| Polish | 497 | 1.6% |
| Portuguese | 36 | 0.1% |
| Puerto Rican | 37 | 0.1% |
| Romanian | 3 | 0.0% |
| Russian | 189 | 0.6% |
| Salvadoran | 1 | 0.0% |
| Scandinavian | 168 | 0.5% |
| Scotch-Irish | 318 | 1.0% |
| Scottish | 1,157 | 3.7% |
| Sioux | 12 | 0.0% |
| Slavic | 5 | 0.0% |
| Slovak | 14 | 0.0% |
| Slovene | 2 | 0.0% |
| South African | 1 | 0.0% |
| South American | 26 | 0.1% |
| Spaniard | 358 | 1.1% |
| Spanish | 459 | 1.5% |
| Spanish American | 4 | 0.0% |
| Sri Lankan | 66 | 0.2% |
| Subsaharan African | 33 | 0.1% |
| Swedish | 664 | 2.1% |
| Swiss | 94 | 0.3% |
| Syrian | 2 | 0.0% |
| Welsh | 529 | 1.7% | View All 79 Rows |
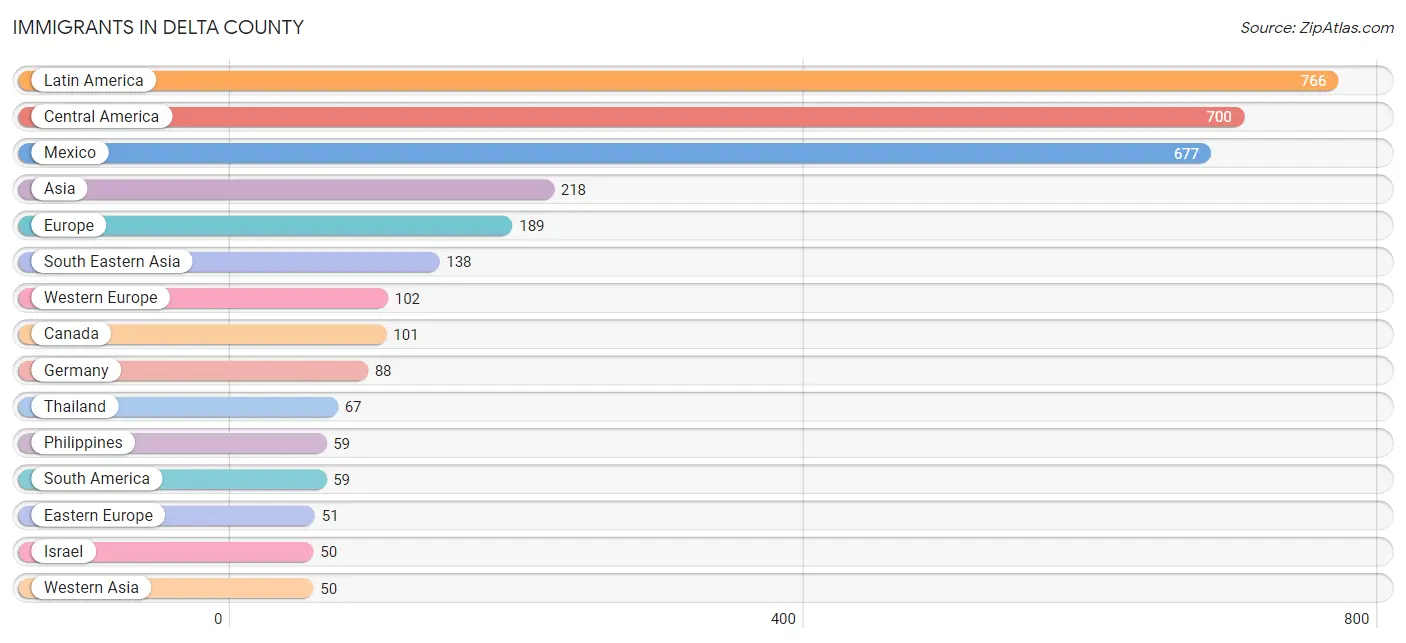
Immigrants in Delta County
The most numerous immigrant groups reported in Delta County came from Latin America (766 | 2.5%), Central America (700 | 2.2%), Mexico (677 | 2.2%), Asia (218 | 0.7%), and Europe (189 | 0.6%), together accounting for 8.2% of all Delta County residents.
| Immigration Origin | # Population | % Population |
| Africa | 18 | 0.1% |
| Argentina | 17 | 0.1% |
| Asia | 218 | 0.7% |
| Australia | 9 | 0.0% |
| Belgium | 5 | 0.0% |
| Brazil | 9 | 0.0% |
| Canada | 101 | 0.3% |
| Caribbean | 7 | 0.0% |
| Central America | 700 | 2.2% |
| China | 30 | 0.1% |
| Eastern Africa | 9 | 0.0% |
| Eastern Asia | 30 | 0.1% |
| Eastern Europe | 51 | 0.2% |
| El Salvador | 1 | 0.0% |
| England | 32 | 0.1% |
| Europe | 189 | 0.6% |
| France | 3 | 0.0% |
| Germany | 88 | 0.3% |
| Grenada | 4 | 0.0% |
| Guatemala | 9 | 0.0% |
| Honduras | 3 | 0.0% |
| Hungary | 15 | 0.1% |
| Israel | 50 | 0.2% |
| Kenya | 9 | 0.0% |
| Latin America | 766 | 2.5% |
| Latvia | 2 | 0.0% |
| Mexico | 677 | 2.2% |
| Netherlands | 6 | 0.0% |
| Northern Europe | 36 | 0.1% |
| Oceania | 9 | 0.0% |
| Peru | 33 | 0.1% |
| Philippines | 59 | 0.2% |
| Russia | 15 | 0.1% |
| Scotland | 4 | 0.0% |
| South Africa | 9 | 0.0% |
| South America | 59 | 0.2% |
| South Eastern Asia | 138 | 0.4% |
| Taiwan | 30 | 0.1% |
| Thailand | 67 | 0.2% |
| Vietnam | 10 | 0.0% |
| Western Asia | 50 | 0.2% |
| Western Europe | 102 | 0.3% | View All 42 Rows |
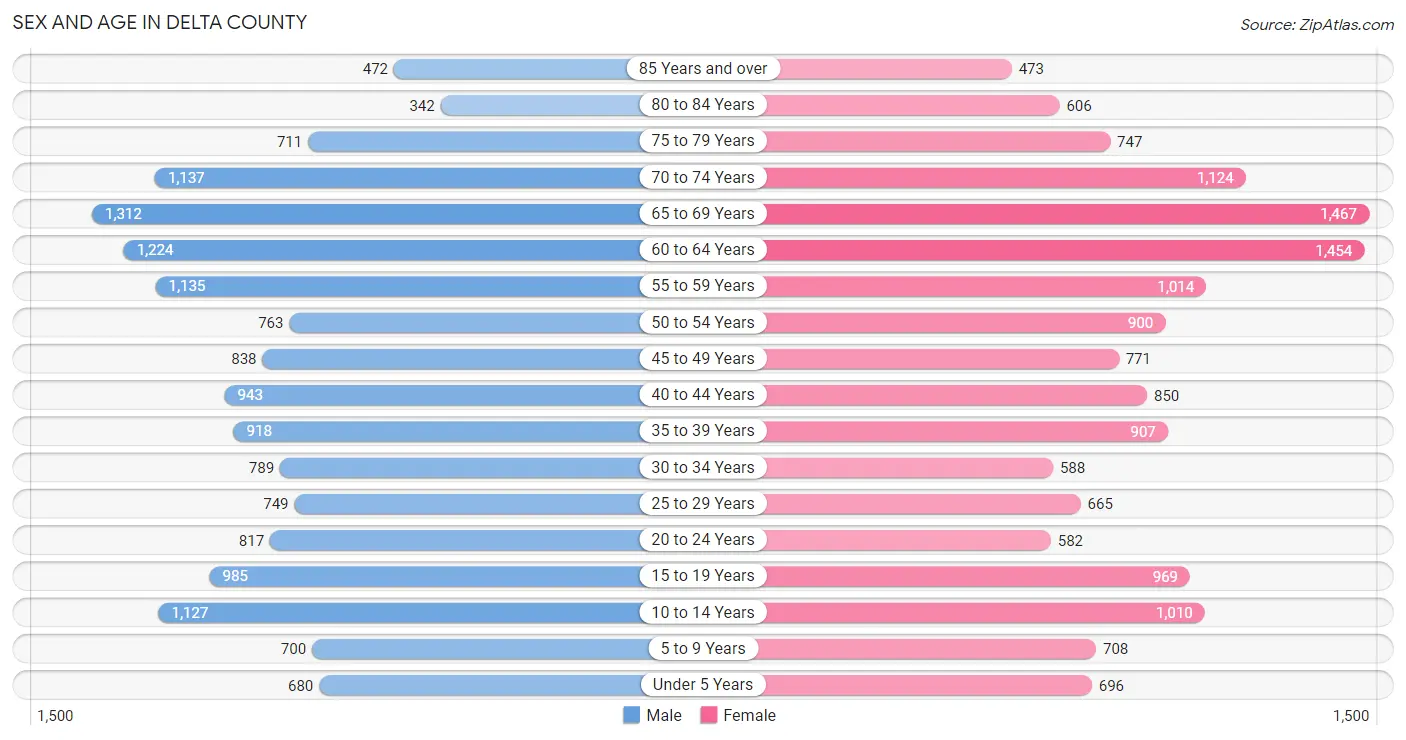
Sex and Age in Delta County
Sex and Age in Delta County
The most populous age groups in Delta County are 65 to 69 Years (1,312 | 8.4%) for men and 65 to 69 Years (1,467 | 9.5%) for women.
| Age Bracket | Male | Female |
| Under 5 Years | 680 (4.3%) | 696 (4.5%) |
| 5 to 9 Years | 700 (4.5%) | 708 (4.6%) |
| 10 to 14 Years | 1,127 (7.2%) | 1,010 (6.5%) |
| 15 to 19 Years | 985 (6.3%) | 969 (6.2%) |
| 20 to 24 Years | 817 (5.2%) | 582 (3.7%) |
| 25 to 29 Years | 749 (4.8%) | 665 (4.3%) |
| 30 to 34 Years | 789 (5.0%) | 588 (3.8%) |
| 35 to 39 Years | 918 (5.9%) | 907 (5.8%) |
| 40 to 44 Years | 943 (6.0%) | 850 (5.5%) |
| 45 to 49 Years | 838 (5.4%) | 771 (5.0%) |
| 50 to 54 Years | 763 (4.9%) | 900 (5.8%) |
| 55 to 59 Years | 1,135 (7.3%) | 1,014 (6.5%) |
| 60 to 64 Years | 1,224 (7.8%) | 1,454 (9.4%) |
| 65 to 69 Years | 1,312 (8.4%) | 1,467 (9.5%) |
| 70 to 74 Years | 1,137 (7.3%) | 1,124 (7.2%) |
| 75 to 79 Years | 711 (4.5%) | 747 (4.8%) |
| 80 to 84 Years | 342 (2.2%) | 606 (3.9%) |
| 85 Years and over | 472 (3.0%) | 473 (3.0%) |
| Total | 15,642 (100.0%) | 15,531 (100.0%) |
Families and Households in Delta County
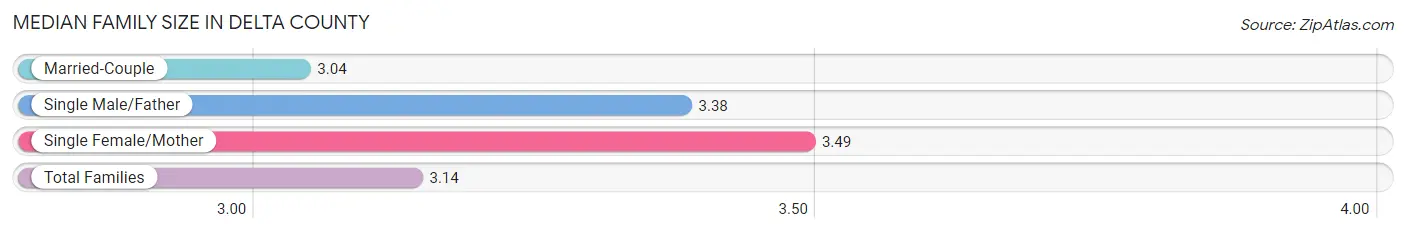
Median Family Size in Delta County
The median family size in Delta County is 3.14 persons per family, with single female/mother families (1,209 | 15.9%) accounting for the largest median family size of 3.49 persons per family. On the other hand, married-couple families (5,903 | 77.7%) represent the smallest median family size with 3.04 persons per family.
| Family Type | # Families | Family Size |
| Married-Couple | 5,903 (77.7%) | 3.04 |
| Single Male/Father | 483 (6.4%) | 3.38 |
| Single Female/Mother | 1,209 (15.9%) | 3.49 |
| Total Families | 7,595 (100.0%) | 3.14 |
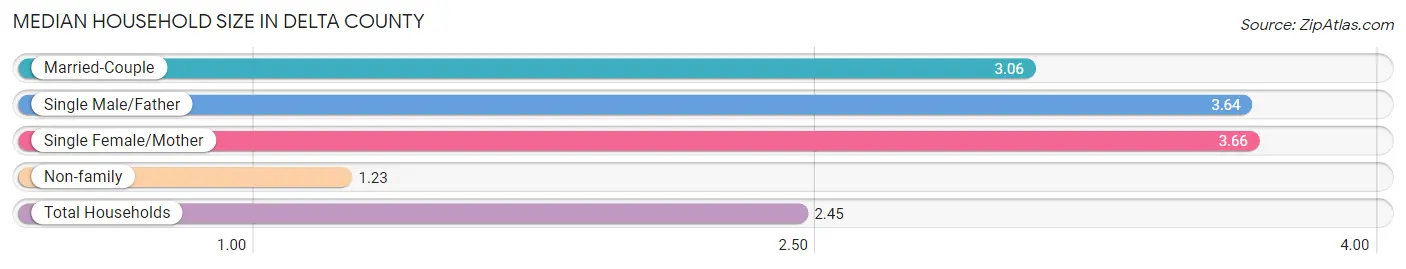
Median Household Size in Delta County
The median household size in Delta County is 2.45 persons per household, with single female/mother households (1,209 | 9.9%) accounting for the largest median household size of 3.66 persons per household. non-family households (4,668 | 38.1%) represent the smallest median household size with 1.23 persons per household.
| Household Type | # Households | Household Size |
| Married-Couple | 5,903 (48.1%) | 3.06 |
| Single Male/Father | 483 (3.9%) | 3.64 |
| Single Female/Mother | 1,209 (9.9%) | 3.66 |
| Non-family | 4,668 (38.1%) | 1.23 |
| Total Households | 12,263 (100.0%) | 2.45 |
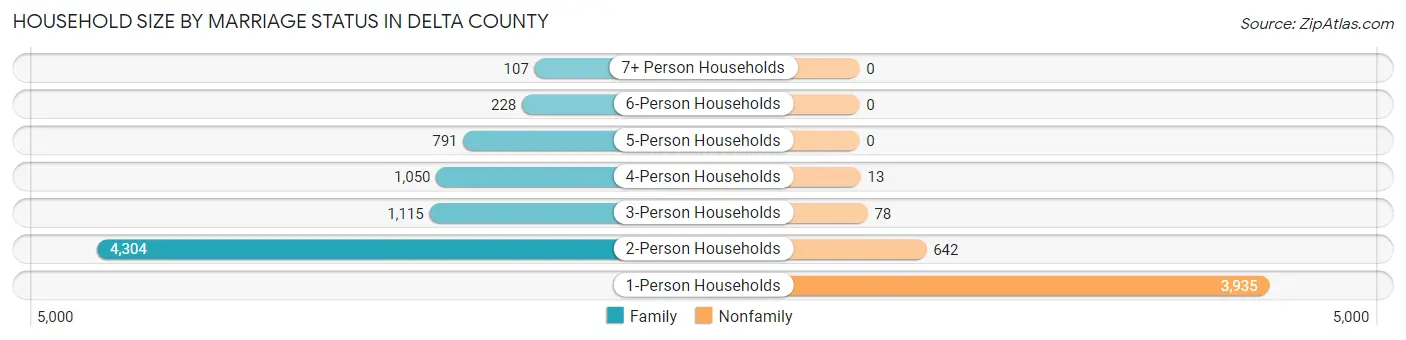
Household Size by Marriage Status in Delta County
Out of a total of 12,263 households in Delta County, 7,595 (61.9%) are family households, while 4,668 (38.1%) are nonfamily households. The most numerous type of family households are 2-person households, comprising 4,304, and the most common type of nonfamily households are 1-person households, comprising 3,935.
| Household Size | Family Households | Nonfamily Households |
| 1-Person Households | - | 3,935 (32.1%) |
| 2-Person Households | 4,304 (35.1%) | 642 (5.2%) |
| 3-Person Households | 1,115 (9.1%) | 78 (0.6%) |
| 4-Person Households | 1,050 (8.6%) | 13 (0.1%) |
| 5-Person Households | 791 (6.5%) | 0 (0.0%) |
| 6-Person Households | 228 (1.9%) | 0 (0.0%) |
| 7+ Person Households | 107 (0.9%) | 0 (0.0%) |
| Total | 7,595 (61.9%) | 4,668 (38.1%) |
Female Fertility in Delta County
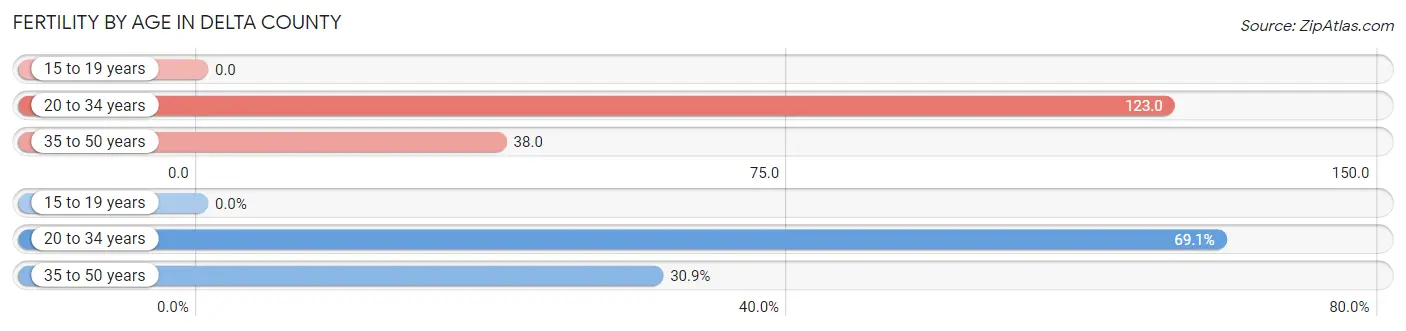
Fertility by Age in Delta County
Average fertility rate in Delta County is 60.0 births per 1,000 women. Women in the age bracket of 20 to 34 years have the highest fertility rate with 123.0 births per 1,000 women. Women in the age bracket of 20 to 34 years acount for 69.1% of all women with births.
| Age Bracket | Women with Births | Births / 1,000 Women |
| 15 to 19 years | 0 (0.0%) | 0.0 |
| 20 to 34 years | 226 (69.1%) | 123.0 |
| 35 to 50 years | 101 (30.9%) | 38.0 |
| Total | 327 (100.0%) | 60.0 |
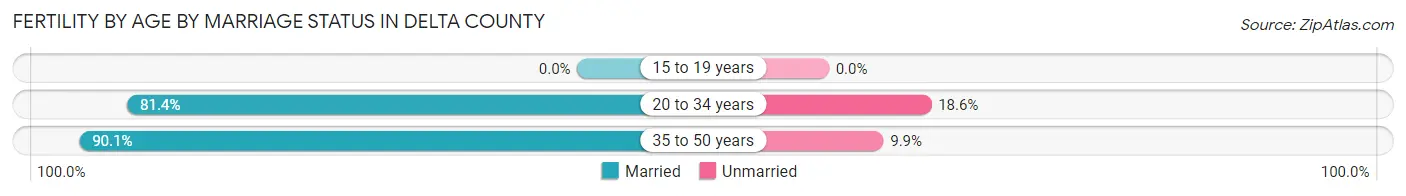
Fertility by Age by Marriage Status in Delta County
84.1% of women with births (327) in Delta County are married. The highest percentage of unmarried women with births falls into 20 to 34 years age bracket with 18.6% of them unmarried at the time of birth, while the lowest percentage of unmarried women with births belong to 35 to 50 years age bracket with 9.9% of them unmarried.
| Age Bracket | Married | Unmarried |
| 15 to 19 years | 0 (0.0%) | 0 (0.0%) |
| 20 to 34 years | 184 (81.4%) | 42 (18.6%) |
| 35 to 50 years | 91 (90.1%) | 10 (9.9%) |
| Total | 275 (84.1%) | 52 (15.9%) |
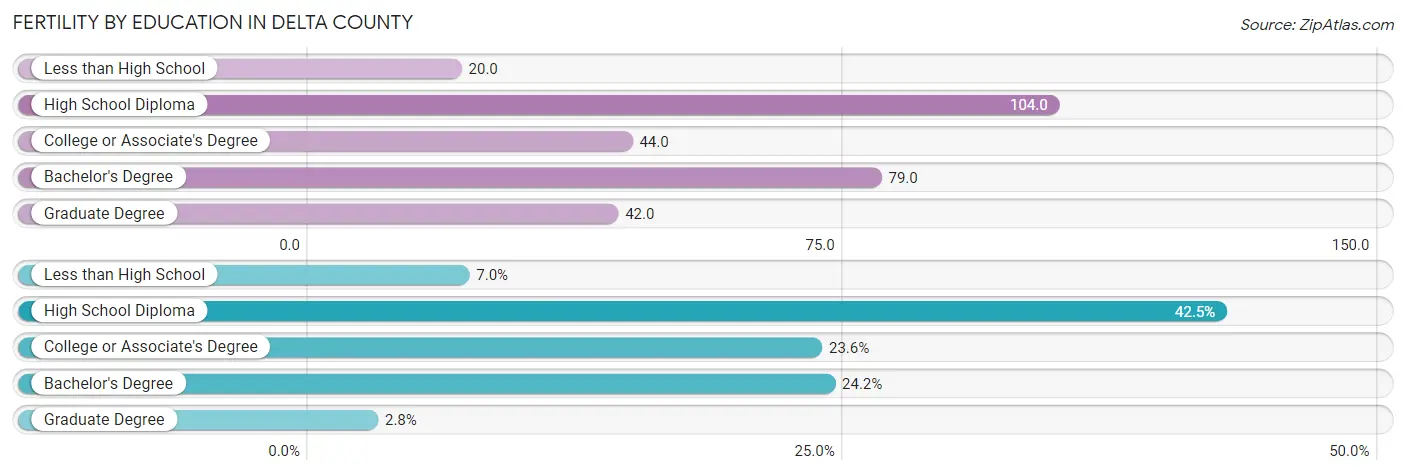
Fertility by Education in Delta County
Average fertility rate in Delta County is 60.0 births per 1,000 women. Women with the education attainment of high school diploma have the highest fertility rate of 104.0 births per 1,000 women, while women with the education attainment of less than high school have the lowest fertility at 20.0 births per 1,000 women. Women with the education attainment of high school diploma represent 42.5% of all women with births.
| Educational Attainment | Women with Births | Births / 1,000 Women |
| Less than High School | 23 (7.0%) | 20.0 |
| High School Diploma | 139 (42.5%) | 104.0 |
| College or Associate's Degree | 77 (23.5%) | 44.0 |
| Bachelor's Degree | 79 (24.2%) | 79.0 |
| Graduate Degree | 9 (2.8%) | 42.0 |
| Total | 327 (100.0%) | 60.0 |
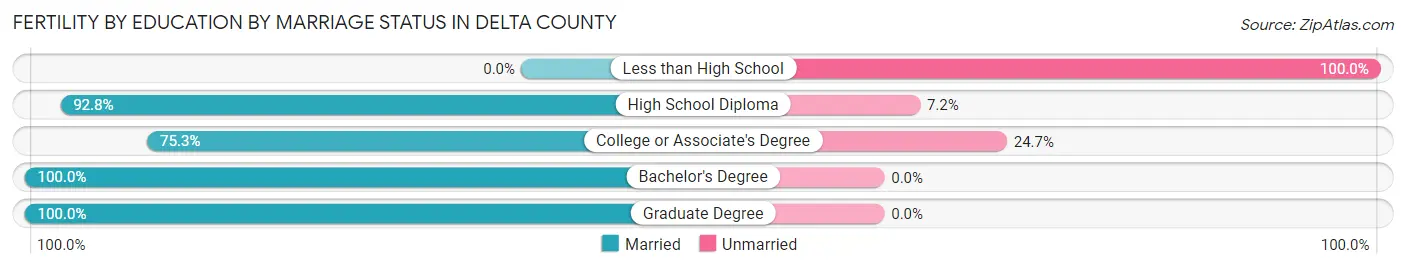
Fertility by Education by Marriage Status in Delta County
15.9% of women with births in Delta County are unmarried. Women with the educational attainment of bachelor's degree are most likely to be married with 100.0% of them married at childbirth, while women with the educational attainment of less than high school are least likely to be married with 100.0% of them unmarried at childbirth.
| Educational Attainment | Married | Unmarried |
| Less than High School | 0 (0.0%) | 23 (100.0%) |
| High School Diploma | 129 (92.8%) | 10 (7.2%) |
| College or Associate's Degree | 58 (75.3%) | 19 (24.7%) |
| Bachelor's Degree | 79 (100.0%) | 0 (0.0%) |
| Graduate Degree | 9 (100.0%) | 0 (0.0%) |
| Total | 275 (84.1%) | 52 (15.9%) |
Income in Delta County
Income Overview in Delta County
Per Capita Income in Delta County is $33,055, while median incomes of families and households are $72,437 and $56,349 respectively.
| Characteristic | Number | Measure |
| Per Capita Income | 31,173 | $33,055 |
| Median Family Income | 7,595 | $72,437 |
| Mean Family Income | 7,595 | $91,053 |
| Median Household Income | 12,263 | $56,349 |
| Mean Household Income | 12,263 | $77,809 |
| Income Deficit | 7,595 | $9,087 |
| Wage / Income Gap (%) | 31,173 | 40.14% |
| Wage / Income Gap ($) | 31,173 | 59.86¢ per $1 |
| Gini / Inequality Index | 31,173 | 0.47 |
Earnings by Sex in Delta County
Average Earnings in Delta County are $33,944, $45,233 for men and $27,075 for women, a difference of 40.1%.
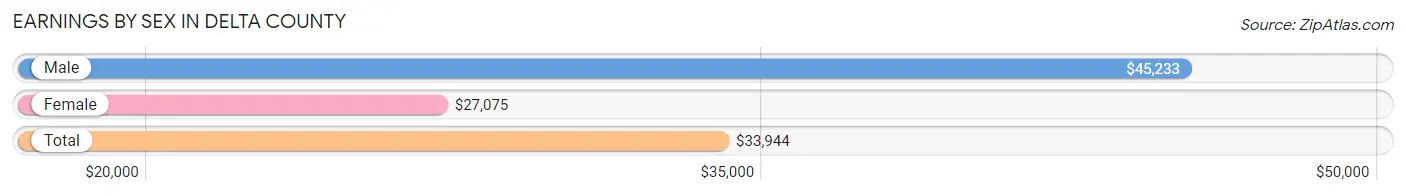
| Sex | Number | Average Earnings |
| Male | 7,033 (51.1%) | $45,233 |
| Female | 6,716 (48.8%) | $27,075 |
| Total | 13,749 (100.0%) | $33,944 |
Earnings by Sex by Income Bracket in Delta County
The most common earnings brackets in Delta County are $100,000+ for men (858 | 12.2%) and $2,499 or less for women (607 | 9.0%).
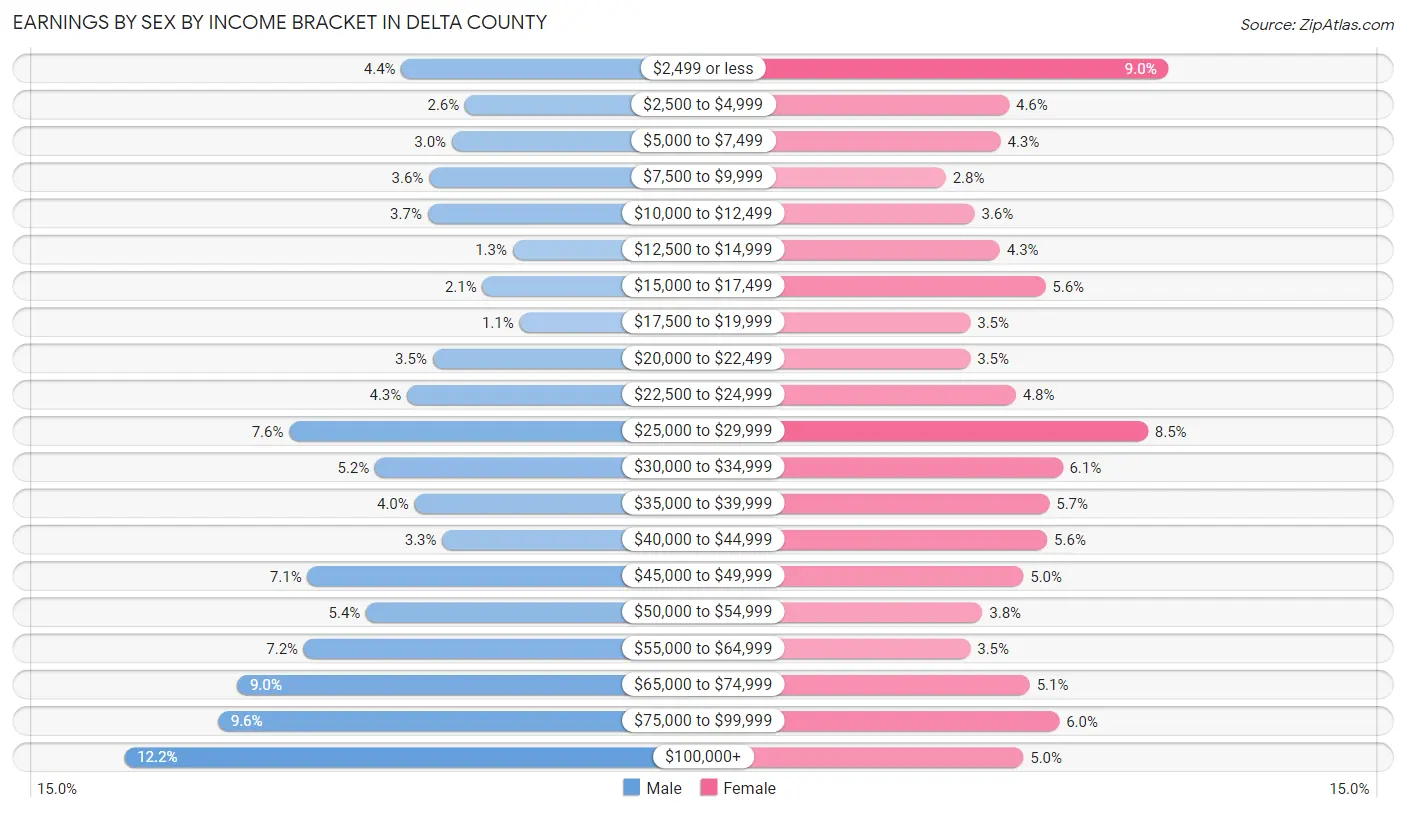
| Income | Male | Female |
| $2,499 or less | 310 (4.4%) | 607 (9.0%) |
| $2,500 to $4,999 | 184 (2.6%) | 306 (4.6%) |
| $5,000 to $7,499 | 210 (3.0%) | 290 (4.3%) |
| $7,500 to $9,999 | 255 (3.6%) | 187 (2.8%) |
| $10,000 to $12,499 | 258 (3.7%) | 241 (3.6%) |
| $12,500 to $14,999 | 90 (1.3%) | 289 (4.3%) |
| $15,000 to $17,499 | 150 (2.1%) | 375 (5.6%) |
| $17,500 to $19,999 | 77 (1.1%) | 233 (3.5%) |
| $20,000 to $22,499 | 248 (3.5%) | 233 (3.5%) |
| $22,500 to $24,999 | 299 (4.3%) | 319 (4.8%) |
| $25,000 to $29,999 | 532 (7.6%) | 568 (8.5%) |
| $30,000 to $34,999 | 362 (5.1%) | 407 (6.1%) |
| $35,000 to $39,999 | 284 (4.0%) | 382 (5.7%) |
| $40,000 to $44,999 | 229 (3.3%) | 378 (5.6%) |
| $45,000 to $49,999 | 496 (7.0%) | 333 (5.0%) |
| $50,000 to $54,999 | 380 (5.4%) | 256 (3.8%) |
| $55,000 to $64,999 | 503 (7.1%) | 233 (3.5%) |
| $65,000 to $74,999 | 635 (9.0%) | 345 (5.1%) |
| $75,000 to $99,999 | 673 (9.6%) | 401 (6.0%) |
| $100,000+ | 858 (12.2%) | 333 (5.0%) |
| Total | 7,033 (100.0%) | 6,716 (100.0%) |
Earnings by Sex by Educational Attainment in Delta County
Average earnings in Delta County are $48,289 for men and $31,135 for women, a difference of 35.5%. Men with an educational attainment of graduate degree enjoy the highest average annual earnings of $71,688, while those with less than high school education earn the least with $42,607. Women with an educational attainment of less than high school earn the most with the average annual earnings of $48,162, while those with college or associate's degree education have the smallest earnings of $25,055.
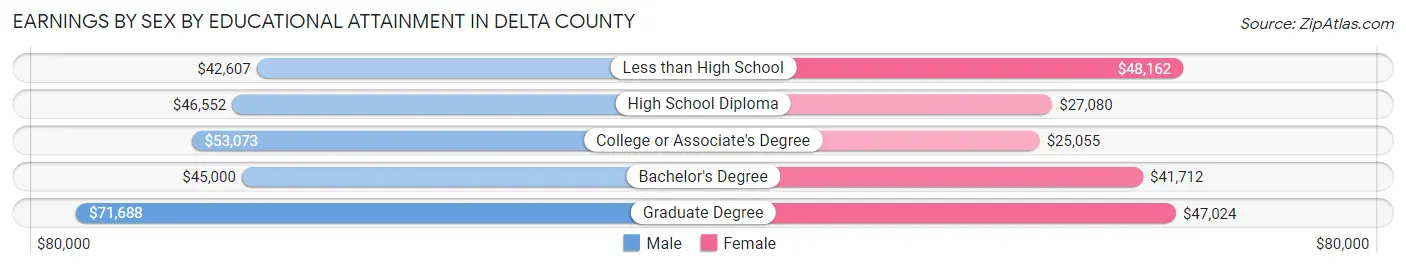
| Educational Attainment | Male Income | Female Income |
| Less than High School | $42,607 | $48,162 |
| High School Diploma | $46,552 | $27,080 |
| College or Associate's Degree | $53,073 | $25,055 |
| Bachelor's Degree | $45,000 | $41,712 |
| Graduate Degree | $71,688 | $47,024 |
| Total | $48,289 | $31,135 |
Family Income in Delta County
Family Income Brackets in Delta County
According to the Delta County family income data, there are 1,542 families falling into the $50,000 to $74,999 income range, which is the most common income bracket and makes up 20.3% of all families. Conversely, the $10,000 to $14,999 income bracket is the least frequent group with only 114 families (1.5%) belonging to this category.
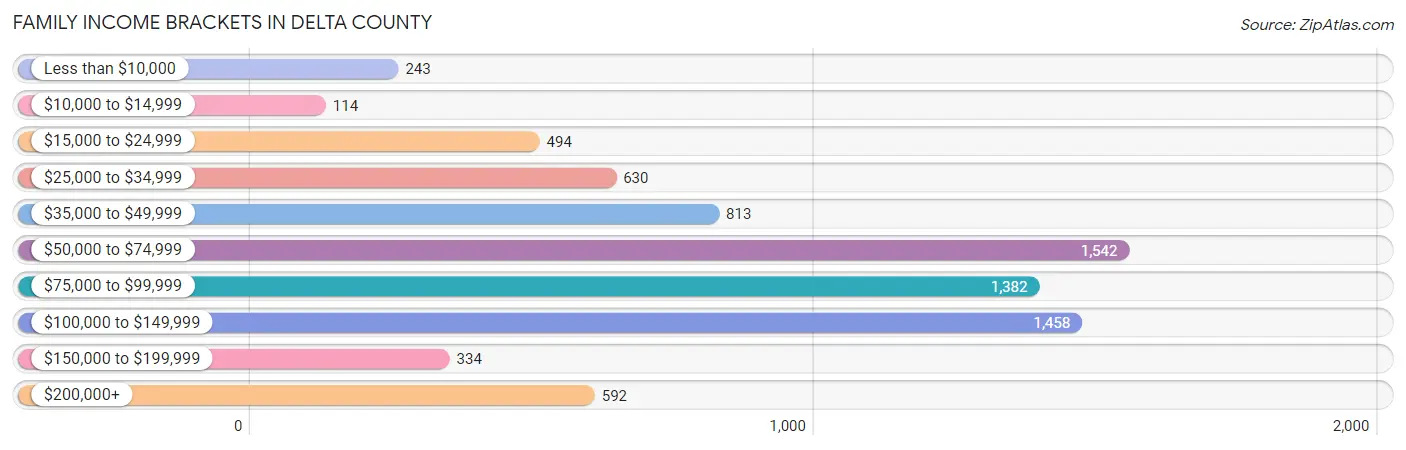
| Income Bracket | # Families | % Families |
| Less than $10,000 | 243 | 3.2% |
| $10,000 to $14,999 | 114 | 1.5% |
| $15,000 to $24,999 | 494 | 6.5% |
| $25,000 to $34,999 | 630 | 8.3% |
| $35,000 to $49,999 | 813 | 10.7% |
| $50,000 to $74,999 | 1,542 | 20.3% |
| $75,000 to $99,999 | 1,382 | 18.2% |
| $100,000 to $149,999 | 1,458 | 19.2% |
| $150,000 to $199,999 | 334 | 4.4% |
| $200,000+ | 592 | 7.8% |
Family Income by Famaliy Size in Delta County
7+ person families (107 | 1.4%) account for the highest median family income in Delta County with $193,092 per family, while 2-person families (4,556 | 60.0%) have the highest median income of $33,968 per family member.
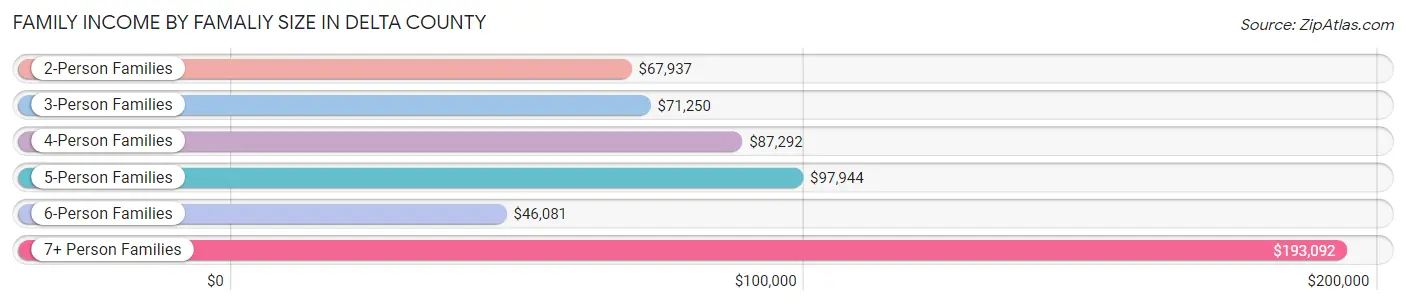
| Income Bracket | # Families | Median Income |
| 2-Person Families | 4,556 (60.0%) | $67,937 |
| 3-Person Families | 960 (12.6%) | $71,250 |
| 4-Person Families | 1,039 (13.7%) | $87,292 |
| 5-Person Families | 713 (9.4%) | $97,944 |
| 6-Person Families | 220 (2.9%) | $46,081 |
| 7+ Person Families | 107 (1.4%) | $193,092 |
| Total | 7,595 (100.0%) | $72,437 |
Family Income by Number of Earners in Delta County
The median family income in Delta County is $72,437, with families comprising 3+ earners (612) having the highest median family income of $122,695, while families with no earners (2,075) have the lowest median family income of $50,991, accounting for 8.1% and 27.3% of families, respectively.
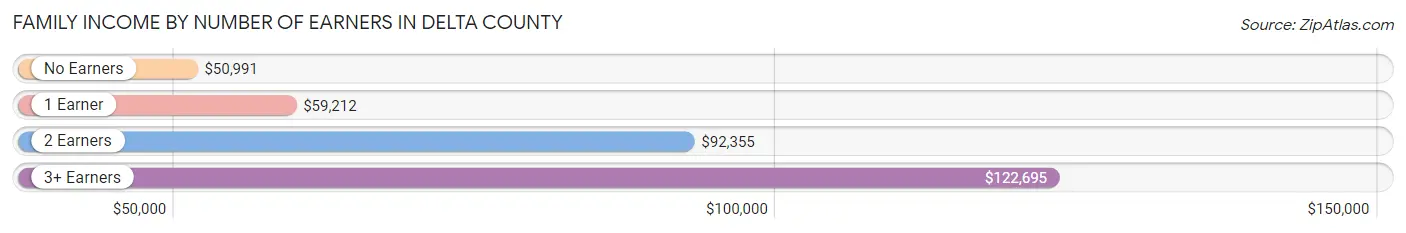
| Number of Earners | # Families | Median Income |
| No Earners | 2,075 (27.3%) | $50,991 |
| 1 Earner | 2,243 (29.5%) | $59,212 |
| 2 Earners | 2,665 (35.1%) | $92,355 |
| 3+ Earners | 612 (8.1%) | $122,695 |
| Total | 7,595 (100.0%) | $72,437 |
Household Income in Delta County
Household Income Brackets in Delta County
With 2,244 households falling in the category, the $50,000 to $74,999 income range is the most frequent in Delta County, accounting for 18.3% of all households. In contrast, only 441 households (3.6%) fall into the $150,000 to $199,999 income bracket, making it the least populous group.
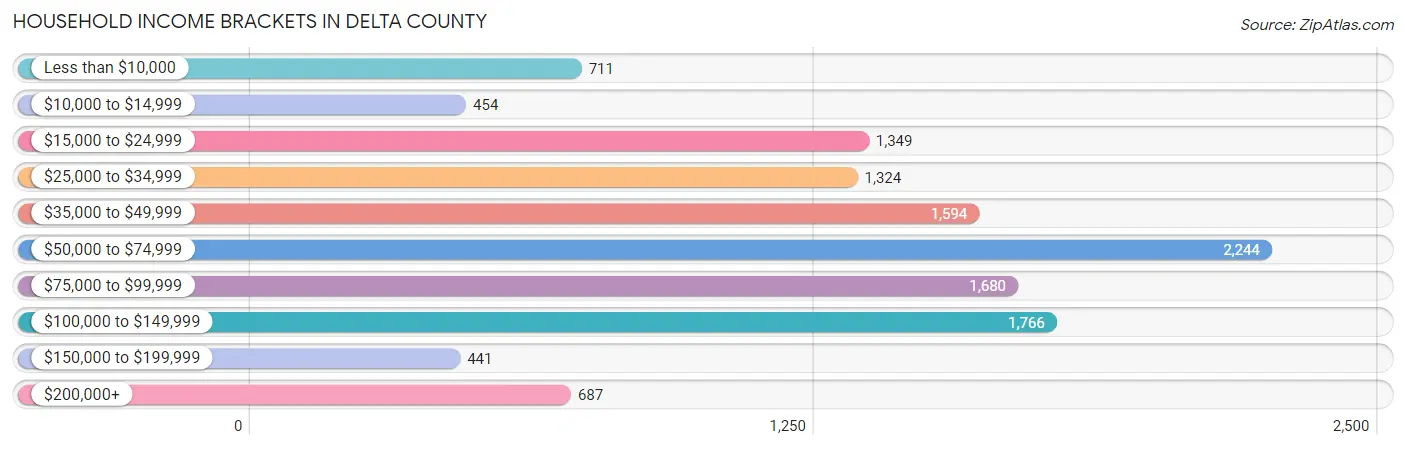
| Income Bracket | # Households | % Households |
| Less than $10,000 | 711 | 5.8% |
| $10,000 to $14,999 | 454 | 3.7% |
| $15,000 to $24,999 | 1,349 | 11.0% |
| $25,000 to $34,999 | 1,324 | 10.8% |
| $35,000 to $49,999 | 1,594 | 13.0% |
| $50,000 to $74,999 | 2,244 | 18.3% |
| $75,000 to $99,999 | 1,680 | 13.7% |
| $100,000 to $149,999 | 1,766 | 14.4% |
| $150,000 to $199,999 | 441 | 3.6% |
| $200,000+ | 687 | 5.6% |
Household Income by Householder Age in Delta County
The median household income in Delta County is $56,349, with the highest median household income of $69,093 found in the 25 to 44 years age bracket for the primary householder. A total of 2,430 households (19.8%) fall into this category. Meanwhile, the 15 to 24 years age bracket for the primary householder has the lowest median household income of $47,949, with 275 households (2.2%) in this group.
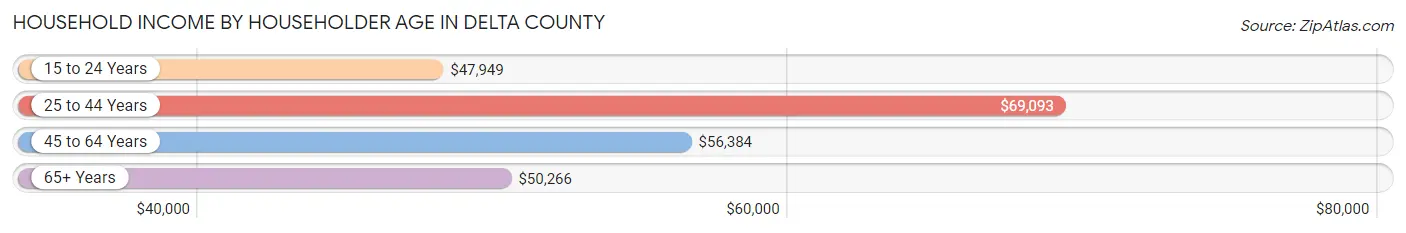
| Income Bracket | # Households | Median Income |
| 15 to 24 Years | 275 (2.2%) | $47,949 |
| 25 to 44 Years | 2,430 (19.8%) | $69,093 |
| 45 to 64 Years | 4,584 (37.4%) | $56,384 |
| 65+ Years | 4,974 (40.6%) | $50,266 |
| Total | 12,263 (100.0%) | $56,349 |
Poverty in Delta County
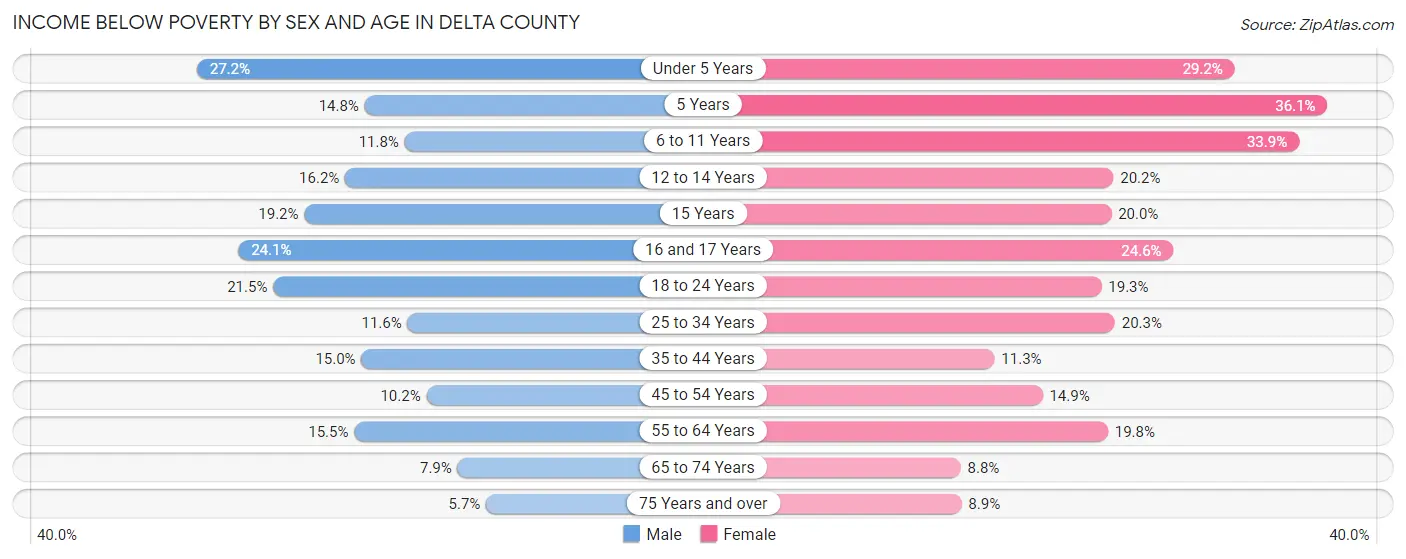
Income Below Poverty by Sex and Age in Delta County
With 13.4% poverty level for males and 16.6% for females among the residents of Delta County, under 5 year old males and 5 year old females are the most vulnerable to poverty, with 185 males (27.2%) and 31 females (36.0%) in their respective age groups living below the poverty level.
| Age Bracket | Male | Female |
| Under 5 Years | 185 (27.2%) | 203 (29.2%) |
| 5 Years | 18 (14.7%) | 31 (36.0%) |
| 6 to 11 Years | 127 (11.8%) | 282 (33.9%) |
| 12 to 14 Years | 99 (16.2%) | 150 (20.2%) |
| 15 Years | 45 (19.2%) | 42 (20.0%) |
| 16 and 17 Years | 98 (24.1%) | 82 (24.6%) |
| 18 to 24 Years | 235 (21.5%) | 194 (19.3%) |
| 25 to 34 Years | 154 (11.6%) | 254 (20.3%) |
| 35 to 44 Years | 236 (15.0%) | 199 (11.3%) |
| 45 to 54 Years | 141 (10.2%) | 249 (14.9%) |
| 55 to 64 Years | 358 (15.5%) | 485 (19.8%) |
| 65 to 74 Years | 190 (7.9%) | 228 (8.8%) |
| 75 Years and over | 86 (5.7%) | 154 (8.9%) |
| Total | 1,972 (13.4%) | 2,553 (16.6%) |
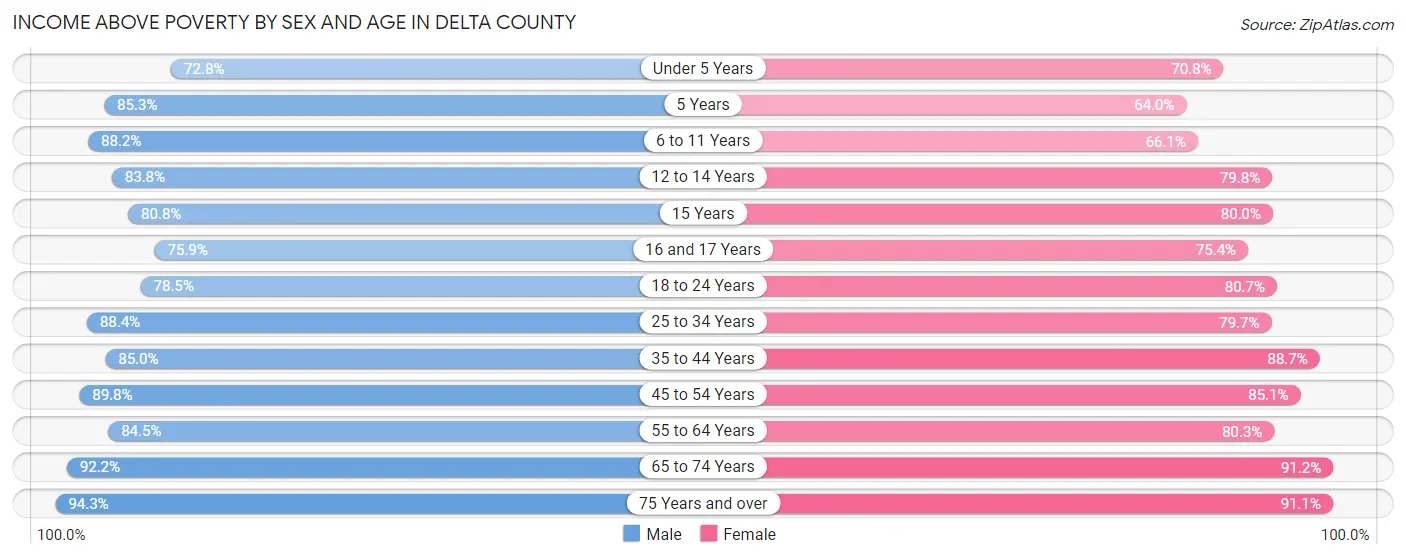
Income Above Poverty by Sex and Age in Delta County
According to the poverty statistics in Delta County, males aged 75 years and over and females aged 65 to 74 years are the age groups that are most secure financially, with 94.3% of males and 91.2% of females in these age groups living above the poverty line.
| Age Bracket | Male | Female |
| Under 5 Years | 495 (72.8%) | 493 (70.8%) |
| 5 Years | 104 (85.3%) | 55 (63.9%) |
| 6 to 11 Years | 951 (88.2%) | 549 (66.1%) |
| 12 to 14 Years | 512 (83.8%) | 594 (79.8%) |
| 15 Years | 189 (80.8%) | 168 (80.0%) |
| 16 and 17 Years | 308 (75.9%) | 251 (75.4%) |
| 18 to 24 Years | 856 (78.5%) | 813 (80.7%) |
| 25 to 34 Years | 1,177 (88.4%) | 999 (79.7%) |
| 35 to 44 Years | 1,338 (85.0%) | 1,558 (88.7%) |
| 45 to 54 Years | 1,247 (89.8%) | 1,422 (85.1%) |
| 55 to 64 Years | 1,948 (84.5%) | 1,971 (80.2%) |
| 65 to 74 Years | 2,230 (92.1%) | 2,356 (91.2%) |
| 75 Years and over | 1,415 (94.3%) | 1,580 (91.1%) |
| Total | 12,770 (86.6%) | 12,809 (83.4%) |
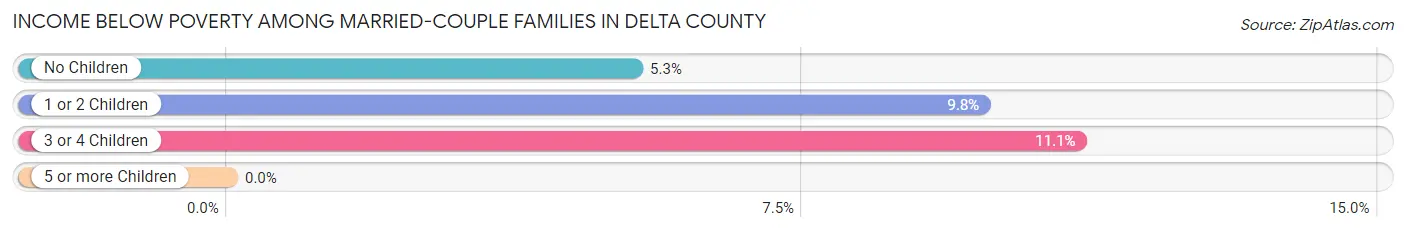
Income Below Poverty Among Married-Couple Families in Delta County
The poverty statistics for married-couple families in Delta County show that 6.8% or 402 of the total 5,903 families live below the poverty line. Families with 3 or 4 children have the highest poverty rate of 11.1%, comprising of 62 families. On the other hand, families with 5 or more children have the lowest poverty rate of 0.0%, which includes 0 families.
| Children | Above Poverty | Below Poverty |
| No Children | 3,829 (94.7%) | 214 (5.3%) |
| 1 or 2 Children | 1,156 (90.2%) | 126 (9.8%) |
| 3 or 4 Children | 497 (88.9%) | 62 (11.1%) |
| 5 or more Children | 19 (100.0%) | 0 (0.0%) |
| Total | 5,501 (93.2%) | 402 (6.8%) |
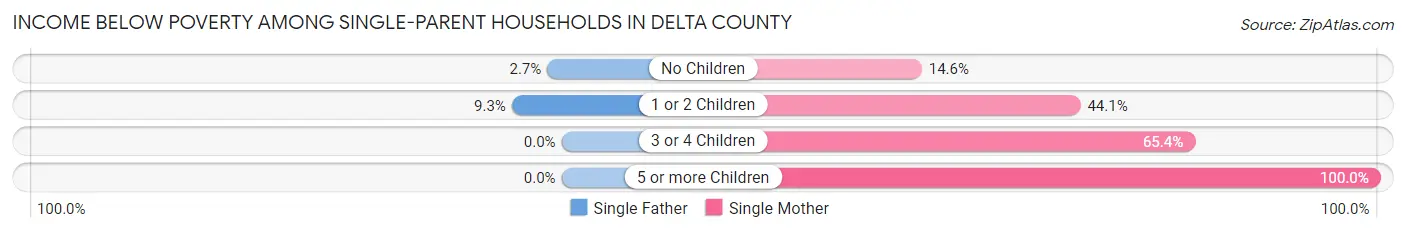
Income Below Poverty Among Single-Parent Households in Delta County
According to the poverty data in Delta County, 4.5% or 22 single-father households and 34.1% or 412 single-mother households are living below the poverty line. Among single-father households, those with 1 or 2 children have the highest poverty rate, with 14 households (9.3%) experiencing poverty. Likewise, among single-mother households, those with 5 or more children have the highest poverty rate, with 43 households (100.0%) falling below the poverty line.
| Children | Single Father | Single Mother |
| No Children | 8 (2.7%) | 80 (14.5%) |
| 1 or 2 Children | 14 (9.3%) | 236 (44.1%) |
| 3 or 4 Children | 0 (0.0%) | 53 (65.4%) |
| 5 or more Children | 0 (0.0%) | 43 (100.0%) |
| Total | 22 (4.5%) | 412 (34.1%) |
Income Below Poverty Among Married-Couple vs Single-Parent Households in Delta County
The poverty data for Delta County shows that 402 of the married-couple family households (6.8%) and 434 of the single-parent households (25.7%) are living below the poverty level. Within the married-couple family households, those with 3 or 4 children have the highest poverty rate, with 62 households (11.1%) falling below the poverty line. Among the single-parent households, those with 5 or more children have the highest poverty rate, with 43 household (81.1%) living below poverty.
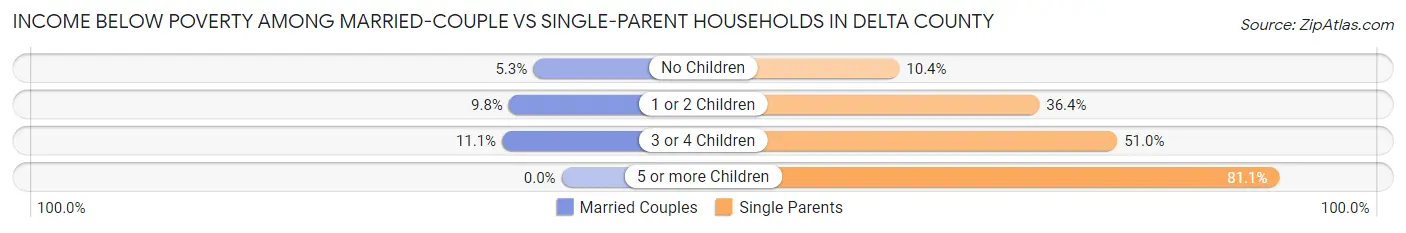
| Children | Married-Couple Families | Single-Parent Households |
| No Children | 214 (5.3%) | 88 (10.4%) |
| 1 or 2 Children | 126 (9.8%) | 250 (36.4%) |
| 3 or 4 Children | 62 (11.1%) | 53 (51.0%) |
| 5 or more Children | 0 (0.0%) | 43 (81.1%) |
| Total | 402 (6.8%) | 434 (25.7%) |
Employment Characteristics in Delta County
Employment by Class of Employer in Delta County
Among the 11,981 employed individuals in Delta County, private company employees (6,955 | 58.1%), self-employed (not incorporated) (1,560 | 13.0%), and local government employees (1,315 | 11.0%) make up the most common classes of employment.
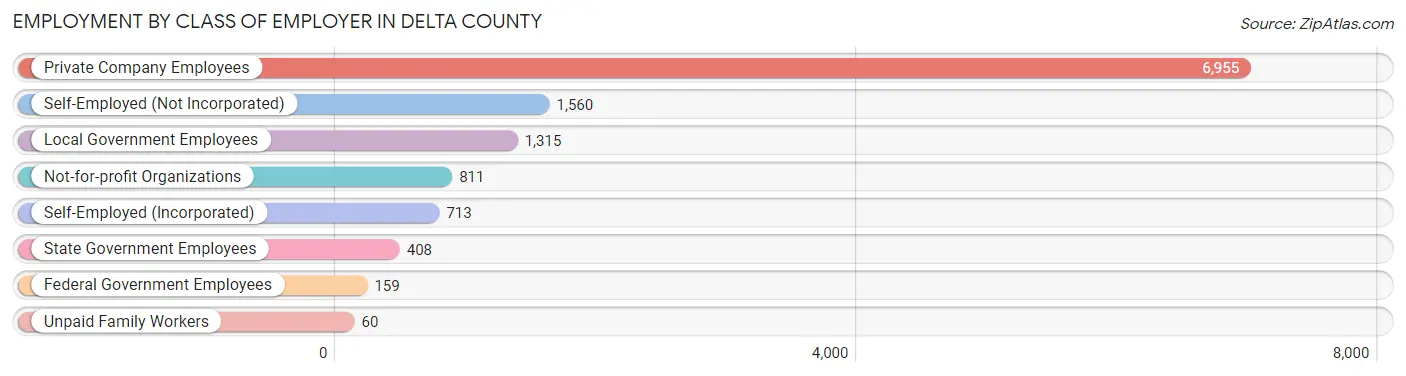
| Employer Class | # Employees | % Employees |
| Private Company Employees | 6,955 | 58.1% |
| Self-Employed (Incorporated) | 713 | 5.9% |
| Self-Employed (Not Incorporated) | 1,560 | 13.0% |
| Not-for-profit Organizations | 811 | 6.8% |
| Local Government Employees | 1,315 | 11.0% |
| State Government Employees | 408 | 3.4% |
| Federal Government Employees | 159 | 1.3% |
| Unpaid Family Workers | 60 | 0.5% |
| Total | 11,981 | 100.0% |
Employment Status by Age in Delta County
According to the labor force statistics for Delta County, out of the total population over 16 years of age (25,808), 49.6% or 12,801 individuals are in the labor force, with 4.4% or 563 of them unemployed. The age group with the highest labor force participation rate is 20 to 24 years, with 80.8% or 1,130 individuals in the labor force. Within the labor force, the 16 to 19 years age range has the highest percentage of unemployed individuals, with 10.2% or 53 of them being unemployed.
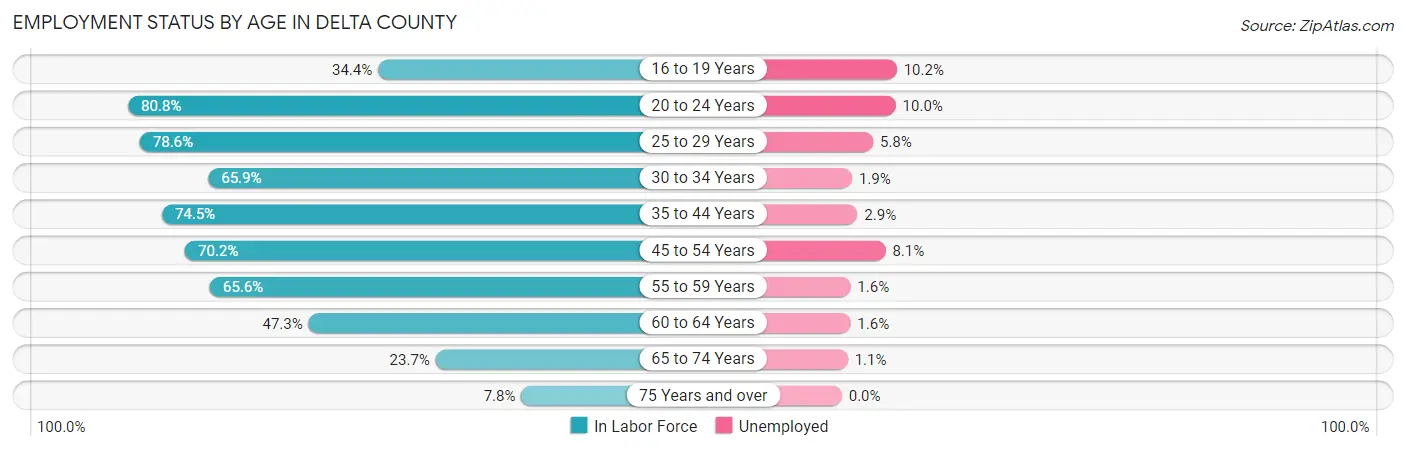
| Age Bracket | In Labor Force | Unemployed |
| 16 to 19 Years | 519 (34.4%) | 53 (10.2%) |
| 20 to 24 Years | 1,130 (80.8%) | 113 (10.0%) |
| 25 to 29 Years | 1,111 (78.6%) | 64 (5.8%) |
| 30 to 34 Years | 907 (65.9%) | 17 (1.9%) |
| 35 to 44 Years | 2,695 (74.5%) | 78 (2.9%) |
| 45 to 54 Years | 2,297 (70.2%) | 186 (8.1%) |
| 55 to 59 Years | 1,410 (65.6%) | 23 (1.6%) |
| 60 to 64 Years | 1,267 (47.3%) | 20 (1.6%) |
| 65 to 74 Years | 1,194 (23.7%) | 13 (1.1%) |
| 75 Years and over | 261 (7.8%) | 0 (0.0%) |
| Total | 12,801 (49.6%) | 563 (4.4%) |
Employment Status by Educational Attainment in Delta County
According to labor force statistics for Delta County, 66.8% of individuals (9,691) out of the total population between 25 and 64 years of age (14,508) are in the labor force, with 4.0% or 388 of them being unemployed. The group with the highest labor force participation rate are those with the educational attainment of bachelor's degree or higher, with 81.0% or 2,684 individuals in the labor force. Within the labor force, individuals with bachelor's degree or higher education have the highest percentage of unemployment, with 4.4% or 118 of them being unemployed.
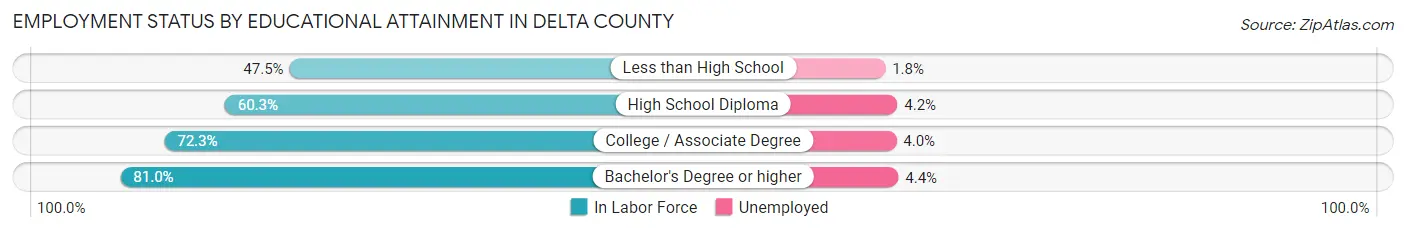
| Educational Attainment | In Labor Force | Unemployed |
| Less than High School | 829 (47.5%) | 31 (1.8%) |
| High School Diploma | 3,312 (60.3%) | 231 (4.2%) |
| College / Associate Degree | 2,860 (72.3%) | 158 (4.0%) |
| Bachelor's Degree or higher | 2,684 (81.0%) | 146 (4.4%) |
| Total | 9,691 (66.8%) | 580 (4.0%) |
Employment Occupations by Sex in Delta County
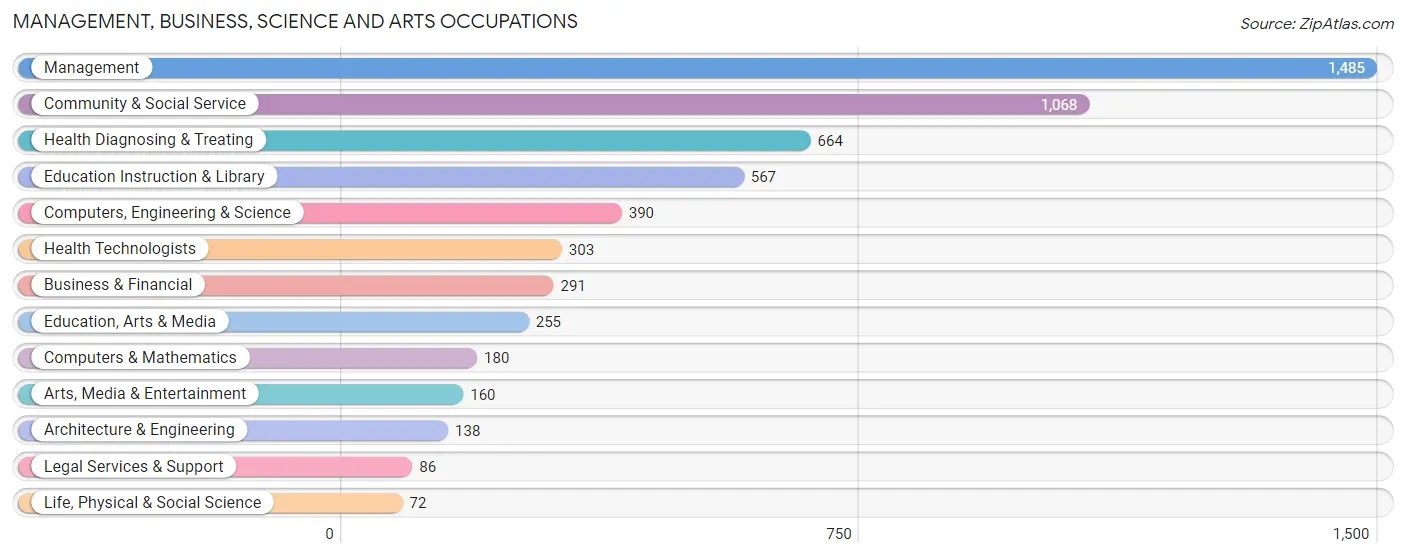
Management, Business, Science and Arts Occupations
The most common Management, Business, Science and Arts occupations in Delta County are Management (1,485 | 12.1%), Community & Social Service (1,068 | 8.7%), Health Diagnosing & Treating (664 | 5.4%), Education Instruction & Library (567 | 4.6%), and Computers, Engineering & Science (390 | 3.2%).
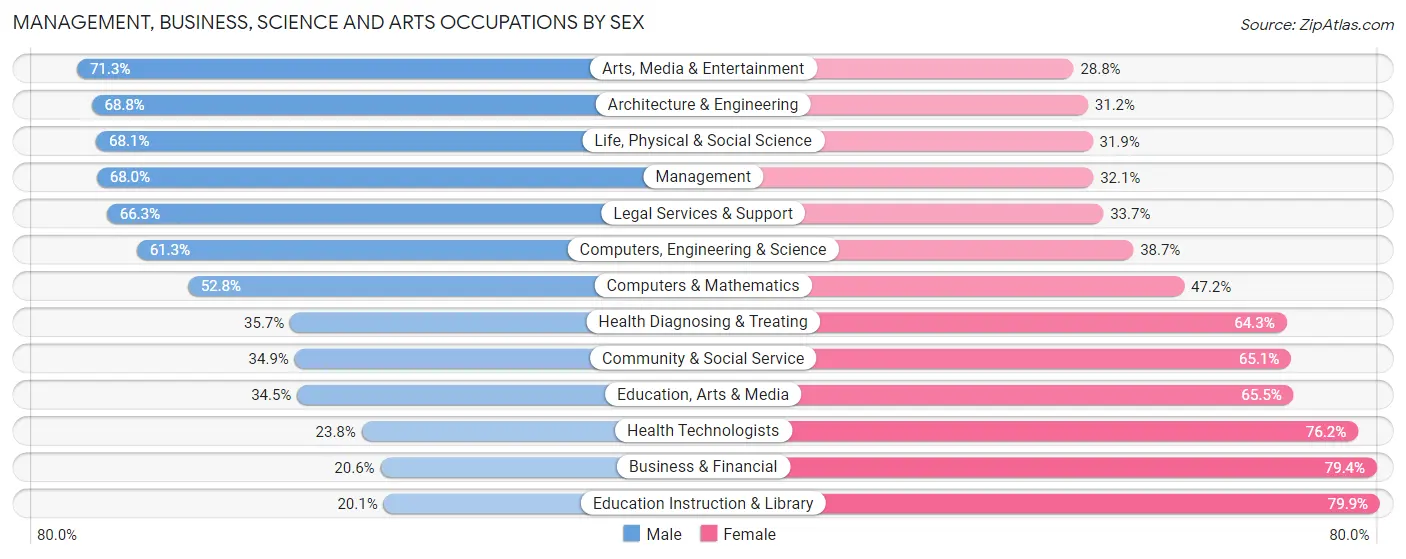
Management, Business, Science and Arts Occupations by Sex
Within the Management, Business, Science and Arts occupations in Delta County, the most male-oriented occupations are Arts, Media & Entertainment (71.3%), Architecture & Engineering (68.8%), and Life, Physical & Social Science (68.1%), while the most female-oriented occupations are Education Instruction & Library (79.9%), Business & Financial (79.4%), and Health Technologists (76.2%).
| Occupation | Male | Female |
| Management | 1,009 (67.9%) | 476 (32.1%) |
| Business & Financial | 60 (20.6%) | 231 (79.4%) |
| Computers, Engineering & Science | 239 (61.3%) | 151 (38.7%) |
| Computers & Mathematics | 95 (52.8%) | 85 (47.2%) |
| Architecture & Engineering | 95 (68.8%) | 43 (31.2%) |
| Life, Physical & Social Science | 49 (68.1%) | 23 (31.9%) |
| Community & Social Service | 373 (34.9%) | 695 (65.1%) |
| Education, Arts & Media | 88 (34.5%) | 167 (65.5%) |
| Legal Services & Support | 57 (66.3%) | 29 (33.7%) |
| Education Instruction & Library | 114 (20.1%) | 453 (79.9%) |
| Arts, Media & Entertainment | 114 (71.3%) | 46 (28.7%) |
| Health Diagnosing & Treating | 237 (35.7%) | 427 (64.3%) |
| Health Technologists | 72 (23.8%) | 231 (76.2%) |
| Total (Category) | 1,918 (49.2%) | 1,980 (50.8%) |
| Total (Overall) | 6,225 (50.9%) | 6,003 (49.1%) |
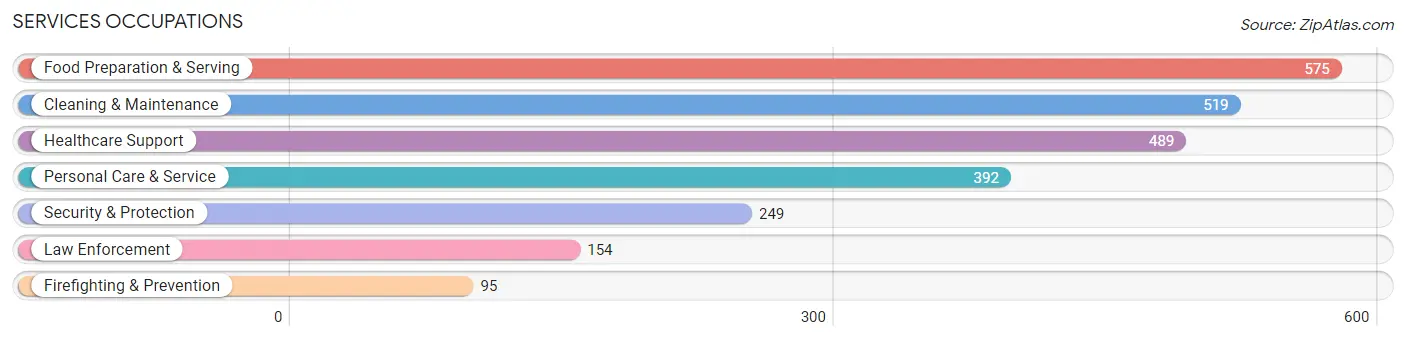
Services Occupations
The most common Services occupations in Delta County are Food Preparation & Serving (575 | 4.7%), Cleaning & Maintenance (519 | 4.2%), Healthcare Support (489 | 4.0%), Personal Care & Service (392 | 3.2%), and Security & Protection (249 | 2.0%).
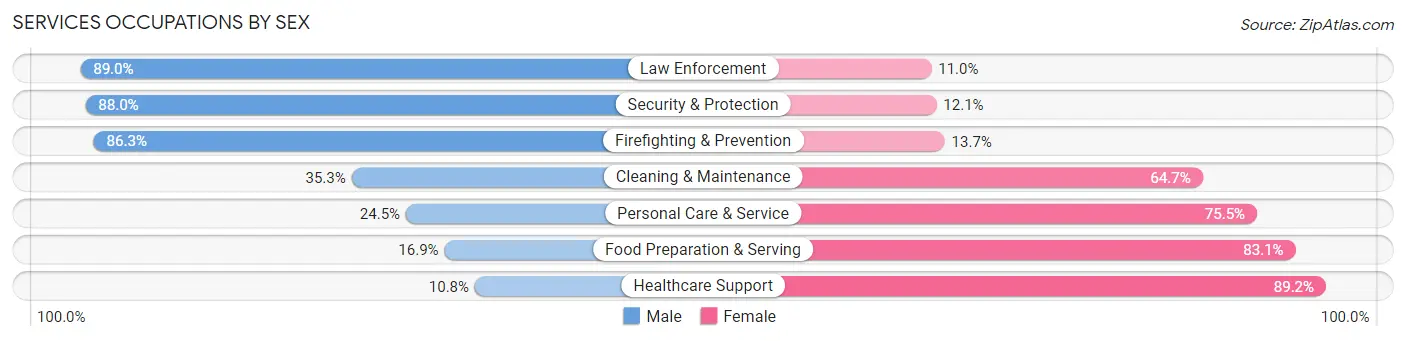
Services Occupations by Sex
Within the Services occupations in Delta County, the most male-oriented occupations are Law Enforcement (89.0%), Security & Protection (87.9%), and Firefighting & Prevention (86.3%), while the most female-oriented occupations are Healthcare Support (89.2%), Food Preparation & Serving (83.1%), and Personal Care & Service (75.5%).
| Occupation | Male | Female |
| Healthcare Support | 53 (10.8%) | 436 (89.2%) |
| Security & Protection | 219 (87.9%) | 30 (12.0%) |
| Firefighting & Prevention | 82 (86.3%) | 13 (13.7%) |
| Law Enforcement | 137 (89.0%) | 17 (11.0%) |
| Food Preparation & Serving | 97 (16.9%) | 478 (83.1%) |
| Cleaning & Maintenance | 183 (35.3%) | 336 (64.7%) |
| Personal Care & Service | 96 (24.5%) | 296 (75.5%) |
| Total (Category) | 648 (29.1%) | 1,576 (70.9%) |
| Total (Overall) | 6,225 (50.9%) | 6,003 (49.1%) |
Sales and Office Occupations
The most common Sales and Office occupations in Delta County are Office & Administration (1,326 | 10.8%), and Sales & Related (1,157 | 9.5%).

Sales and Office Occupations by Sex

| Occupation | Male | Female |
| Sales & Related | 561 (48.5%) | 596 (51.5%) |
| Office & Administration | 167 (12.6%) | 1,159 (87.4%) |
| Total (Category) | 728 (29.3%) | 1,755 (70.7%) |
| Total (Overall) | 6,225 (50.9%) | 6,003 (49.1%) |
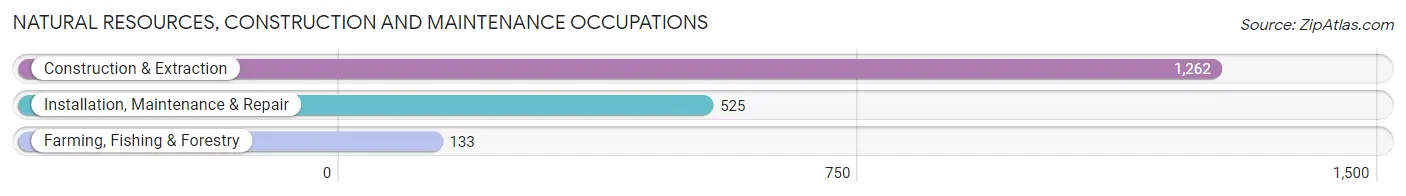
Natural Resources, Construction and Maintenance Occupations
The most common Natural Resources, Construction and Maintenance occupations in Delta County are Construction & Extraction (1,262 | 10.3%), Installation, Maintenance & Repair (525 | 4.3%), and Farming, Fishing & Forestry (133 | 1.1%).
Natural Resources, Construction and Maintenance Occupations by Sex
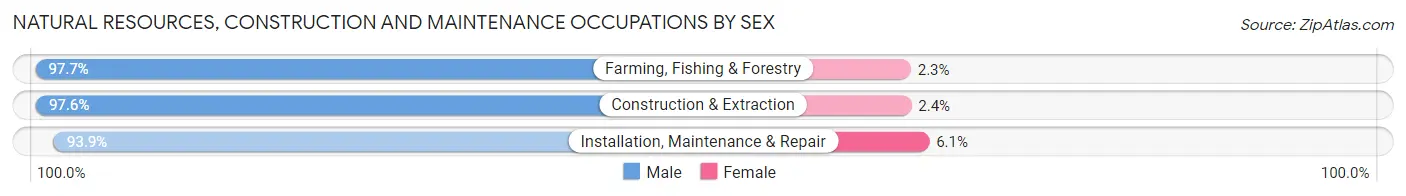
| Occupation | Male | Female |
| Farming, Fishing & Forestry | 130 (97.7%) | 3 (2.3%) |
| Construction & Extraction | 1,232 (97.6%) | 30 (2.4%) |
| Installation, Maintenance & Repair | 493 (93.9%) | 32 (6.1%) |
| Total (Category) | 1,855 (96.6%) | 65 (3.4%) |
| Total (Overall) | 6,225 (50.9%) | 6,003 (49.1%) |
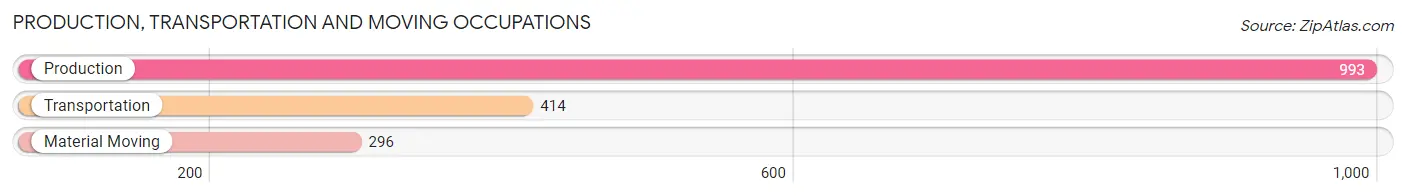
Production, Transportation and Moving Occupations
The most common Production, Transportation and Moving occupations in Delta County are Production (993 | 8.1%), Transportation (414 | 3.4%), and Material Moving (296 | 2.4%).
Production, Transportation and Moving Occupations by Sex
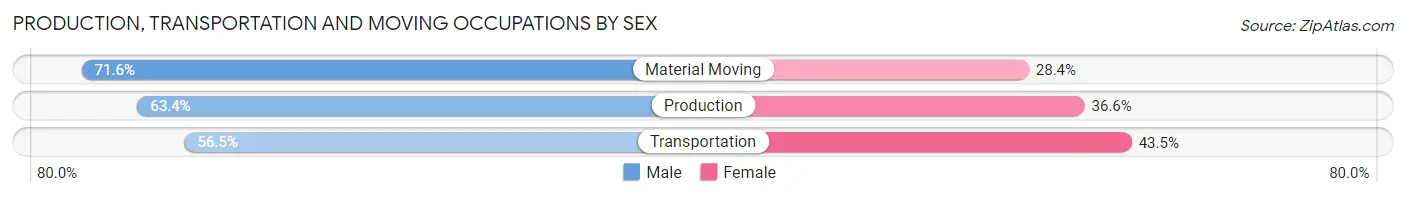
| Occupation | Male | Female |
| Production | 630 (63.4%) | 363 (36.6%) |
| Transportation | 234 (56.5%) | 180 (43.5%) |
| Material Moving | 212 (71.6%) | 84 (28.4%) |
| Total (Category) | 1,076 (63.2%) | 627 (36.8%) |
| Total (Overall) | 6,225 (50.9%) | 6,003 (49.1%) |
Employment Industries by Sex in Delta County
Employment Industries in Delta County
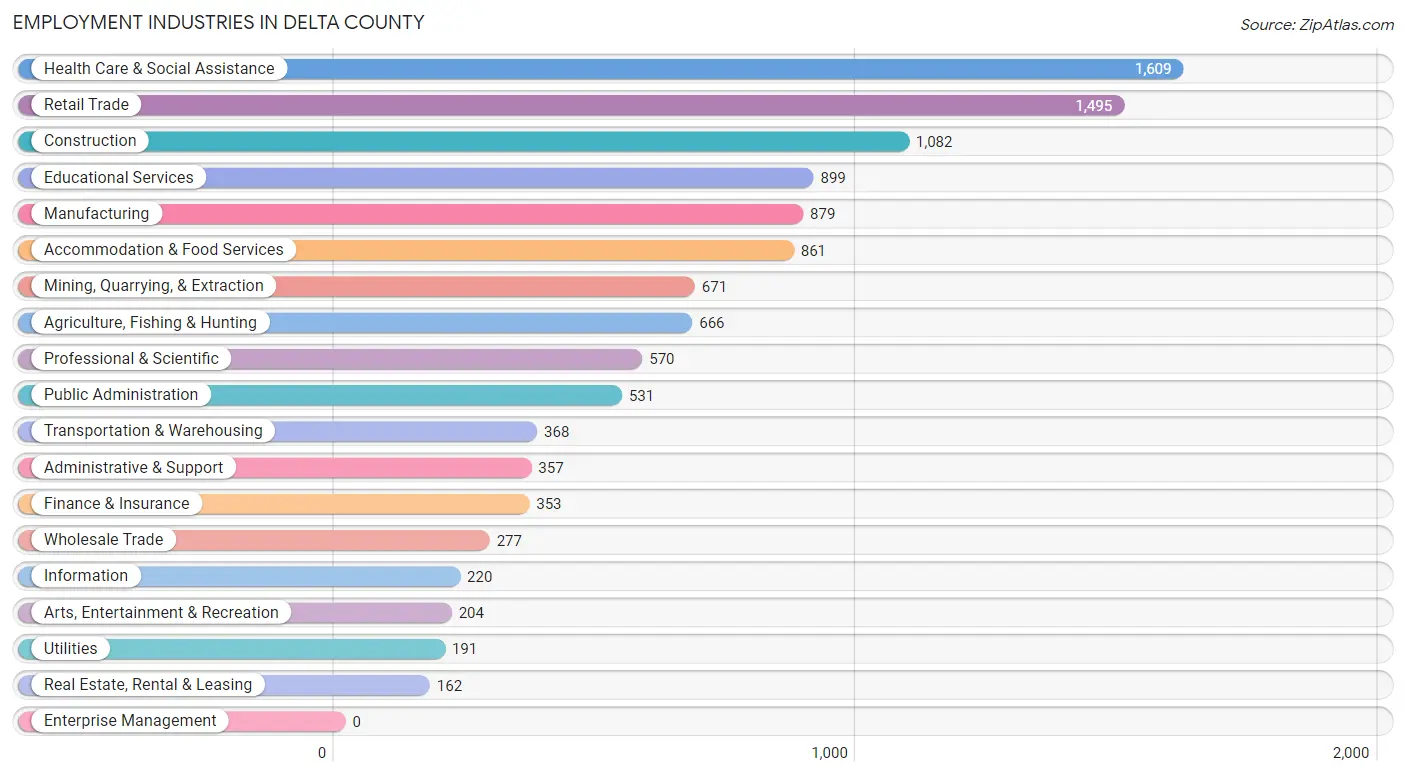
The major employment industries in Delta County include Health Care & Social Assistance (1,609 | 13.2%), Retail Trade (1,495 | 12.2%), Construction (1,082 | 8.8%), Educational Services (899 | 7.3%), and Manufacturing (879 | 7.2%).
Employment Industries by Sex in Delta County
The Delta County industries that see more men than women are Construction (94.4%), Mining, Quarrying, & Extraction (83.0%), and Wholesale Trade (81.6%), whereas the industries that tend to have a higher number of women are Finance & Insurance (84.1%), Health Care & Social Assistance (80.2%), and Accommodation & Food Services (77.9%).
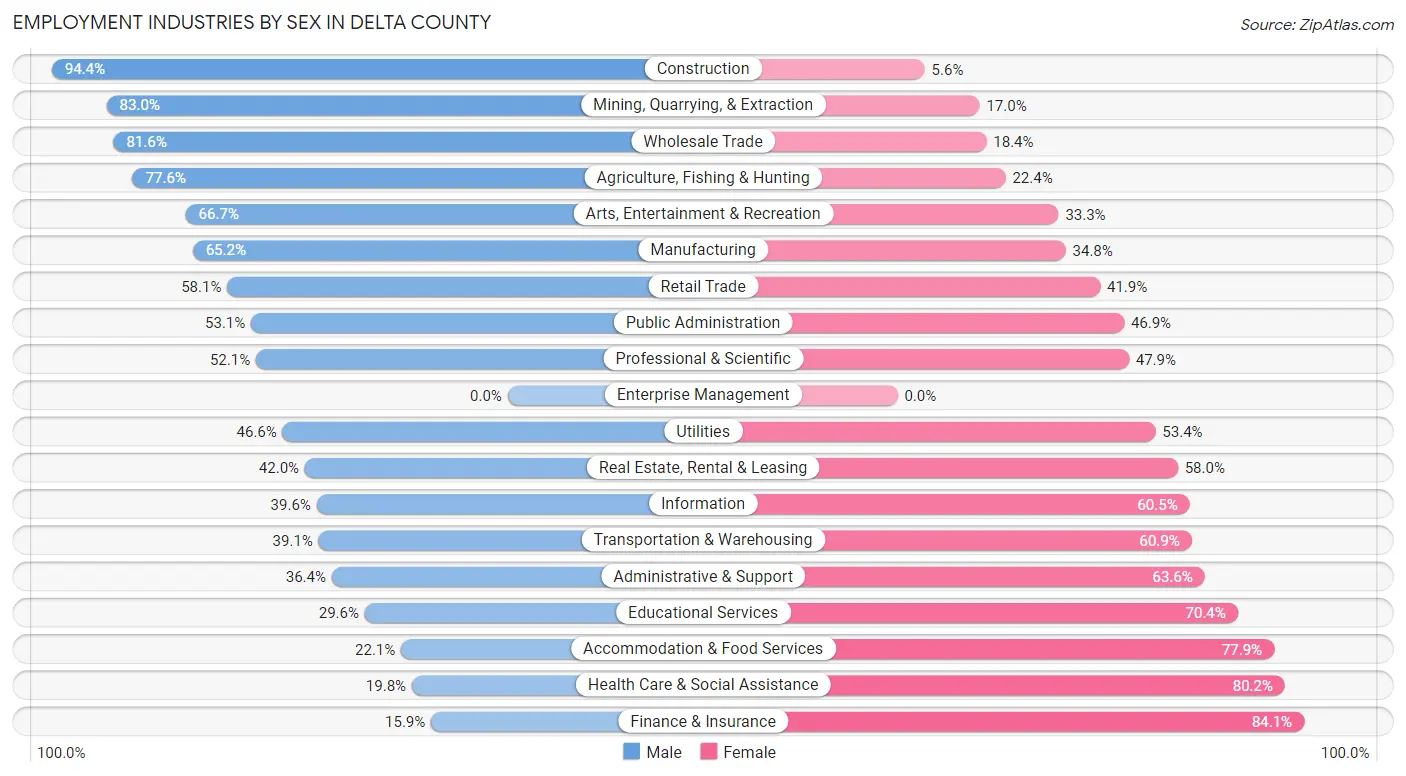
| Industry | Male | Female |
| Agriculture, Fishing & Hunting | 517 (77.6%) | 149 (22.4%) |
| Mining, Quarrying, & Extraction | 557 (83.0%) | 114 (17.0%) |
| Construction | 1,021 (94.4%) | 61 (5.6%) |
| Manufacturing | 573 (65.2%) | 306 (34.8%) |
| Wholesale Trade | 226 (81.6%) | 51 (18.4%) |
| Retail Trade | 868 (58.1%) | 627 (41.9%) |
| Transportation & Warehousing | 144 (39.1%) | 224 (60.9%) |
| Utilities | 89 (46.6%) | 102 (53.4%) |
| Information | 87 (39.6%) | 133 (60.5%) |
| Finance & Insurance | 56 (15.9%) | 297 (84.1%) |
| Real Estate, Rental & Leasing | 68 (42.0%) | 94 (58.0%) |
| Professional & Scientific | 297 (52.1%) | 273 (47.9%) |
| Enterprise Management | 0 (0.0%) | 0 (0.0%) |
| Administrative & Support | 130 (36.4%) | 227 (63.6%) |
| Educational Services | 266 (29.6%) | 633 (70.4%) |
| Health Care & Social Assistance | 319 (19.8%) | 1,290 (80.2%) |
| Arts, Entertainment & Recreation | 136 (66.7%) | 68 (33.3%) |
| Accommodation & Food Services | 190 (22.1%) | 671 (77.9%) |
| Public Administration | 282 (53.1%) | 249 (46.9%) |
| Total | 6,225 (50.9%) | 6,003 (49.1%) |
Education in Delta County
School Enrollment in Delta County
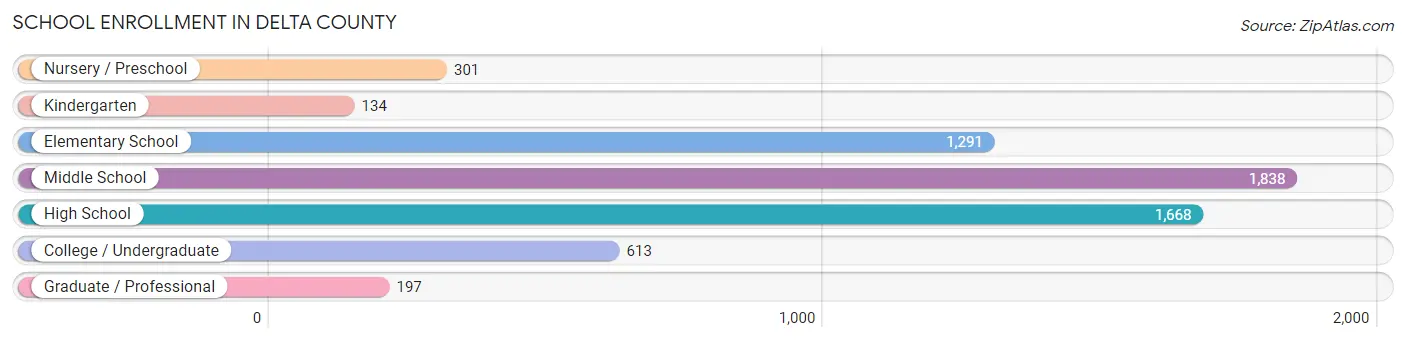
The most common levels of schooling among the 6,042 students in Delta County are middle school (1,838 | 30.4%), high school (1,668 | 27.6%), and elementary school (1,291 | 21.4%).
| School Level | # Students | % Students |
| Nursery / Preschool | 301 | 5.0% |
| Kindergarten | 134 | 2.2% |
| Elementary School | 1,291 | 21.4% |
| Middle School | 1,838 | 30.4% |
| High School | 1,668 | 27.6% |
| College / Undergraduate | 613 | 10.2% |
| Graduate / Professional | 197 | 3.3% |
| Total | 6,042 | 100.0% |
School Enrollment by Age by Funding Source in Delta County
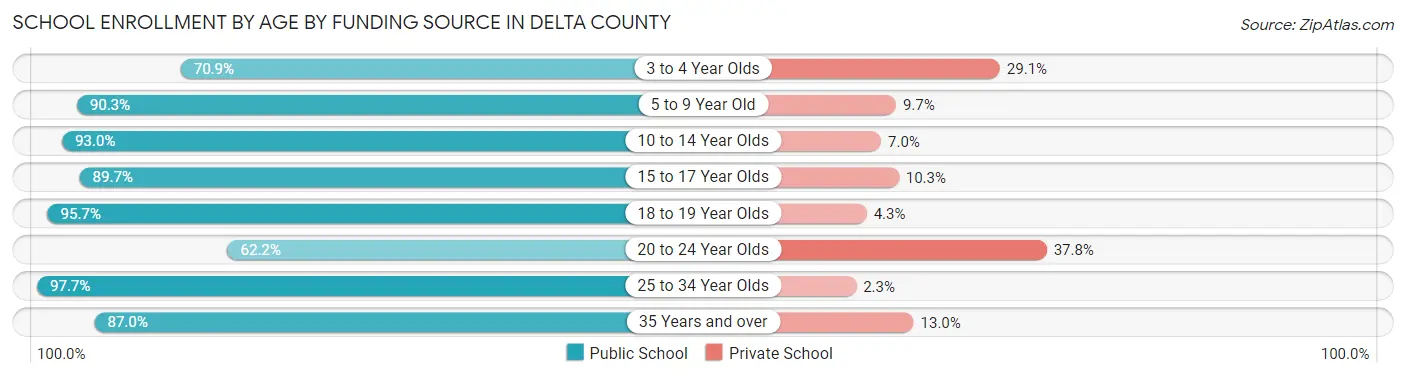
Out of a total of 6,042 students who are enrolled in schools in Delta County, 640 (10.6%) attend a private institution, while the remaining 5,402 (89.4%) are enrolled in public schools. The age group of 20 to 24 year olds has the highest likelihood of being enrolled in private schools, with 104 (37.8% in the age bracket) enrolled. Conversely, the age group of 25 to 34 year olds has the lowest likelihood of being enrolled in a private school, with 167 (97.7% in the age bracket) attending a public institution.
| Age Bracket | Public School | Private School |
| 3 to 4 Year Olds | 190 (70.9%) | 78 (29.1%) |
| 5 to 9 Year Old | 1,103 (90.3%) | 119 (9.7%) |
| 10 to 14 Year Olds | 1,988 (93.0%) | 149 (7.0%) |
| 15 to 17 Year Olds | 1,032 (89.7%) | 118 (10.3%) |
| 18 to 19 Year Olds | 446 (95.7%) | 20 (4.3%) |
| 20 to 24 Year Olds | 171 (62.2%) | 104 (37.8%) |
| 25 to 34 Year Olds | 167 (97.7%) | 4 (2.3%) |
| 35 Years and over | 307 (87.0%) | 46 (13.0%) |
| Total | 5,402 (89.4%) | 640 (10.6%) |
Educational Attainment by Field of Study in Delta County
Education (1,202 | 19.6%), business (755 | 12.3%), bio, nature & agricultural (706 | 11.5%), science & technology (525 | 8.5%), and liberal arts & history (467 | 7.6%) are the most common fields of study among 6,144 individuals in Delta County who have obtained a bachelor's degree or higher.
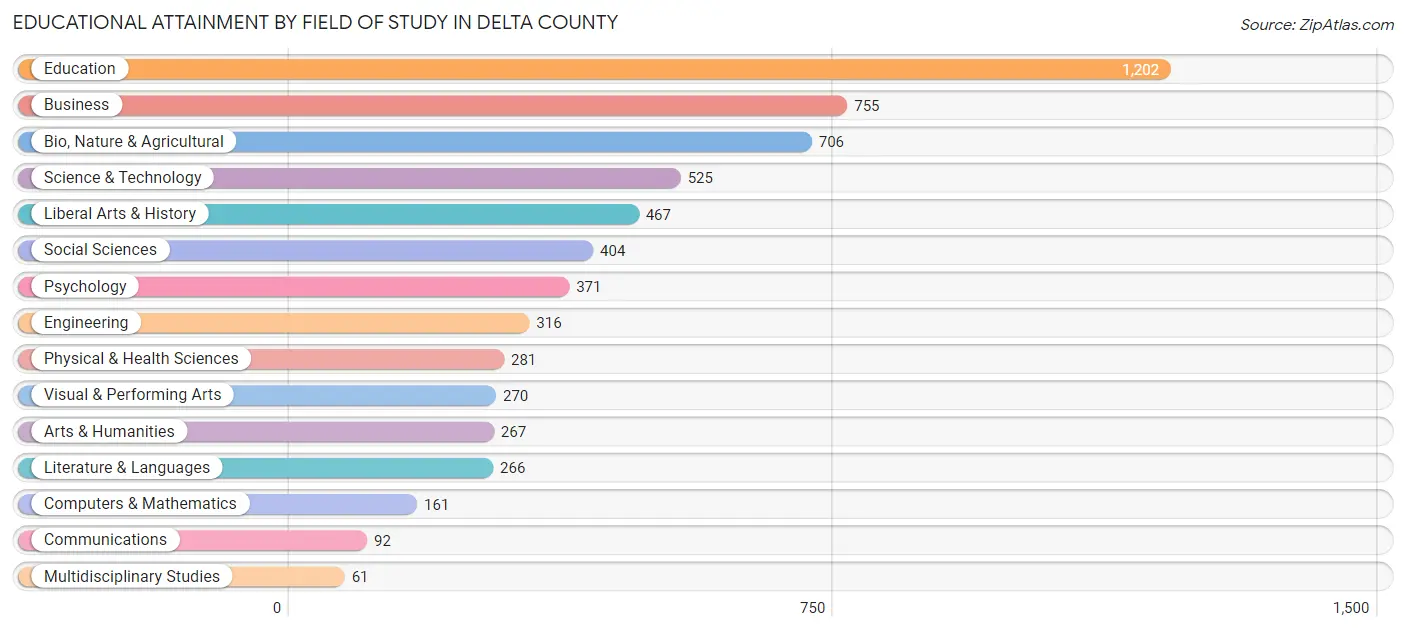
| Field of Study | # Graduates | % Graduates |
| Computers & Mathematics | 161 | 2.6% |
| Bio, Nature & Agricultural | 706 | 11.5% |
| Physical & Health Sciences | 281 | 4.6% |
| Psychology | 371 | 6.0% |
| Social Sciences | 404 | 6.6% |
| Engineering | 316 | 5.1% |
| Multidisciplinary Studies | 61 | 1.0% |
| Science & Technology | 525 | 8.5% |
| Business | 755 | 12.3% |
| Education | 1,202 | 19.6% |
| Literature & Languages | 266 | 4.3% |
| Liberal Arts & History | 467 | 7.6% |
| Visual & Performing Arts | 270 | 4.4% |
| Communications | 92 | 1.5% |
| Arts & Humanities | 267 | 4.3% |
| Total | 6,144 | 100.0% |
Transportation & Commute in Delta County
Vehicle Availability by Sex in Delta County
The most prevalent vehicle ownership categories in Delta County are males with 2 vehicles (2,025, accounting for 33.4%) and females with 2 vehicles (1,843, making up 34.5%).
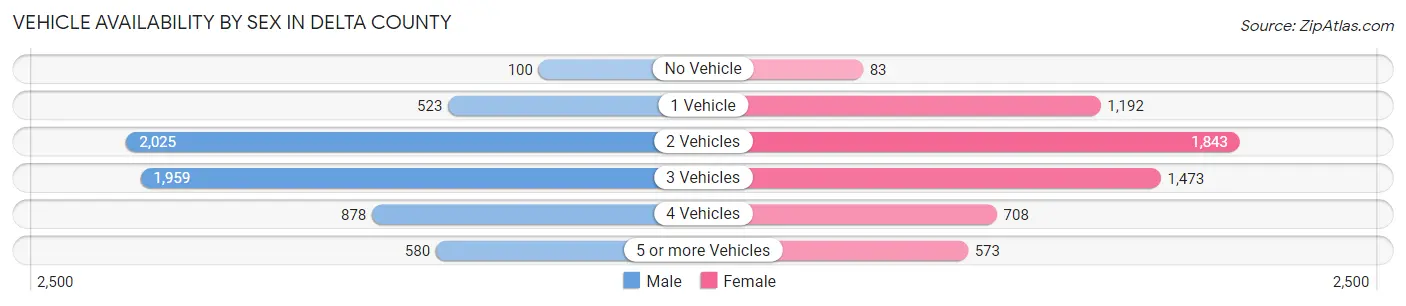
| Vehicles Available | Male | Female |
| No Vehicle | 100 (1.7%) | 83 (1.4%) |
| 1 Vehicle | 523 (8.6%) | 1,192 (20.3%) |
| 2 Vehicles | 2,025 (33.4%) | 1,843 (31.4%) |
| 3 Vehicles | 1,959 (32.3%) | 1,473 (25.1%) |
| 4 Vehicles | 878 (14.5%) | 708 (12.1%) |
| 5 or more Vehicles | 580 (9.6%) | 573 (9.8%) |
| Total | 6,065 (100.0%) | 5,872 (100.0%) |
Commute Time in Delta County
The most frequently occuring commute durations in Delta County are 5 to 9 minutes (2,073 commuters, 19.8%), 10 to 14 minutes (1,537 commuters, 14.7%), and 15 to 19 minutes (1,301 commuters, 12.4%).
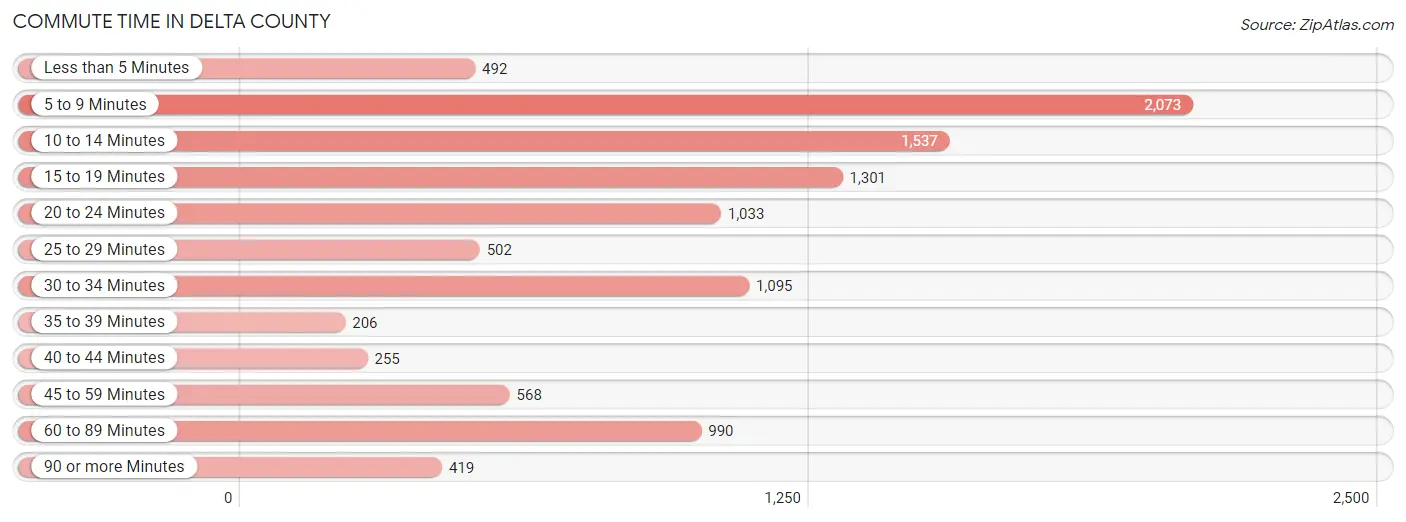
| Commute Time | # Commuters | % Commuters |
| Less than 5 Minutes | 492 | 4.7% |
| 5 to 9 Minutes | 2,073 | 19.8% |
| 10 to 14 Minutes | 1,537 | 14.7% |
| 15 to 19 Minutes | 1,301 | 12.4% |
| 20 to 24 Minutes | 1,033 | 9.9% |
| 25 to 29 Minutes | 502 | 4.8% |
| 30 to 34 Minutes | 1,095 | 10.5% |
| 35 to 39 Minutes | 206 | 2.0% |
| 40 to 44 Minutes | 255 | 2.4% |
| 45 to 59 Minutes | 568 | 5.4% |
| 60 to 89 Minutes | 990 | 9.5% |
| 90 or more Minutes | 419 | 4.0% |
Commute Time by Sex in Delta County
The most common commute times in Delta County are 20 to 24 minutes (710 commuters, 13.1%) for males and 5 to 9 minutes (1,436 commuters, 28.3%) for females.
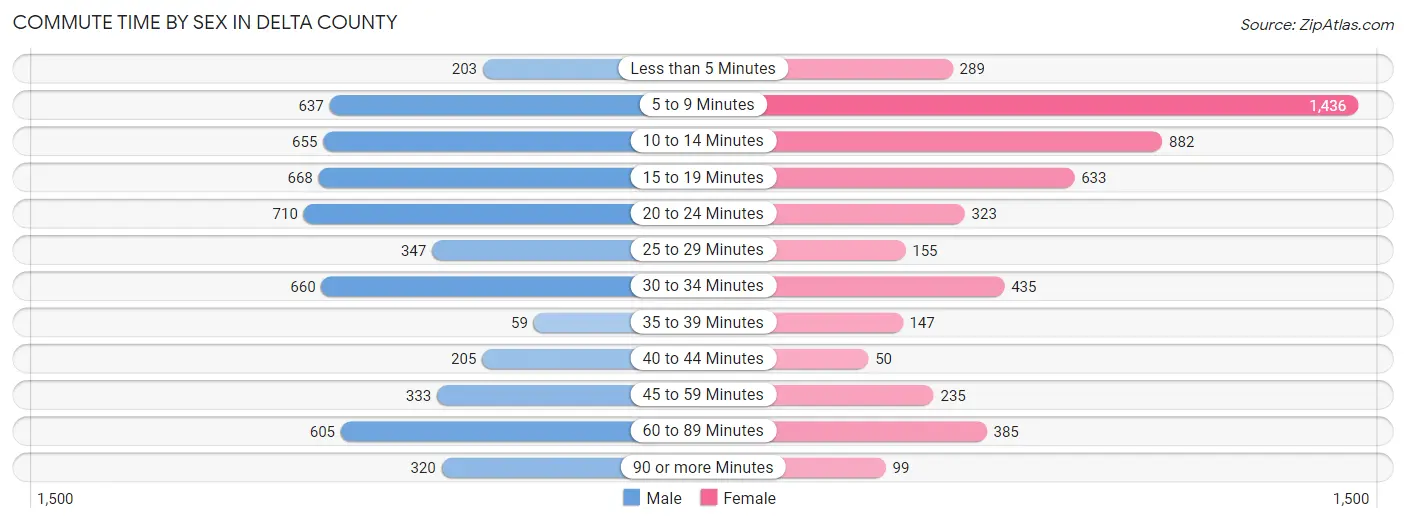
| Commute Time | Male | Female |
| Less than 5 Minutes | 203 (3.8%) | 289 (5.7%) |
| 5 to 9 Minutes | 637 (11.8%) | 1,436 (28.3%) |
| 10 to 14 Minutes | 655 (12.1%) | 882 (17.4%) |
| 15 to 19 Minutes | 668 (12.4%) | 633 (12.5%) |
| 20 to 24 Minutes | 710 (13.1%) | 323 (6.4%) |
| 25 to 29 Minutes | 347 (6.4%) | 155 (3.1%) |
| 30 to 34 Minutes | 660 (12.2%) | 435 (8.6%) |
| 35 to 39 Minutes | 59 (1.1%) | 147 (2.9%) |
| 40 to 44 Minutes | 205 (3.8%) | 50 (1.0%) |
| 45 to 59 Minutes | 333 (6.2%) | 235 (4.6%) |
| 60 to 89 Minutes | 605 (11.2%) | 385 (7.6%) |
| 90 or more Minutes | 320 (5.9%) | 99 (1.9%) |
Time of Departure to Work by Sex in Delta County
The most frequent times of departure to work in Delta County are 7:30 AM to 7:59 AM (740, 13.7%) for males and 7:30 AM to 7:59 AM (1,140, 22.5%) for females.
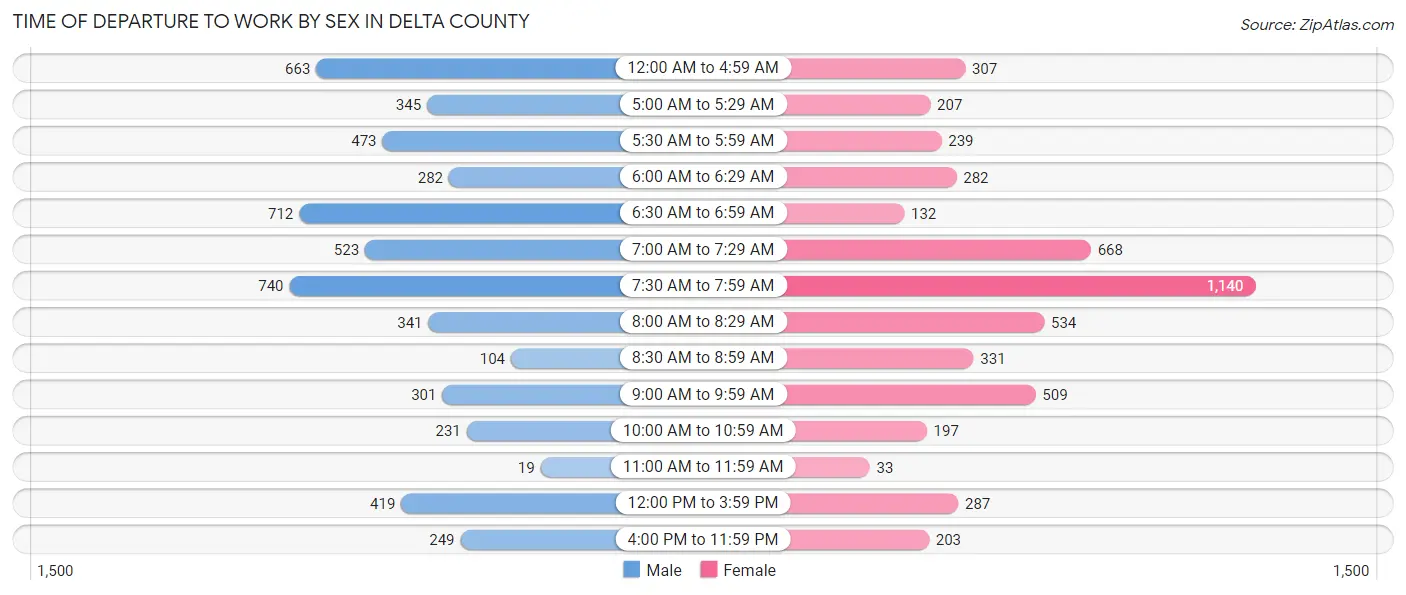
| Time of Departure | Male | Female |
| 12:00 AM to 4:59 AM | 663 (12.3%) | 307 (6.1%) |
| 5:00 AM to 5:29 AM | 345 (6.4%) | 207 (4.1%) |
| 5:30 AM to 5:59 AM | 473 (8.8%) | 239 (4.7%) |
| 6:00 AM to 6:29 AM | 282 (5.2%) | 282 (5.6%) |
| 6:30 AM to 6:59 AM | 712 (13.2%) | 132 (2.6%) |
| 7:00 AM to 7:29 AM | 523 (9.7%) | 668 (13.2%) |
| 7:30 AM to 7:59 AM | 740 (13.7%) | 1,140 (22.5%) |
| 8:00 AM to 8:29 AM | 341 (6.3%) | 534 (10.5%) |
| 8:30 AM to 8:59 AM | 104 (1.9%) | 331 (6.5%) |
| 9:00 AM to 9:59 AM | 301 (5.6%) | 509 (10.0%) |
| 10:00 AM to 10:59 AM | 231 (4.3%) | 197 (3.9%) |
| 11:00 AM to 11:59 AM | 19 (0.4%) | 33 (0.6%) |
| 12:00 PM to 3:59 PM | 419 (7.8%) | 287 (5.7%) |
| 4:00 PM to 11:59 PM | 249 (4.6%) | 203 (4.0%) |
| Total | 5,402 (100.0%) | 5,069 (100.0%) |
Housing Occupancy in Delta County
Occupancy by Ownership in Delta County
Of the total 12,263 dwellings in Delta County, owner-occupied units account for 9,328 (76.1%), while renter-occupied units make up 2,935 (23.9%).
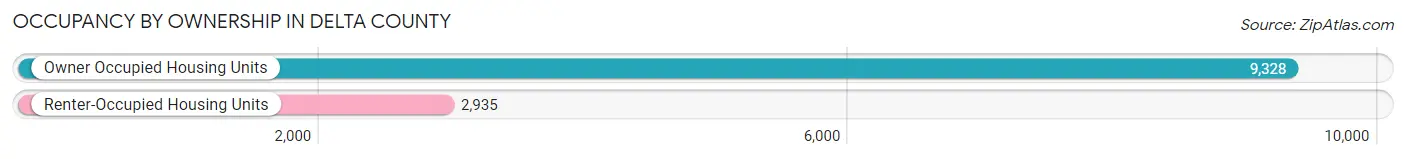
| Occupancy | # Housing Units | % Housing Units |
| Owner Occupied Housing Units | 9,328 | 76.1% |
| Renter-Occupied Housing Units | 2,935 | 23.9% |
| Total Occupied Housing Units | 12,263 | 100.0% |
Occupancy by Household Size in Delta County
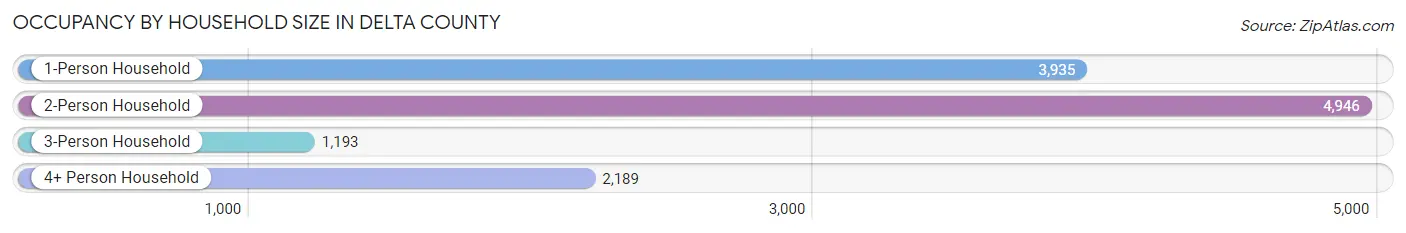
| Household Size | # Housing Units | % Housing Units |
| 1-Person Household | 3,935 | 32.1% |
| 2-Person Household | 4,946 | 40.3% |
| 3-Person Household | 1,193 | 9.7% |
| 4+ Person Household | 2,189 | 17.8% |
| Total Housing Units | 12,263 | 100.0% |
Occupancy by Ownership by Household Size in Delta County
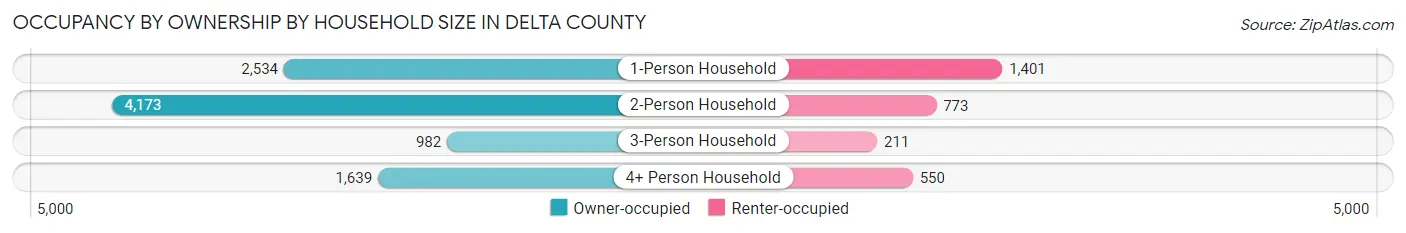
| Household Size | Owner-occupied | Renter-occupied |
| 1-Person Household | 2,534 (64.4%) | 1,401 (35.6%) |
| 2-Person Household | 4,173 (84.4%) | 773 (15.6%) |
| 3-Person Household | 982 (82.3%) | 211 (17.7%) |
| 4+ Person Household | 1,639 (74.9%) | 550 (25.1%) |
| Total Housing Units | 9,328 (76.1%) | 2,935 (23.9%) |
Occupancy by Educational Attainment in Delta County
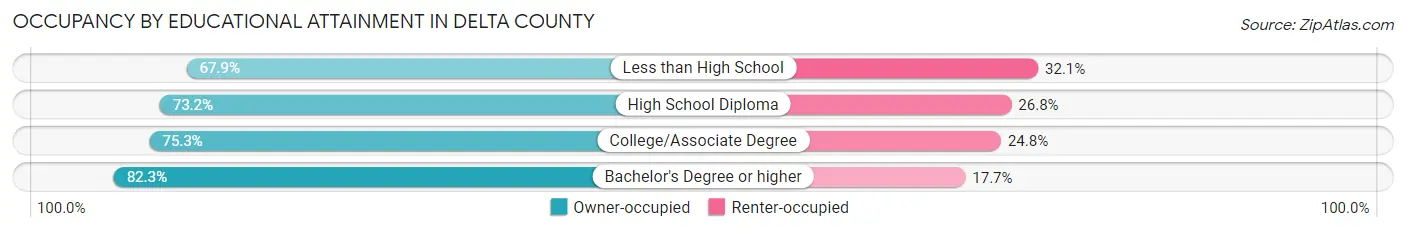
| Household Size | Owner-occupied | Renter-occupied |
| Less than High School | 719 (67.9%) | 340 (32.1%) |
| High School Diploma | 2,793 (73.2%) | 1,023 (26.8%) |
| College/Associate Degree | 2,831 (75.2%) | 931 (24.7%) |
| Bachelor's Degree or higher | 2,985 (82.3%) | 641 (17.7%) |
Occupancy by Age of Householder in Delta County
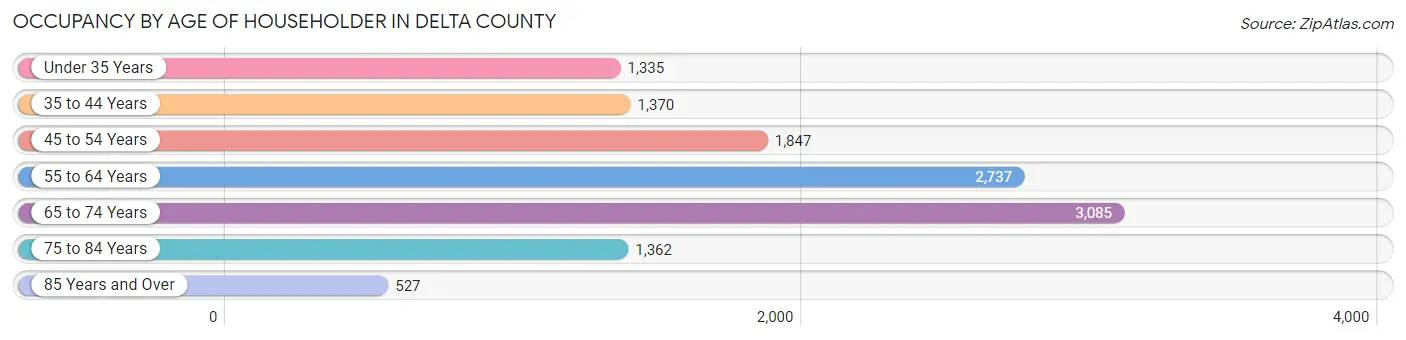
| Age Bracket | # Households | % Households |
| Under 35 Years | 1,335 | 10.9% |
| 35 to 44 Years | 1,370 | 11.2% |
| 45 to 54 Years | 1,847 | 15.1% |
| 55 to 64 Years | 2,737 | 22.3% |
| 65 to 74 Years | 3,085 | 25.2% |
| 75 to 84 Years | 1,362 | 11.1% |
| 85 Years and Over | 527 | 4.3% |
| Total | 12,263 | 100.0% |
Housing Finances in Delta County
Median Income by Occupancy in Delta County
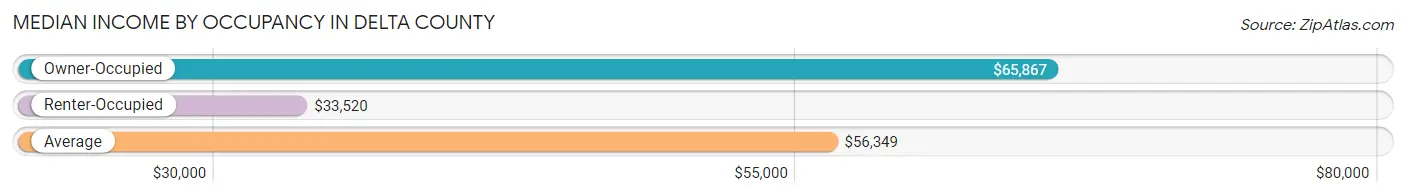
| Occupancy Type | # Households | Median Income |
| Owner-Occupied | 9,328 (76.1%) | $65,867 |
| Renter-Occupied | 2,935 (23.9%) | $33,520 |
| Average | 12,263 (100.0%) | $56,349 |
Occupancy by Householder Income Bracket in Delta County
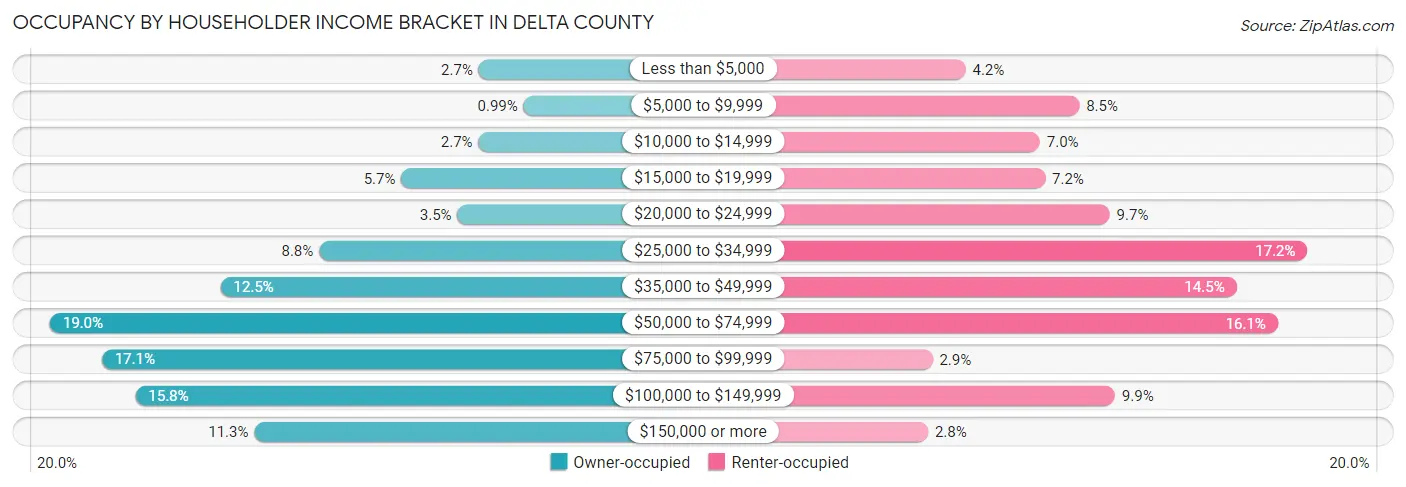
| Income Bracket | Owner-occupied | Renter-occupied |
| Less than $5,000 | 252 (2.7%) | 123 (4.2%) |
| $5,000 to $9,999 | 92 (1.0%) | 250 (8.5%) |
| $10,000 to $14,999 | 253 (2.7%) | 206 (7.0%) |
| $15,000 to $19,999 | 527 (5.7%) | 212 (7.2%) |
| $20,000 to $24,999 | 327 (3.5%) | 284 (9.7%) |
| $25,000 to $34,999 | 819 (8.8%) | 505 (17.2%) |
| $35,000 to $49,999 | 1,170 (12.5%) | 426 (14.5%) |
| $50,000 to $74,999 | 1,776 (19.0%) | 472 (16.1%) |
| $75,000 to $99,999 | 1,591 (17.1%) | 86 (2.9%) |
| $100,000 to $149,999 | 1,472 (15.8%) | 290 (9.9%) |
| $150,000 or more | 1,049 (11.3%) | 81 (2.8%) |
| Total | 9,328 (100.0%) | 2,935 (100.0%) |
Monthly Housing Cost Tiers in Delta County
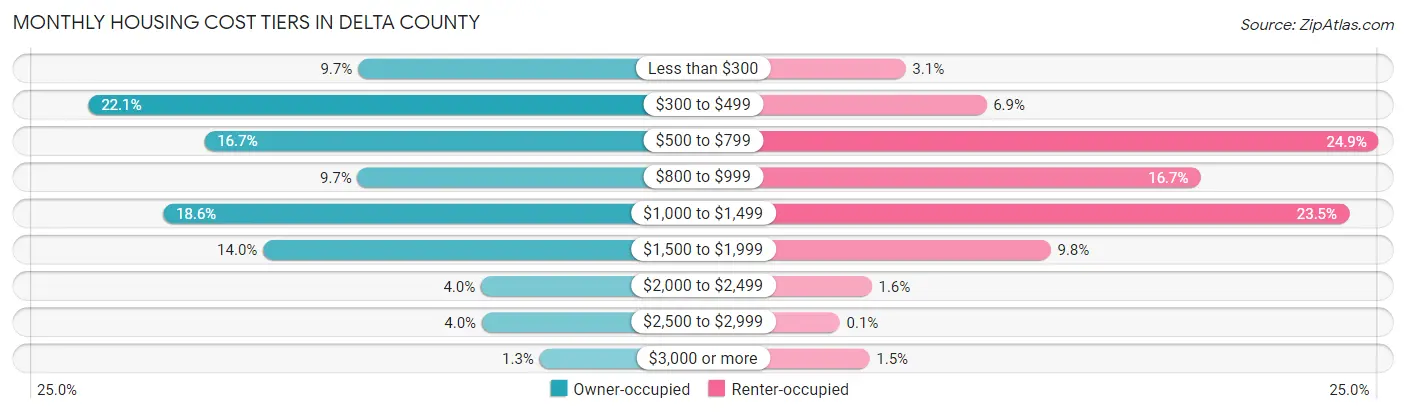
| Monthly Cost | Owner-occupied | Renter-occupied |
| Less than $300 | 900 (9.7%) | 92 (3.1%) |
| $300 to $499 | 2,059 (22.1%) | 201 (6.9%) |
| $500 to $799 | 1,561 (16.7%) | 731 (24.9%) |
| $800 to $999 | 902 (9.7%) | 490 (16.7%) |
| $1,000 to $1,499 | 1,738 (18.6%) | 691 (23.5%) |
| $1,500 to $1,999 | 1,308 (14.0%) | 288 (9.8%) |
| $2,000 to $2,499 | 372 (4.0%) | 46 (1.6%) |
| $2,500 to $2,999 | 368 (4.0%) | 3 (0.1%) |
| $3,000 or more | 120 (1.3%) | 43 (1.5%) |
| Total | 9,328 (100.0%) | 2,935 (100.0%) |
Physical Housing Characteristics in Delta County
Housing Structures in Delta County
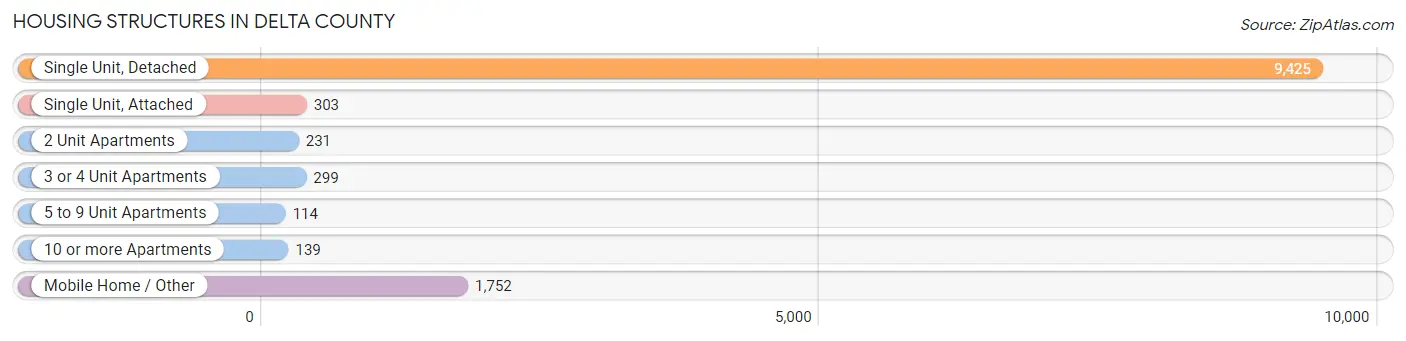
| Structure Type | # Housing Units | % Housing Units |
| Single Unit, Detached | 9,425 | 76.9% |
| Single Unit, Attached | 303 | 2.5% |
| 2 Unit Apartments | 231 | 1.9% |
| 3 or 4 Unit Apartments | 299 | 2.4% |
| 5 to 9 Unit Apartments | 114 | 0.9% |
| 10 or more Apartments | 139 | 1.1% |
| Mobile Home / Other | 1,752 | 14.3% |
| Total | 12,263 | 100.0% |
Housing Structures by Occupancy in Delta County
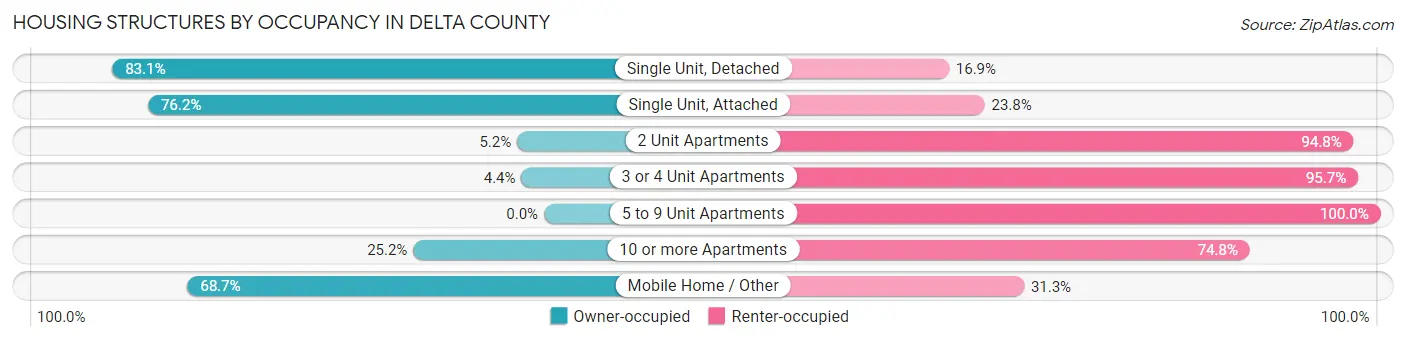
| Structure Type | Owner-occupied | Renter-occupied |
| Single Unit, Detached | 7,834 (83.1%) | 1,591 (16.9%) |
| Single Unit, Attached | 231 (76.2%) | 72 (23.8%) |
| 2 Unit Apartments | 12 (5.2%) | 219 (94.8%) |
| 3 or 4 Unit Apartments | 13 (4.3%) | 286 (95.7%) |
| 5 to 9 Unit Apartments | 0 (0.0%) | 114 (100.0%) |
| 10 or more Apartments | 35 (25.2%) | 104 (74.8%) |
| Mobile Home / Other | 1,203 (68.7%) | 549 (31.3%) |
| Total | 9,328 (76.1%) | 2,935 (23.9%) |
Housing Structures by Number of Rooms in Delta County
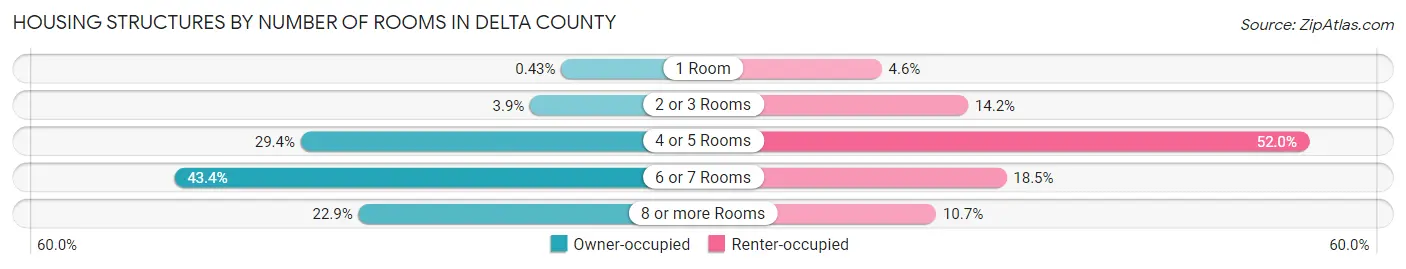
| Number of Rooms | Owner-occupied | Renter-occupied |
| 1 Room | 40 (0.4%) | 136 (4.6%) |
| 2 or 3 Rooms | 363 (3.9%) | 417 (14.2%) |
| 4 or 5 Rooms | 2,738 (29.3%) | 1,527 (52.0%) |
| 6 or 7 Rooms | 4,047 (43.4%) | 542 (18.5%) |
| 8 or more Rooms | 2,140 (22.9%) | 313 (10.7%) |
| Total | 9,328 (100.0%) | 2,935 (100.0%) |
Housing Structure by Heating Type in Delta County
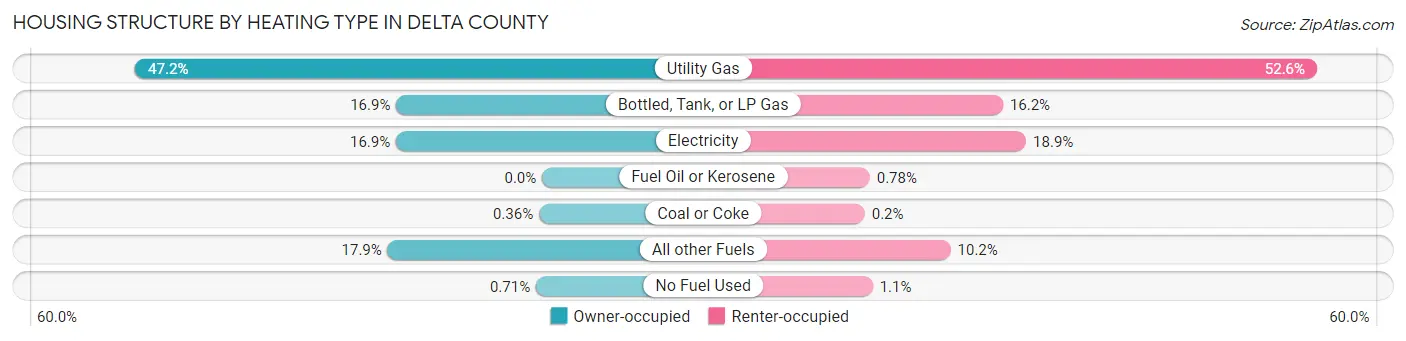
| Heating Type | Owner-occupied | Renter-occupied |
| Utility Gas | 4,401 (47.2%) | 1,544 (52.6%) |
| Bottled, Tank, or LP Gas | 1,577 (16.9%) | 476 (16.2%) |
| Electricity | 1,579 (16.9%) | 555 (18.9%) |
| Fuel Oil or Kerosene | 0 (0.0%) | 23 (0.8%) |
| Coal or Coke | 34 (0.4%) | 6 (0.2%) |
| All other Fuels | 1,671 (17.9%) | 298 (10.2%) |
| No Fuel Used | 66 (0.7%) | 33 (1.1%) |
| Total | 9,328 (100.0%) | 2,935 (100.0%) |
Household Vehicle Usage in Delta County
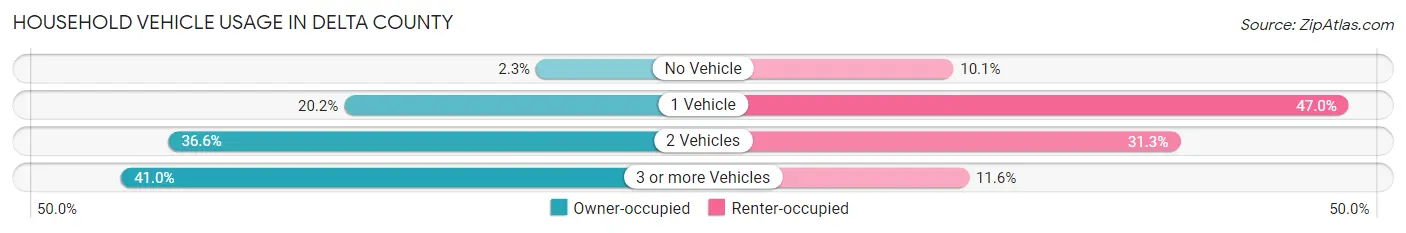
| Vehicles per Household | Owner-occupied | Renter-occupied |
| No Vehicle | 212 (2.3%) | 297 (10.1%) |
| 1 Vehicle | 1,882 (20.2%) | 1,380 (47.0%) |
| 2 Vehicles | 3,411 (36.6%) | 918 (31.3%) |
| 3 or more Vehicles | 3,823 (41.0%) | 340 (11.6%) |
| Total | 9,328 (100.0%) | 2,935 (100.0%) |
Real Estate & Mortgages in Delta County
Real Estate and Mortgage Overview in Delta County
| Characteristic | Without Mortgage | With Mortgage |
| Housing Units | 4,491 | 4,837 |
| Median Property Value | $289,700 | $293,300 |
| Median Household Income | $51,480 | $644 |
| Monthly Housing Costs | $434 | $120 |
| Real Estate Taxes | $876 | $26 |
Property Value by Mortgage Status in Delta County
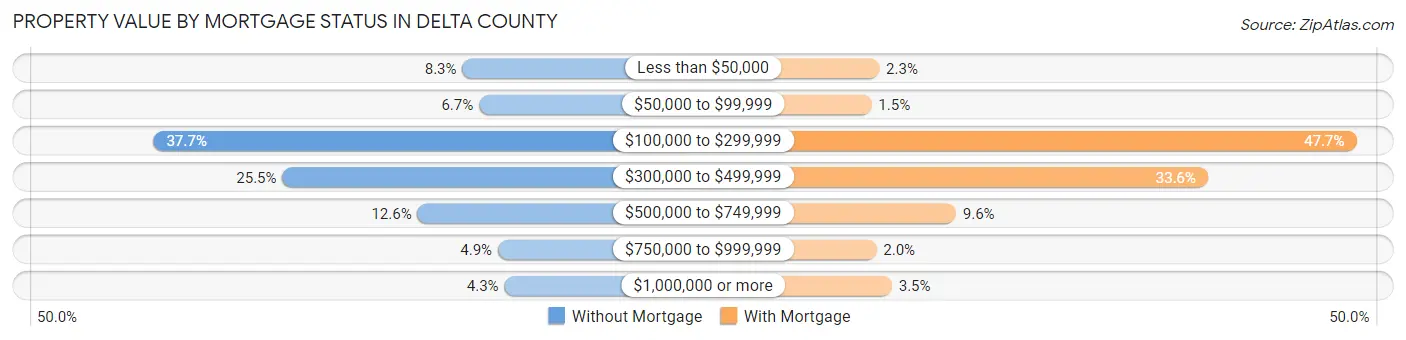
| Property Value | Without Mortgage | With Mortgage |
| Less than $50,000 | 373 (8.3%) | 109 (2.2%) |
| $50,000 to $99,999 | 302 (6.7%) | 73 (1.5%) |
| $100,000 to $299,999 | 1,694 (37.7%) | 2,307 (47.7%) |
| $300,000 to $499,999 | 1,143 (25.5%) | 1,623 (33.6%) |
| $500,000 to $749,999 | 565 (12.6%) | 462 (9.6%) |
| $750,000 to $999,999 | 221 (4.9%) | 96 (2.0%) |
| $1,000,000 or more | 193 (4.3%) | 167 (3.5%) |
| Total | 4,491 (100.0%) | 4,837 (100.0%) |
Household Income by Mortgage Status in Delta County
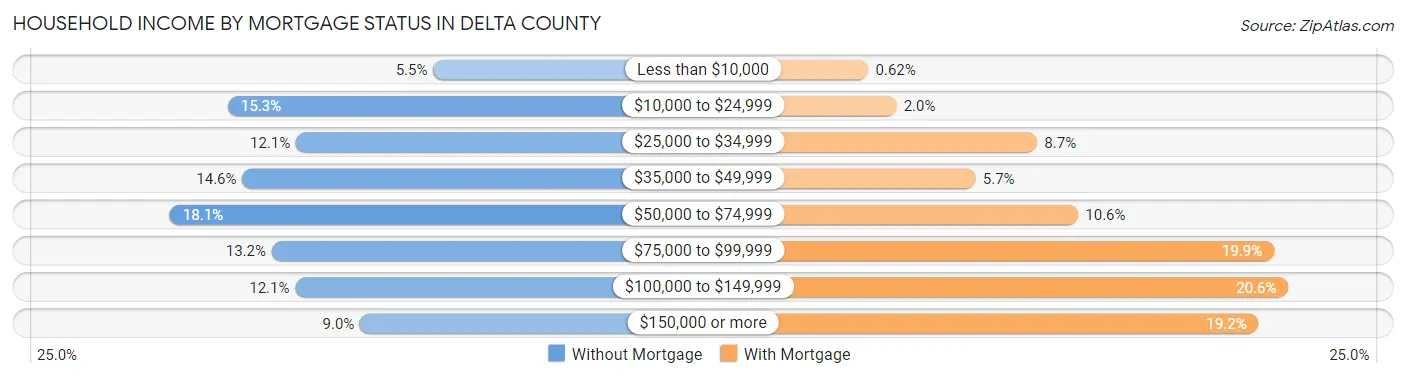
| Household Income | Without Mortgage | With Mortgage |
| Less than $10,000 | 249 (5.5%) | 30 (0.6%) |
| $10,000 to $24,999 | 688 (15.3%) | 95 (2.0%) |
| $25,000 to $34,999 | 542 (12.1%) | 419 (8.7%) |
| $35,000 to $49,999 | 657 (14.6%) | 277 (5.7%) |
| $50,000 to $74,999 | 812 (18.1%) | 513 (10.6%) |
| $75,000 to $99,999 | 594 (13.2%) | 964 (19.9%) |
| $100,000 to $149,999 | 544 (12.1%) | 997 (20.6%) |
| $150,000 or more | 405 (9.0%) | 928 (19.2%) |
| Total | 4,491 (100.0%) | 4,837 (100.0%) |
Property Value to Household Income Ratio in Delta County
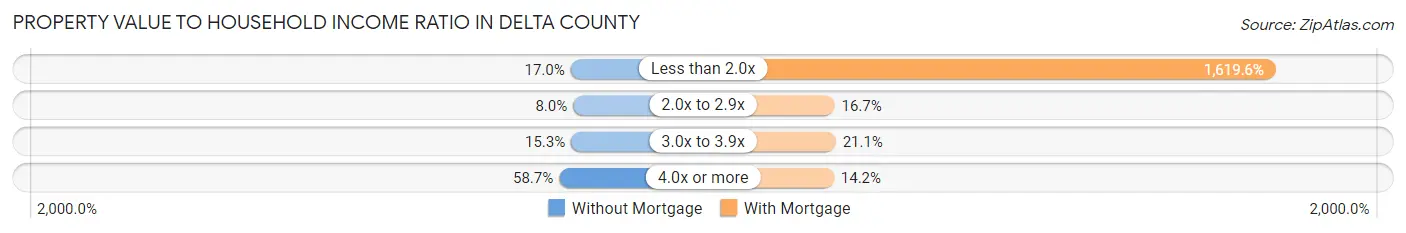
| Value-to-Income Ratio | Without Mortgage | With Mortgage |
| Less than 2.0x | 765 (17.0%) | 78,340 (1,619.6%) |
| 2.0x to 2.9x | 359 (8.0%) | 809 (16.7%) |
| 3.0x to 3.9x | 687 (15.3%) | 1,018 (21.0%) |
| 4.0x or more | 2,634 (58.7%) | 689 (14.2%) |
| Total | 4,491 (100.0%) | 4,837 (100.0%) |
Real Estate Taxes by Mortgage Status in Delta County
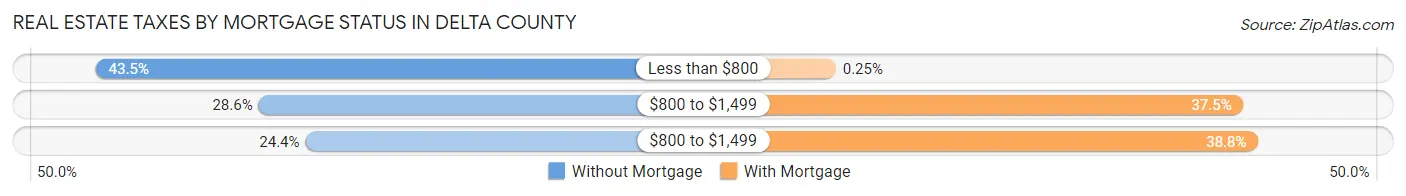
| Property Taxes | Without Mortgage | With Mortgage |
| Less than $800 | 1,954 (43.5%) | 12 (0.3%) |
| $800 to $1,499 | 1,286 (28.6%) | 1,813 (37.5%) |
| $800 to $1,499 | 1,094 (24.4%) | 1,878 (38.8%) |
| Total | 4,491 (100.0%) | 4,837 (100.0%) |
Health & Disability in Delta County
Health Insurance Coverage by Age in Delta County
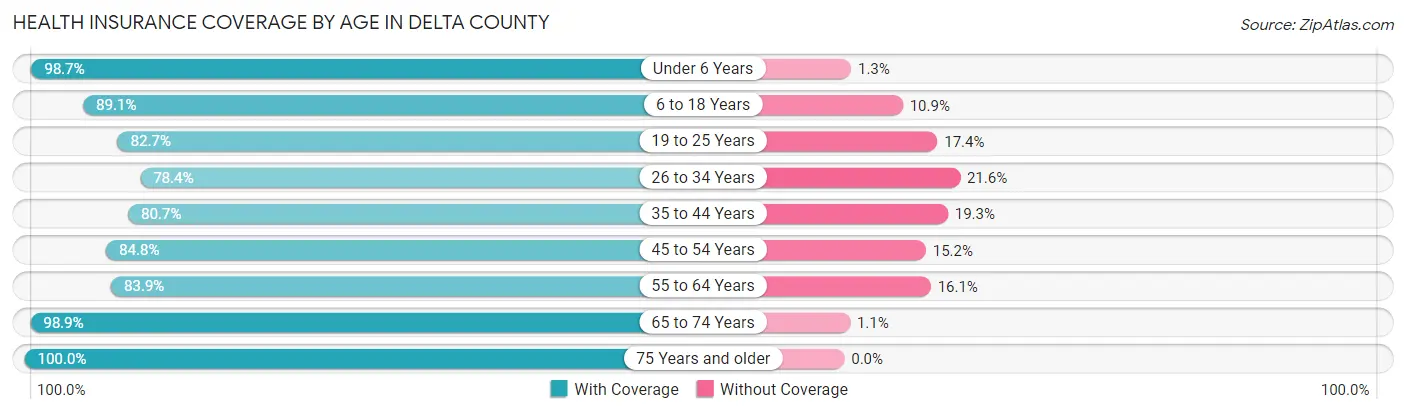
| Age Bracket | With Coverage | Without Coverage |
| Under 6 Years | 1,564 (98.7%) | 20 (1.3%) |
| 6 to 18 Years | 4,454 (89.1%) | 545 (10.9%) |
| 19 to 25 Years | 1,443 (82.7%) | 303 (17.3%) |
| 26 to 34 Years | 1,923 (78.4%) | 529 (21.6%) |
| 35 to 44 Years | 2,688 (80.7%) | 643 (19.3%) |
| 45 to 54 Years | 2,594 (84.8%) | 465 (15.2%) |
| 55 to 64 Years | 3,995 (83.9%) | 767 (16.1%) |
| 65 to 74 Years | 4,951 (98.9%) | 53 (1.1%) |
| 75 Years and older | 3,235 (100.0%) | 0 (0.0%) |
| Total | 26,847 (89.0%) | 3,325 (11.0%) |
Health Insurance Coverage by Citizenship Status in Delta County
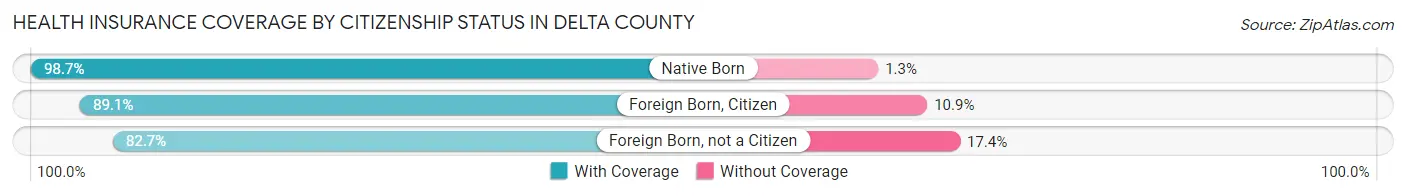
| Citizenship Status | With Coverage | Without Coverage |
| Native Born | 1,564 (98.7%) | 20 (1.3%) |
| Foreign Born, Citizen | 4,454 (89.1%) | 545 (10.9%) |
| Foreign Born, not a Citizen | 1,443 (82.7%) | 303 (17.3%) |
Health Insurance Coverage by Household Income in Delta County
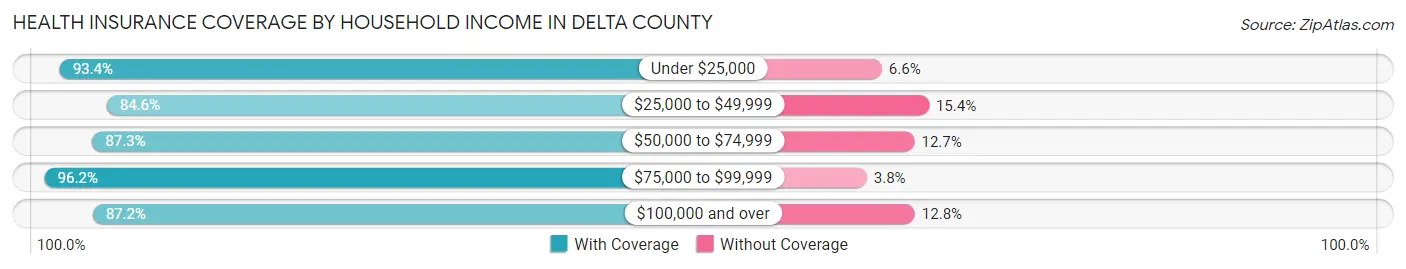
| Household Income | With Coverage | Without Coverage |
| Under $25,000 | 3,973 (93.4%) | 280 (6.6%) |
| $25,000 to $49,999 | 4,928 (84.6%) | 897 (15.4%) |
| $50,000 to $74,999 | 5,182 (87.3%) | 754 (12.7%) |
| $75,000 to $99,999 | 4,422 (96.2%) | 173 (3.8%) |
| $100,000 and over | 8,194 (87.2%) | 1,199 (12.8%) |
Public vs Private Health Insurance Coverage by Age in Delta County
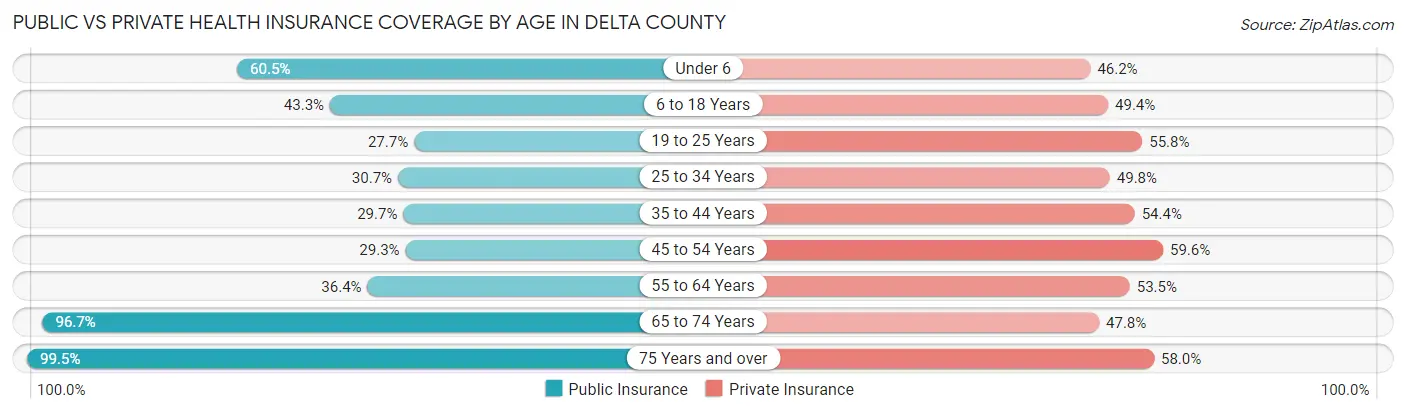
| Age Bracket | Public Insurance | Private Insurance |
| Under 6 | 959 (60.5%) | 731 (46.2%) |
| 6 to 18 Years | 2,166 (43.3%) | 2,471 (49.4%) |
| 19 to 25 Years | 484 (27.7%) | 974 (55.8%) |
| 25 to 34 Years | 753 (30.7%) | 1,220 (49.8%) |
| 35 to 44 Years | 990 (29.7%) | 1,811 (54.4%) |
| 45 to 54 Years | 897 (29.3%) | 1,824 (59.6%) |
| 55 to 64 Years | 1,732 (36.4%) | 2,546 (53.5%) |
| 65 to 74 Years | 4,838 (96.7%) | 2,390 (47.8%) |
| 75 Years and over | 3,220 (99.5%) | 1,875 (58.0%) |
| Total | 16,039 (53.2%) | 15,842 (52.5%) |
Disability Status by Sex by Age in Delta County
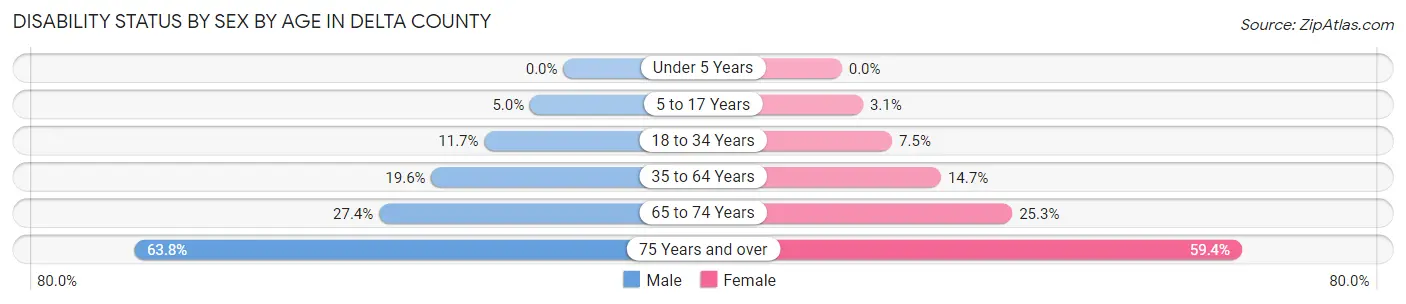
| Age Bracket | Male | Female |
| Under 5 Years | 0 (0.0%) | 0 (0.0%) |
| 5 to 17 Years | 122 (5.0%) | 71 (3.1%) |
| 18 to 34 Years | 284 (11.7%) | 169 (7.5%) |
| 35 to 64 Years | 1,032 (19.6%) | 867 (14.7%) |
| 65 to 74 Years | 662 (27.4%) | 654 (25.3%) |
| 75 Years and over | 957 (63.8%) | 1,030 (59.4%) |
Disability Class by Sex by Age in Delta County
Disability Class: Hearing Difficulty
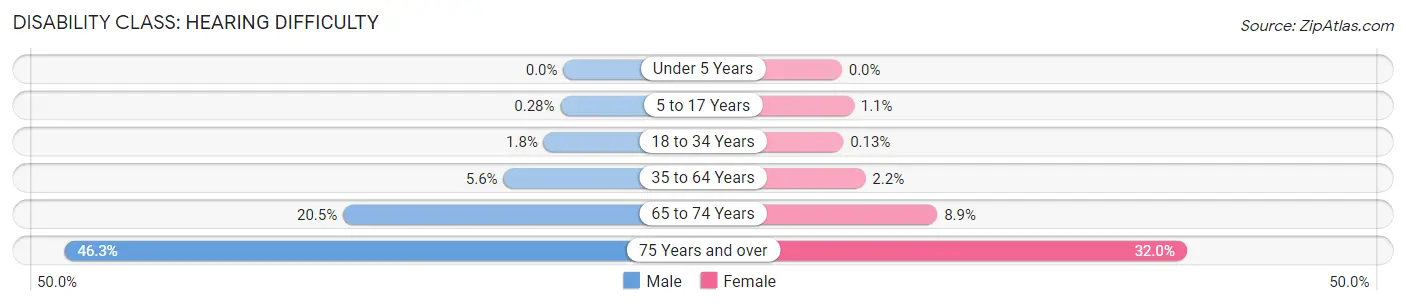
| Age Bracket | Male | Female |
| Under 5 Years | 0 (0.0%) | 0 (0.0%) |
| 5 to 17 Years | 7 (0.3%) | 25 (1.1%) |
| 18 to 34 Years | 44 (1.8%) | 3 (0.1%) |
| 35 to 64 Years | 293 (5.6%) | 129 (2.2%) |
| 65 to 74 Years | 495 (20.4%) | 229 (8.9%) |
| 75 Years and over | 695 (46.3%) | 555 (32.0%) |
Disability Class: Vision Difficulty
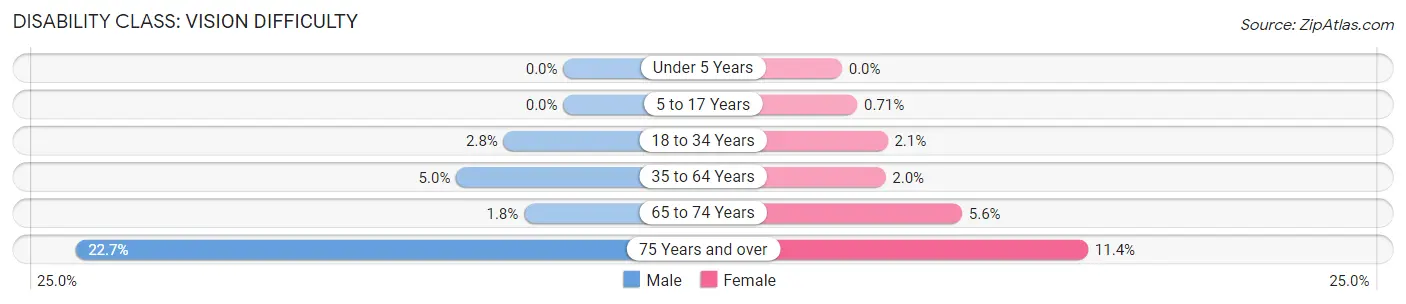
| Age Bracket | Male | Female |
| Under 5 Years | 0 (0.0%) | 0 (0.0%) |
| 5 to 17 Years | 0 (0.0%) | 16 (0.7%) |
| 18 to 34 Years | 67 (2.8%) | 48 (2.1%) |
| 35 to 64 Years | 262 (5.0%) | 119 (2.0%) |
| 65 to 74 Years | 44 (1.8%) | 144 (5.6%) |
| 75 Years and over | 340 (22.7%) | 198 (11.4%) |
Disability Class: Cognitive Difficulty
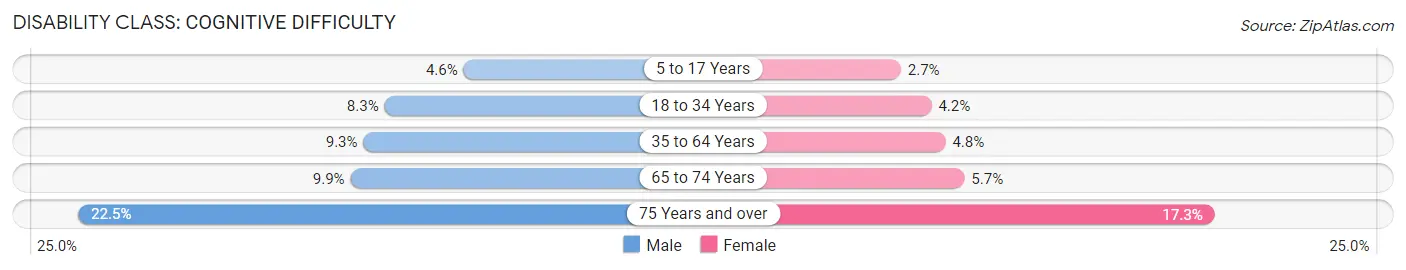
| Age Bracket | Male | Female |
| 5 to 17 Years | 114 (4.6%) | 62 (2.7%) |
| 18 to 34 Years | 201 (8.3%) | 94 (4.2%) |
| 35 to 64 Years | 489 (9.3%) | 283 (4.8%) |
| 65 to 74 Years | 239 (9.9%) | 147 (5.7%) |
| 75 Years and over | 338 (22.5%) | 300 (17.3%) |
Disability Class: Ambulatory Difficulty
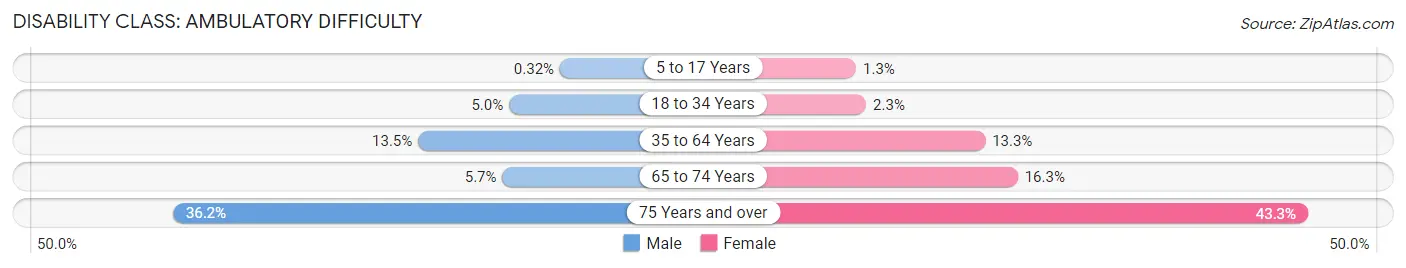
| Age Bracket | Male | Female |
| 5 to 17 Years | 8 (0.3%) | 30 (1.3%) |
| 18 to 34 Years | 122 (5.0%) | 51 (2.3%) |
| 35 to 64 Years | 710 (13.5%) | 783 (13.3%) |
| 65 to 74 Years | 137 (5.7%) | 422 (16.3%) |
| 75 Years and over | 544 (36.2%) | 750 (43.2%) |
Disability Class: Self-Care Difficulty
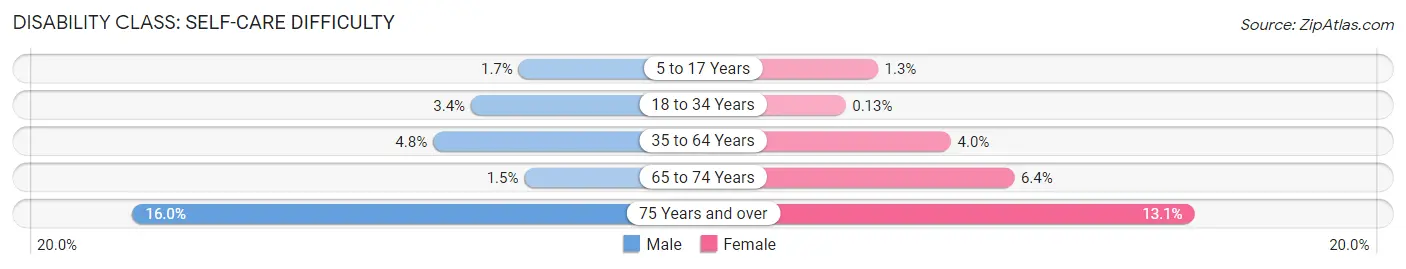
| Age Bracket | Male | Female |
| 5 to 17 Years | 41 (1.7%) | 30 (1.3%) |
| 18 to 34 Years | 83 (3.4%) | 3 (0.1%) |
| 35 to 64 Years | 255 (4.8%) | 238 (4.0%) |
| 65 to 74 Years | 35 (1.5%) | 165 (6.4%) |
| 75 Years and over | 240 (16.0%) | 227 (13.1%) |
Technology Access in Delta County
Computing Device Access in Delta County
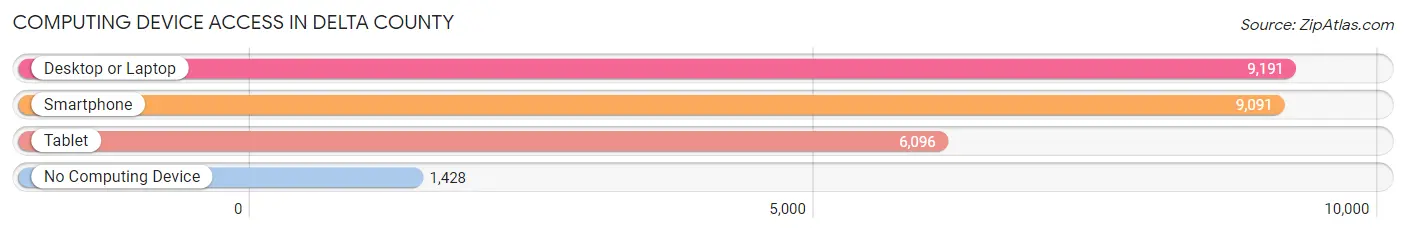
| Device Type | # Households | % Households |
| Desktop or Laptop | 9,191 | 75.0% |
| Smartphone | 9,091 | 74.1% |
| Tablet | 6,096 | 49.7% |
| No Computing Device | 1,428 | 11.6% |
| Total | 12,263 | 100.0% |
Internet Access in Delta County
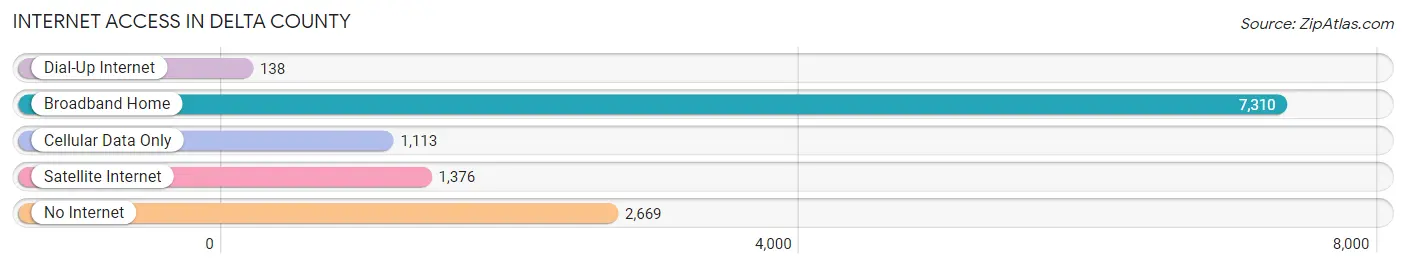
| Internet Type | # Households | % Households |
| Dial-Up Internet | 138 | 1.1% |
| Broadband Home | 7,310 | 59.6% |
| Cellular Data Only | 1,113 | 9.1% |
| Satellite Internet | 1,376 | 11.2% |
| No Internet | 2,669 | 21.8% |
| Total | 12,263 | 100.0% |
Delta County Summary
County History
Delta County is located in the western part of Colorado and is part of the Grand Junction Metropolitan Statistical Area. The county was established in 1883 and was named after the nearby delta of the Gunnison River. The county was originally inhabited by the Ute Indians, who were later displaced by settlers in the late 19th century. The first settlers were ranchers and farmers, who were attracted to the area by its fertile soil and abundant water.
The county experienced a period of rapid growth in the early 20th century, as the area became a popular destination for tourists and outdoor enthusiasts. The area was also home to several coal mines, which provided employment for many of the county’s residents. The county’s population peaked in the 1950s, but has since declined due to the closure of the coal mines and the decline of the agricultural industry.
Geography
Delta County is located in the western part of Colorado and is bordered by Mesa County to the north, Montrose County to the east, Gunnison County to the south, and Utah to the west. The county covers an area of 1,149 square miles and has an elevation of 4,919 feet. The county is located in the Colorado Plateau region and is characterized by rolling hills, mesas, and canyons. The Gunnison River runs through the county and is a popular destination for fishing and rafting.
The county is home to several state parks, including the Black Canyon of the Gunnison National Park, the Curecanti National Recreation Area, and the Gunnison Gorge National Conservation Area. The county is also home to several ski resorts, including Powderhorn, Sunlight, and Crested Butte.
Economy
Delta County’s economy is largely based on agriculture, tourism, and energy production. The county is home to several large farms, which produce a variety of crops, including corn, wheat, hay, and alfalfa. The county is also home to several wineries and breweries, which produce a variety of wines and beers.
The county is also home to several energy production facilities, including coal mines, natural gas wells, and oil refineries. The county is also home to several manufacturing facilities, which produce a variety of products, including furniture, clothing, and electronics.
Demographics
As of the 2010 census, Delta County had a population of 30,952. The population is spread out with a median age of 41.7 years. The racial makeup of the county is 87.3% White, 0.7% African American, 0.9% Native American, 0.7% Asian, 0.1% Pacific Islander, 8.2% from other races, and 2.1% from two or more races. Hispanic or Latino of any race were 16.3% of the population.
The median household income in the county is $45,945 and the median family income is $54,945. The per capita income in the county is $24,945. The unemployment rate in the county is 5.2%.
Conclusion
Delta County is located in the western part of Colorado and is part of the Grand Junction Metropolitan Statistical Area. The county was established in 1883 and was named after the nearby delta of the Gunnison River. The county is characterized by rolling hills, mesas, and canyons and is home to several state parks, ski resorts, and energy production facilities. The county’s economy is largely based on agriculture, tourism, and energy production. As of the 2010 census, Delta County had a population of 30,952 with a median age of 41.7 years and a median household income of $45,945.
Common Questions
What is the Total Population of Delta County?
Total Population of Delta County is 31,173.
What is the Total Male Population of Delta County?
Total Male Population of Delta County is 15,642.
What is the Total Female Population of Delta County?
Total Female Population of Delta County is 15,531.
What is the Ratio of Males per 100 Females in Delta County?
There are 100.71 Males per 100 Females in Delta County.
What is the Ratio of Females per 100 Males in Delta County?
There are 99.29 Females per 100 Males in Delta County.
What is the Median Population Age in Delta County?
Median Population Age in Delta County is 47.8 Years.
What is the Average Family Size in Delta County
Average Family Size in Delta County is 3.1 People.
What is the Average Household Size in Delta County
Average Household Size in Delta County is 2.5 People.
What is Per Capita Income in Delta County?
Per Capita income in Delta County is $33,055.
What is the Median Family Income in Delta County?
Median Family Income in Delta County is $72,437.
What is the Median Household income in Delta County?
Median Household Income in Delta County is $56,349.
What is Income or Wage Gap in Delta County?
Income or Wage Gap in Delta County is 40.1%.
Women in Delta County earn 59.9 cents for every dollar earned by a man.
What is Family Income Deficit in Delta County?
Family Income Deficit in Delta County is $9,087.
Families that are below poverty line in Delta County earn $9,087 less on average than the poverty threshold level.
What is Inequality or Gini Index in Delta County?
Inequality or Gini Index in Delta County is 0.47.
How Large is the Labor Force in Delta County?
There are 12,801 People in the Labor Forcein in Delta County.
What is the Percentage of People in the Labor Force in Delta County?
49.6% of People are in the Labor Force in Delta County.
What is the Unemployment Rate in Delta County?
Unemployment Rate in Delta County is 4.4%.