Chaffee County, CO
Chaffee County Map
Chaffee County Overview
19,564
TOTAL POPULATION
10,215
MALE POPULATION
9,349
FEMALE POPULATION
109.26
MALES / 100 FEMALES
91.52
FEMALES / 100 MALES
47.8
MEDIAN AGE
2.5
AVG FAMILY SIZE
2.0
AVG HOUSEHOLD SIZE
$38,167
PER CAPITA INCOME
$83,786
AVG FAMILY INCOME
$65,703
AVG HOUSEHOLD INCOME
29.6%
WAGE / INCOME GAP [ % ]
70.4¢/ $1
WAGE / INCOME GAP [ $ ]
0.44
INEQUALITY / GINI INDEX
9,323
LABOR FORCE [ PEOPLE ]
54.7%
PERCENT IN LABOR FORCE
6.0%
UNEMPLOYMENT RATE
Chaffee County Area Codes
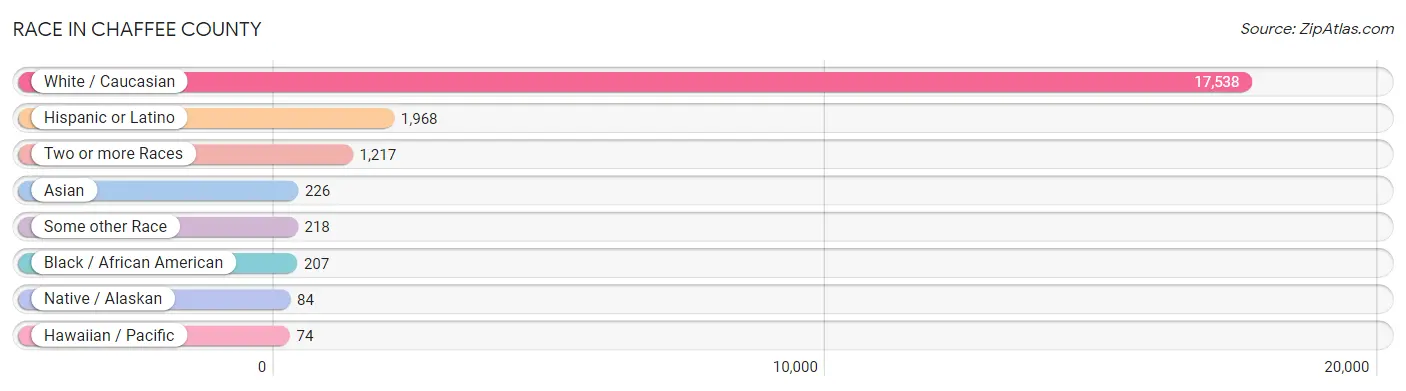
Race in Chaffee County
The most populous races in Chaffee County are White / Caucasian (17,538 | 89.6%), Hispanic or Latino (1,968 | 10.1%), and Two or more Races (1,217 | 6.2%).
| Race | # Population | % Population |
| Asian | 226 | 1.2% |
| Black / African American | 207 | 1.1% |
| Hawaiian / Pacific | 74 | 0.4% |
| Hispanic or Latino | 1,968 | 10.1% |
| Native / Alaskan | 84 | 0.4% |
| White / Caucasian | 17,538 | 89.6% |
| Two or more Races | 1,217 | 6.2% |
| Some other Race | 218 | 1.1% |
| Total | 19,564 | 100.0% |
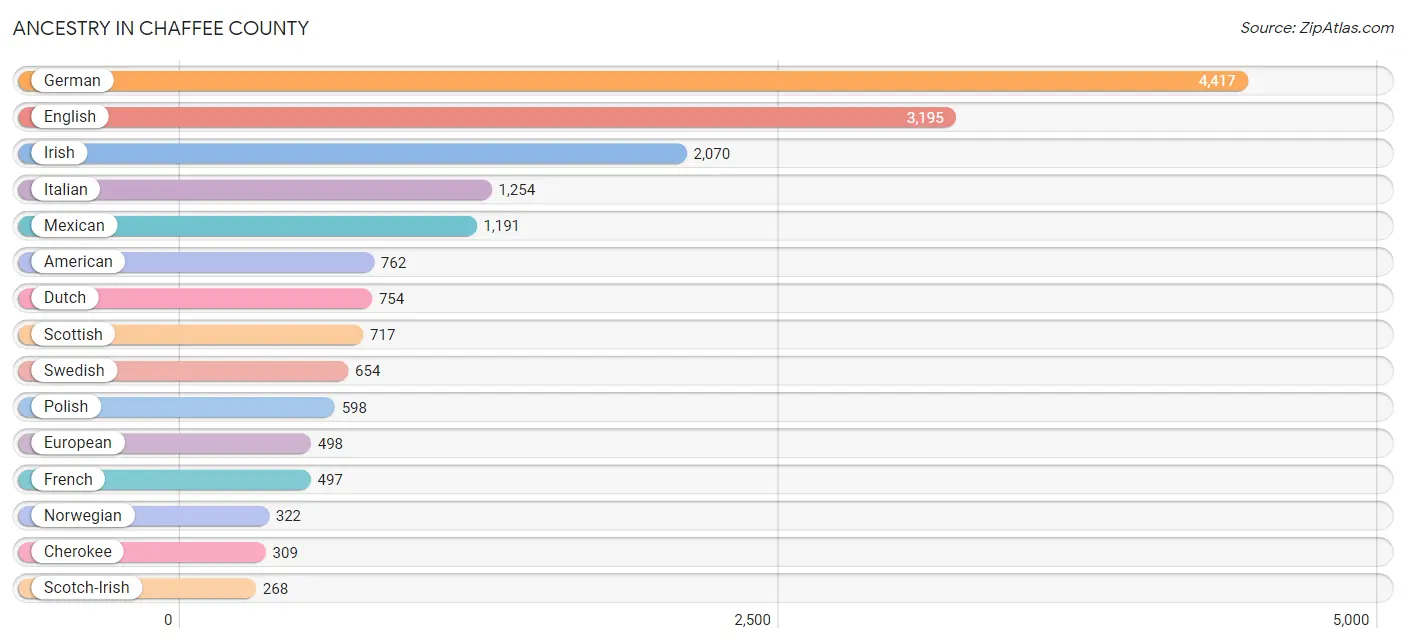
Ancestry in Chaffee County
The most populous ancestries reported in Chaffee County are German (4,417 | 22.6%), English (3,195 | 16.3%), Irish (2,070 | 10.6%), Italian (1,254 | 6.4%), and Mexican (1,191 | 6.1%), together accounting for 62.0% of all Chaffee County residents.
| Ancestry | # Population | % Population |
| American | 762 | 3.9% |
| Apache | 83 | 0.4% |
| Arab | 38 | 0.2% |
| Austrian | 116 | 0.6% |
| Belgian | 15 | 0.1% |
| Bhutanese | 8 | 0.0% |
| British | 231 | 1.2% |
| Burmese | 155 | 0.8% |
| Canadian | 19 | 0.1% |
| Central American | 19 | 0.1% |
| Central American Indian | 19 | 0.1% |
| Cherokee | 309 | 1.6% |
| Chickasaw | 32 | 0.2% |
| Creek | 132 | 0.7% |
| Croatian | 9 | 0.1% |
| Cuban | 164 | 0.8% |
| Czech | 70 | 0.4% |
| Czechoslovakian | 40 | 0.2% |
| Danish | 152 | 0.8% |
| Dutch | 754 | 3.8% |
| Eastern European | 40 | 0.2% |
| English | 3,195 | 16.3% |
| European | 498 | 2.5% |
| Finnish | 42 | 0.2% |
| French | 497 | 2.5% |
| French American Indian | 15 | 0.1% |
| French Canadian | 52 | 0.3% |
| German | 4,417 | 22.6% |
| German Russian | 16 | 0.1% |
| Greek | 46 | 0.2% |
| Guatemalan | 19 | 0.1% |
| Hungarian | 39 | 0.2% |
| Icelander | 14 | 0.1% |
| Indian (Asian) | 78 | 0.4% |
| Irish | 2,070 | 10.6% |
| Italian | 1,254 | 6.4% |
| Lebanese | 30 | 0.2% |
| Lithuanian | 47 | 0.2% |
| Mexican | 1,191 | 6.1% |
| Native Hawaiian | 45 | 0.2% |
| Navajo | 31 | 0.2% |
| Northern European | 49 | 0.3% |
| Norwegian | 322 | 1.7% |
| Okinawan | 15 | 0.1% |
| Osage | 58 | 0.3% |
| Pakistani | 11 | 0.1% |
| Pennsylvania German | 20 | 0.1% |
| Polish | 598 | 3.1% |
| Portuguese | 56 | 0.3% |
| Puerto Rican | 87 | 0.4% |
| Romanian | 16 | 0.1% |
| Russian | 195 | 1.0% |
| Scandinavian | 95 | 0.5% |
| Scotch-Irish | 268 | 1.4% |
| Scottish | 717 | 3.7% |
| Serbian | 11 | 0.1% |
| Slovak | 148 | 0.8% |
| Slovene | 39 | 0.2% |
| South American | 39 | 0.2% |
| Spaniard | 104 | 0.5% |
| Spanish | 26 | 0.1% |
| Sri Lankan | 14 | 0.1% |
| Swedish | 654 | 3.3% |
| Swiss | 14 | 0.1% |
| Thai | 12 | 0.1% |
| Ukrainian | 48 | 0.3% |
| Welsh | 176 | 0.9% |
| Yugoslavian | 12 | 0.1% | View All 68 Rows |
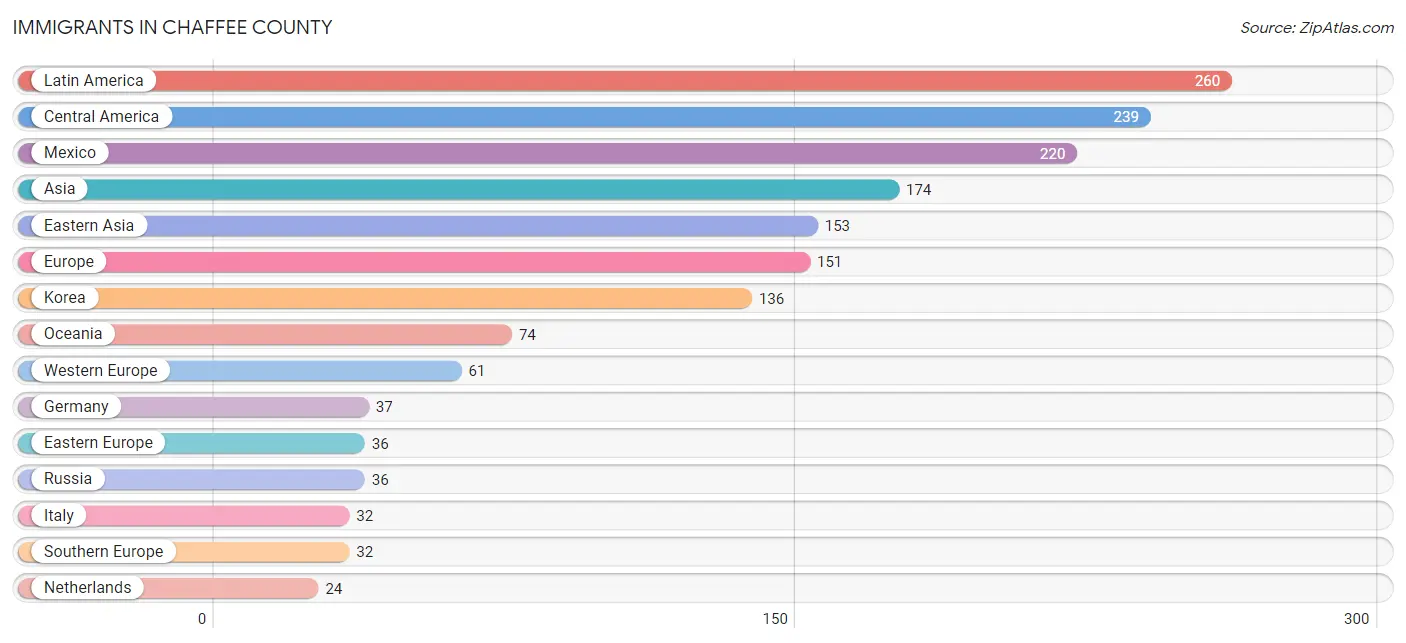
Immigrants in Chaffee County
The most numerous immigrant groups reported in Chaffee County came from Latin America (260 | 1.3%), Central America (239 | 1.2%), Mexico (220 | 1.1%), Asia (174 | 0.9%), and Eastern Asia (153 | 0.8%), together accounting for 5.3% of all Chaffee County residents.
| Immigration Origin | # Population | % Population |
| Asia | 174 | 0.9% |
| Brazil | 9 | 0.1% |
| Canada | 15 | 0.1% |
| Caribbean | 2 | 0.0% |
| Central America | 239 | 1.2% |
| China | 17 | 0.1% |
| Colombia | 10 | 0.1% |
| Dominican Republic | 2 | 0.0% |
| Eastern Asia | 153 | 0.8% |
| Eastern Europe | 36 | 0.2% |
| Europe | 151 | 0.8% |
| Germany | 37 | 0.2% |
| Guatemala | 19 | 0.1% |
| Italy | 32 | 0.2% |
| Korea | 136 | 0.7% |
| Latin America | 260 | 1.3% |
| Mexico | 220 | 1.1% |
| Netherlands | 24 | 0.1% |
| Northern Europe | 22 | 0.1% |
| Oceania | 74 | 0.4% |
| Russia | 36 | 0.2% |
| Singapore | 15 | 0.1% |
| South America | 19 | 0.1% |
| South Eastern Asia | 21 | 0.1% |
| Southern Europe | 32 | 0.2% |
| Sweden | 9 | 0.1% |
| Vietnam | 6 | 0.0% |
| Western Europe | 61 | 0.3% | View All 28 Rows |
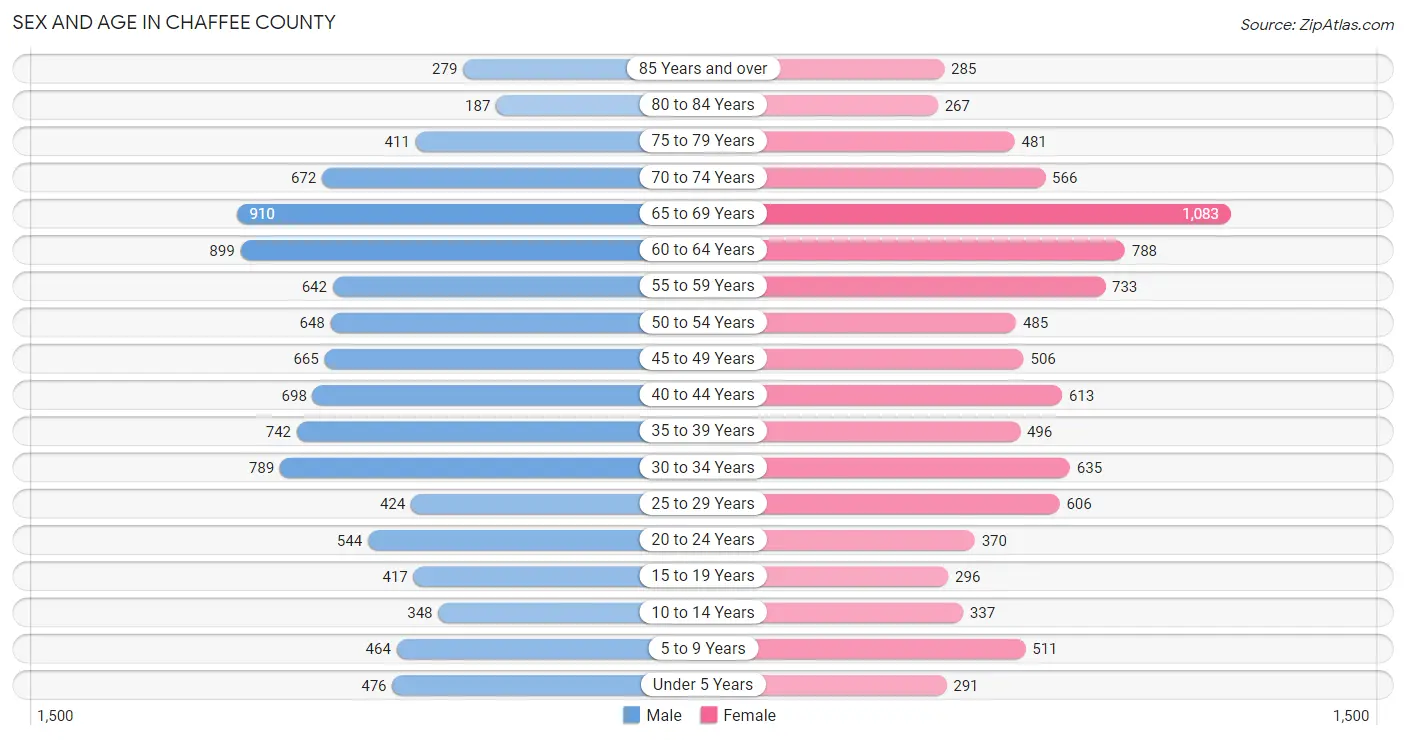
Sex and Age in Chaffee County
Sex and Age in Chaffee County
The most populous age groups in Chaffee County are 65 to 69 Years (910 | 8.9%) for men and 65 to 69 Years (1,083 | 11.6%) for women.
| Age Bracket | Male | Female |
| Under 5 Years | 476 (4.7%) | 291 (3.1%) |
| 5 to 9 Years | 464 (4.5%) | 511 (5.5%) |
| 10 to 14 Years | 348 (3.4%) | 337 (3.6%) |
| 15 to 19 Years | 417 (4.1%) | 296 (3.2%) |
| 20 to 24 Years | 544 (5.3%) | 370 (4.0%) |
| 25 to 29 Years | 424 (4.2%) | 606 (6.5%) |
| 30 to 34 Years | 789 (7.7%) | 635 (6.8%) |
| 35 to 39 Years | 742 (7.3%) | 496 (5.3%) |
| 40 to 44 Years | 698 (6.8%) | 613 (6.6%) |
| 45 to 49 Years | 665 (6.5%) | 506 (5.4%) |
| 50 to 54 Years | 648 (6.3%) | 485 (5.2%) |
| 55 to 59 Years | 642 (6.3%) | 733 (7.8%) |
| 60 to 64 Years | 899 (8.8%) | 788 (8.4%) |
| 65 to 69 Years | 910 (8.9%) | 1,083 (11.6%) |
| 70 to 74 Years | 672 (6.6%) | 566 (6.0%) |
| 75 to 79 Years | 411 (4.0%) | 481 (5.1%) |
| 80 to 84 Years | 187 (1.8%) | 267 (2.9%) |
| 85 Years and over | 279 (2.7%) | 285 (3.0%) |
| Total | 10,215 (100.0%) | 9,349 (100.0%) |
Families and Households in Chaffee County
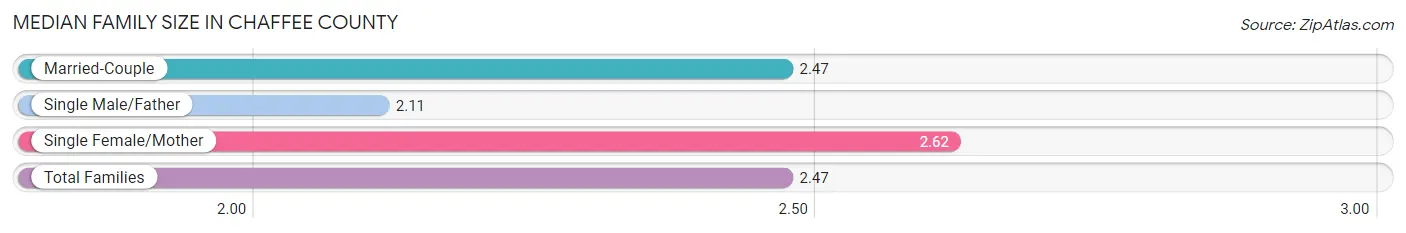
Median Family Size in Chaffee County
The median family size in Chaffee County is 2.47 persons per family, with single female/mother families (709 | 13.3%) accounting for the largest median family size of 2.62 persons per family. On the other hand, single male/father families (237 | 4.4%) represent the smallest median family size with 2.11 persons per family.
| Family Type | # Families | Family Size |
| Married-Couple | 4,381 (82.2%) | 2.47 |
| Single Male/Father | 237 (4.4%) | 2.11 |
| Single Female/Mother | 709 (13.3%) | 2.62 |
| Total Families | 5,327 (100.0%) | 2.47 |
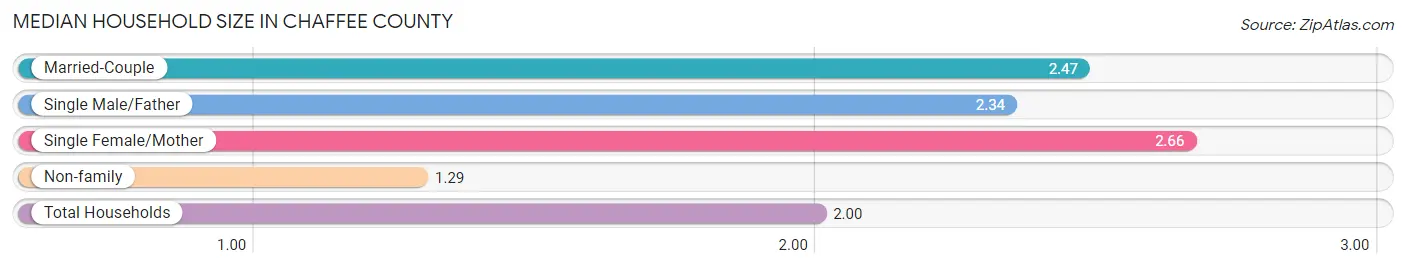
Median Household Size in Chaffee County
The median household size in Chaffee County is 2.00 persons per household, with single female/mother households (709 | 7.8%) accounting for the largest median household size of 2.66 persons per household. non-family households (3,739 | 41.2%) represent the smallest median household size with 1.29 persons per household.
| Household Type | # Households | Household Size |
| Married-Couple | 4,381 (48.3%) | 2.47 |
| Single Male/Father | 237 (2.6%) | 2.34 |
| Single Female/Mother | 709 (7.8%) | 2.66 |
| Non-family | 3,739 (41.2%) | 1.29 |
| Total Households | 9,066 (100.0%) | 2.00 |
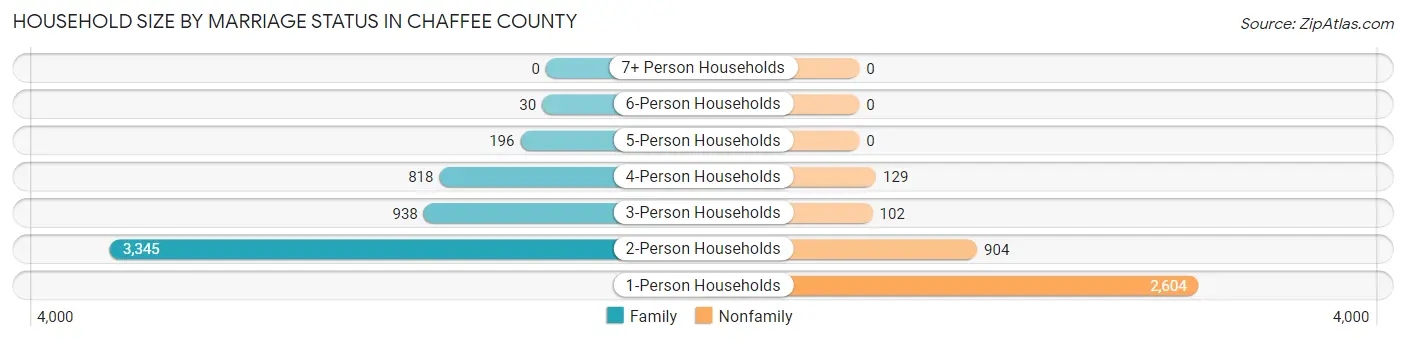
Household Size by Marriage Status in Chaffee County
Out of a total of 9,066 households in Chaffee County, 5,327 (58.8%) are family households, while 3,739 (41.2%) are nonfamily households. The most numerous type of family households are 2-person households, comprising 3,345, and the most common type of nonfamily households are 1-person households, comprising 2,604.
| Household Size | Family Households | Nonfamily Households |
| 1-Person Households | - | 2,604 (28.7%) |
| 2-Person Households | 3,345 (36.9%) | 904 (10.0%) |
| 3-Person Households | 938 (10.3%) | 102 (1.1%) |
| 4-Person Households | 818 (9.0%) | 129 (1.4%) |
| 5-Person Households | 196 (2.2%) | 0 (0.0%) |
| 6-Person Households | 30 (0.3%) | 0 (0.0%) |
| 7+ Person Households | 0 (0.0%) | 0 (0.0%) |
| Total | 5,327 (58.8%) | 3,739 (41.2%) |
Female Fertility in Chaffee County
Fertility by Age in Chaffee County
Average fertility rate in Chaffee County is 28.0 births per 1,000 women. Women in the age bracket of 20 to 34 years have the highest fertility rate with 47.0 births per 1,000 women. Women in the age bracket of 20 to 34 years acount for 74.5% of all women with births.
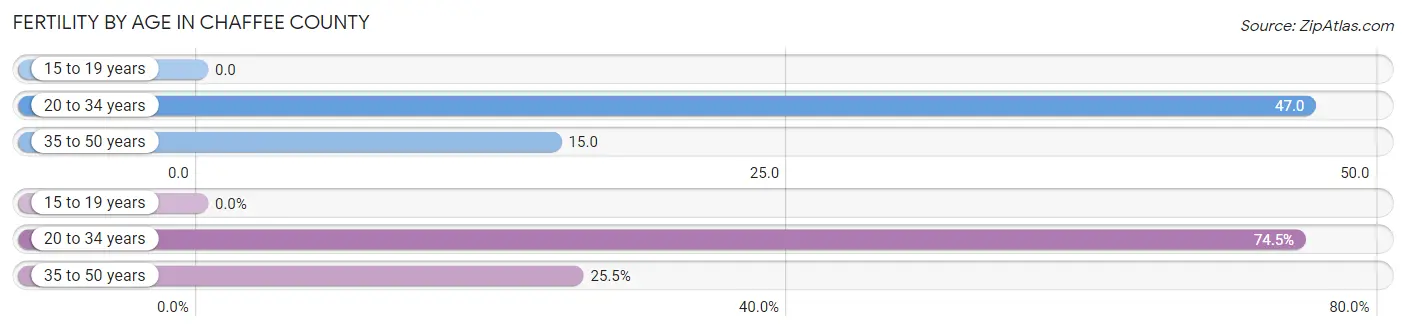
| Age Bracket | Women with Births | Births / 1,000 Women |
| 15 to 19 years | 0 (0.0%) | 0.0 |
| 20 to 34 years | 76 (74.5%) | 47.0 |
| 35 to 50 years | 26 (25.5%) | 15.0 |
| Total | 102 (100.0%) | 28.0 |
Fertility by Age by Marriage Status in Chaffee County
74.5% of women with births (102) in Chaffee County are married. The highest percentage of unmarried women with births falls into 35 to 50 years age bracket with 100.0% of them unmarried at the time of birth, while the lowest percentage of unmarried women with births belong to 20 to 34 years age bracket with 0.0% of them unmarried.
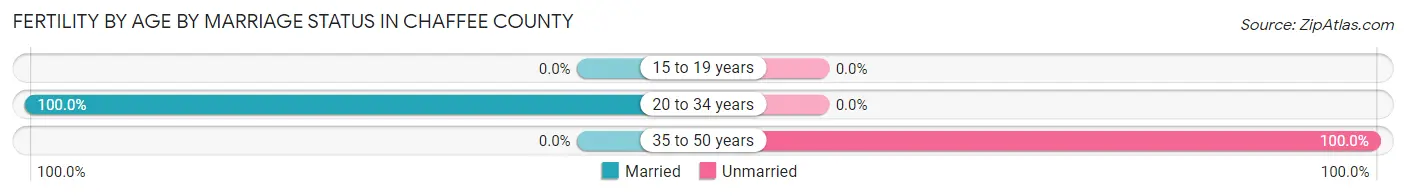
| Age Bracket | Married | Unmarried |
| 15 to 19 years | 0 (0.0%) | 0 (0.0%) |
| 20 to 34 years | 76 (100.0%) | 0 (0.0%) |
| 35 to 50 years | 0 (0.0%) | 26 (100.0%) |
| Total | 76 (74.5%) | 26 (25.5%) |
Fertility by Education in Chaffee County
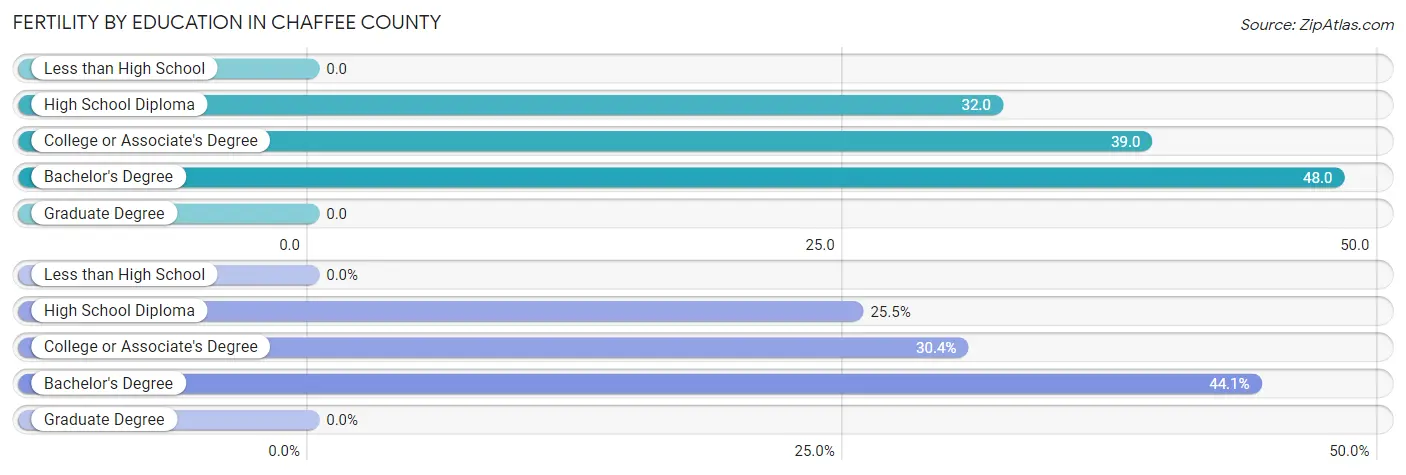
| Educational Attainment | Women with Births | Births / 1,000 Women |
| Less than High School | 0 (0.0%) | 0.0 |
| High School Diploma | 26 (25.5%) | 32.0 |
| College or Associate's Degree | 31 (30.4%) | 39.0 |
| Bachelor's Degree | 45 (44.1%) | 48.0 |
| Graduate Degree | 0 (0.0%) | 0.0 |
| Total | 102 (100.0%) | 28.0 |
Fertility by Education by Marriage Status in Chaffee County
25.5% of women with births in Chaffee County are unmarried. Women with the educational attainment of college or associate's degree are most likely to be married with 100.0% of them married at childbirth, while women with the educational attainment of high school diploma are least likely to be married with 100.0% of them unmarried at childbirth.
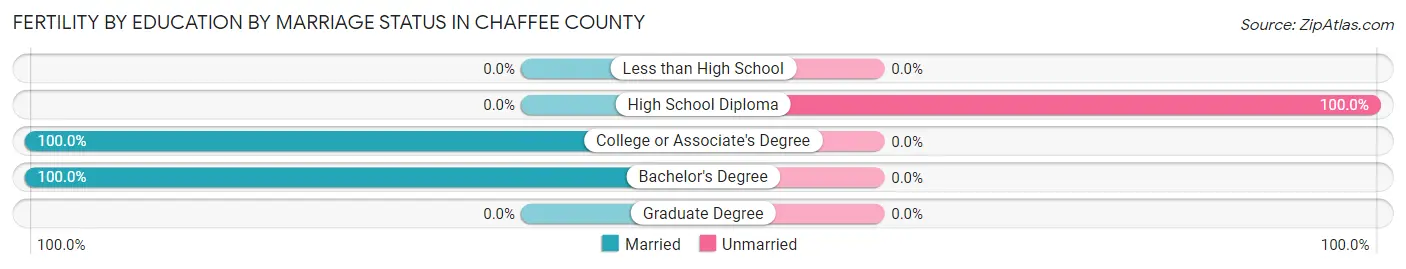
| Educational Attainment | Married | Unmarried |
| Less than High School | 0 (0.0%) | 0 (0.0%) |
| High School Diploma | 0 (0.0%) | 26 (100.0%) |
| College or Associate's Degree | 31 (100.0%) | 0 (0.0%) |
| Bachelor's Degree | 45 (100.0%) | 0 (0.0%) |
| Graduate Degree | 0 (0.0%) | 0 (0.0%) |
| Total | 76 (74.5%) | 26 (25.5%) |
Income in Chaffee County
Income Overview in Chaffee County
Per Capita Income in Chaffee County is $38,167, while median incomes of families and households are $83,786 and $65,703 respectively.
| Characteristic | Number | Measure |
| Per Capita Income | 19,564 | $38,167 |
| Median Family Income | 5,327 | $83,786 |
| Mean Family Income | 5,327 | $106,224 |
| Median Household Income | 9,066 | $65,703 |
| Mean Household Income | 9,066 | $87,722 |
| Income Deficit | 5,327 | $0 |
| Wage / Income Gap (%) | 19,564 | 29.62% |
| Wage / Income Gap ($) | 19,564 | 70.38¢ per $1 |
| Gini / Inequality Index | 19,564 | 0.44 |
Earnings by Sex in Chaffee County
Average Earnings in Chaffee County are $35,360, $41,520 for men and $29,221 for women, a difference of 29.6%.
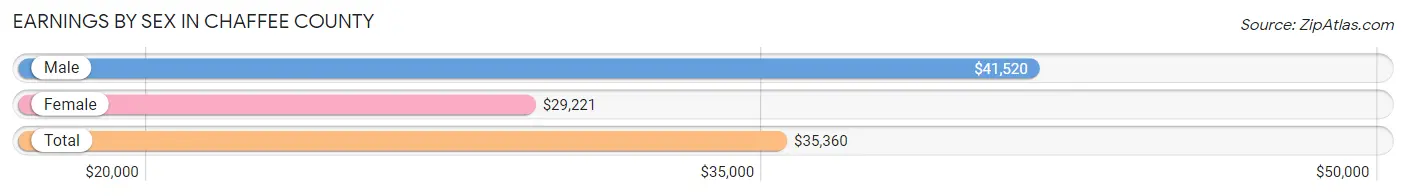
| Sex | Number | Average Earnings |
| Male | 4,906 (50.3%) | $41,520 |
| Female | 4,838 (49.6%) | $29,221 |
| Total | 9,744 (100.0%) | $35,360 |
Earnings by Sex by Income Bracket in Chaffee County
The most common earnings brackets in Chaffee County are $55,000 to $64,999 for men (596 | 12.1%) and $7,500 to $9,999 for women (417 | 8.6%).
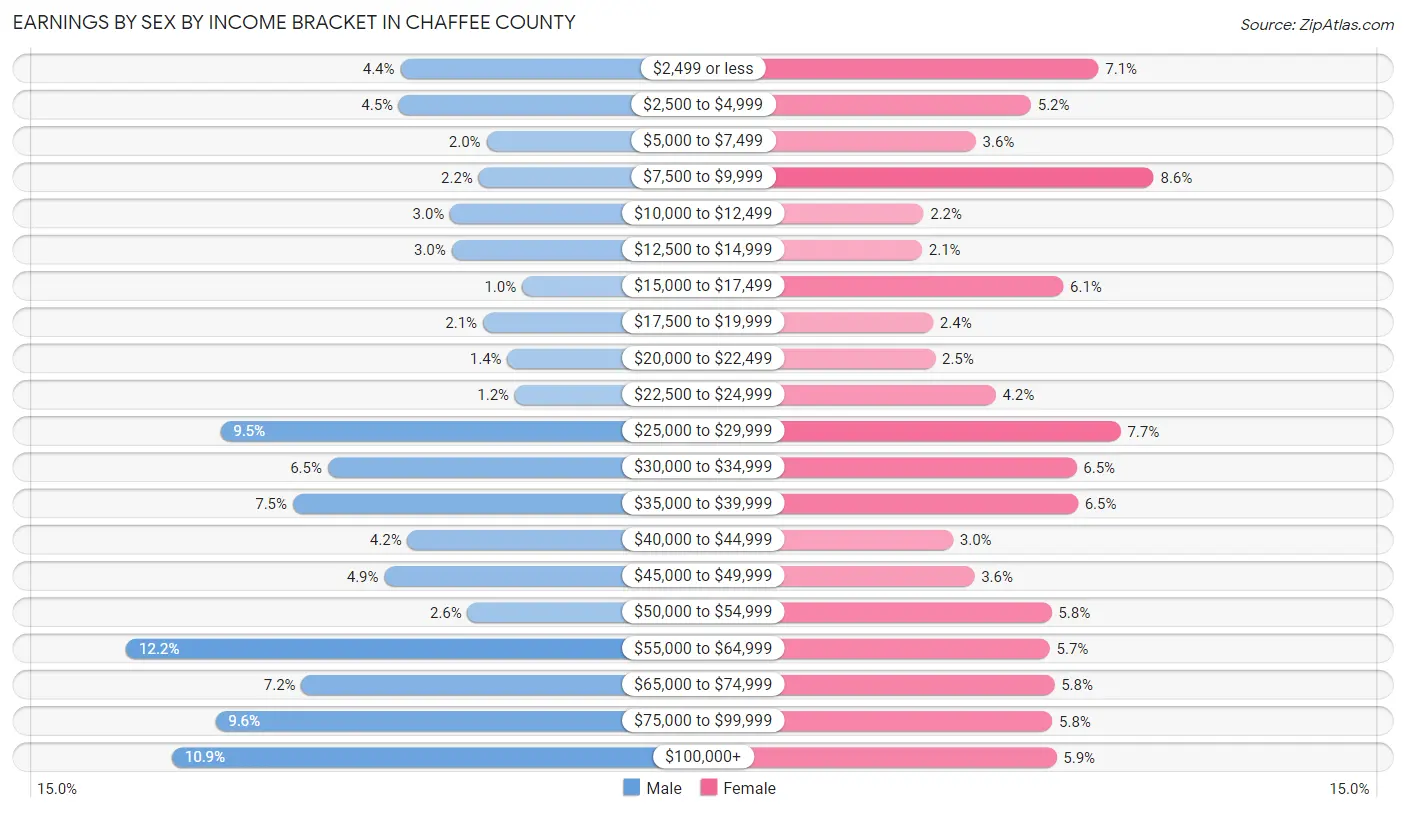
| Income | Male | Female |
| $2,499 or less | 218 (4.4%) | 342 (7.1%) |
| $2,500 to $4,999 | 220 (4.5%) | 250 (5.2%) |
| $5,000 to $7,499 | 99 (2.0%) | 175 (3.6%) |
| $7,500 to $9,999 | 110 (2.2%) | 417 (8.6%) |
| $10,000 to $12,499 | 149 (3.0%) | 104 (2.1%) |
| $12,500 to $14,999 | 147 (3.0%) | 102 (2.1%) |
| $15,000 to $17,499 | 50 (1.0%) | 294 (6.1%) |
| $17,500 to $19,999 | 104 (2.1%) | 117 (2.4%) |
| $20,000 to $22,499 | 70 (1.4%) | 120 (2.5%) |
| $22,500 to $24,999 | 60 (1.2%) | 202 (4.2%) |
| $25,000 to $29,999 | 466 (9.5%) | 372 (7.7%) |
| $30,000 to $34,999 | 318 (6.5%) | 312 (6.5%) |
| $35,000 to $39,999 | 366 (7.5%) | 314 (6.5%) |
| $40,000 to $44,999 | 208 (4.2%) | 144 (3.0%) |
| $45,000 to $49,999 | 240 (4.9%) | 173 (3.6%) |
| $50,000 to $54,999 | 125 (2.5%) | 278 (5.8%) |
| $55,000 to $64,999 | 596 (12.1%) | 276 (5.7%) |
| $65,000 to $74,999 | 354 (7.2%) | 282 (5.8%) |
| $75,000 to $99,999 | 473 (9.6%) | 279 (5.8%) |
| $100,000+ | 533 (10.9%) | 285 (5.9%) |
| Total | 4,906 (100.0%) | 4,838 (100.0%) |
Earnings by Sex by Educational Attainment in Chaffee County
Average earnings in Chaffee County are $47,428 for men and $31,746 for women, a difference of 33.1%. Men with an educational attainment of bachelor's degree enjoy the highest average annual earnings of $60,284, while those with college or associate's degree education earn the least with $39,831. Women with an educational attainment of graduate degree earn the most with the average annual earnings of $46,250, while those with college or associate's degree education have the smallest earnings of $22,600.
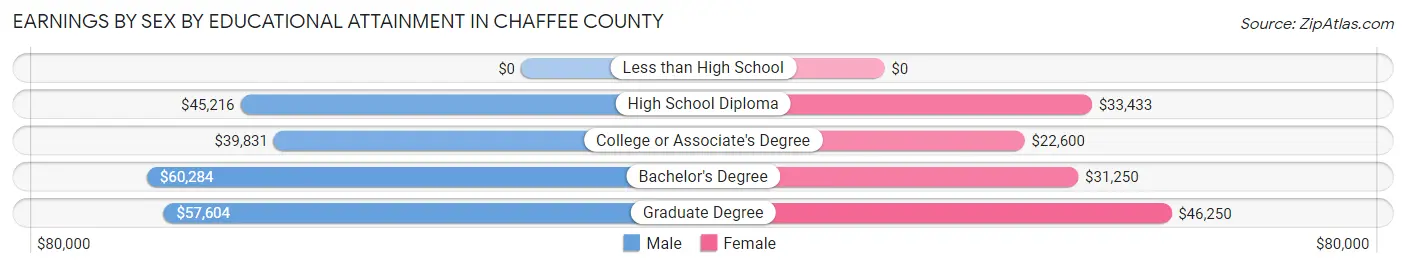
| Educational Attainment | Male Income | Female Income |
| Less than High School | - | - |
| High School Diploma | $45,216 | $33,433 |
| College or Associate's Degree | $39,831 | $22,600 |
| Bachelor's Degree | $60,284 | $31,250 |
| Graduate Degree | $57,604 | $46,250 |
| Total | $47,428 | $31,746 |
Family Income in Chaffee County
Family Income Brackets in Chaffee County
According to the Chaffee County family income data, there are 1,145 families falling into the $50,000 to $74,999 income range, which is the most common income bracket and makes up 21.5% of all families. Conversely, the $10,000 to $14,999 income bracket is the least frequent group with only 96 families (1.8%) belonging to this category.
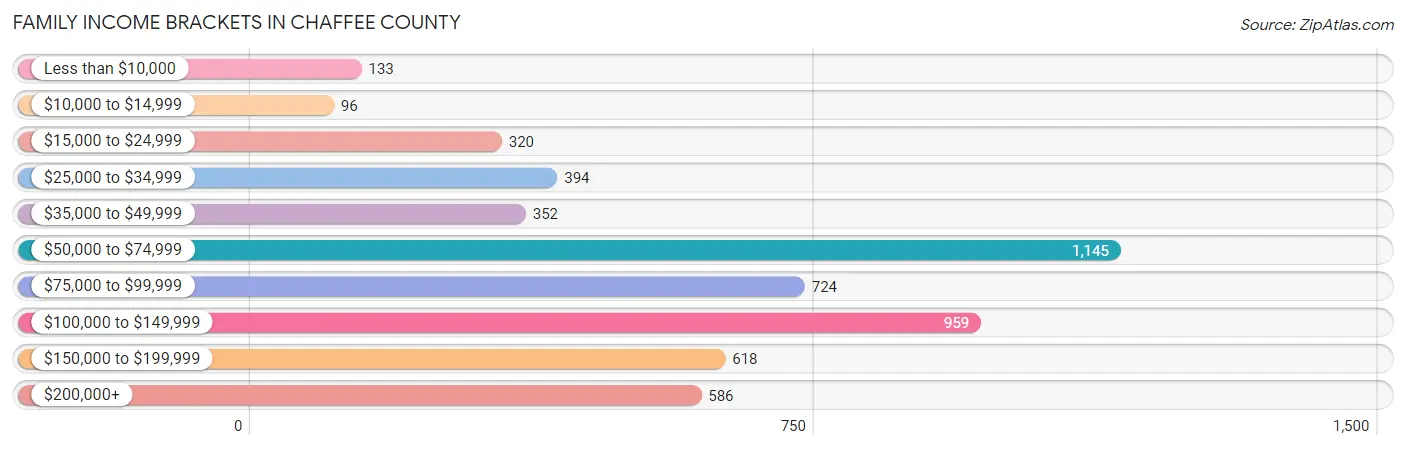
| Income Bracket | # Families | % Families |
| Less than $10,000 | 133 | 2.5% |
| $10,000 to $14,999 | 96 | 1.8% |
| $15,000 to $24,999 | 320 | 6.0% |
| $25,000 to $34,999 | 394 | 7.4% |
| $35,000 to $49,999 | 352 | 6.6% |
| $50,000 to $74,999 | 1,145 | 21.5% |
| $75,000 to $99,999 | 724 | 13.6% |
| $100,000 to $149,999 | 959 | 18.0% |
| $150,000 to $199,999 | 618 | 11.6% |
| $200,000+ | 586 | 11.0% |
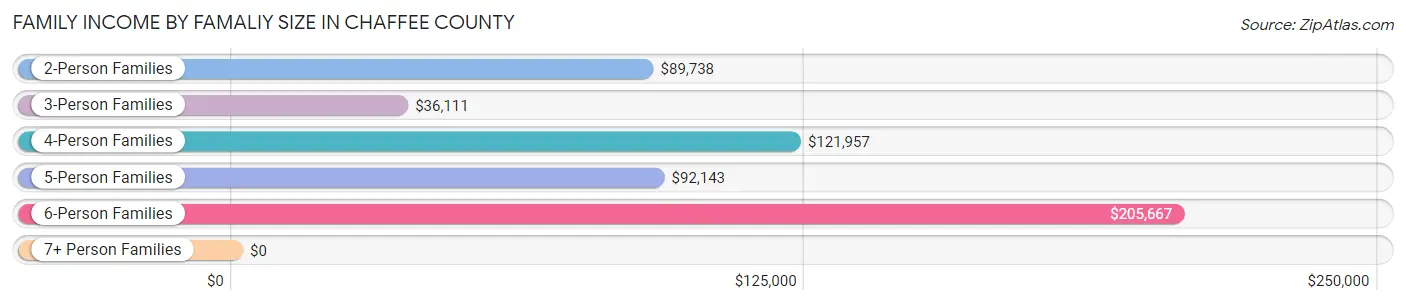
Family Income by Famaliy Size in Chaffee County
6-person families (30 | 0.6%) account for the highest median family income in Chaffee County with $205,667 per family, while 2-person families (3,359 | 63.1%) have the highest median income of $44,869 per family member.
| Income Bracket | # Families | Median Income |
| 2-Person Families | 3,359 (63.1%) | $89,738 |
| 3-Person Families | 1,188 (22.3%) | $36,111 |
| 4-Person Families | 554 (10.4%) | $121,957 |
| 5-Person Families | 196 (3.7%) | $92,143 |
| 6-Person Families | 30 (0.6%) | $205,667 |
| 7+ Person Families | 0 (0.0%) | $0 |
| Total | 5,327 (100.0%) | $83,786 |
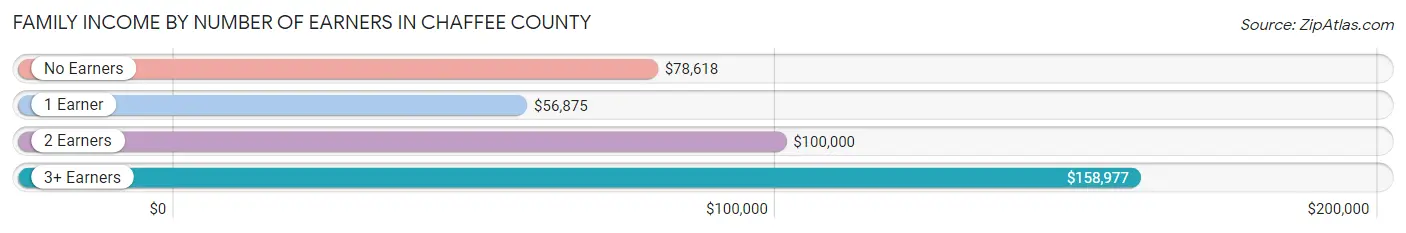
Family Income by Number of Earners in Chaffee County
The median family income in Chaffee County is $83,786, with families comprising 3+ earners (393) having the highest median family income of $158,977, while families with 1 earner (1,428) have the lowest median family income of $56,875, accounting for 7.4% and 26.8% of families, respectively.
| Number of Earners | # Families | Median Income |
| No Earners | 1,314 (24.7%) | $78,618 |
| 1 Earner | 1,428 (26.8%) | $56,875 |
| 2 Earners | 2,192 (41.1%) | $100,000 |
| 3+ Earners | 393 (7.4%) | $158,977 |
| Total | 5,327 (100.0%) | $83,786 |
Household Income in Chaffee County
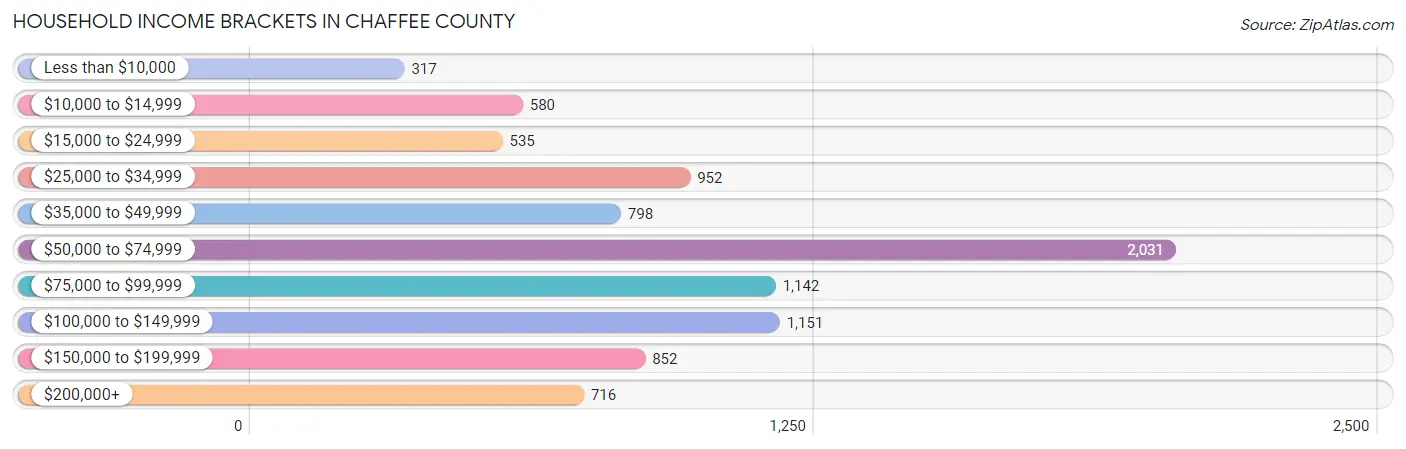
Household Income Brackets in Chaffee County
With 2,031 households falling in the category, the $50,000 to $74,999 income range is the most frequent in Chaffee County, accounting for 22.4% of all households. In contrast, only 317 households (3.5%) fall into the less than $10,000 income bracket, making it the least populous group.
| Income Bracket | # Households | % Households |
| Less than $10,000 | 317 | 3.5% |
| $10,000 to $14,999 | 580 | 6.4% |
| $15,000 to $24,999 | 535 | 5.9% |
| $25,000 to $34,999 | 952 | 10.5% |
| $35,000 to $49,999 | 798 | 8.8% |
| $50,000 to $74,999 | 2,031 | 22.4% |
| $75,000 to $99,999 | 1,142 | 12.6% |
| $100,000 to $149,999 | 1,151 | 12.7% |
| $150,000 to $199,999 | 852 | 9.4% |
| $200,000+ | 716 | 7.9% |
Household Income by Householder Age in Chaffee County
The median household income in Chaffee County is $65,703, with the highest median household income of $69,595 found in the 25 to 44 years age bracket for the primary householder. A total of 2,276 households (25.1%) fall into this category. Meanwhile, the 65+ years age bracket for the primary householder has the lowest median household income of $57,940, with 3,359 households (37.0%) in this group.

| Income Bracket | # Households | Median Income |
| 15 to 24 Years | 444 (4.9%) | $66,028 |
| 25 to 44 Years | 2,276 (25.1%) | $69,595 |
| 45 to 64 Years | 2,987 (33.0%) | $63,493 |
| 65+ Years | 3,359 (37.0%) | $57,940 |
| Total | 9,066 (100.0%) | $65,703 |
Poverty in Chaffee County
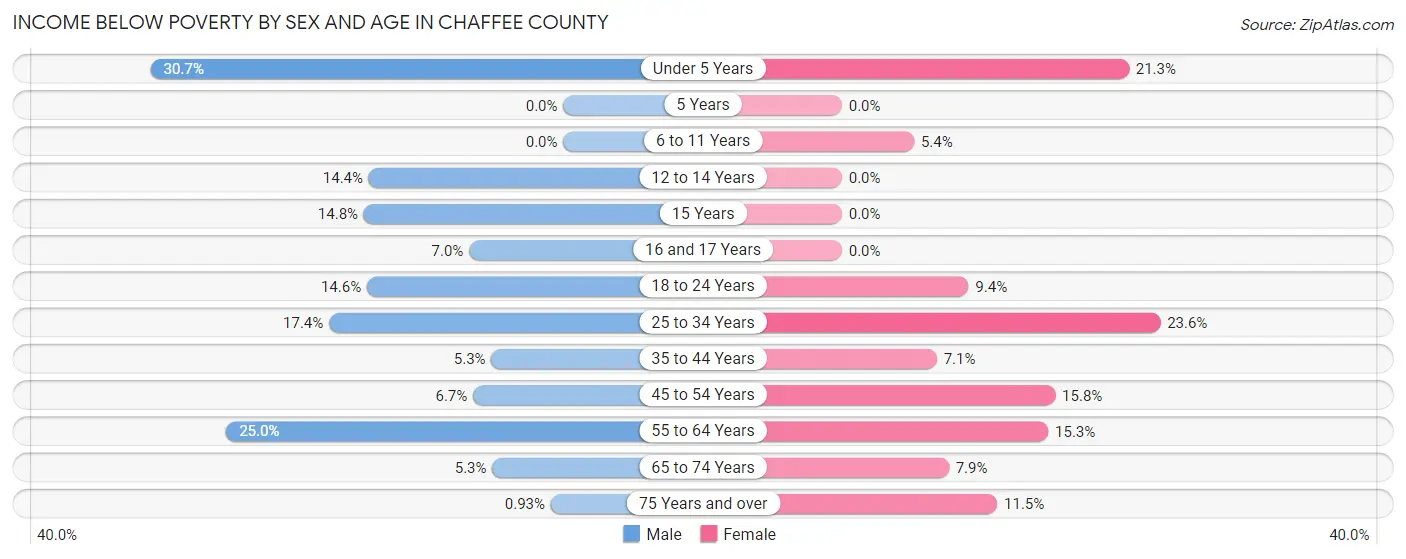
Income Below Poverty by Sex and Age in Chaffee County
With 11.3% poverty level for males and 12.2% for females among the residents of Chaffee County, under 5 year old males and 25 to 34 year old females are the most vulnerable to poverty, with 137 males (30.6%) and 292 females (23.6%) in their respective age groups living below the poverty level.
| Age Bracket | Male | Female |
| Under 5 Years | 137 (30.6%) | 62 (21.3%) |
| 5 Years | 0 (0.0%) | 0 (0.0%) |
| 6 to 11 Years | 0 (0.0%) | 29 (5.4%) |
| 12 to 14 Years | 41 (14.4%) | 0 (0.0%) |
| 15 Years | 8 (14.8%) | 0 (0.0%) |
| 16 and 17 Years | 16 (7.0%) | 0 (0.0%) |
| 18 to 24 Years | 91 (14.6%) | 42 (9.4%) |
| 25 to 34 Years | 128 (17.4%) | 292 (23.6%) |
| 35 to 44 Years | 57 (5.3%) | 78 (7.0%) |
| 45 to 54 Years | 68 (6.7%) | 157 (15.8%) |
| 55 to 64 Years | 362 (25.0%) | 231 (15.3%) |
| 65 to 74 Years | 81 (5.3%) | 131 (7.9%) |
| 75 Years and over | 8 (0.9%) | 118 (11.5%) |
| Total | 997 (11.3%) | 1,140 (12.2%) |
Income Above Poverty by Sex and Age in Chaffee County
According to the poverty statistics in Chaffee County, males aged 5 years and females aged 5 years are the age groups that are most secure financially, with 100.0% of males and 100.0% of females in these age groups living above the poverty line.
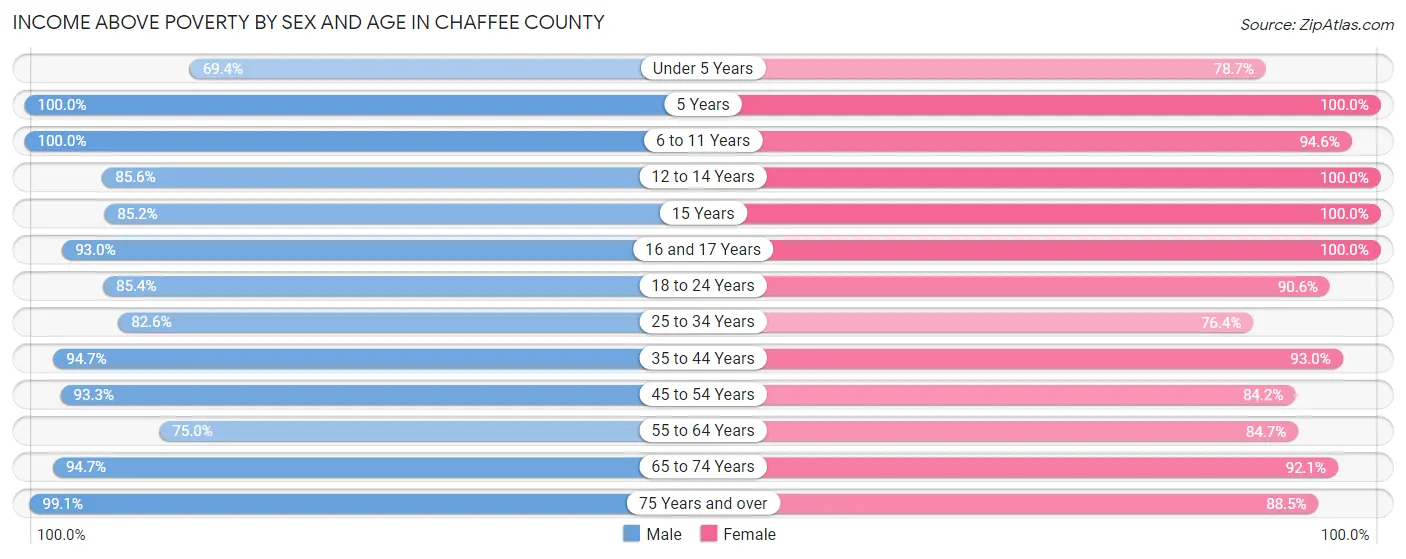
| Age Bracket | Male | Female |
| Under 5 Years | 310 (69.4%) | 229 (78.7%) |
| 5 Years | 37 (100.0%) | 90 (100.0%) |
| 6 to 11 Years | 491 (100.0%) | 512 (94.6%) |
| 12 to 14 Years | 243 (85.6%) | 217 (100.0%) |
| 15 Years | 46 (85.2%) | 40 (100.0%) |
| 16 and 17 Years | 213 (93.0%) | 178 (100.0%) |
| 18 to 24 Years | 533 (85.4%) | 405 (90.6%) |
| 25 to 34 Years | 608 (82.6%) | 943 (76.4%) |
| 35 to 44 Years | 1,011 (94.7%) | 1,028 (92.9%) |
| 45 to 54 Years | 947 (93.3%) | 834 (84.2%) |
| 55 to 64 Years | 1,084 (75.0%) | 1,277 (84.7%) |
| 65 to 74 Years | 1,457 (94.7%) | 1,518 (92.1%) |
| 75 Years and over | 852 (99.1%) | 905 (88.5%) |
| Total | 7,832 (88.7%) | 8,176 (87.8%) |
Income Below Poverty Among Married-Couple Families in Chaffee County
The poverty statistics for married-couple families in Chaffee County show that 3.2% or 138 of the total 4,381 families live below the poverty line. Families with 1 or 2 children have the highest poverty rate of 5.3%, comprising of 48 families. On the other hand, families with no children have the lowest poverty rate of 2.6%, which includes 85 families.
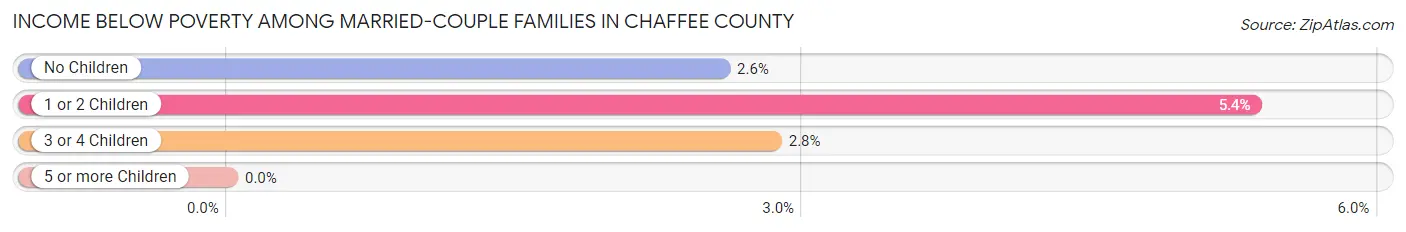
| Children | Above Poverty | Below Poverty |
| No Children | 3,222 (97.4%) | 85 (2.6%) |
| 1 or 2 Children | 850 (94.7%) | 48 (5.3%) |
| 3 or 4 Children | 171 (97.2%) | 5 (2.8%) |
| 5 or more Children | 0 (0.0%) | 0 (0.0%) |
| Total | 4,243 (96.9%) | 138 (3.2%) |
Income Below Poverty Among Single-Parent Households in Chaffee County
According to the poverty data in Chaffee County, 35.4% or 84 single-father households and 39.2% or 278 single-mother households are living below the poverty line. Among single-father households, those with no children have the highest poverty rate, with 39 households (52.0%) experiencing poverty. Likewise, among single-mother households, those with 1 or 2 children have the highest poverty rate, with 278 households (45.7%) falling below the poverty line.
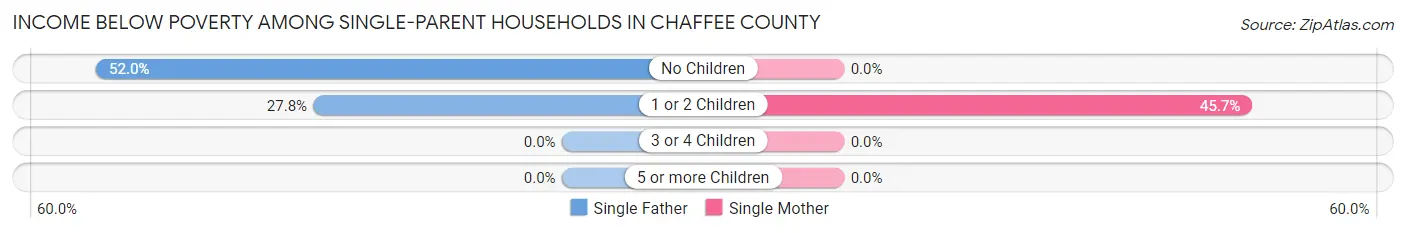
| Children | Single Father | Single Mother |
| No Children | 39 (52.0%) | 0 (0.0%) |
| 1 or 2 Children | 45 (27.8%) | 278 (45.7%) |
| 3 or 4 Children | 0 (0.0%) | 0 (0.0%) |
| 5 or more Children | 0 (0.0%) | 0 (0.0%) |
| Total | 84 (35.4%) | 278 (39.2%) |
Income Below Poverty Among Married-Couple vs Single-Parent Households in Chaffee County
The poverty data for Chaffee County shows that 138 of the married-couple family households (3.2%) and 362 of the single-parent households (38.3%) are living below the poverty level. Within the married-couple family households, those with 1 or 2 children have the highest poverty rate, with 48 households (5.3%) falling below the poverty line. Among the single-parent households, those with 1 or 2 children have the highest poverty rate, with 323 household (41.9%) living below poverty.
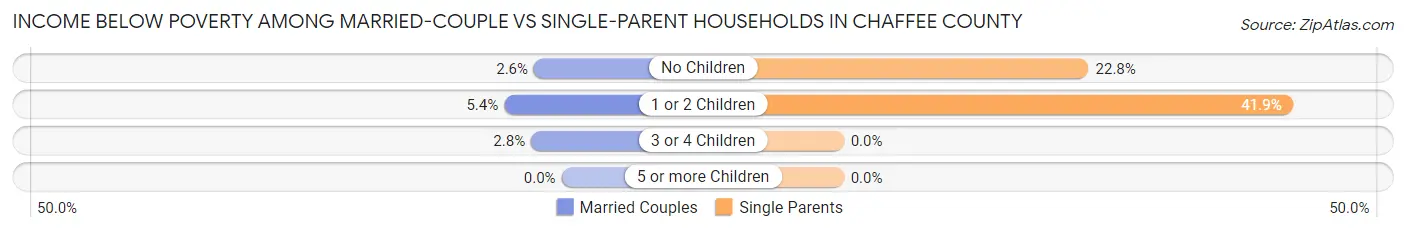
| Children | Married-Couple Families | Single-Parent Households |
| No Children | 85 (2.6%) | 39 (22.8%) |
| 1 or 2 Children | 48 (5.3%) | 323 (41.9%) |
| 3 or 4 Children | 5 (2.8%) | 0 (0.0%) |
| 5 or more Children | 0 (0.0%) | 0 (0.0%) |
| Total | 138 (3.2%) | 362 (38.3%) |
Employment Characteristics in Chaffee County
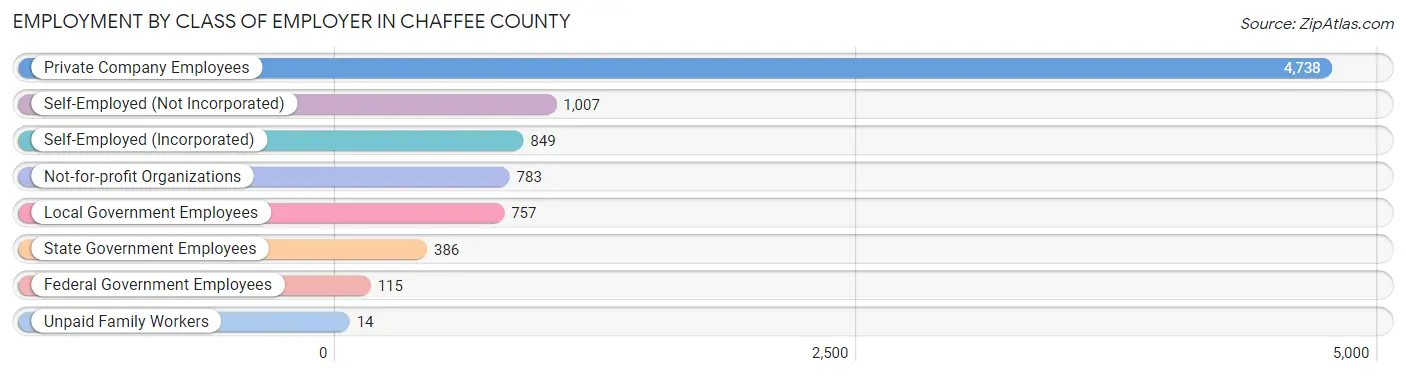
Employment by Class of Employer in Chaffee County
Among the 8,649 employed individuals in Chaffee County, private company employees (4,738 | 54.8%), self-employed (not incorporated) (1,007 | 11.6%), and self-employed (incorporated) (849 | 9.8%) make up the most common classes of employment.
| Employer Class | # Employees | % Employees |
| Private Company Employees | 4,738 | 54.8% |
| Self-Employed (Incorporated) | 849 | 9.8% |
| Self-Employed (Not Incorporated) | 1,007 | 11.6% |
| Not-for-profit Organizations | 783 | 9.0% |
| Local Government Employees | 757 | 8.7% |
| State Government Employees | 386 | 4.5% |
| Federal Government Employees | 115 | 1.3% |
| Unpaid Family Workers | 14 | 0.2% |
| Total | 8,649 | 100.0% |
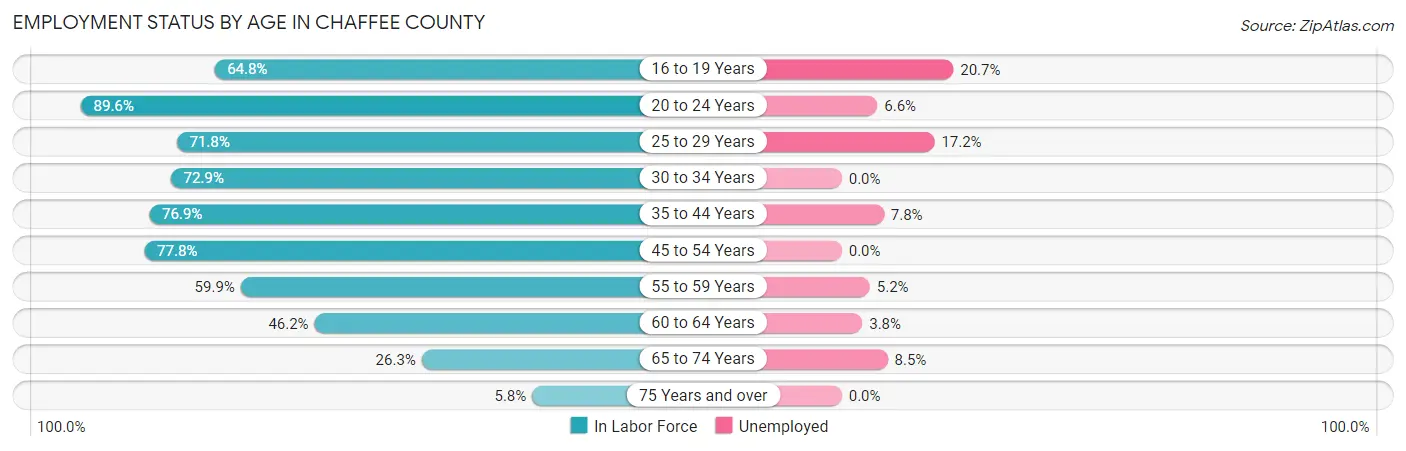
Employment Status by Age in Chaffee County
According to the labor force statistics for Chaffee County, out of the total population over 16 years of age (17,043), 54.7% or 9,323 individuals are in the labor force, with 6.0% or 559 of them unemployed. The age group with the highest labor force participation rate is 20 to 24 years, with 89.6% or 819 individuals in the labor force. Within the labor force, the 16 to 19 years age range has the highest percentage of unemployed individuals, with 20.7% or 83 of them being unemployed.
| Age Bracket | In Labor Force | Unemployed |
| 16 to 19 Years | 401 (64.8%) | 83 (20.7%) |
| 20 to 24 Years | 819 (89.6%) | 54 (6.6%) |
| 25 to 29 Years | 740 (71.8%) | 127 (17.2%) |
| 30 to 34 Years | 1,038 (72.9%) | 0 (0.0%) |
| 35 to 44 Years | 1,960 (76.9%) | 153 (7.8%) |
| 45 to 54 Years | 1,793 (77.8%) | 0 (0.0%) |
| 55 to 59 Years | 824 (59.9%) | 43 (5.2%) |
| 60 to 64 Years | 779 (46.2%) | 30 (3.8%) |
| 65 to 74 Years | 850 (26.3%) | 72 (8.5%) |
| 75 Years and over | 111 (5.8%) | 0 (0.0%) |
| Total | 9,323 (54.7%) | 559 (6.0%) |
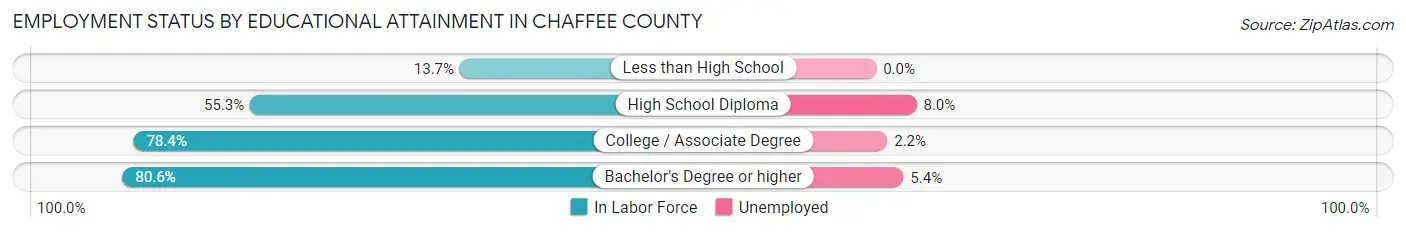
Employment Status by Educational Attainment in Chaffee County
According to labor force statistics for Chaffee County, 68.8% of individuals (7,134) out of the total population between 25 and 64 years of age (10,369) are in the labor force, with 4.9% or 350 of them being unemployed. The group with the highest labor force participation rate are those with the educational attainment of bachelor's degree or higher, with 80.6% or 3,475 individuals in the labor force. Within the labor force, individuals with high school diploma education have the highest percentage of unemployment, with 8.0% or 117 of them being unemployed.
| Educational Attainment | In Labor Force | Unemployed |
| Less than High School | 102 (13.7%) | 0 (0.0%) |
| High School Diploma | 1,460 (55.3%) | 211 (8.0%) |
| College / Associate Degree | 2,096 (78.4%) | 59 (2.2%) |
| Bachelor's Degree or higher | 3,475 (80.6%) | 233 (5.4%) |
| Total | 7,134 (68.8%) | 508 (4.9%) |
Employment Occupations by Sex in Chaffee County
Management, Business, Science and Arts Occupations
The most common Management, Business, Science and Arts occupations in Chaffee County are Community & Social Service (1,294 | 14.8%), Management (1,064 | 12.2%), Education Instruction & Library (790 | 9.0%), Health Diagnosing & Treating (695 | 7.9%), and Health Technologists (438 | 5.0%).
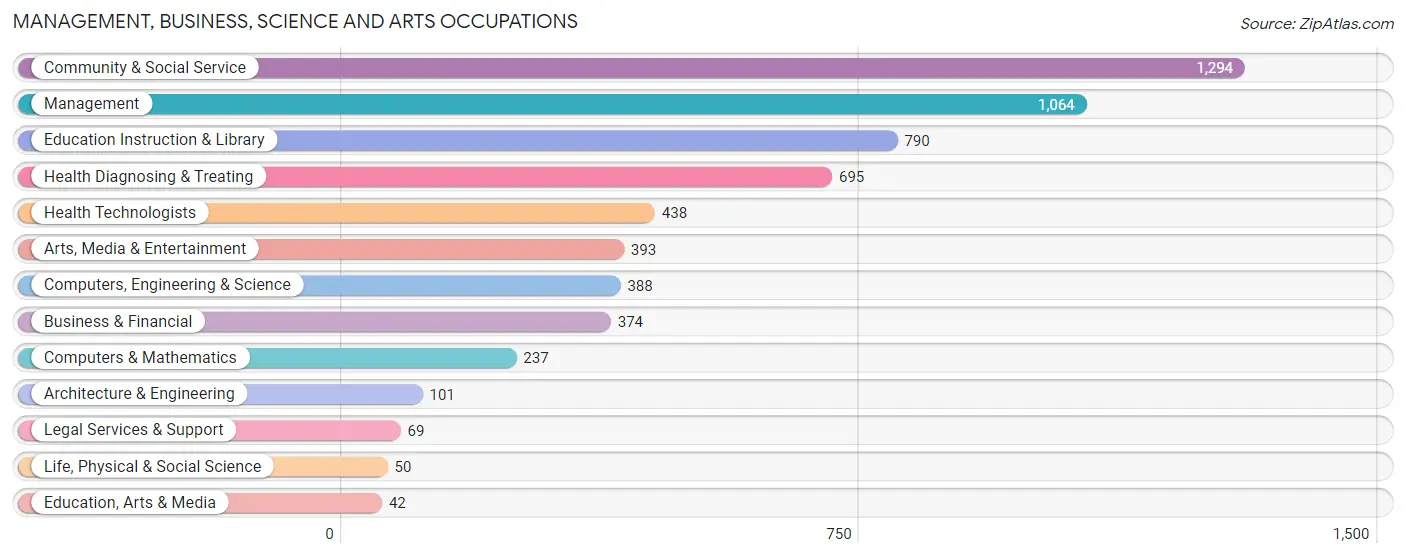
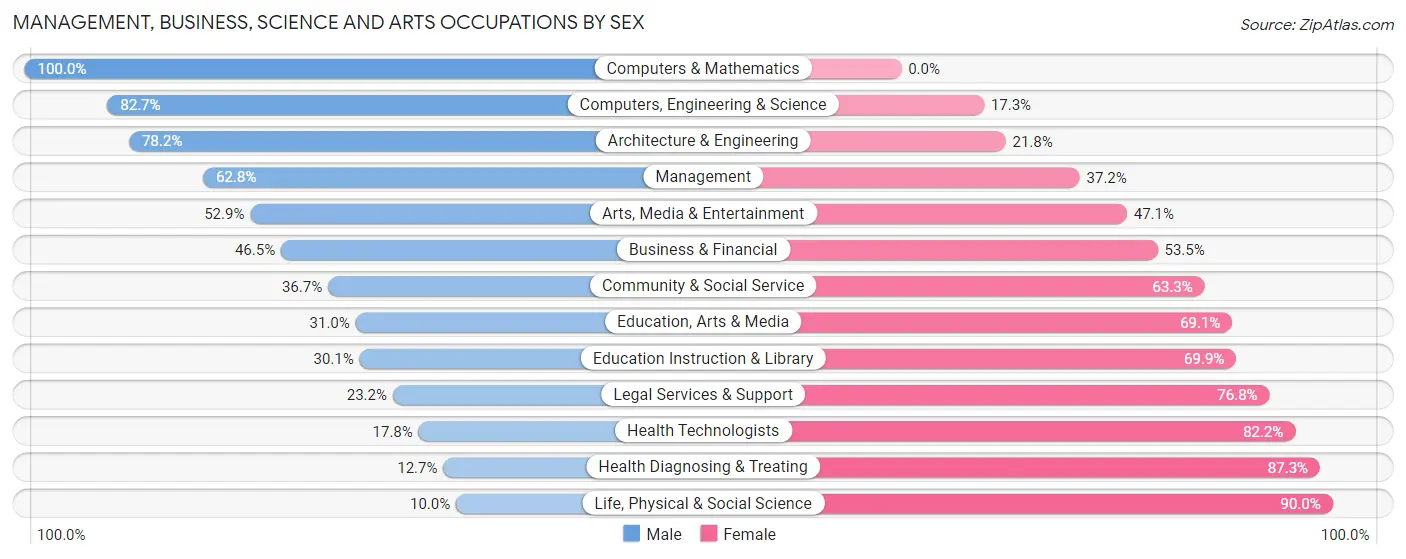
Management, Business, Science and Arts Occupations by Sex
Within the Management, Business, Science and Arts occupations in Chaffee County, the most male-oriented occupations are Computers & Mathematics (100.0%), Computers, Engineering & Science (82.7%), and Architecture & Engineering (78.2%), while the most female-oriented occupations are Life, Physical & Social Science (90.0%), Health Diagnosing & Treating (87.3%), and Health Technologists (82.2%).
| Occupation | Male | Female |
| Management | 668 (62.8%) | 396 (37.2%) |
| Business & Financial | 174 (46.5%) | 200 (53.5%) |
| Computers, Engineering & Science | 321 (82.7%) | 67 (17.3%) |
| Computers & Mathematics | 237 (100.0%) | 0 (0.0%) |
| Architecture & Engineering | 79 (78.2%) | 22 (21.8%) |
| Life, Physical & Social Science | 5 (10.0%) | 45 (90.0%) |
| Community & Social Service | 475 (36.7%) | 819 (63.3%) |
| Education, Arts & Media | 13 (30.9%) | 29 (69.1%) |
| Legal Services & Support | 16 (23.2%) | 53 (76.8%) |
| Education Instruction & Library | 238 (30.1%) | 552 (69.9%) |
| Arts, Media & Entertainment | 208 (52.9%) | 185 (47.1%) |
| Health Diagnosing & Treating | 88 (12.7%) | 607 (87.3%) |
| Health Technologists | 78 (17.8%) | 360 (82.2%) |
| Total (Category) | 1,726 (45.2%) | 2,089 (54.8%) |
| Total (Overall) | 4,425 (50.6%) | 4,327 (49.4%) |
Services Occupations
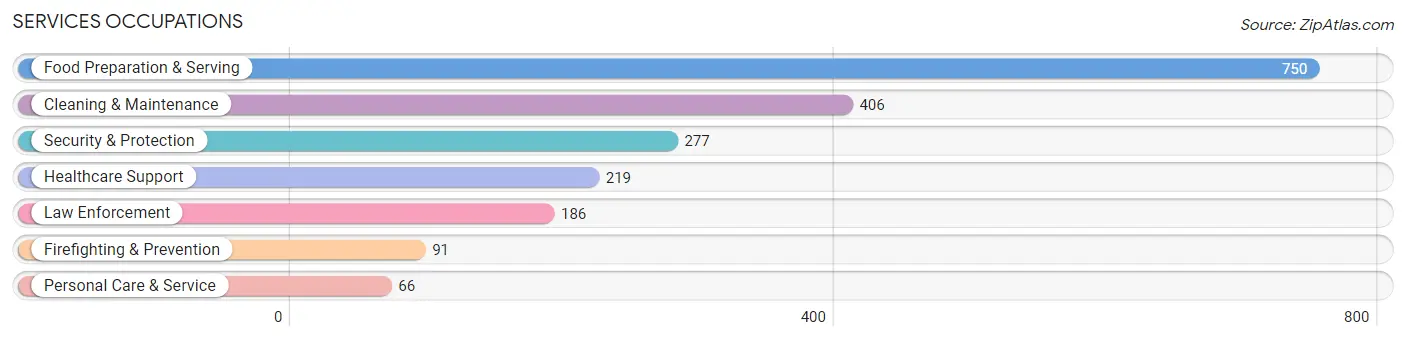
The most common Services occupations in Chaffee County are Food Preparation & Serving (750 | 8.6%), Cleaning & Maintenance (406 | 4.6%), Security & Protection (277 | 3.2%), Healthcare Support (219 | 2.5%), and Law Enforcement (186 | 2.1%).
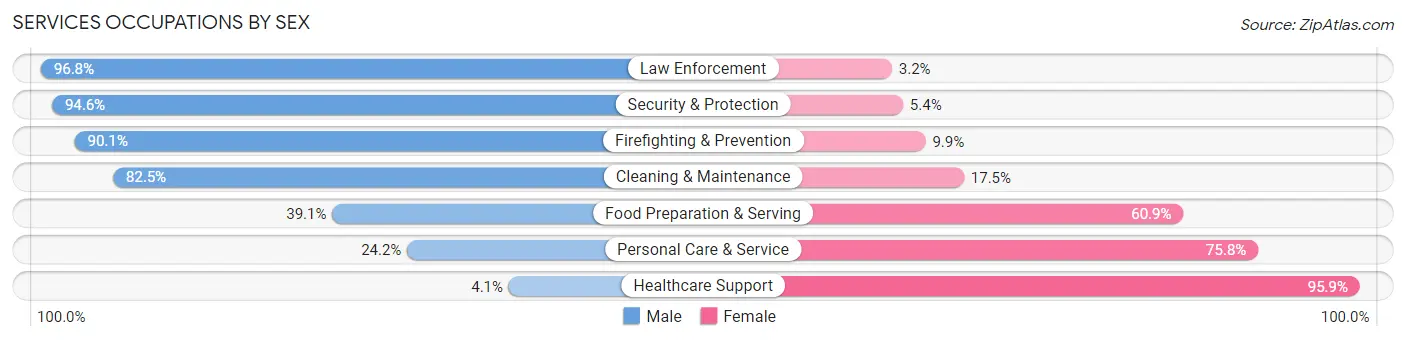
Services Occupations by Sex
Within the Services occupations in Chaffee County, the most male-oriented occupations are Law Enforcement (96.8%), Security & Protection (94.6%), and Firefighting & Prevention (90.1%), while the most female-oriented occupations are Healthcare Support (95.9%), Personal Care & Service (75.8%), and Food Preparation & Serving (60.9%).
| Occupation | Male | Female |
| Healthcare Support | 9 (4.1%) | 210 (95.9%) |
| Security & Protection | 262 (94.6%) | 15 (5.4%) |
| Firefighting & Prevention | 82 (90.1%) | 9 (9.9%) |
| Law Enforcement | 180 (96.8%) | 6 (3.2%) |
| Food Preparation & Serving | 293 (39.1%) | 457 (60.9%) |
| Cleaning & Maintenance | 335 (82.5%) | 71 (17.5%) |
| Personal Care & Service | 16 (24.2%) | 50 (75.8%) |
| Total (Category) | 915 (53.3%) | 803 (46.7%) |
| Total (Overall) | 4,425 (50.6%) | 4,327 (49.4%) |
Sales and Office Occupations
The most common Sales and Office occupations in Chaffee County are Office & Administration (1,018 | 11.6%), and Sales & Related (870 | 9.9%).

Sales and Office Occupations by Sex

| Occupation | Male | Female |
| Sales & Related | 472 (54.2%) | 398 (45.8%) |
| Office & Administration | 137 (13.5%) | 881 (86.5%) |
| Total (Category) | 609 (32.3%) | 1,279 (67.7%) |
| Total (Overall) | 4,425 (50.6%) | 4,327 (49.4%) |
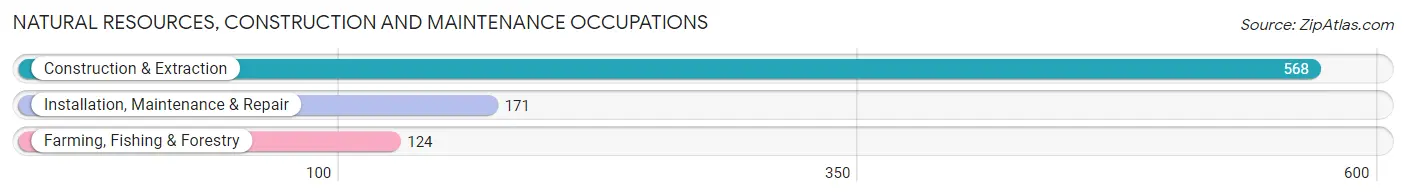
Natural Resources, Construction and Maintenance Occupations
The most common Natural Resources, Construction and Maintenance occupations in Chaffee County are Construction & Extraction (568 | 6.5%), Installation, Maintenance & Repair (171 | 1.9%), and Farming, Fishing & Forestry (124 | 1.4%).
Natural Resources, Construction and Maintenance Occupations by Sex
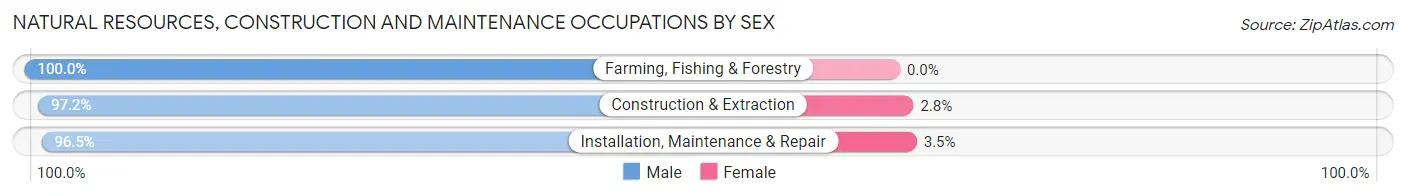
| Occupation | Male | Female |
| Farming, Fishing & Forestry | 124 (100.0%) | 0 (0.0%) |
| Construction & Extraction | 552 (97.2%) | 16 (2.8%) |
| Installation, Maintenance & Repair | 165 (96.5%) | 6 (3.5%) |
| Total (Category) | 841 (97.5%) | 22 (2.5%) |
| Total (Overall) | 4,425 (50.6%) | 4,327 (49.4%) |
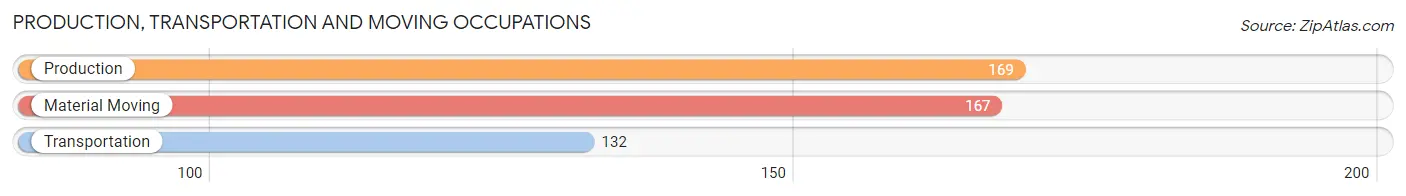
Production, Transportation and Moving Occupations
The most common Production, Transportation and Moving occupations in Chaffee County are Production (169 | 1.9%), Material Moving (167 | 1.9%), and Transportation (132 | 1.5%).
Production, Transportation and Moving Occupations by Sex
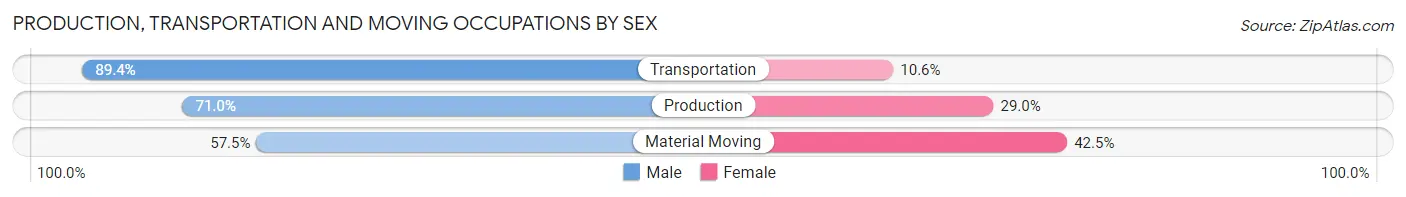
| Occupation | Male | Female |
| Production | 120 (71.0%) | 49 (29.0%) |
| Transportation | 118 (89.4%) | 14 (10.6%) |
| Material Moving | 96 (57.5%) | 71 (42.5%) |
| Total (Category) | 334 (71.4%) | 134 (28.6%) |
| Total (Overall) | 4,425 (50.6%) | 4,327 (49.4%) |
Employment Industries by Sex in Chaffee County
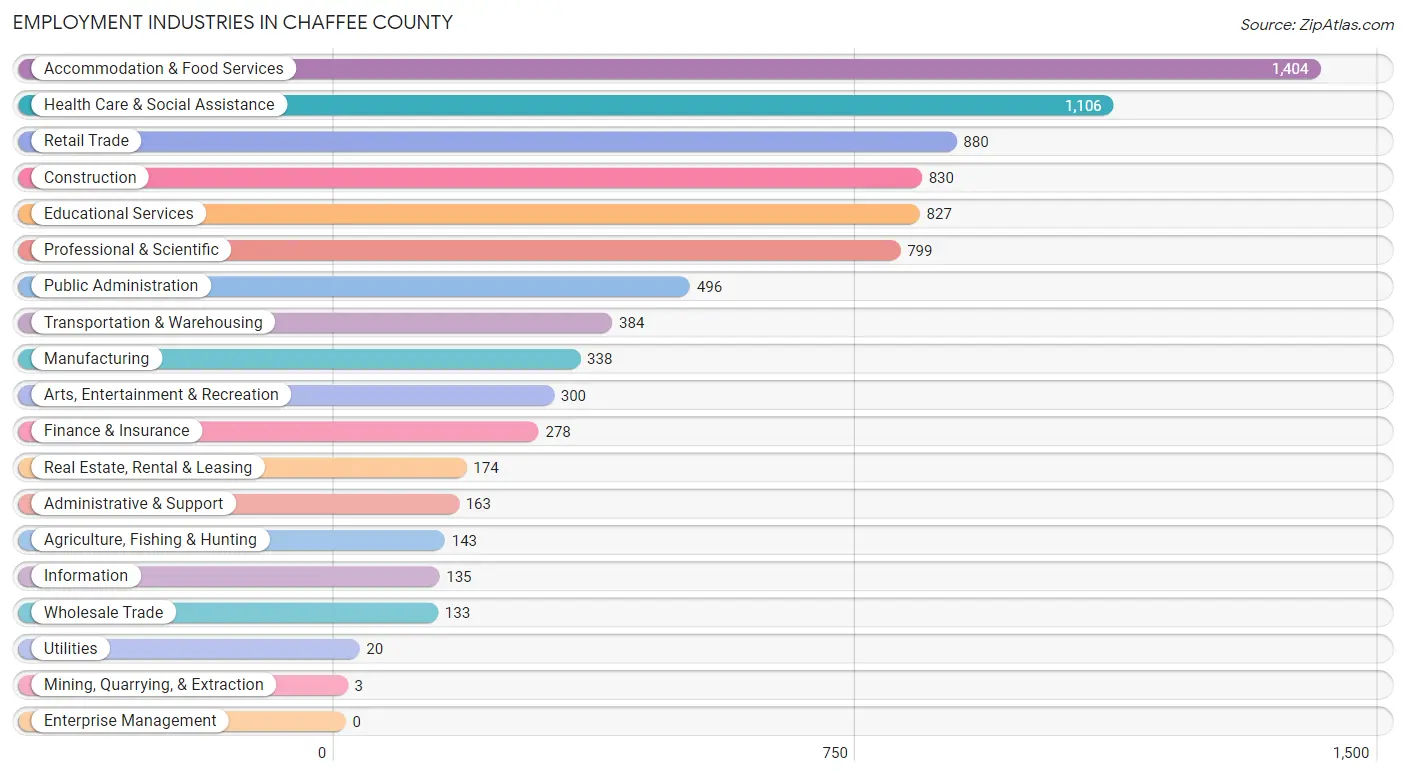
Employment Industries in Chaffee County
The major employment industries in Chaffee County include Accommodation & Food Services (1,404 | 16.0%), Health Care & Social Assistance (1,106 | 12.6%), Retail Trade (880 | 10.1%), Construction (830 | 9.5%), and Educational Services (827 | 9.5%).
Employment Industries by Sex in Chaffee County
The Chaffee County industries that see more men than women are Agriculture, Fishing & Hunting (100.0%), Construction (92.5%), and Manufacturing (71.6%), whereas the industries that tend to have a higher number of women are Mining, Quarrying, & Extraction (100.0%), Health Care & Social Assistance (85.1%), and Wholesale Trade (66.9%).
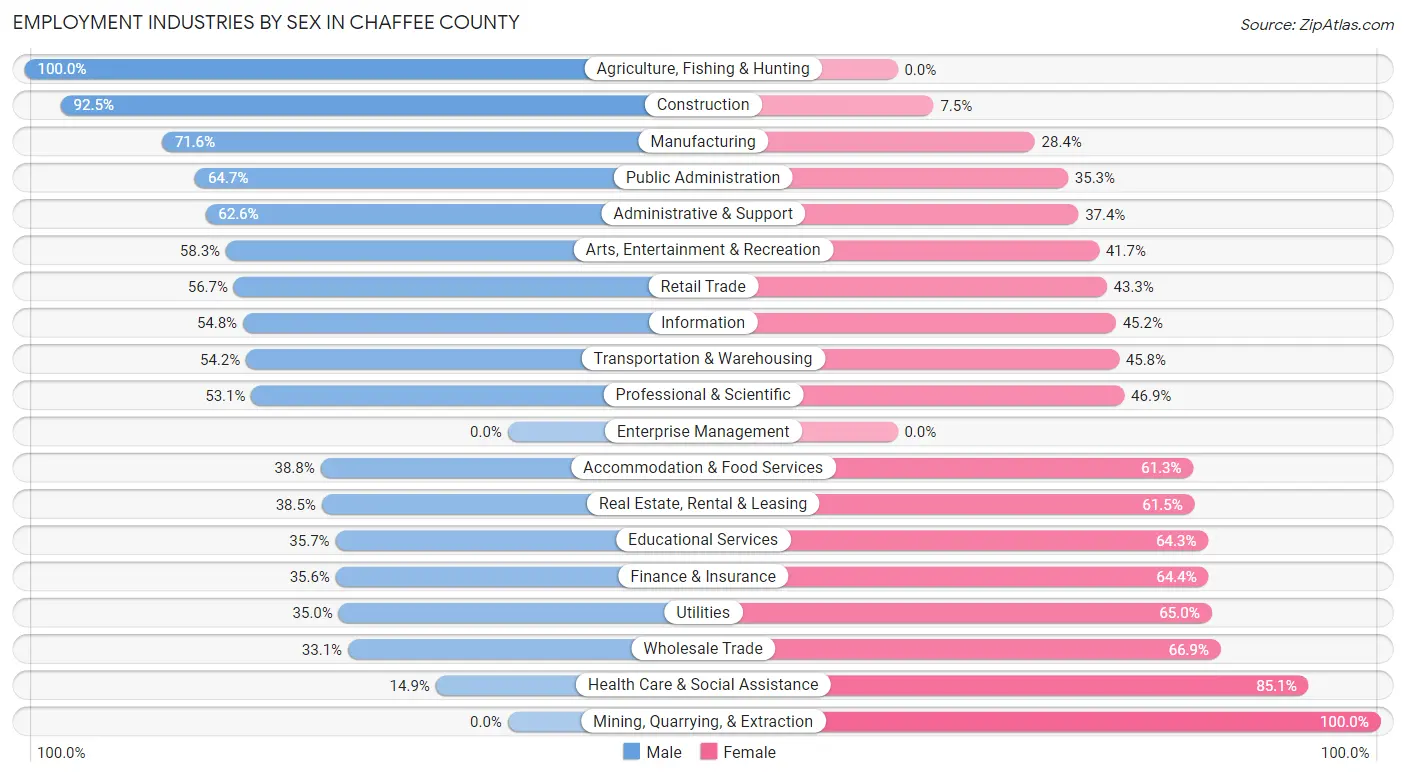
| Industry | Male | Female |
| Agriculture, Fishing & Hunting | 143 (100.0%) | 0 (0.0%) |
| Mining, Quarrying, & Extraction | 0 (0.0%) | 3 (100.0%) |
| Construction | 768 (92.5%) | 62 (7.5%) |
| Manufacturing | 242 (71.6%) | 96 (28.4%) |
| Wholesale Trade | 44 (33.1%) | 89 (66.9%) |
| Retail Trade | 499 (56.7%) | 381 (43.3%) |
| Transportation & Warehousing | 208 (54.2%) | 176 (45.8%) |
| Utilities | 7 (35.0%) | 13 (65.0%) |
| Information | 74 (54.8%) | 61 (45.2%) |
| Finance & Insurance | 99 (35.6%) | 179 (64.4%) |
| Real Estate, Rental & Leasing | 67 (38.5%) | 107 (61.5%) |
| Professional & Scientific | 424 (53.1%) | 375 (46.9%) |
| Enterprise Management | 0 (0.0%) | 0 (0.0%) |
| Administrative & Support | 102 (62.6%) | 61 (37.4%) |
| Educational Services | 295 (35.7%) | 532 (64.3%) |
| Health Care & Social Assistance | 165 (14.9%) | 941 (85.1%) |
| Arts, Entertainment & Recreation | 175 (58.3%) | 125 (41.7%) |
| Accommodation & Food Services | 544 (38.8%) | 860 (61.3%) |
| Public Administration | 321 (64.7%) | 175 (35.3%) |
| Total | 4,425 (50.6%) | 4,327 (49.4%) |
Education in Chaffee County
School Enrollment in Chaffee County
The most common levels of schooling among the 2,895 students in Chaffee County are elementary school (796 | 27.5%), middle school (611 | 21.1%), and high school (542 | 18.7%).
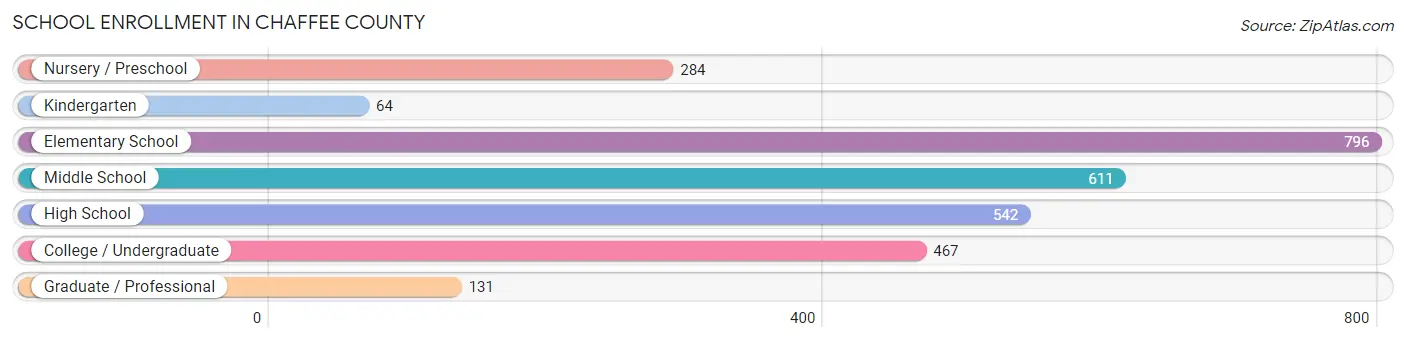
| School Level | # Students | % Students |
| Nursery / Preschool | 284 | 9.8% |
| Kindergarten | 64 | 2.2% |
| Elementary School | 796 | 27.5% |
| Middle School | 611 | 21.1% |
| High School | 542 | 18.7% |
| College / Undergraduate | 467 | 16.1% |
| Graduate / Professional | 131 | 4.5% |
| Total | 2,895 | 100.0% |
School Enrollment by Age by Funding Source in Chaffee County
Out of a total of 2,895 students who are enrolled in schools in Chaffee County, 556 (19.2%) attend a private institution, while the remaining 2,339 (80.8%) are enrolled in public schools. The age group of 3 to 4 year olds has the highest likelihood of being enrolled in private schools, with 108 (55.7% in the age bracket) enrolled. Conversely, the age group of 18 to 19 year olds has the lowest likelihood of being enrolled in a private school, with 156 (100.0% in the age bracket) attending a public institution.
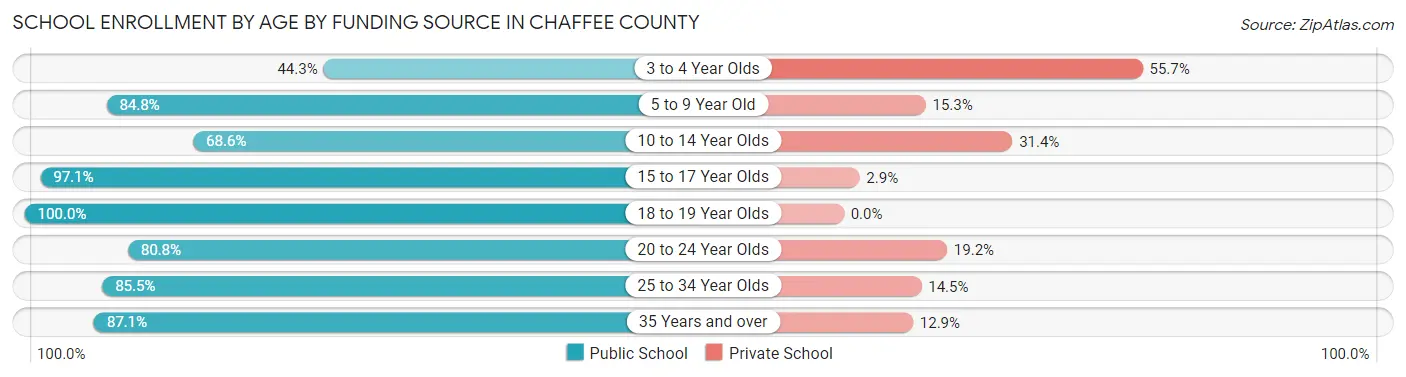
| Age Bracket | Public School | Private School |
| 3 to 4 Year Olds | 86 (44.3%) | 108 (55.7%) |
| 5 to 9 Year Old | 789 (84.8%) | 142 (15.2%) |
| 10 to 14 Year Olds | 470 (68.6%) | 215 (31.4%) |
| 15 to 17 Year Olds | 431 (97.1%) | 13 (2.9%) |
| 18 to 19 Year Olds | 156 (100.0%) | 0 (0.0%) |
| 20 to 24 Year Olds | 168 (80.8%) | 40 (19.2%) |
| 25 to 34 Year Olds | 71 (85.5%) | 12 (14.5%) |
| 35 Years and over | 169 (87.1%) | 25 (12.9%) |
| Total | 2,339 (80.8%) | 556 (19.2%) |
Educational Attainment by Field of Study in Chaffee County
Education (1,143 | 16.1%), business (855 | 12.0%), social sciences (754 | 10.6%), science & technology (694 | 9.8%), and bio, nature & agricultural (546 | 7.7%) are the most common fields of study among 7,100 individuals in Chaffee County who have obtained a bachelor's degree or higher.
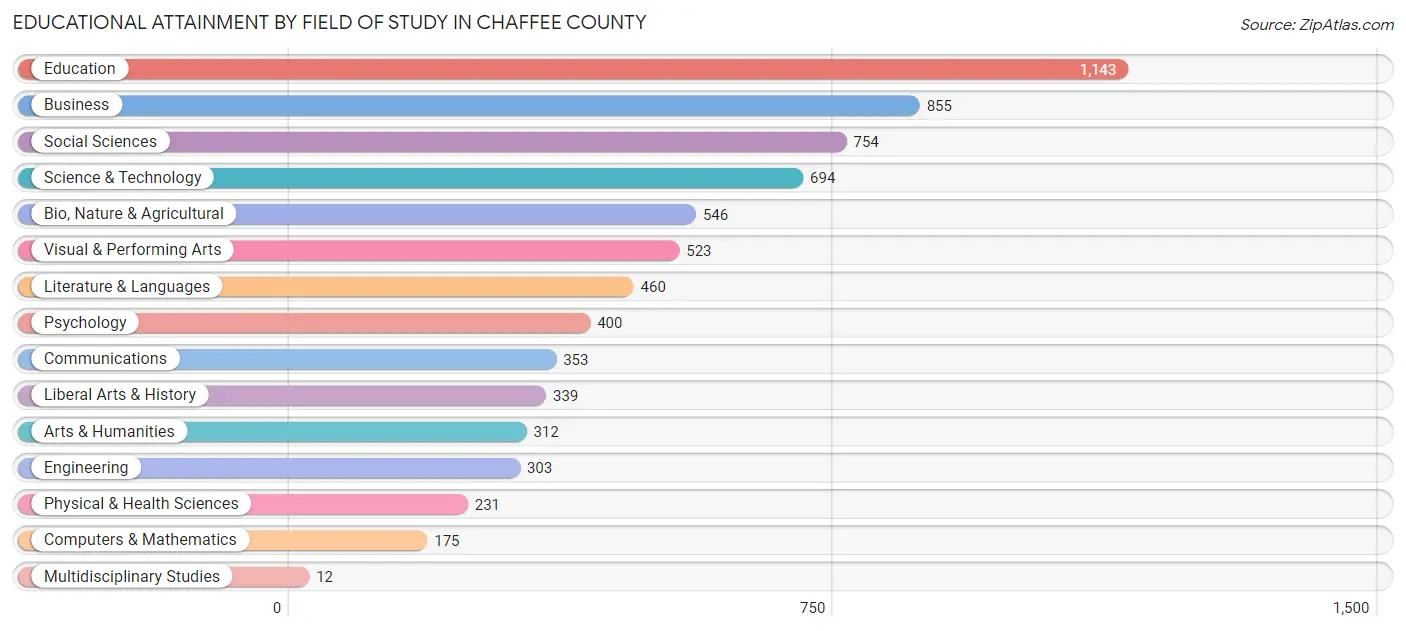
| Field of Study | # Graduates | % Graduates |
| Computers & Mathematics | 175 | 2.5% |
| Bio, Nature & Agricultural | 546 | 7.7% |
| Physical & Health Sciences | 231 | 3.3% |
| Psychology | 400 | 5.6% |
| Social Sciences | 754 | 10.6% |
| Engineering | 303 | 4.3% |
| Multidisciplinary Studies | 12 | 0.2% |
| Science & Technology | 694 | 9.8% |
| Business | 855 | 12.0% |
| Education | 1,143 | 16.1% |
| Literature & Languages | 460 | 6.5% |
| Liberal Arts & History | 339 | 4.8% |
| Visual & Performing Arts | 523 | 7.4% |
| Communications | 353 | 5.0% |
| Arts & Humanities | 312 | 4.4% |
| Total | 7,100 | 100.0% |
Transportation & Commute in Chaffee County
Vehicle Availability by Sex in Chaffee County
The most prevalent vehicle ownership categories in Chaffee County are males with 2 vehicles (1,716, accounting for 39.7%) and females with 2 vehicles (1,914, making up 39.9%).
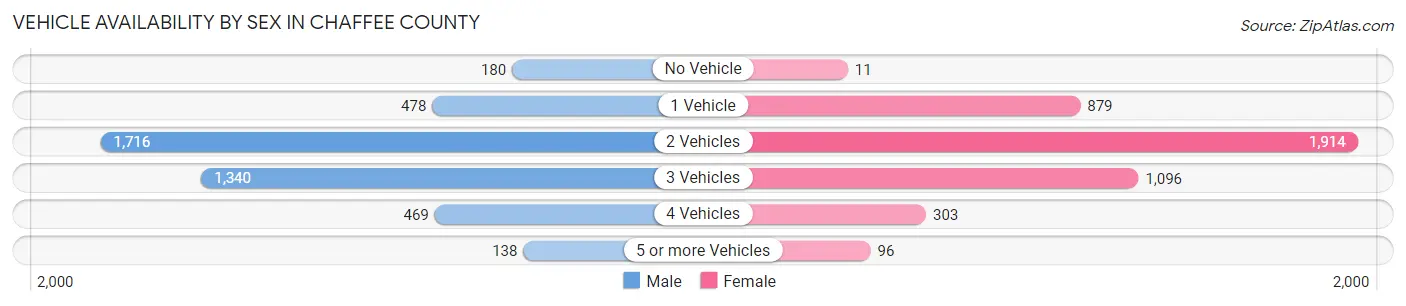
| Vehicles Available | Male | Female |
| No Vehicle | 180 (4.2%) | 11 (0.3%) |
| 1 Vehicle | 478 (11.1%) | 879 (20.4%) |
| 2 Vehicles | 1,716 (39.7%) | 1,914 (44.5%) |
| 3 Vehicles | 1,340 (31.0%) | 1,096 (25.5%) |
| 4 Vehicles | 469 (10.8%) | 303 (7.0%) |
| 5 or more Vehicles | 138 (3.2%) | 96 (2.2%) |
| Total | 4,321 (100.0%) | 4,299 (100.0%) |
Commute Time in Chaffee County
The most frequently occuring commute durations in Chaffee County are 5 to 9 minutes (2,390 commuters, 33.6%), 10 to 14 minutes (1,132 commuters, 15.9%), and less than 5 minutes (985 commuters, 13.8%).
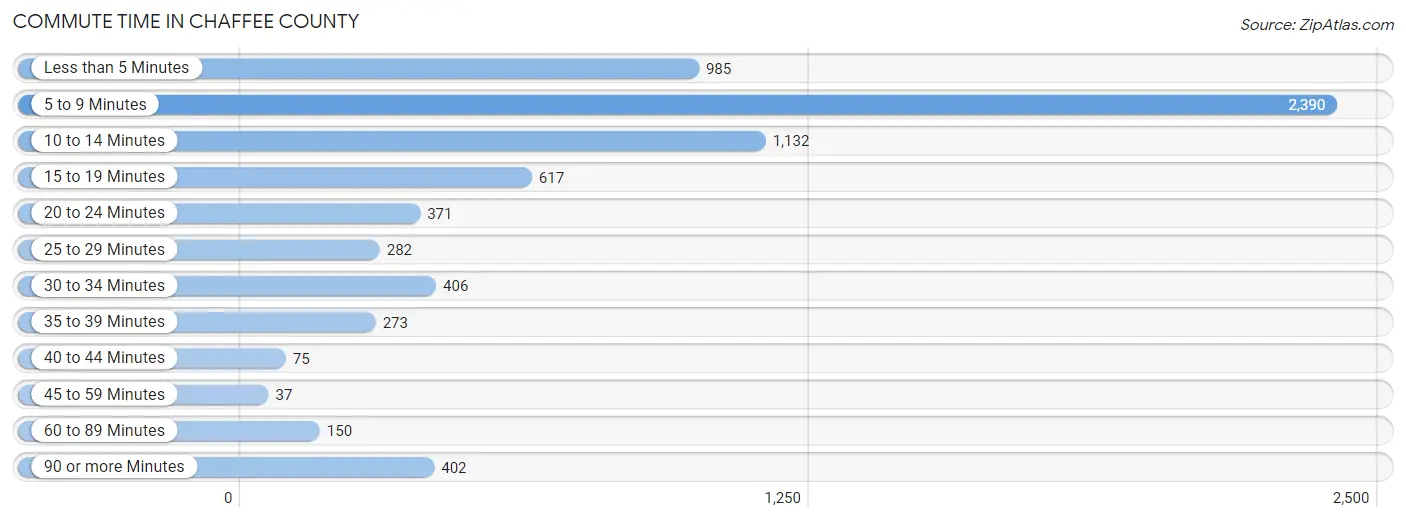
| Commute Time | # Commuters | % Commuters |
| Less than 5 Minutes | 985 | 13.8% |
| 5 to 9 Minutes | 2,390 | 33.6% |
| 10 to 14 Minutes | 1,132 | 15.9% |
| 15 to 19 Minutes | 617 | 8.7% |
| 20 to 24 Minutes | 371 | 5.2% |
| 25 to 29 Minutes | 282 | 4.0% |
| 30 to 34 Minutes | 406 | 5.7% |
| 35 to 39 Minutes | 273 | 3.8% |
| 40 to 44 Minutes | 75 | 1.1% |
| 45 to 59 Minutes | 37 | 0.5% |
| 60 to 89 Minutes | 150 | 2.1% |
| 90 or more Minutes | 402 | 5.7% |
Commute Time by Sex in Chaffee County
The most common commute times in Chaffee County are 5 to 9 minutes (1,104 commuters, 30.3%) for males and 5 to 9 minutes (1,286 commuters, 37.0%) for females.
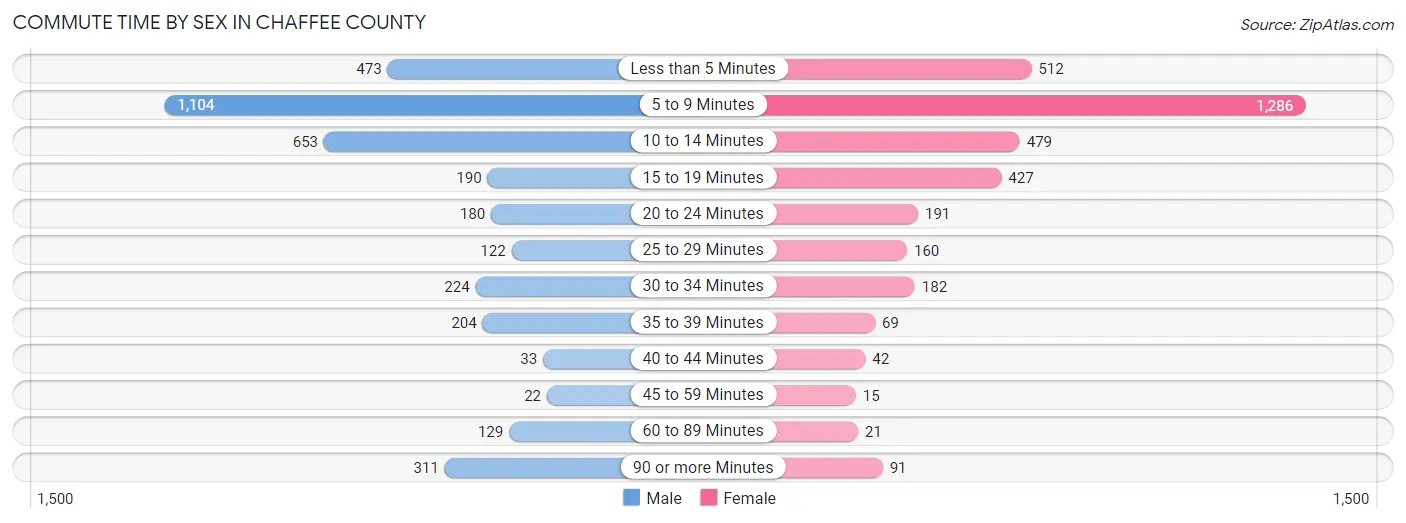
| Commute Time | Male | Female |
| Less than 5 Minutes | 473 (13.0%) | 512 (14.7%) |
| 5 to 9 Minutes | 1,104 (30.3%) | 1,286 (37.0%) |
| 10 to 14 Minutes | 653 (17.9%) | 479 (13.8%) |
| 15 to 19 Minutes | 190 (5.2%) | 427 (12.3%) |
| 20 to 24 Minutes | 180 (4.9%) | 191 (5.5%) |
| 25 to 29 Minutes | 122 (3.4%) | 160 (4.6%) |
| 30 to 34 Minutes | 224 (6.1%) | 182 (5.2%) |
| 35 to 39 Minutes | 204 (5.6%) | 69 (2.0%) |
| 40 to 44 Minutes | 33 (0.9%) | 42 (1.2%) |
| 45 to 59 Minutes | 22 (0.6%) | 15 (0.4%) |
| 60 to 89 Minutes | 129 (3.5%) | 21 (0.6%) |
| 90 or more Minutes | 311 (8.5%) | 91 (2.6%) |
Time of Departure to Work by Sex in Chaffee County
The most frequent times of departure to work in Chaffee County are 7:00 AM to 7:29 AM (565, 15.5%) for males and 7:30 AM to 7:59 AM (722, 20.8%) for females.
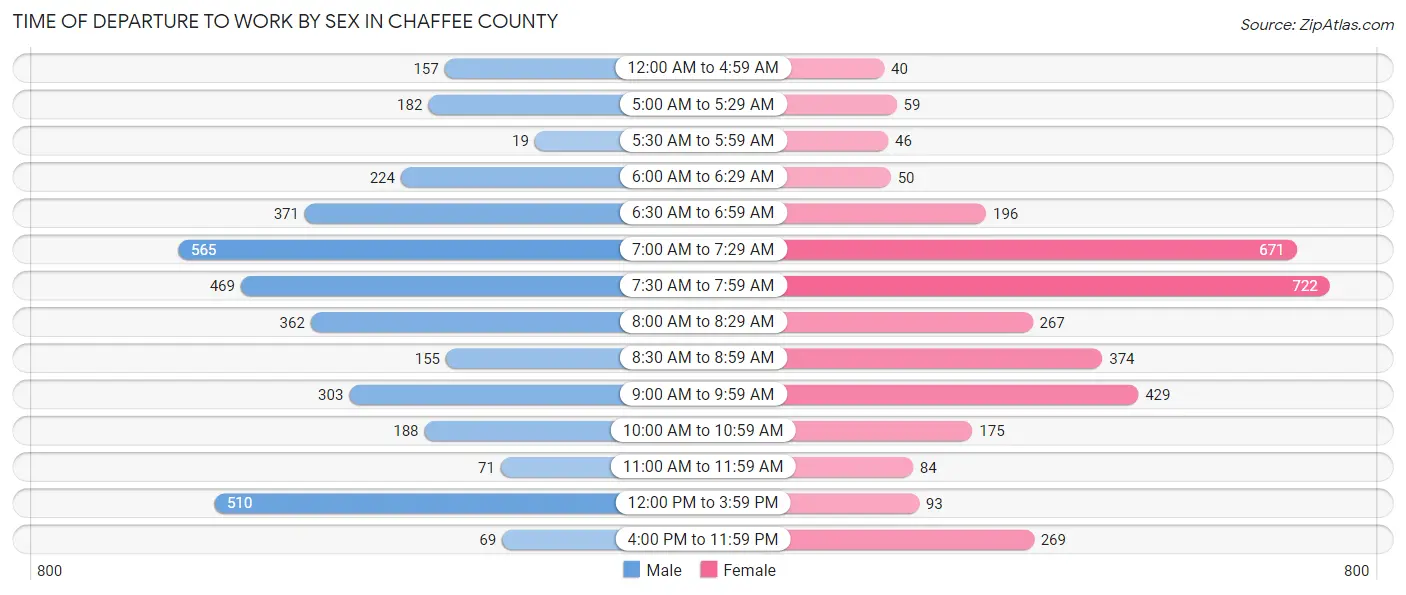
| Time of Departure | Male | Female |
| 12:00 AM to 4:59 AM | 157 (4.3%) | 40 (1.1%) |
| 5:00 AM to 5:29 AM | 182 (5.0%) | 59 (1.7%) |
| 5:30 AM to 5:59 AM | 19 (0.5%) | 46 (1.3%) |
| 6:00 AM to 6:29 AM | 224 (6.1%) | 50 (1.4%) |
| 6:30 AM to 6:59 AM | 371 (10.2%) | 196 (5.6%) |
| 7:00 AM to 7:29 AM | 565 (15.5%) | 671 (19.3%) |
| 7:30 AM to 7:59 AM | 469 (12.9%) | 722 (20.8%) |
| 8:00 AM to 8:29 AM | 362 (9.9%) | 267 (7.7%) |
| 8:30 AM to 8:59 AM | 155 (4.3%) | 374 (10.8%) |
| 9:00 AM to 9:59 AM | 303 (8.3%) | 429 (12.3%) |
| 10:00 AM to 10:59 AM | 188 (5.2%) | 175 (5.0%) |
| 11:00 AM to 11:59 AM | 71 (1.9%) | 84 (2.4%) |
| 12:00 PM to 3:59 PM | 510 (14.0%) | 93 (2.7%) |
| 4:00 PM to 11:59 PM | 69 (1.9%) | 269 (7.7%) |
| Total | 3,645 (100.0%) | 3,475 (100.0%) |
Housing Occupancy in Chaffee County
Occupancy by Ownership in Chaffee County
Of the total 9,066 dwellings in Chaffee County, owner-occupied units account for 6,309 (69.6%), while renter-occupied units make up 2,757 (30.4%).
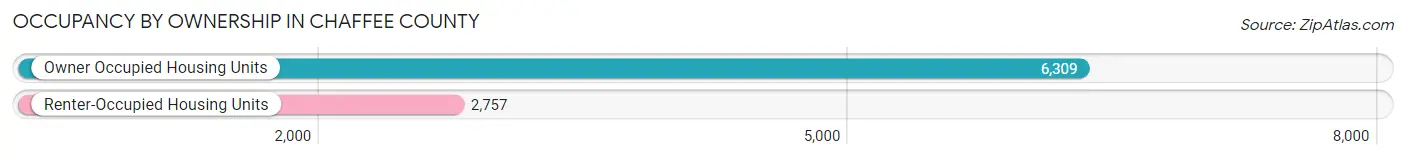
| Occupancy | # Housing Units | % Housing Units |
| Owner Occupied Housing Units | 6,309 | 69.6% |
| Renter-Occupied Housing Units | 2,757 | 30.4% |
| Total Occupied Housing Units | 9,066 | 100.0% |
Occupancy by Household Size in Chaffee County
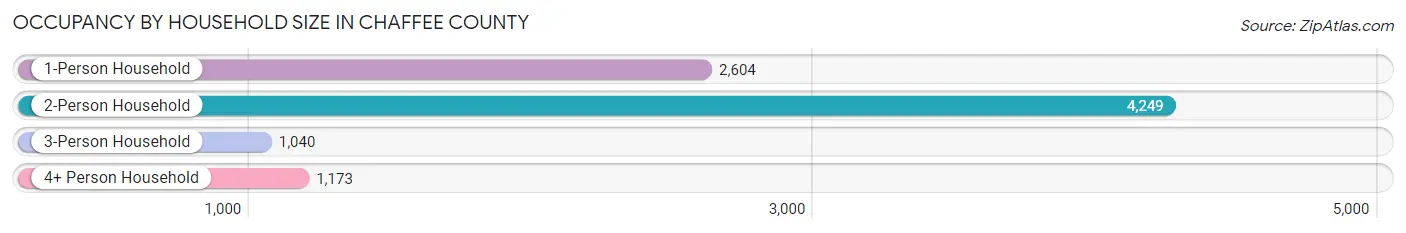
| Household Size | # Housing Units | % Housing Units |
| 1-Person Household | 2,604 | 28.7% |
| 2-Person Household | 4,249 | 46.9% |
| 3-Person Household | 1,040 | 11.5% |
| 4+ Person Household | 1,173 | 12.9% |
| Total Housing Units | 9,066 | 100.0% |
Occupancy by Ownership by Household Size in Chaffee County
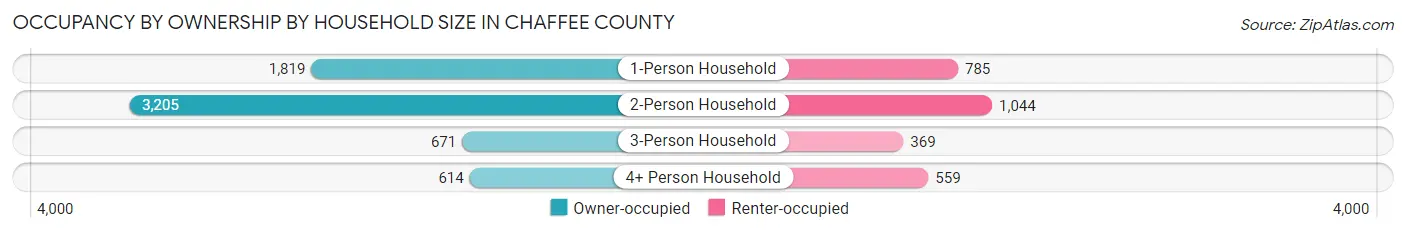
| Household Size | Owner-occupied | Renter-occupied |
| 1-Person Household | 1,819 (69.9%) | 785 (30.1%) |
| 2-Person Household | 3,205 (75.4%) | 1,044 (24.6%) |
| 3-Person Household | 671 (64.5%) | 369 (35.5%) |
| 4+ Person Household | 614 (52.3%) | 559 (47.7%) |
| Total Housing Units | 6,309 (69.6%) | 2,757 (30.4%) |
Occupancy by Educational Attainment in Chaffee County
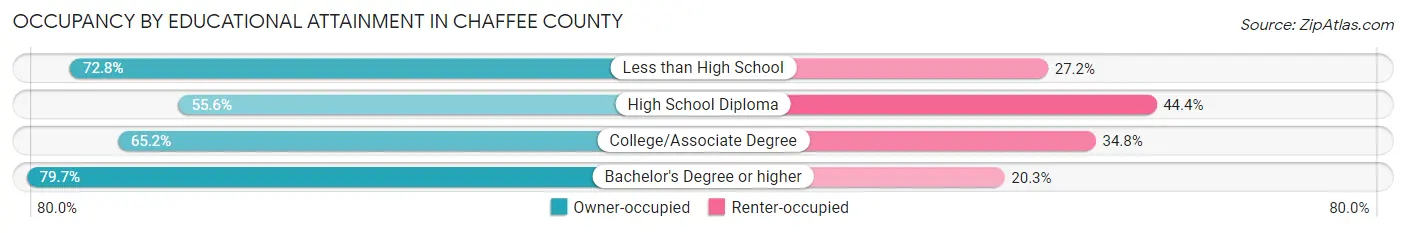
| Household Size | Owner-occupied | Renter-occupied |
| Less than High School | 377 (72.8%) | 141 (27.2%) |
| High School Diploma | 1,140 (55.6%) | 911 (44.4%) |
| College/Associate Degree | 1,731 (65.2%) | 924 (34.8%) |
| Bachelor's Degree or higher | 3,061 (79.7%) | 781 (20.3%) |
Occupancy by Age of Householder in Chaffee County
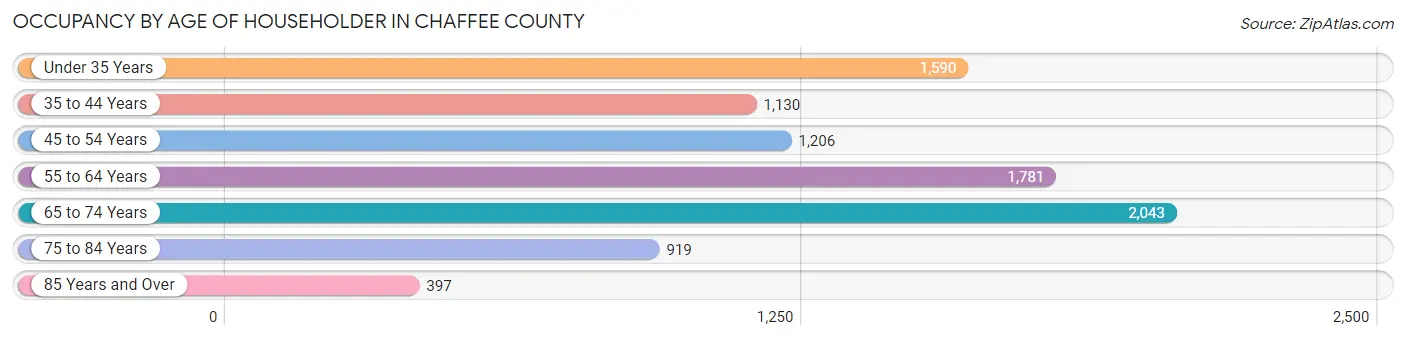
| Age Bracket | # Households | % Households |
| Under 35 Years | 1,590 | 17.5% |
| 35 to 44 Years | 1,130 | 12.5% |
| 45 to 54 Years | 1,206 | 13.3% |
| 55 to 64 Years | 1,781 | 19.6% |
| 65 to 74 Years | 2,043 | 22.5% |
| 75 to 84 Years | 919 | 10.1% |
| 85 Years and Over | 397 | 4.4% |
| Total | 9,066 | 100.0% |
Housing Finances in Chaffee County
Median Income by Occupancy in Chaffee County
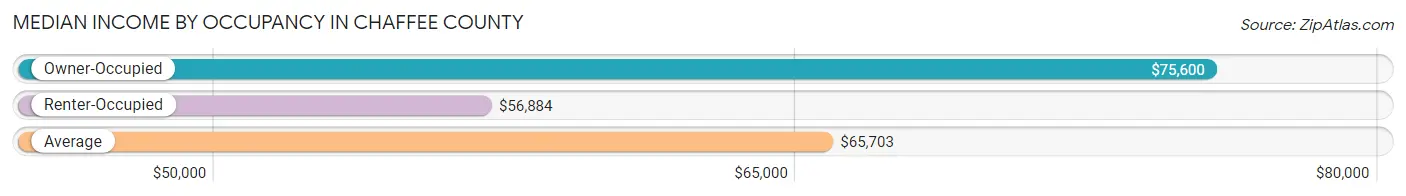
| Occupancy Type | # Households | Median Income |
| Owner-Occupied | 6,309 (69.6%) | $75,600 |
| Renter-Occupied | 2,757 (30.4%) | $56,884 |
| Average | 9,066 (100.0%) | $65,703 |
Occupancy by Householder Income Bracket in Chaffee County
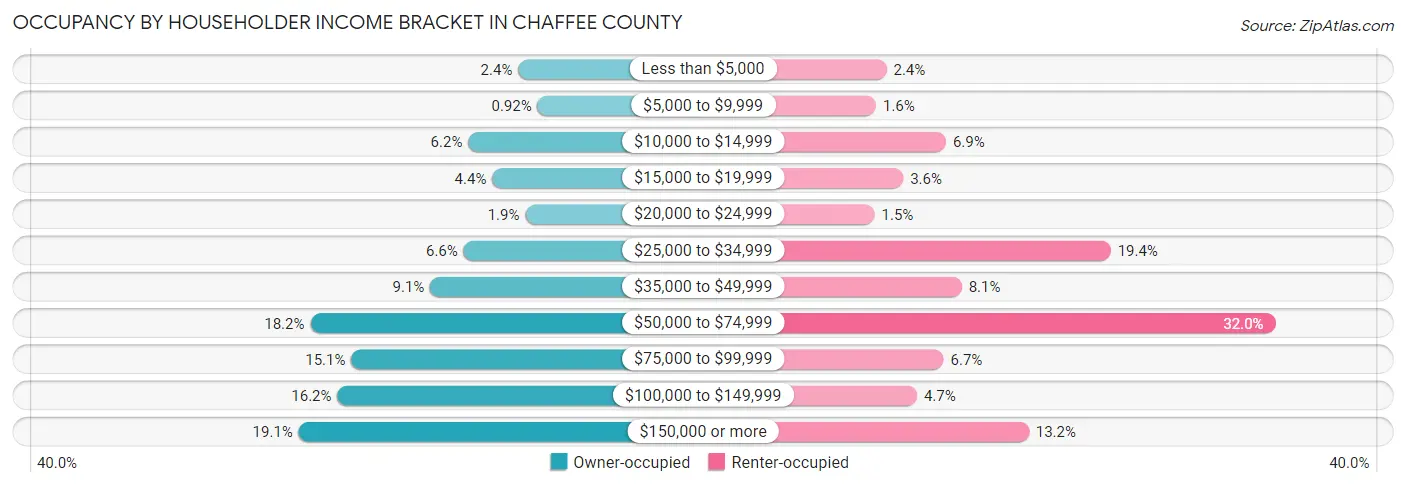
| Income Bracket | Owner-occupied | Renter-occupied |
| Less than $5,000 | 151 (2.4%) | 65 (2.4%) |
| $5,000 to $9,999 | 58 (0.9%) | 43 (1.6%) |
| $10,000 to $14,999 | 391 (6.2%) | 190 (6.9%) |
| $15,000 to $19,999 | 276 (4.4%) | 100 (3.6%) |
| $20,000 to $24,999 | 117 (1.8%) | 40 (1.5%) |
| $25,000 to $34,999 | 413 (6.6%) | 536 (19.4%) |
| $35,000 to $49,999 | 574 (9.1%) | 223 (8.1%) |
| $50,000 to $74,999 | 1,150 (18.2%) | 882 (32.0%) |
| $75,000 to $99,999 | 953 (15.1%) | 185 (6.7%) |
| $100,000 to $149,999 | 1,020 (16.2%) | 129 (4.7%) |
| $150,000 or more | 1,206 (19.1%) | 364 (13.2%) |
| Total | 6,309 (100.0%) | 2,757 (100.0%) |
Monthly Housing Cost Tiers in Chaffee County
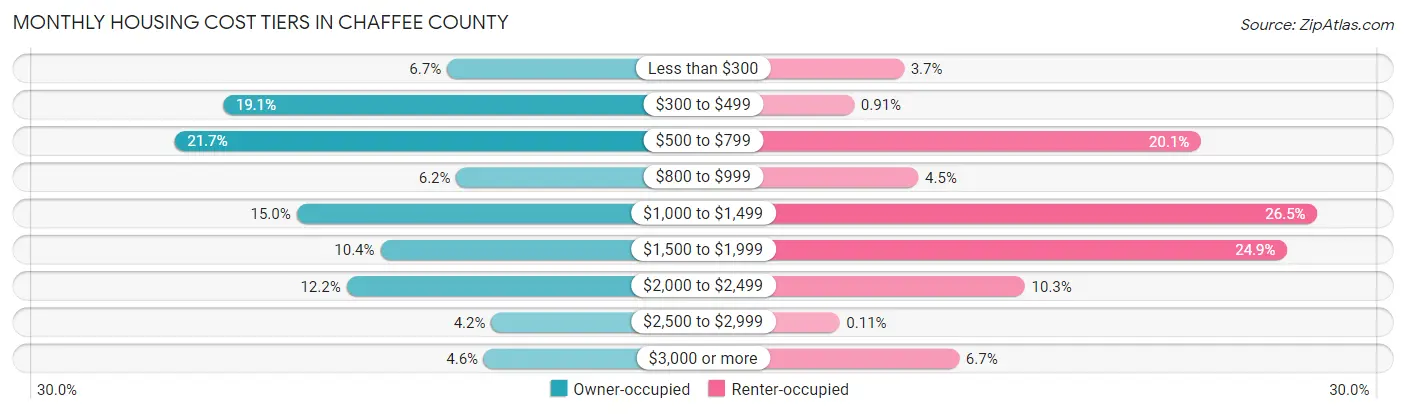
| Monthly Cost | Owner-occupied | Renter-occupied |
| Less than $300 | 421 (6.7%) | 101 (3.7%) |
| $300 to $499 | 1,202 (19.1%) | 25 (0.9%) |
| $500 to $799 | 1,371 (21.7%) | 554 (20.1%) |
| $800 to $999 | 388 (6.1%) | 123 (4.5%) |
| $1,000 to $1,499 | 945 (15.0%) | 731 (26.5%) |
| $1,500 to $1,999 | 653 (10.3%) | 685 (24.8%) |
| $2,000 to $2,499 | 771 (12.2%) | 285 (10.3%) |
| $2,500 to $2,999 | 266 (4.2%) | 3 (0.1%) |
| $3,000 or more | 292 (4.6%) | 185 (6.7%) |
| Total | 6,309 (100.0%) | 2,757 (100.0%) |
Physical Housing Characteristics in Chaffee County
Housing Structures in Chaffee County
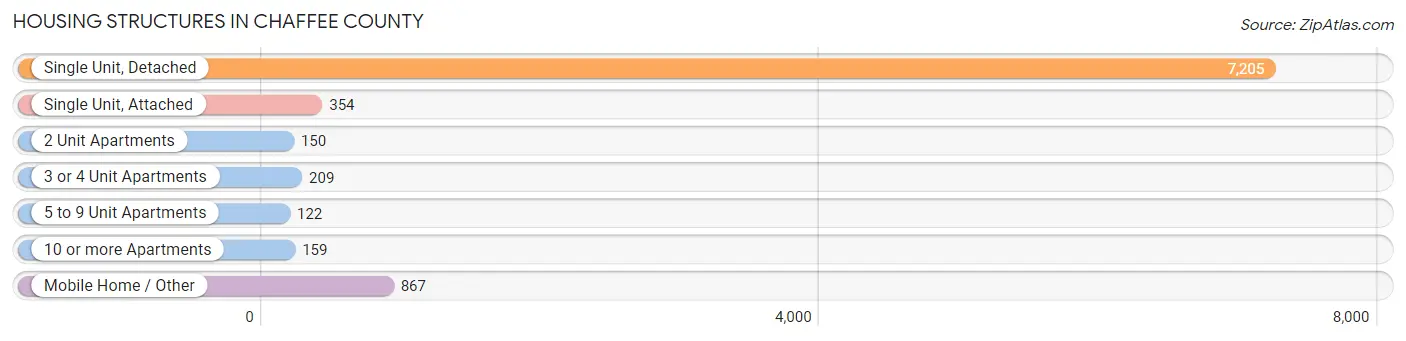
| Structure Type | # Housing Units | % Housing Units |
| Single Unit, Detached | 7,205 | 79.5% |
| Single Unit, Attached | 354 | 3.9% |
| 2 Unit Apartments | 150 | 1.7% |
| 3 or 4 Unit Apartments | 209 | 2.3% |
| 5 to 9 Unit Apartments | 122 | 1.3% |
| 10 or more Apartments | 159 | 1.8% |
| Mobile Home / Other | 867 | 9.6% |
| Total | 9,066 | 100.0% |
Housing Structures by Occupancy in Chaffee County
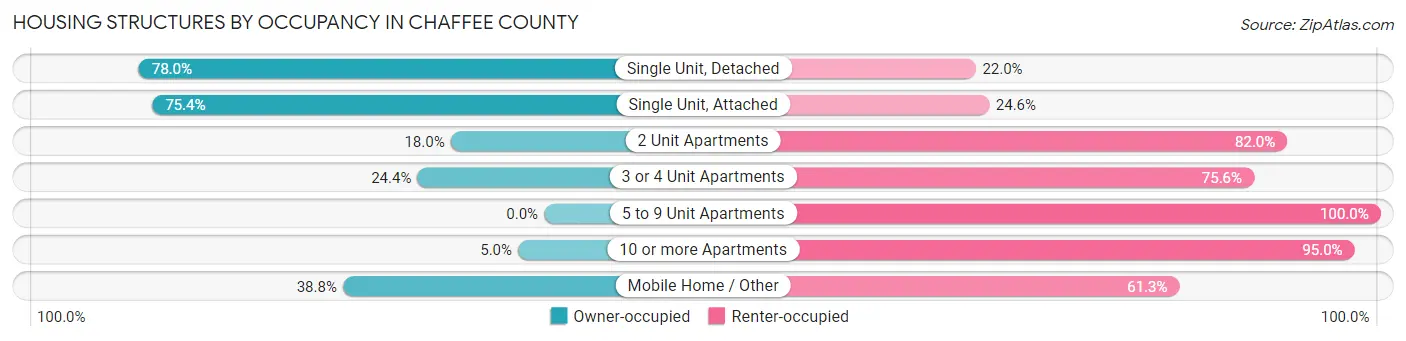
| Structure Type | Owner-occupied | Renter-occupied |
| Single Unit, Detached | 5,620 (78.0%) | 1,585 (22.0%) |
| Single Unit, Attached | 267 (75.4%) | 87 (24.6%) |
| 2 Unit Apartments | 27 (18.0%) | 123 (82.0%) |
| 3 or 4 Unit Apartments | 51 (24.4%) | 158 (75.6%) |
| 5 to 9 Unit Apartments | 0 (0.0%) | 122 (100.0%) |
| 10 or more Apartments | 8 (5.0%) | 151 (95.0%) |
| Mobile Home / Other | 336 (38.8%) | 531 (61.3%) |
| Total | 6,309 (69.6%) | 2,757 (30.4%) |
Housing Structures by Number of Rooms in Chaffee County
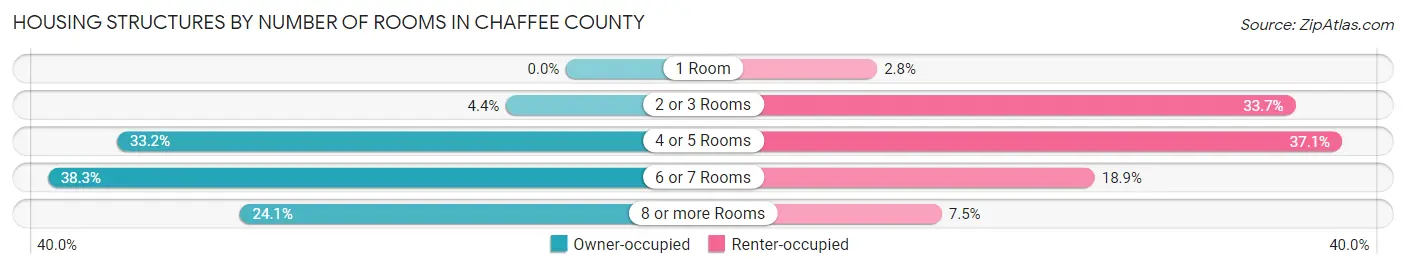
| Number of Rooms | Owner-occupied | Renter-occupied |
| 1 Room | 0 (0.0%) | 76 (2.8%) |
| 2 or 3 Rooms | 280 (4.4%) | 929 (33.7%) |
| 4 or 5 Rooms | 2,093 (33.2%) | 1,024 (37.1%) |
| 6 or 7 Rooms | 2,416 (38.3%) | 520 (18.9%) |
| 8 or more Rooms | 1,520 (24.1%) | 208 (7.5%) |
| Total | 6,309 (100.0%) | 2,757 (100.0%) |
Housing Structure by Heating Type in Chaffee County
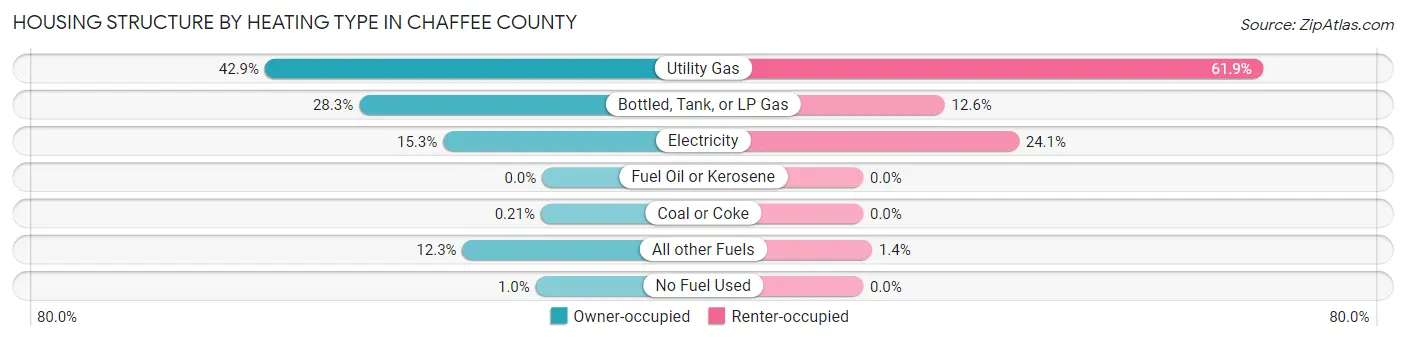
| Heating Type | Owner-occupied | Renter-occupied |
| Utility Gas | 2,704 (42.9%) | 1,707 (61.9%) |
| Bottled, Tank, or LP Gas | 1,786 (28.3%) | 348 (12.6%) |
| Electricity | 966 (15.3%) | 664 (24.1%) |
| Fuel Oil or Kerosene | 0 (0.0%) | 0 (0.0%) |
| Coal or Coke | 13 (0.2%) | 0 (0.0%) |
| All other Fuels | 777 (12.3%) | 38 (1.4%) |
| No Fuel Used | 63 (1.0%) | 0 (0.0%) |
| Total | 6,309 (100.0%) | 2,757 (100.0%) |
Household Vehicle Usage in Chaffee County
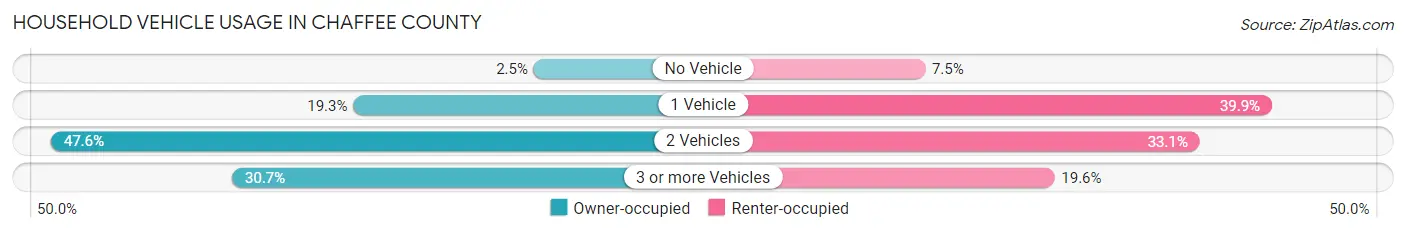
| Vehicles per Household | Owner-occupied | Renter-occupied |
| No Vehicle | 156 (2.5%) | 206 (7.5%) |
| 1 Vehicle | 1,219 (19.3%) | 1,099 (39.9%) |
| 2 Vehicles | 3,000 (47.5%) | 913 (33.1%) |
| 3 or more Vehicles | 1,934 (30.6%) | 539 (19.6%) |
| Total | 6,309 (100.0%) | 2,757 (100.0%) |
Real Estate & Mortgages in Chaffee County
Real Estate and Mortgage Overview in Chaffee County
| Characteristic | Without Mortgage | With Mortgage |
| Housing Units | 2,940 | 3,369 |
| Median Property Value | $556,900 | $488,600 |
| Median Household Income | $61,353 | $745 |
| Monthly Housing Costs | $489 | $292 |
| Real Estate Taxes | $1,582 | $98 |
Property Value by Mortgage Status in Chaffee County
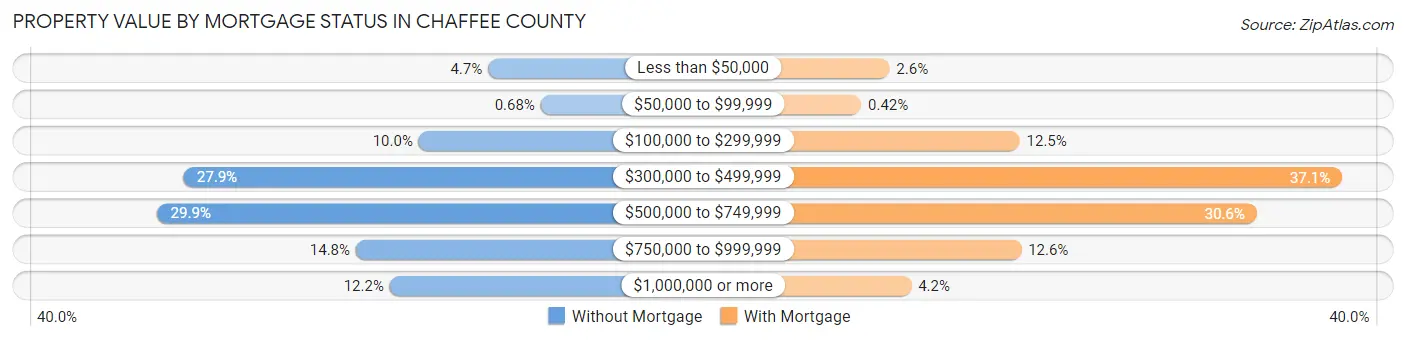
| Property Value | Without Mortgage | With Mortgage |
| Less than $50,000 | 138 (4.7%) | 87 (2.6%) |
| $50,000 to $99,999 | 20 (0.7%) | 14 (0.4%) |
| $100,000 to $299,999 | 293 (10.0%) | 421 (12.5%) |
| $300,000 to $499,999 | 819 (27.9%) | 1,249 (37.1%) |
| $500,000 to $749,999 | 878 (29.9%) | 1,030 (30.6%) |
| $750,000 to $999,999 | 434 (14.8%) | 425 (12.6%) |
| $1,000,000 or more | 358 (12.2%) | 143 (4.2%) |
| Total | 2,940 (100.0%) | 3,369 (100.0%) |
Household Income by Mortgage Status in Chaffee County
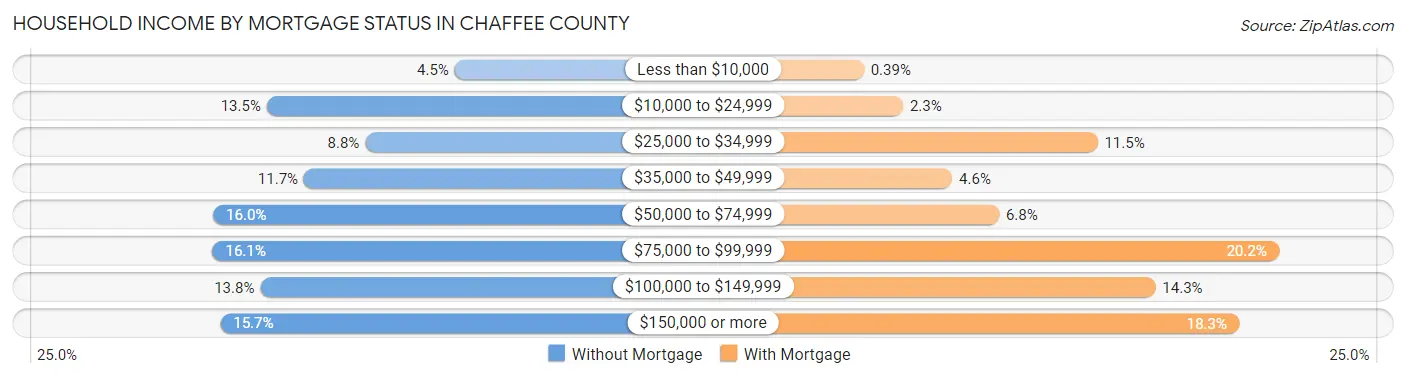
| Household Income | Without Mortgage | With Mortgage |
| Less than $10,000 | 133 (4.5%) | 13 (0.4%) |
| $10,000 to $24,999 | 396 (13.5%) | 76 (2.3%) |
| $25,000 to $34,999 | 258 (8.8%) | 388 (11.5%) |
| $35,000 to $49,999 | 344 (11.7%) | 155 (4.6%) |
| $50,000 to $74,999 | 471 (16.0%) | 230 (6.8%) |
| $75,000 to $99,999 | 472 (16.1%) | 679 (20.2%) |
| $100,000 to $149,999 | 405 (13.8%) | 481 (14.3%) |
| $150,000 or more | 461 (15.7%) | 615 (18.2%) |
| Total | 2,940 (100.0%) | 3,369 (100.0%) |
Property Value to Household Income Ratio in Chaffee County
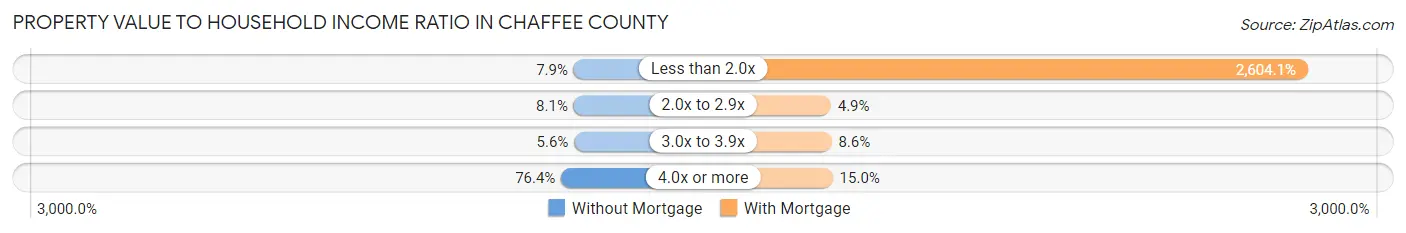
| Value-to-Income Ratio | Without Mortgage | With Mortgage |
| Less than 2.0x | 233 (7.9%) | 87,733 (2,604.1%) |
| 2.0x to 2.9x | 237 (8.1%) | 164 (4.9%) |
| 3.0x to 3.9x | 165 (5.6%) | 289 (8.6%) |
| 4.0x or more | 2,245 (76.4%) | 505 (15.0%) |
| Total | 2,940 (100.0%) | 3,369 (100.0%) |
Real Estate Taxes by Mortgage Status in Chaffee County
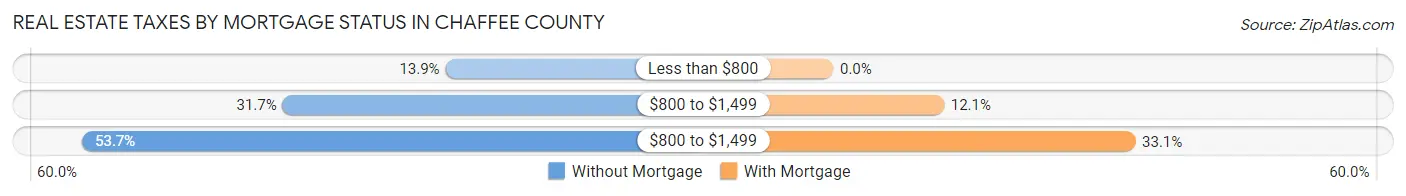
| Property Taxes | Without Mortgage | With Mortgage |
| Less than $800 | 408 (13.9%) | 0 (0.0%) |
| $800 to $1,499 | 933 (31.7%) | 409 (12.1%) |
| $800 to $1,499 | 1,579 (53.7%) | 1,115 (33.1%) |
| Total | 2,940 (100.0%) | 3,369 (100.0%) |
Health & Disability in Chaffee County
Health Insurance Coverage by Age in Chaffee County
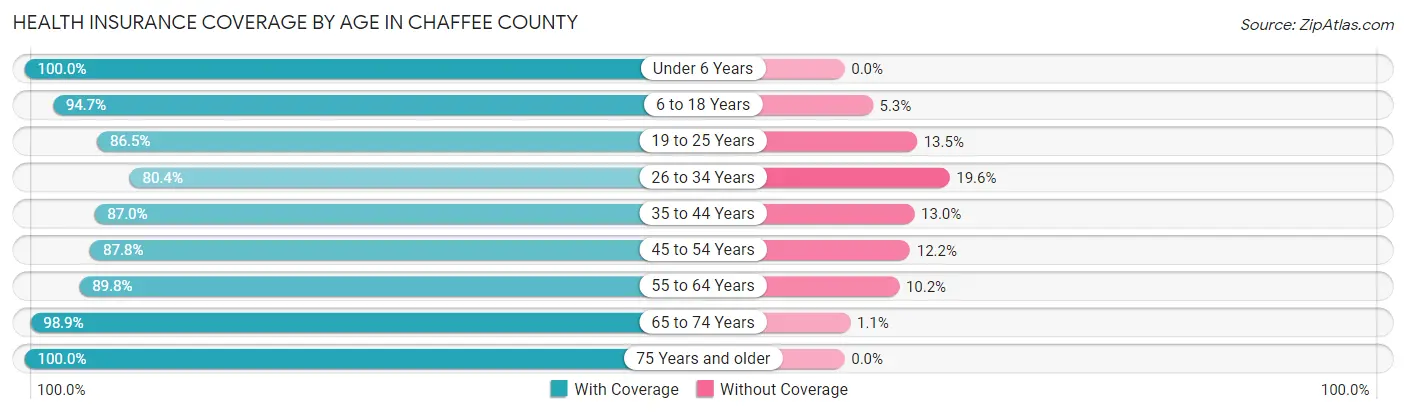
| Age Bracket | With Coverage | Without Coverage |
| Under 6 Years | 894 (100.0%) | 0 (0.0%) |
| 6 to 18 Years | 2,048 (94.7%) | 114 (5.3%) |
| 19 to 25 Years | 864 (86.5%) | 135 (13.5%) |
| 26 to 34 Years | 1,540 (80.4%) | 375 (19.6%) |
| 35 to 44 Years | 1,891 (87.0%) | 283 (13.0%) |
| 45 to 54 Years | 1,761 (87.8%) | 245 (12.2%) |
| 55 to 64 Years | 2,653 (89.8%) | 301 (10.2%) |
| 65 to 74 Years | 3,153 (98.9%) | 34 (1.1%) |
| 75 Years and older | 1,883 (100.0%) | 0 (0.0%) |
| Total | 16,687 (91.8%) | 1,487 (8.2%) |
Health Insurance Coverage by Citizenship Status in Chaffee County
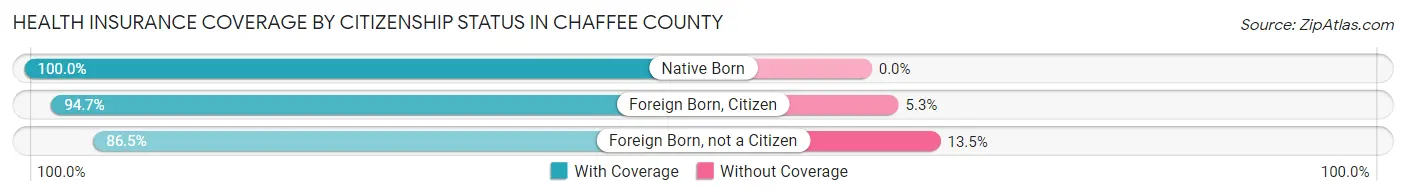
| Citizenship Status | With Coverage | Without Coverage |
| Native Born | 894 (100.0%) | 0 (0.0%) |
| Foreign Born, Citizen | 2,048 (94.7%) | 114 (5.3%) |
| Foreign Born, not a Citizen | 864 (86.5%) | 135 (13.5%) |
Health Insurance Coverage by Household Income in Chaffee County
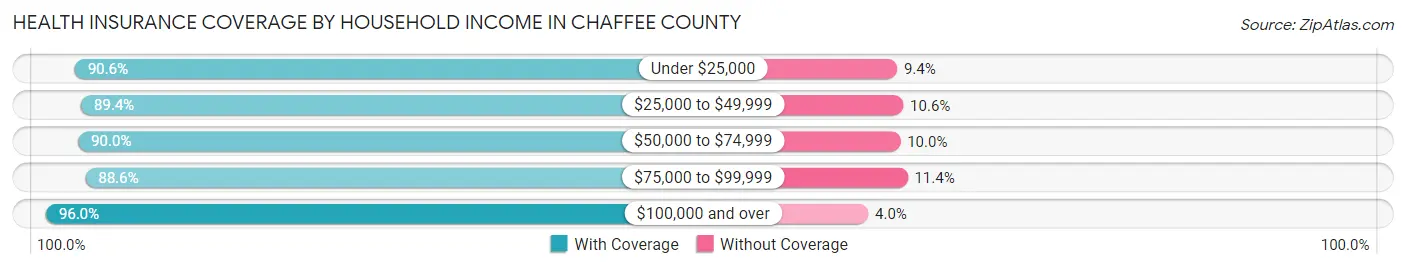
| Household Income | With Coverage | Without Coverage |
| Under $25,000 | 1,715 (90.6%) | 178 (9.4%) |
| $25,000 to $49,999 | 2,634 (89.4%) | 311 (10.6%) |
| $50,000 to $74,999 | 3,669 (90.0%) | 408 (10.0%) |
| $75,000 to $99,999 | 2,369 (88.6%) | 304 (11.4%) |
| $100,000 and over | 6,250 (96.0%) | 260 (4.0%) |
Public vs Private Health Insurance Coverage by Age in Chaffee County
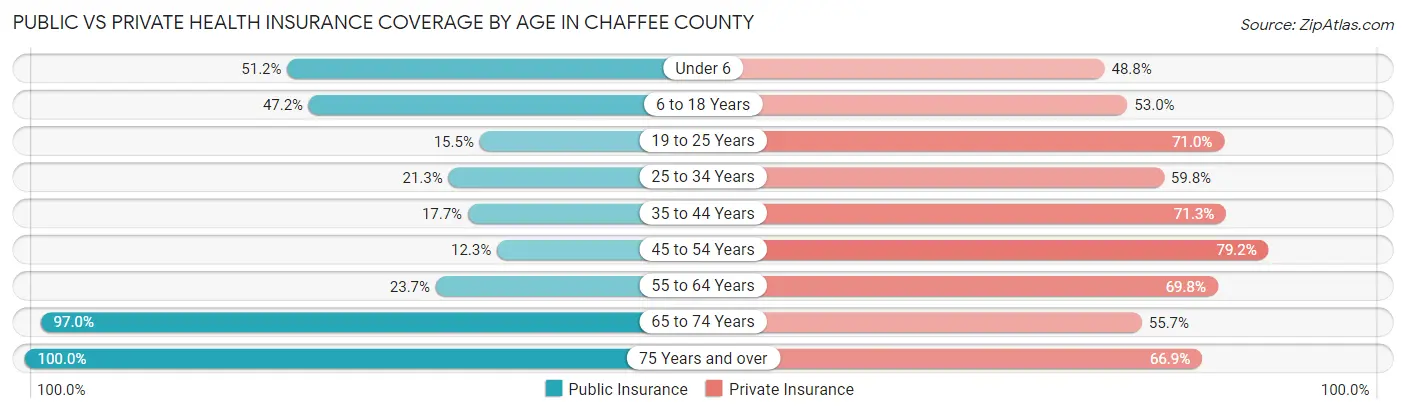
| Age Bracket | Public Insurance | Private Insurance |
| Under 6 | 458 (51.2%) | 436 (48.8%) |
| 6 to 18 Years | 1,021 (47.2%) | 1,146 (53.0%) |
| 19 to 25 Years | 155 (15.5%) | 709 (71.0%) |
| 25 to 34 Years | 408 (21.3%) | 1,145 (59.8%) |
| 35 to 44 Years | 385 (17.7%) | 1,551 (71.3%) |
| 45 to 54 Years | 247 (12.3%) | 1,589 (79.2%) |
| 55 to 64 Years | 699 (23.7%) | 2,061 (69.8%) |
| 65 to 74 Years | 3,092 (97.0%) | 1,775 (55.7%) |
| 75 Years and over | 1,883 (100.0%) | 1,259 (66.9%) |
| Total | 8,348 (45.9%) | 11,671 (64.2%) |
Disability Status by Sex by Age in Chaffee County
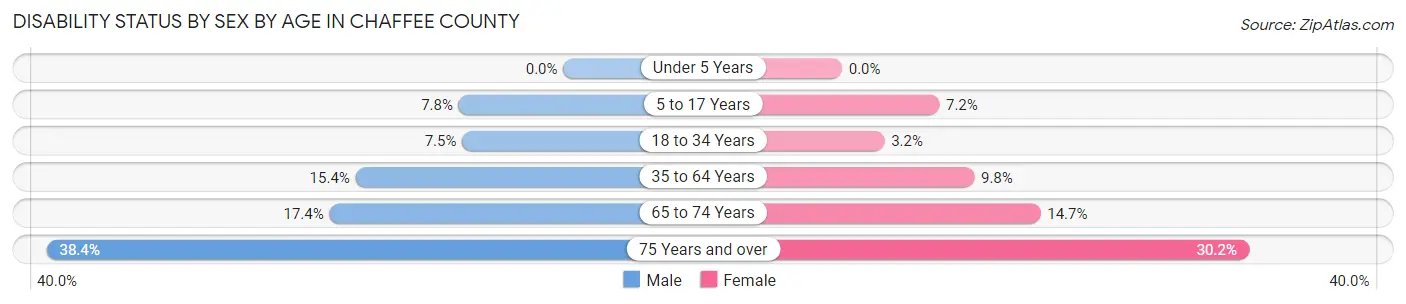
| Age Bracket | Male | Female |
| Under 5 Years | 0 (0.0%) | 0 (0.0%) |
| 5 to 17 Years | 85 (7.8%) | 77 (7.2%) |
| 18 to 34 Years | 102 (7.5%) | 53 (3.2%) |
| 35 to 64 Years | 544 (15.4%) | 354 (9.8%) |
| 65 to 74 Years | 267 (17.4%) | 243 (14.7%) |
| 75 Years and over | 330 (38.4%) | 309 (30.2%) |
Disability Class by Sex by Age in Chaffee County
Disability Class: Hearing Difficulty
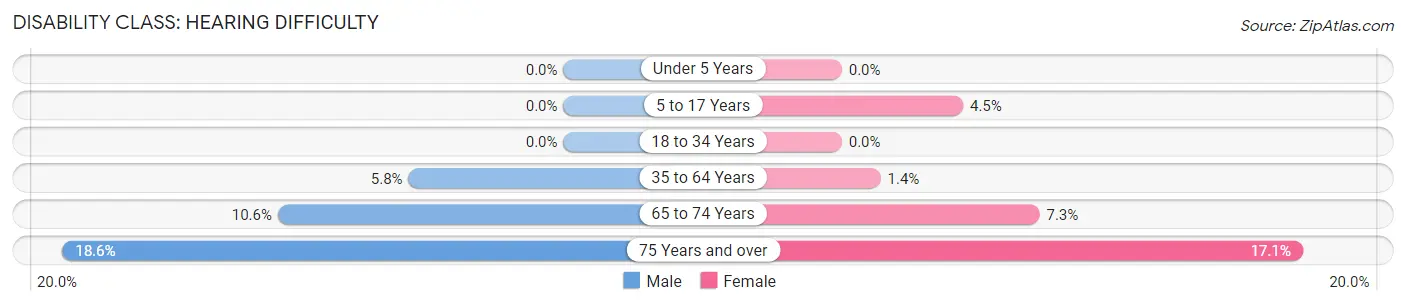
| Age Bracket | Male | Female |
| Under 5 Years | 0 (0.0%) | 0 (0.0%) |
| 5 to 17 Years | 0 (0.0%) | 48 (4.5%) |
| 18 to 34 Years | 0 (0.0%) | 0 (0.0%) |
| 35 to 64 Years | 203 (5.8%) | 52 (1.4%) |
| 65 to 74 Years | 163 (10.6%) | 121 (7.3%) |
| 75 Years and over | 160 (18.6%) | 175 (17.1%) |
Disability Class: Vision Difficulty
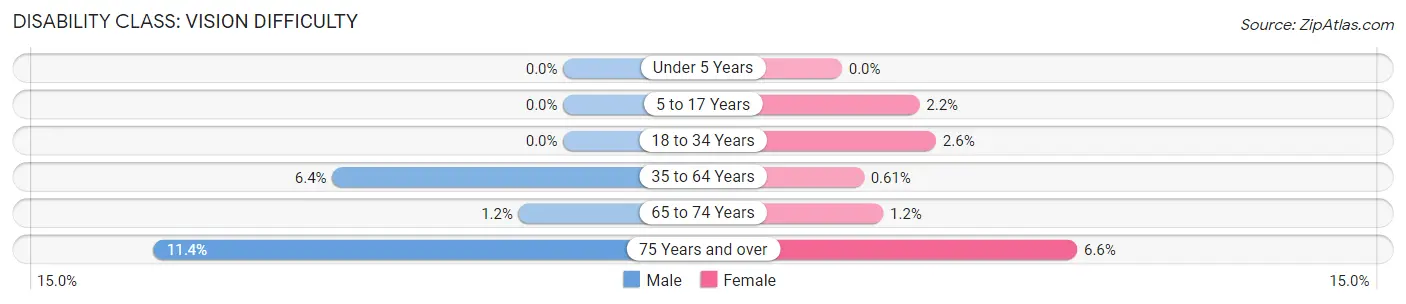
| Age Bracket | Male | Female |
| Under 5 Years | 0 (0.0%) | 0 (0.0%) |
| 5 to 17 Years | 0 (0.0%) | 23 (2.2%) |
| 18 to 34 Years | 0 (0.0%) | 44 (2.6%) |
| 35 to 64 Years | 227 (6.4%) | 22 (0.6%) |
| 65 to 74 Years | 19 (1.2%) | 19 (1.1%) |
| 75 Years and over | 98 (11.4%) | 67 (6.6%) |
Disability Class: Cognitive Difficulty
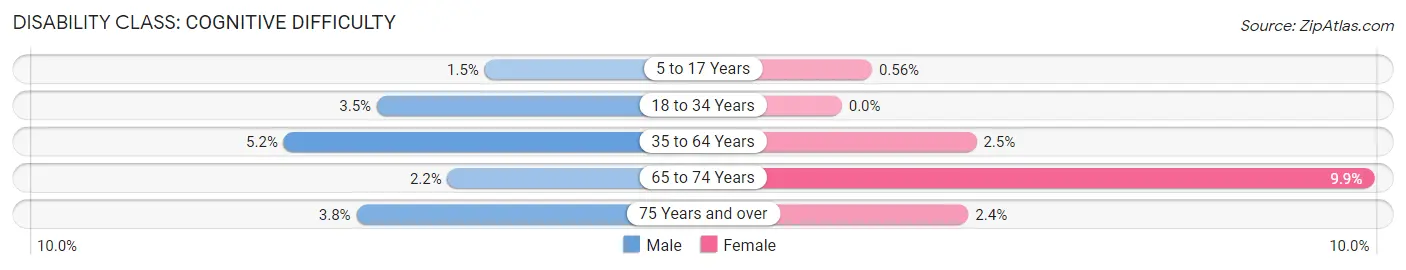
| Age Bracket | Male | Female |
| 5 to 17 Years | 16 (1.5%) | 6 (0.6%) |
| 18 to 34 Years | 47 (3.5%) | 0 (0.0%) |
| 35 to 64 Years | 183 (5.2%) | 90 (2.5%) |
| 65 to 74 Years | 33 (2.1%) | 163 (9.9%) |
| 75 Years and over | 33 (3.8%) | 24 (2.4%) |
Disability Class: Ambulatory Difficulty
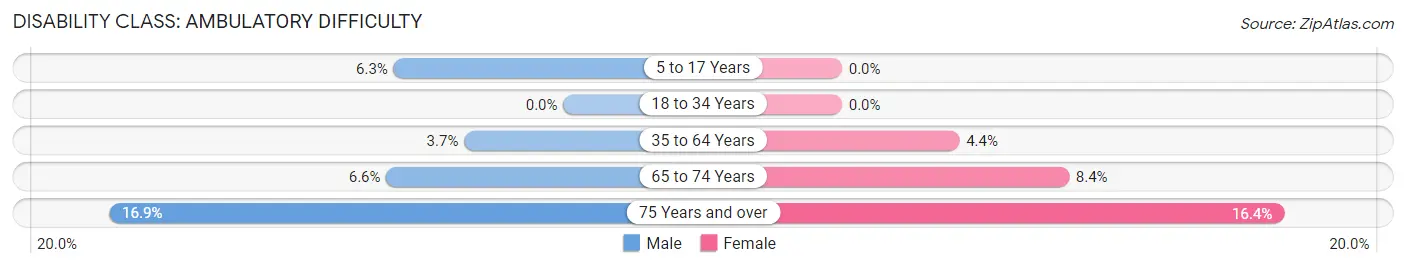
| Age Bracket | Male | Female |
| 5 to 17 Years | 69 (6.3%) | 0 (0.0%) |
| 18 to 34 Years | 0 (0.0%) | 0 (0.0%) |
| 35 to 64 Years | 130 (3.7%) | 157 (4.4%) |
| 65 to 74 Years | 101 (6.6%) | 139 (8.4%) |
| 75 Years and over | 145 (16.9%) | 168 (16.4%) |
Disability Class: Self-Care Difficulty
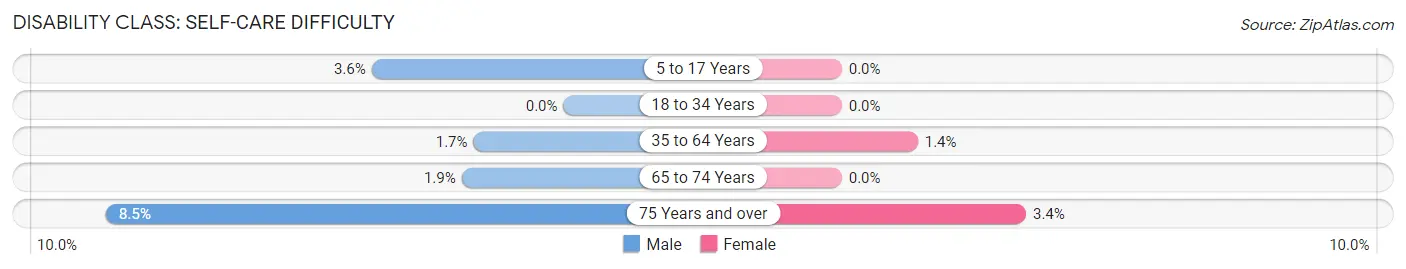
| Age Bracket | Male | Female |
| 5 to 17 Years | 39 (3.6%) | 0 (0.0%) |
| 18 to 34 Years | 0 (0.0%) | 0 (0.0%) |
| 35 to 64 Years | 59 (1.7%) | 51 (1.4%) |
| 65 to 74 Years | 29 (1.9%) | 0 (0.0%) |
| 75 Years and over | 73 (8.5%) | 35 (3.4%) |
Technology Access in Chaffee County
Computing Device Access in Chaffee County
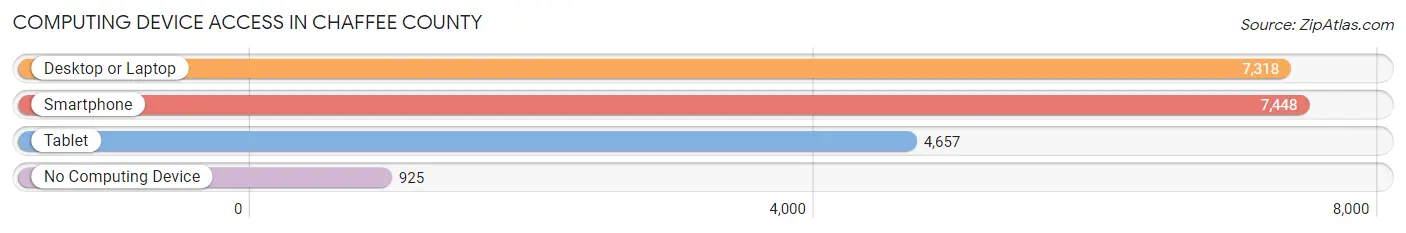
| Device Type | # Households | % Households |
| Desktop or Laptop | 7,318 | 80.7% |
| Smartphone | 7,448 | 82.2% |
| Tablet | 4,657 | 51.4% |
| No Computing Device | 925 | 10.2% |
| Total | 9,066 | 100.0% |
Internet Access in Chaffee County
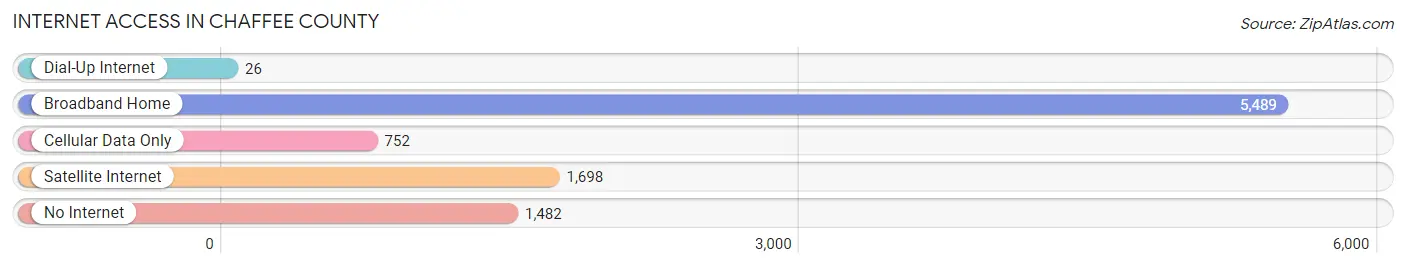
| Internet Type | # Households | % Households |
| Dial-Up Internet | 26 | 0.3% |
| Broadband Home | 5,489 | 60.5% |
| Cellular Data Only | 752 | 8.3% |
| Satellite Internet | 1,698 | 18.7% |
| No Internet | 1,482 | 16.4% |
| Total | 9,066 | 100.0% |
Chaffee County Summary
Chaffee County is located in the central part of Colorado, and is bordered by Lake, Park, Fremont, Saguache, and Gunnison counties. It is home to the Collegiate Peaks, which are part of the Sawatch Range of the Rocky Mountains. The county seat is Buena Vista, and the largest city is Salida. The county was named after Jerome B. Chaffee, a former Colorado senator.
Geography
Chaffee County covers an area of 1,015 square miles, making it the 11th largest county in Colorado. It is located in the central part of the state, and is bordered by Lake, Park, Fremont, Saguache, and Gunnison counties. The county is home to the Collegiate Peaks, which are part of the Sawatch Range of the Rocky Mountains. The highest point in the county is Mount Harvard, which has an elevation of 14,421 feet. The Arkansas River runs through the county, and is a popular destination for whitewater rafting and kayaking.
The county is divided into two distinct regions: the Arkansas Valley and the Sawatch Range. The Arkansas Valley is located in the eastern part of the county, and is characterized by rolling hills and wide open spaces. The Sawatch Range is located in the western part of the county, and is home to the Collegiate Peaks. The range is characterized by steep, rugged mountains and deep valleys.
Economy
The economy of Chaffee County is largely based on tourism and agriculture. The county is home to several ski resorts, including Monarch Mountain and Ski Cooper, which attract visitors from all over the world. The Arkansas River is also a popular destination for whitewater rafting and kayaking. Agriculture is also an important part of the county’s economy, with cattle ranching and hay production being the main agricultural activities.
Demographics
As of the 2010 census, the population of Chaffee County was 17,809. The population density was 17.6 people per square mile. The racial makeup of the county was 94.2% White, 0.7% Black or African American, 0.7% Native American, 0.5% Asian, 0.1% Pacific Islander, 2.2% from other races, and 1.6% from two or more races. Hispanic or Latino of any race were 6.3% of the population.
The median income for a household in the county was $41,945, and the median income for a family was $50,945. The per capita income for the county was $22,945. About 11.2% of families and 15.2% of the population were below the poverty line, including 19.2% of those under age 18 and 8.2% of those age 65 or over.
Conclusion
Chaffee County is located in the central part of Colorado, and is bordered by Lake, Park, Fremont, Saguache, and Gunnison counties. It is home to the Collegiate Peaks, which are part of the Sawatch Range of the Rocky Mountains. The county’s economy is largely based on tourism and agriculture, with cattle ranching and hay production being the main agricultural activities. As of the 2010 census, the population of Chaffee County was 17,809, with a median income for a household of $41,945.
Common Questions
What is the Total Population of Chaffee County?
Total Population of Chaffee County is 19,564.
What is the Total Male Population of Chaffee County?
Total Male Population of Chaffee County is 10,215.
What is the Total Female Population of Chaffee County?
Total Female Population of Chaffee County is 9,349.
What is the Ratio of Males per 100 Females in Chaffee County?
There are 109.26 Males per 100 Females in Chaffee County.
What is the Ratio of Females per 100 Males in Chaffee County?
There are 91.52 Females per 100 Males in Chaffee County.
What is the Median Population Age in Chaffee County?
Median Population Age in Chaffee County is 47.8 Years.
What is the Average Family Size in Chaffee County
Average Family Size in Chaffee County is 2.5 People.
What is the Average Household Size in Chaffee County
Average Household Size in Chaffee County is 2.0 People.
What is Per Capita Income in Chaffee County?
Per Capita income in Chaffee County is $38,167.
What is the Median Family Income in Chaffee County?
Median Family Income in Chaffee County is $83,786.
What is the Median Household income in Chaffee County?
Median Household Income in Chaffee County is $65,703.
What is Income or Wage Gap in Chaffee County?
Income or Wage Gap in Chaffee County is 29.6%.
Women in Chaffee County earn 70.4 cents for every dollar earned by a man.
What is Inequality or Gini Index in Chaffee County?
Inequality or Gini Index in Chaffee County is 0.44.
How Large is the Labor Force in Chaffee County?
There are 9,323 People in the Labor Forcein in Chaffee County.
What is the Percentage of People in the Labor Force in Chaffee County?
54.7% of People are in the Labor Force in Chaffee County.
What is the Unemployment Rate in Chaffee County?
Unemployment Rate in Chaffee County is 6.0%.