Broomfield County, CO
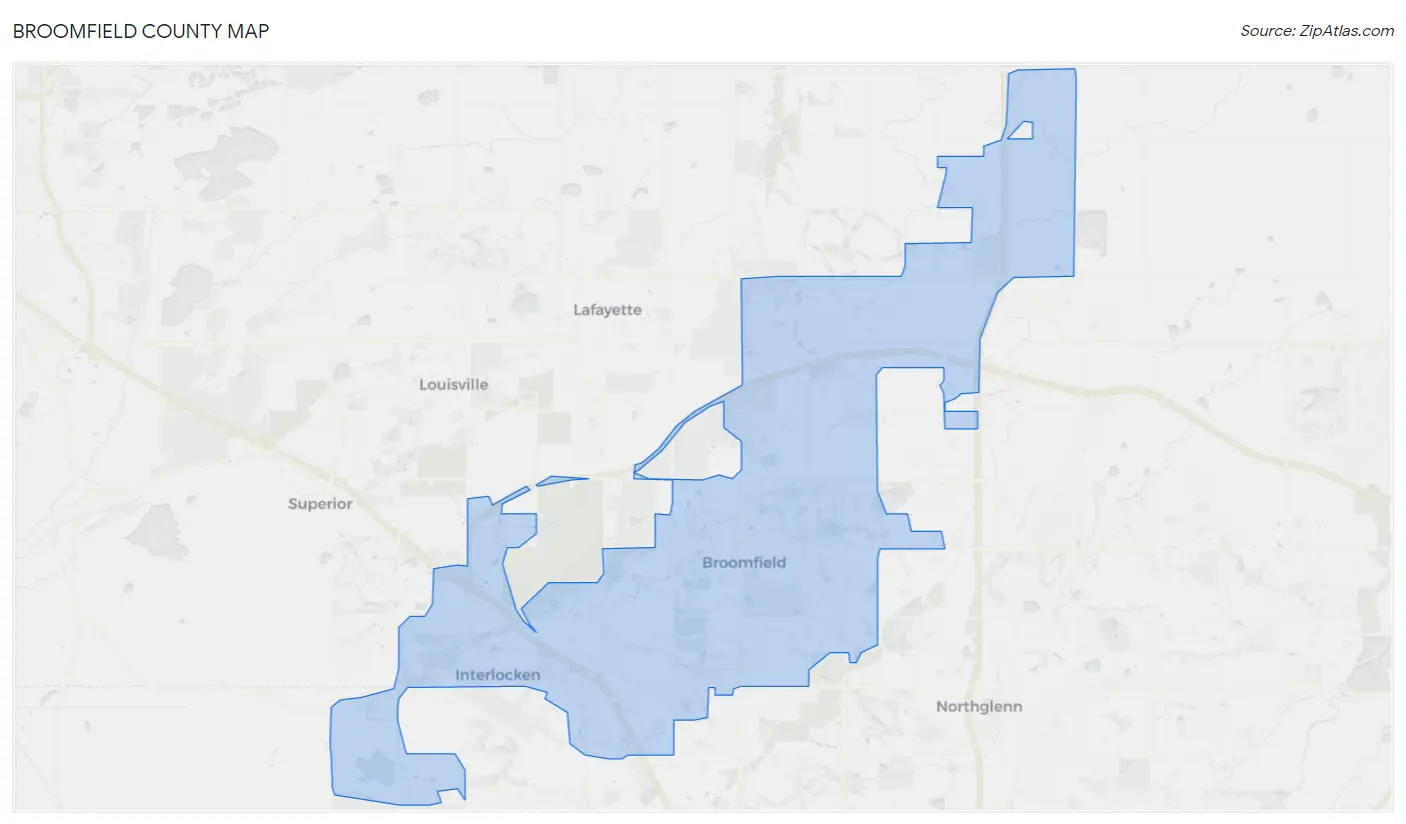
Broomfield County Map
Broomfield County Overview
73,946
TOTAL POPULATION
37,204
MALE POPULATION
36,742
FEMALE POPULATION
101.26
MALES / 100 FEMALES
98.76
FEMALES / 100 MALES
38.6
MEDIAN AGE
3.0
AVG FAMILY SIZE
2.4
AVG HOUSEHOLD SIZE
$60,862
PER CAPITA INCOME
$154,023
AVG FAMILY INCOME
$117,541
AVG HOUSEHOLD INCOME
34.1%
WAGE / INCOME GAP [ % ]
65.9¢/ $1
WAGE / INCOME GAP [ $ ]
$13,443
FAMILY INCOME DEFICIT
0.40
INEQUALITY / GINI INDEX
43,320
LABOR FORCE [ PEOPLE ]
71.9%
PERCENT IN LABOR FORCE
3.2%
UNEMPLOYMENT RATE
Broomfield County Area Codes
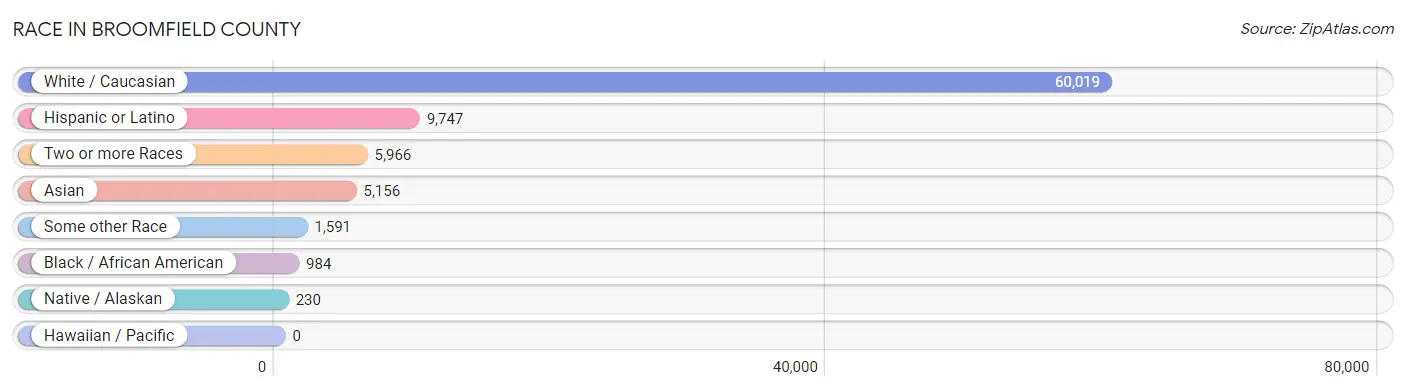
Race in Broomfield County
The most populous races in Broomfield County are White / Caucasian (60,019 | 81.2%), Hispanic or Latino (9,747 | 13.2%), and Two or more Races (5,966 | 8.1%).
| Race | # Population | % Population |
| Asian | 5,156 | 7.0% |
| Black / African American | 984 | 1.3% |
| Hawaiian / Pacific | 0 | 0.0% |
| Hispanic or Latino | 9,747 | 13.2% |
| Native / Alaskan | 230 | 0.3% |
| White / Caucasian | 60,019 | 81.2% |
| Two or more Races | 5,966 | 8.1% |
| Some other Race | 1,591 | 2.1% |
| Total | 73,946 | 100.0% |
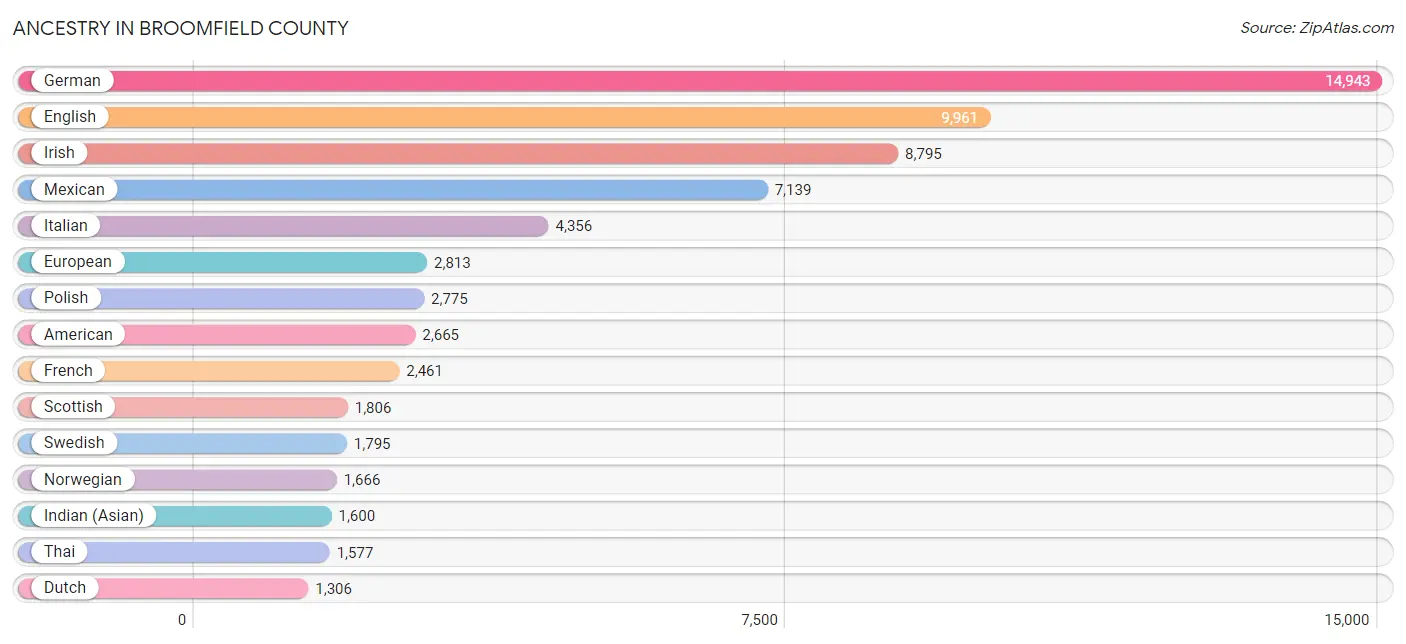
Ancestry in Broomfield County
The most populous ancestries reported in Broomfield County are German (14,943 | 20.2%), English (9,961 | 13.5%), Irish (8,795 | 11.9%), Mexican (7,139 | 9.7%), and Italian (4,356 | 5.9%), together accounting for 61.1% of all Broomfield County residents.
| Ancestry | # Population | % Population |
| African | 144 | 0.2% |
| Albanian | 22 | 0.0% |
| American | 2,665 | 3.6% |
| Apache | 34 | 0.1% |
| Arab | 569 | 0.8% |
| Argentinean | 141 | 0.2% |
| Armenian | 26 | 0.0% |
| Assyrian / Chaldean / Syriac | 34 | 0.1% |
| Australian | 60 | 0.1% |
| Austrian | 216 | 0.3% |
| Bangladeshi | 115 | 0.2% |
| Basque | 8 | 0.0% |
| Belgian | 81 | 0.1% |
| Bhutanese | 365 | 0.5% |
| Blackfeet | 71 | 0.1% |
| Brazilian | 21 | 0.0% |
| British | 1,082 | 1.5% |
| Bulgarian | 42 | 0.1% |
| Burmese | 427 | 0.6% |
| Cajun | 2 | 0.0% |
| Cambodian | 25 | 0.0% |
| Canadian | 173 | 0.2% |
| Celtic | 18 | 0.0% |
| Central American | 228 | 0.3% |
| Central American Indian | 47 | 0.1% |
| Cherokee | 116 | 0.2% |
| Cheyenne | 3 | 0.0% |
| Chilean | 74 | 0.1% |
| Choctaw | 12 | 0.0% |
| Colombian | 46 | 0.1% |
| Costa Rican | 94 | 0.1% |
| Creek | 14 | 0.0% |
| Croatian | 178 | 0.2% |
| Cuban | 261 | 0.4% |
| Czech | 503 | 0.7% |
| Czechoslovakian | 72 | 0.1% |
| Danish | 810 | 1.1% |
| Dominican | 67 | 0.1% |
| Dutch | 1,306 | 1.8% |
| Eastern European | 382 | 0.5% |
| Ecuadorian | 31 | 0.0% |
| Egyptian | 80 | 0.1% |
| English | 9,961 | 13.5% |
| Ethiopian | 1 | 0.0% |
| European | 2,813 | 3.8% |
| Filipino | 2 | 0.0% |
| Finnish | 303 | 0.4% |
| French | 2,461 | 3.3% |
| French Canadian | 589 | 0.8% |
| German | 14,943 | 20.2% |
| Greek | 366 | 0.5% |
| Guamanian / Chamorro | 6 | 0.0% |
| Guatemalan | 52 | 0.1% |
| Honduran | 7 | 0.0% |
| Hungarian | 363 | 0.5% |
| Icelander | 7 | 0.0% |
| Indian (Asian) | 1,600 | 2.2% |
| Iranian | 124 | 0.2% |
| Iraqi | 69 | 0.1% |
| Irish | 8,795 | 11.9% |
| Iroquois | 55 | 0.1% |
| Israeli | 109 | 0.2% |
| Italian | 4,356 | 5.9% |
| Jamaican | 43 | 0.1% |
| Japanese | 69 | 0.1% |
| Jordanian | 21 | 0.0% |
| Korean | 882 | 1.2% |
| Latvian | 9 | 0.0% |
| Lebanese | 176 | 0.2% |
| Lithuanian | 373 | 0.5% |
| Luxembourger | 13 | 0.0% |
| Malaysian | 54 | 0.1% |
| Menominee | 5 | 0.0% |
| Mexican | 7,139 | 9.7% |
| Mexican American Indian | 29 | 0.0% |
| Mongolian | 51 | 0.1% |
| Moroccan | 15 | 0.0% |
| Native Hawaiian | 42 | 0.1% |
| Navajo | 152 | 0.2% |
| New Zealander | 87 | 0.1% |
| Nicaraguan | 7 | 0.0% |
| Northern European | 266 | 0.4% |
| Norwegian | 1,666 | 2.2% |
| Pakistani | 87 | 0.1% |
| Palestinian | 61 | 0.1% |
| Pennsylvania German | 9 | 0.0% |
| Peruvian | 69 | 0.1% |
| Polish | 2,775 | 3.7% |
| Portuguese | 168 | 0.2% |
| Potawatomi | 29 | 0.0% |
| Pueblo | 11 | 0.0% |
| Puerto Rican | 395 | 0.5% |
| Romanian | 83 | 0.1% |
| Russian | 727 | 1.0% |
| Salvadoran | 68 | 0.1% |
| Scandinavian | 665 | 0.9% |
| Scotch-Irish | 728 | 1.0% |
| Scottish | 1,806 | 2.4% |
| Serbian | 22 | 0.0% |
| Sioux | 203 | 0.3% |
| Slavic | 24 | 0.0% |
| Slovak | 142 | 0.2% |
| Slovene | 87 | 0.1% |
| South African | 8 | 0.0% |
| South American | 365 | 0.5% |
| South American Indian | 7 | 0.0% |
| Spaniard | 399 | 0.5% |
| Spanish | 452 | 0.6% |
| Spanish American | 87 | 0.1% |
| Sri Lankan | 947 | 1.3% |
| Subsaharan African | 193 | 0.3% |
| Sudanese | 40 | 0.1% |
| Swedish | 1,795 | 2.4% |
| Swiss | 397 | 0.5% |
| Syrian | 59 | 0.1% |
| Thai | 1,577 | 2.1% |
| Trinidadian and Tobagonian | 10 | 0.0% |
| Turkish | 49 | 0.1% |
| Ukrainian | 200 | 0.3% |
| Ute | 21 | 0.0% |
| Venezuelan | 4 | 0.0% |
| Vietnamese | 5 | 0.0% |
| Welsh | 517 | 0.7% |
| Yugoslavian | 53 | 0.1% | View All 124 Rows |
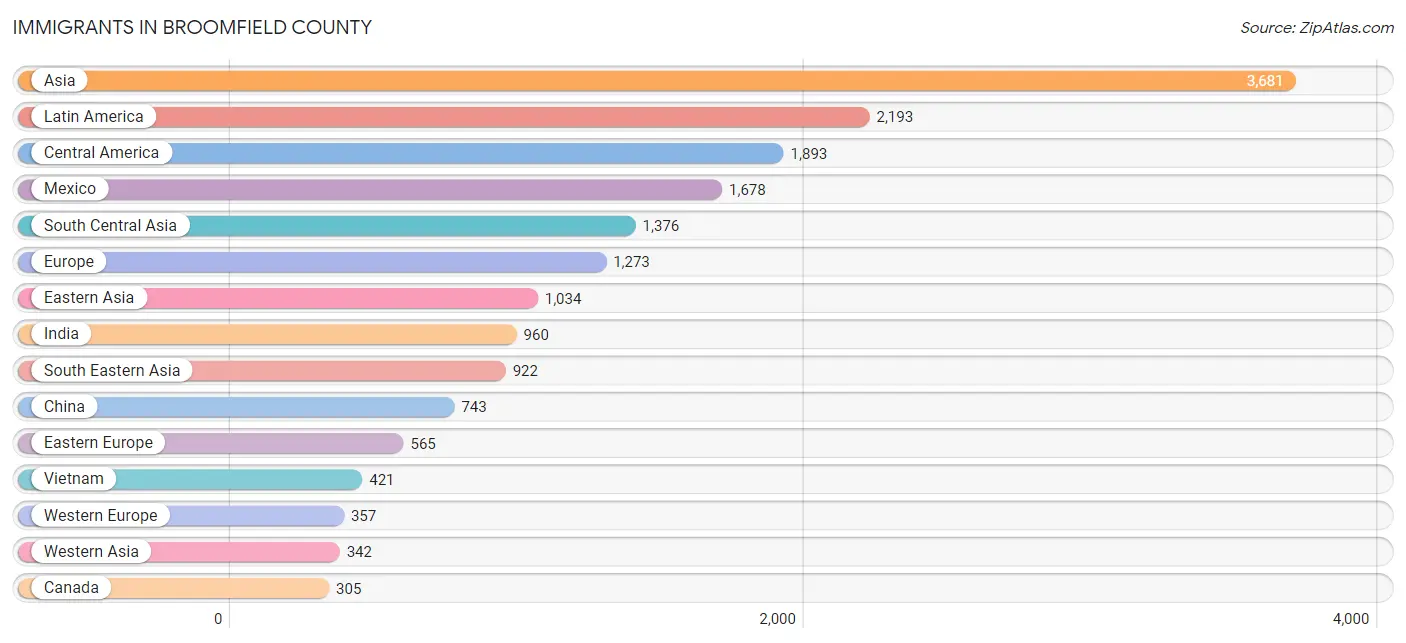
Immigrants in Broomfield County
The most numerous immigrant groups reported in Broomfield County came from Asia (3,681 | 5.0%), Latin America (2,193 | 3.0%), Central America (1,893 | 2.6%), Mexico (1,678 | 2.3%), and South Central Asia (1,376 | 1.9%), together accounting for 14.6% of all Broomfield County residents.
| Immigration Origin | # Population | % Population |
| Africa | 255 | 0.3% |
| Argentina | 71 | 0.1% |
| Asia | 3,681 | 5.0% |
| Australia | 113 | 0.2% |
| Austria | 26 | 0.0% |
| Bangladesh | 5 | 0.0% |
| Belarus | 29 | 0.0% |
| Bosnia and Herzegovina | 90 | 0.1% |
| Brazil | 38 | 0.1% |
| Bulgaria | 36 | 0.1% |
| Cambodia | 46 | 0.1% |
| Canada | 305 | 0.4% |
| Caribbean | 109 | 0.2% |
| Central America | 1,893 | 2.6% |
| Chile | 60 | 0.1% |
| China | 743 | 1.0% |
| Costa Rica | 64 | 0.1% |
| Croatia | 27 | 0.0% |
| Cuba | 82 | 0.1% |
| Czechoslovakia | 26 | 0.0% |
| Denmark | 32 | 0.0% |
| Eastern Africa | 111 | 0.2% |
| Eastern Asia | 1,034 | 1.4% |
| Eastern Europe | 565 | 0.8% |
| Ecuador | 6 | 0.0% |
| Egypt | 100 | 0.1% |
| El Salvador | 7 | 0.0% |
| England | 60 | 0.1% |
| Ethiopia | 1 | 0.0% |
| Europe | 1,273 | 1.7% |
| France | 51 | 0.1% |
| Germany | 274 | 0.4% |
| Guatemala | 127 | 0.2% |
| Hong Kong | 24 | 0.0% |
| Hungary | 28 | 0.0% |
| India | 960 | 1.3% |
| Indonesia | 6 | 0.0% |
| Iran | 133 | 0.2% |
| Iraq | 96 | 0.1% |
| Ireland | 15 | 0.0% |
| Italy | 78 | 0.1% |
| Jamaica | 27 | 0.0% |
| Japan | 60 | 0.1% |
| Jordan | 78 | 0.1% |
| Kenya | 31 | 0.0% |
| Korea | 207 | 0.3% |
| Kuwait | 5 | 0.0% |
| Laos | 48 | 0.1% |
| Latin America | 2,193 | 3.0% |
| Lebanon | 18 | 0.0% |
| Lithuania | 9 | 0.0% |
| Malaysia | 23 | 0.0% |
| Mexico | 1,678 | 2.3% |
| Morocco | 8 | 0.0% |
| Nepal | 200 | 0.3% |
| Northern Africa | 118 | 0.2% |
| Northern Europe | 232 | 0.3% |
| Oceania | 175 | 0.2% |
| Pakistan | 67 | 0.1% |
| Panama | 17 | 0.0% |
| Peru | 12 | 0.0% |
| Philippines | 299 | 0.4% |
| Poland | 192 | 0.3% |
| Romania | 10 | 0.0% |
| Russia | 101 | 0.1% |
| Saudi Arabia | 15 | 0.0% |
| Scotland | 30 | 0.0% |
| Singapore | 16 | 0.0% |
| South Africa | 19 | 0.0% |
| South America | 191 | 0.3% |
| South Central Asia | 1,376 | 1.9% |
| South Eastern Asia | 922 | 1.3% |
| Southern Europe | 109 | 0.2% |
| Spain | 31 | 0.0% |
| Sri Lanka | 11 | 0.0% |
| Sweden | 37 | 0.1% |
| Switzerland | 6 | 0.0% |
| Syria | 62 | 0.1% |
| Taiwan | 44 | 0.1% |
| Thailand | 63 | 0.1% |
| Turkey | 59 | 0.1% |
| Uganda | 15 | 0.0% |
| Ukraine | 17 | 0.0% |
| Venezuela | 4 | 0.0% |
| Vietnam | 421 | 0.6% |
| Western Asia | 342 | 0.5% |
| Western Europe | 357 | 0.5% |
| Zimbabwe | 11 | 0.0% | View All 88 Rows |
Sex and Age in Broomfield County
Sex and Age in Broomfield County
The most populous age groups in Broomfield County are 30 to 34 Years (3,111 | 8.4%) for men and 40 to 44 Years (2,890 | 7.9%) for women.
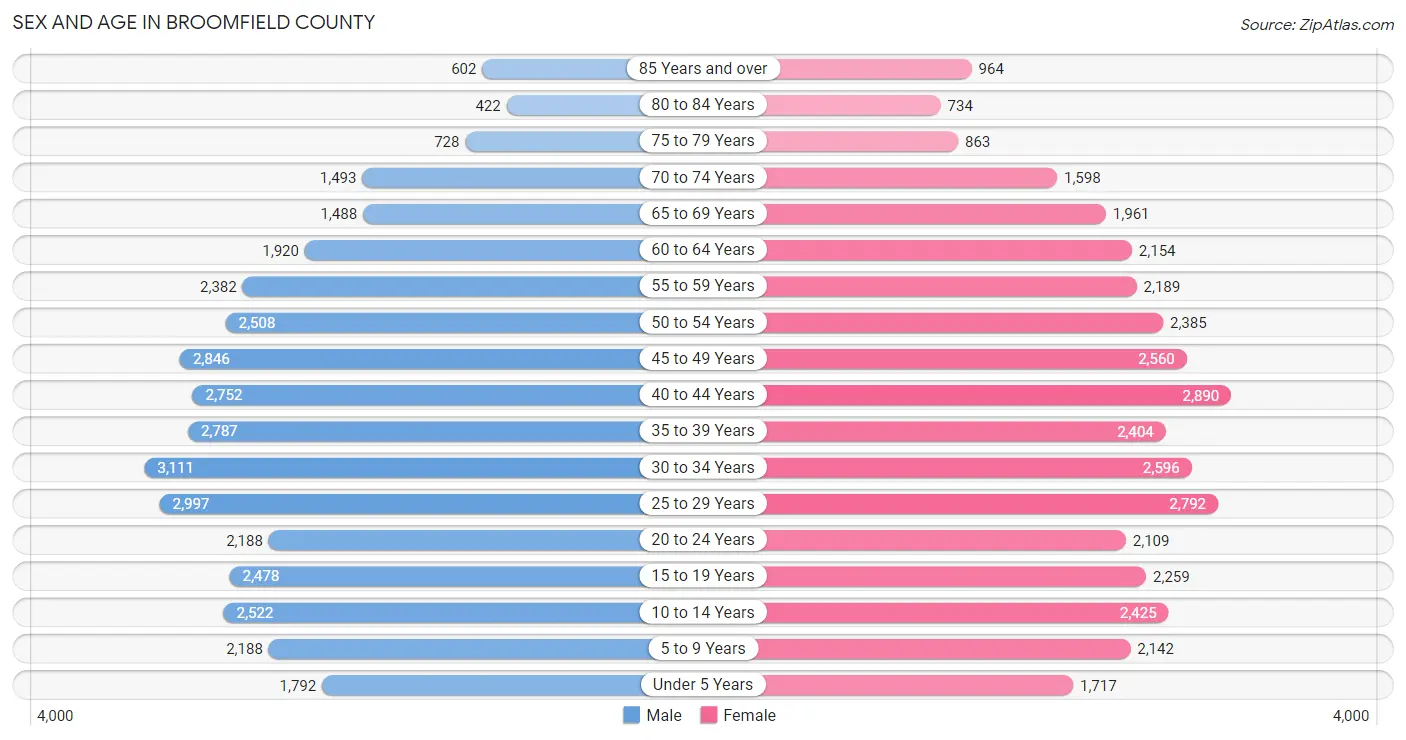
| Age Bracket | Male | Female |
| Under 5 Years | 1,792 (4.8%) | 1,717 (4.7%) |
| 5 to 9 Years | 2,188 (5.9%) | 2,142 (5.8%) |
| 10 to 14 Years | 2,522 (6.8%) | 2,425 (6.6%) |
| 15 to 19 Years | 2,478 (6.7%) | 2,259 (6.1%) |
| 20 to 24 Years | 2,188 (5.9%) | 2,109 (5.7%) |
| 25 to 29 Years | 2,997 (8.1%) | 2,792 (7.6%) |
| 30 to 34 Years | 3,111 (8.4%) | 2,596 (7.1%) |
| 35 to 39 Years | 2,787 (7.5%) | 2,404 (6.5%) |
| 40 to 44 Years | 2,752 (7.4%) | 2,890 (7.9%) |
| 45 to 49 Years | 2,846 (7.6%) | 2,560 (7.0%) |
| 50 to 54 Years | 2,508 (6.7%) | 2,385 (6.5%) |
| 55 to 59 Years | 2,382 (6.4%) | 2,189 (6.0%) |
| 60 to 64 Years | 1,920 (5.2%) | 2,154 (5.9%) |
| 65 to 69 Years | 1,488 (4.0%) | 1,961 (5.3%) |
| 70 to 74 Years | 1,493 (4.0%) | 1,598 (4.3%) |
| 75 to 79 Years | 728 (2.0%) | 863 (2.4%) |
| 80 to 84 Years | 422 (1.1%) | 734 (2.0%) |
| 85 Years and over | 602 (1.6%) | 964 (2.6%) |
| Total | 37,204 (100.0%) | 36,742 (100.0%) |
Families and Households in Broomfield County
Median Family Size in Broomfield County
The median family size in Broomfield County is 3.02 persons per family, with married-couple families (15,955 | 84.2%) accounting for the largest median family size of 3.08 persons per family. On the other hand, single male/father families (986 | 5.2%) represent the smallest median family size with 2.62 persons per family.
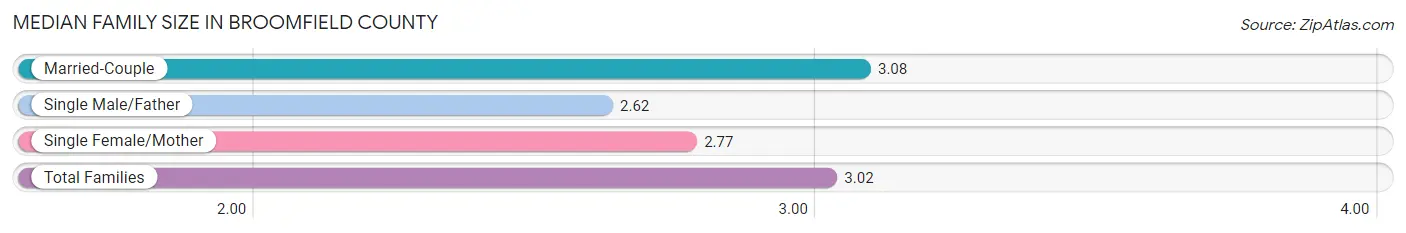
| Family Type | # Families | Family Size |
| Married-Couple | 15,955 (84.2%) | 3.08 |
| Single Male/Father | 986 (5.2%) | 2.62 |
| Single Female/Mother | 2,012 (10.6%) | 2.77 |
| Total Families | 18,953 (100.0%) | 3.02 |
Median Household Size in Broomfield County
The median household size in Broomfield County is 2.44 persons per household, with married-couple households (15,955 | 53.0%) accounting for the largest median household size of 3.12 persons per household. non-family households (11,150 | 37.0%) represent the smallest median household size with 1.32 persons per household.
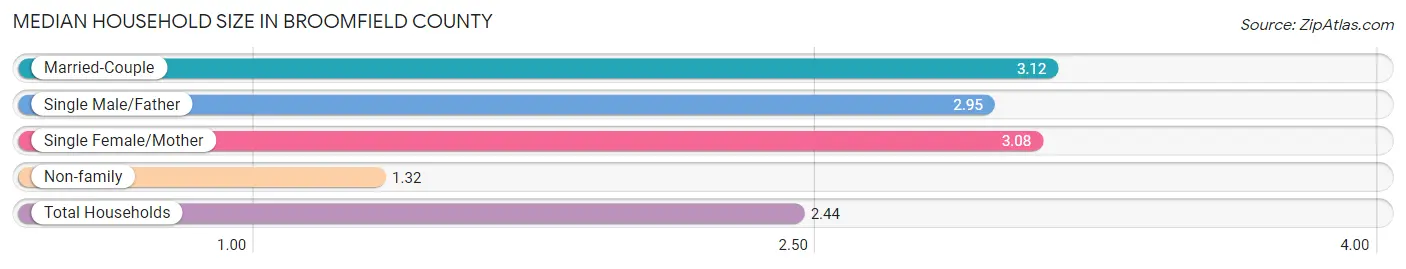
| Household Type | # Households | Household Size |
| Married-Couple | 15,955 (53.0%) | 3.12 |
| Single Male/Father | 986 (3.3%) | 2.95 |
| Single Female/Mother | 2,012 (6.7%) | 3.08 |
| Non-family | 11,150 (37.0%) | 1.32 |
| Total Households | 30,103 (100.0%) | 2.44 |
Household Size by Marriage Status in Broomfield County
Out of a total of 30,103 households in Broomfield County, 18,953 (63.0%) are family households, while 11,150 (37.0%) are nonfamily households. The most numerous type of family households are 2-person households, comprising 8,406, and the most common type of nonfamily households are 1-person households, comprising 8,181.
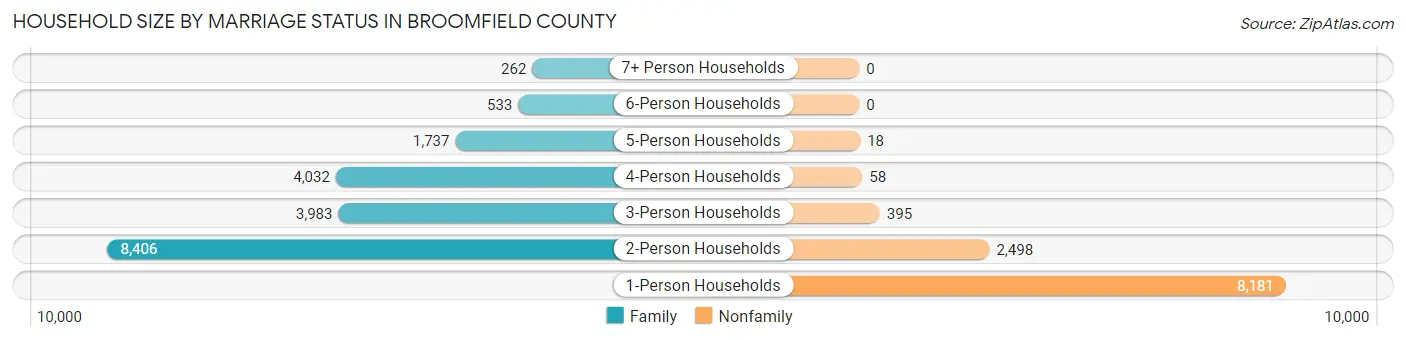
| Household Size | Family Households | Nonfamily Households |
| 1-Person Households | - | 8,181 (27.2%) |
| 2-Person Households | 8,406 (27.9%) | 2,498 (8.3%) |
| 3-Person Households | 3,983 (13.2%) | 395 (1.3%) |
| 4-Person Households | 4,032 (13.4%) | 58 (0.2%) |
| 5-Person Households | 1,737 (5.8%) | 18 (0.1%) |
| 6-Person Households | 533 (1.8%) | 0 (0.0%) |
| 7+ Person Households | 262 (0.9%) | 0 (0.0%) |
| Total | 18,953 (63.0%) | 11,150 (37.0%) |
Female Fertility in Broomfield County
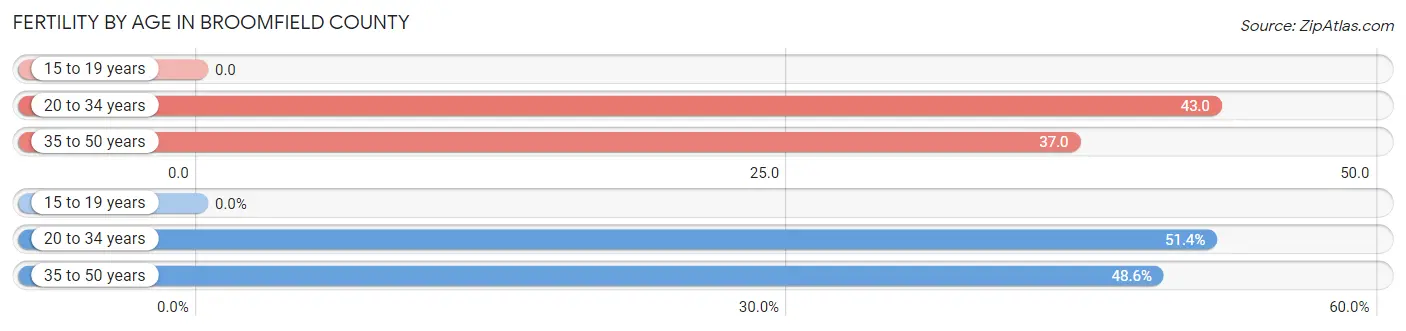
Fertility by Age in Broomfield County
Average fertility rate in Broomfield County is 35.0 births per 1,000 women. Women in the age bracket of 20 to 34 years have the highest fertility rate with 43.0 births per 1,000 women. Women in the age bracket of 20 to 34 years acount for 51.4% of all women with births.
| Age Bracket | Women with Births | Births / 1,000 Women |
| 15 to 19 years | 0 (0.0%) | 0.0 |
| 20 to 34 years | 321 (51.4%) | 43.0 |
| 35 to 50 years | 304 (48.6%) | 37.0 |
| Total | 625 (100.0%) | 35.0 |
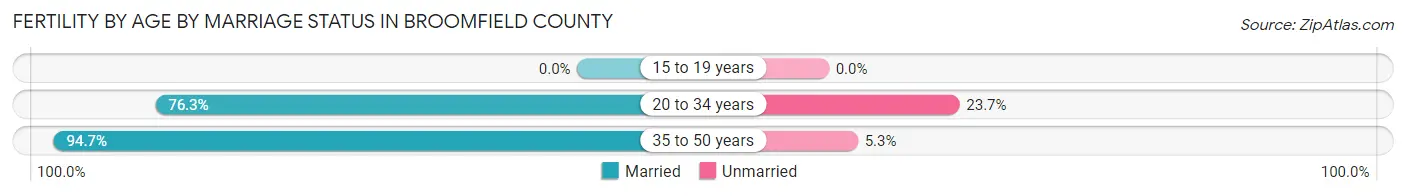
Fertility by Age by Marriage Status in Broomfield County
85.3% of women with births (625) in Broomfield County are married. The highest percentage of unmarried women with births falls into 20 to 34 years age bracket with 23.7% of them unmarried at the time of birth, while the lowest percentage of unmarried women with births belong to 35 to 50 years age bracket with 5.3% of them unmarried.
| Age Bracket | Married | Unmarried |
| 15 to 19 years | 0 (0.0%) | 0 (0.0%) |
| 20 to 34 years | 245 (76.3%) | 76 (23.7%) |
| 35 to 50 years | 288 (94.7%) | 16 (5.3%) |
| Total | 533 (85.3%) | 92 (14.7%) |
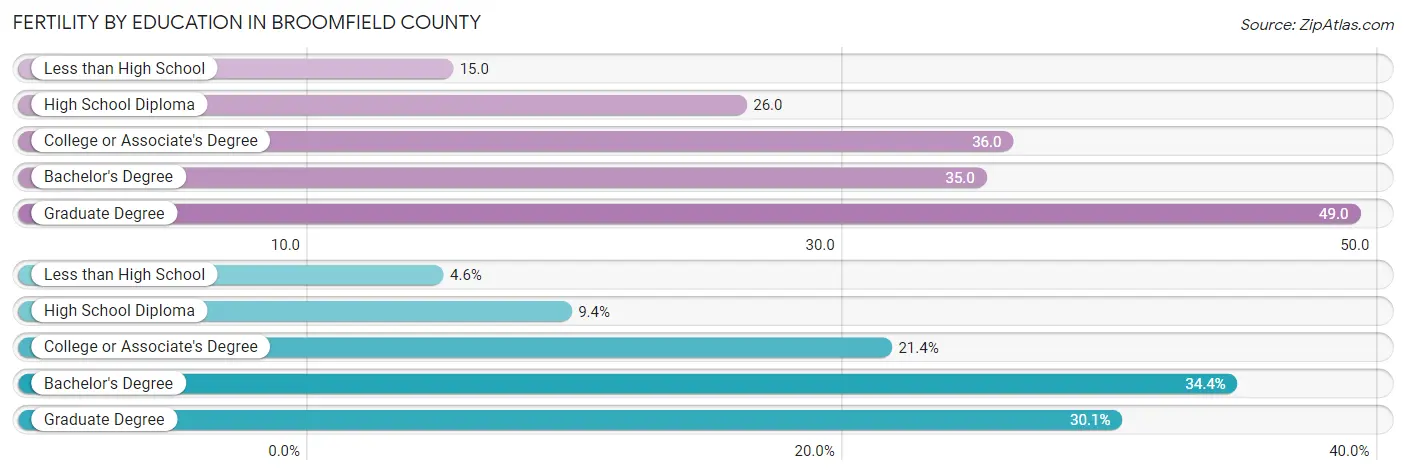
Fertility by Education in Broomfield County
Average fertility rate in Broomfield County is 35.0 births per 1,000 women. Women with the education attainment of graduate degree have the highest fertility rate of 49.0 births per 1,000 women, while women with the education attainment of less than high school have the lowest fertility at 15.0 births per 1,000 women. Women with the education attainment of bachelor's degree represent 34.4% of all women with births.
| Educational Attainment | Women with Births | Births / 1,000 Women |
| Less than High School | 29 (4.6%) | 15.0 |
| High School Diploma | 59 (9.4%) | 26.0 |
| College or Associate's Degree | 134 (21.4%) | 36.0 |
| Bachelor's Degree | 215 (34.4%) | 35.0 |
| Graduate Degree | 188 (30.1%) | 49.0 |
| Total | 625 (100.0%) | 35.0 |
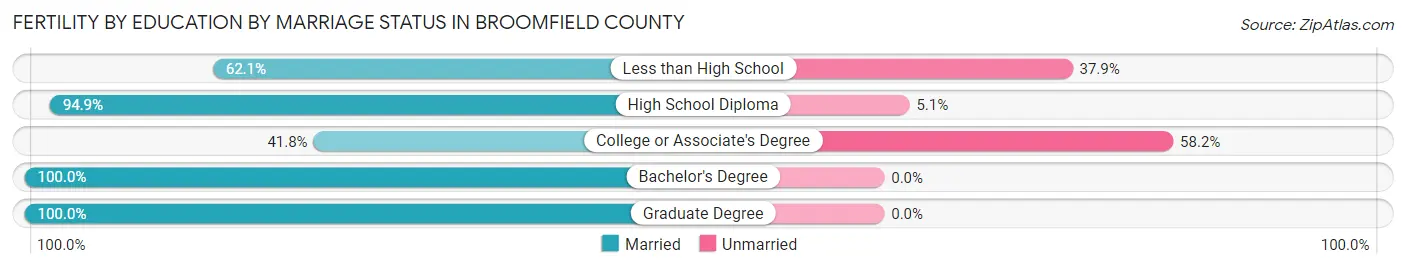
Fertility by Education by Marriage Status in Broomfield County
14.7% of women with births in Broomfield County are unmarried. Women with the educational attainment of bachelor's degree are most likely to be married with 100.0% of them married at childbirth, while women with the educational attainment of college or associate's degree are least likely to be married with 58.2% of them unmarried at childbirth.
| Educational Attainment | Married | Unmarried |
| Less than High School | 18 (62.1%) | 11 (37.9%) |
| High School Diploma | 56 (94.9%) | 3 (5.1%) |
| College or Associate's Degree | 56 (41.8%) | 78 (58.2%) |
| Bachelor's Degree | 215 (100.0%) | 0 (0.0%) |
| Graduate Degree | 188 (100.0%) | 0 (0.0%) |
| Total | 533 (85.3%) | 92 (14.7%) |
Income in Broomfield County
Income Overview in Broomfield County
Per Capita Income in Broomfield County is $60,862, while median incomes of families and households are $154,023 and $117,541 respectively.
| Characteristic | Number | Measure |
| Per Capita Income | 73,946 | $60,862 |
| Median Family Income | 18,953 | $154,023 |
| Mean Family Income | 18,953 | $177,831 |
| Median Household Income | 30,103 | $117,541 |
| Mean Household Income | 30,103 | $148,374 |
| Income Deficit | 18,953 | $13,443 |
| Wage / Income Gap (%) | 73,946 | 34.06% |
| Wage / Income Gap ($) | 73,946 | 65.94¢ per $1 |
| Gini / Inequality Index | 73,946 | 0.40 |
Earnings by Sex in Broomfield County
Average Earnings in Broomfield County are $60,743, $74,291 for men and $48,990 for women, a difference of 34.1%.
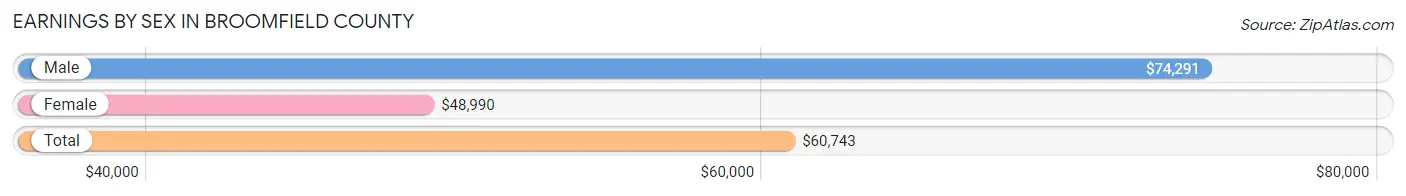
| Sex | Number | Average Earnings |
| Male | 24,358 (53.8%) | $74,291 |
| Female | 20,900 (46.2%) | $48,990 |
| Total | 45,258 (100.0%) | $60,743 |
Earnings by Sex by Income Bracket in Broomfield County
The most common earnings brackets in Broomfield County are $100,000+ for men (9,050 | 37.1%) and $100,000+ for women (3,731 | 17.8%).
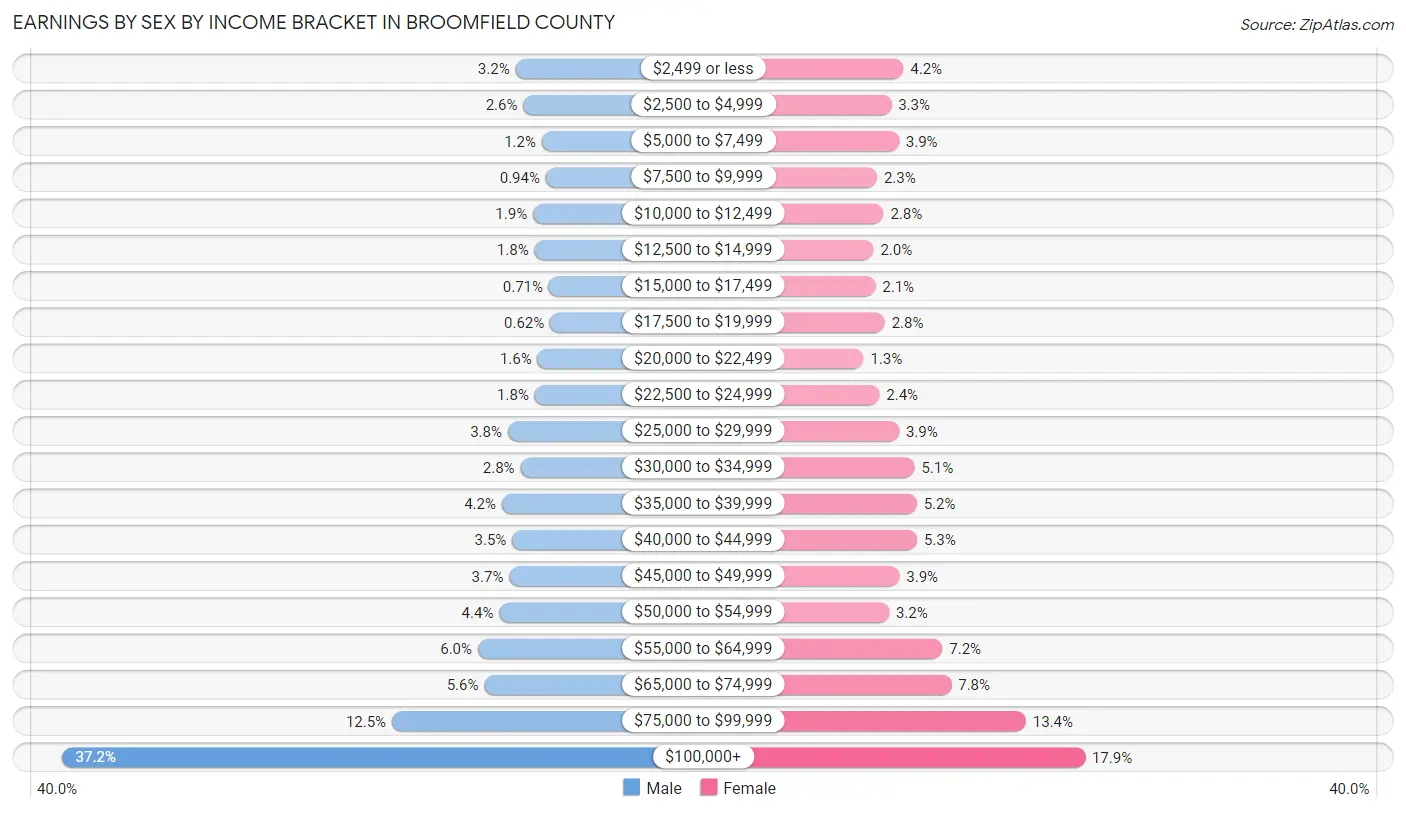
| Income | Male | Female |
| $2,499 or less | 782 (3.2%) | 887 (4.2%) |
| $2,500 to $4,999 | 640 (2.6%) | 695 (3.3%) |
| $5,000 to $7,499 | 301 (1.2%) | 816 (3.9%) |
| $7,500 to $9,999 | 230 (0.9%) | 472 (2.3%) |
| $10,000 to $12,499 | 462 (1.9%) | 574 (2.8%) |
| $12,500 to $14,999 | 435 (1.8%) | 417 (2.0%) |
| $15,000 to $17,499 | 172 (0.7%) | 448 (2.1%) |
| $17,500 to $19,999 | 151 (0.6%) | 593 (2.8%) |
| $20,000 to $22,499 | 381 (1.6%) | 262 (1.3%) |
| $22,500 to $24,999 | 431 (1.8%) | 511 (2.4%) |
| $25,000 to $29,999 | 924 (3.8%) | 818 (3.9%) |
| $30,000 to $34,999 | 691 (2.8%) | 1,059 (5.1%) |
| $35,000 to $39,999 | 1,032 (4.2%) | 1,095 (5.2%) |
| $40,000 to $44,999 | 842 (3.5%) | 1,099 (5.3%) |
| $45,000 to $49,999 | 897 (3.7%) | 824 (3.9%) |
| $50,000 to $54,999 | 1,080 (4.4%) | 661 (3.2%) |
| $55,000 to $64,999 | 1,468 (6.0%) | 1,496 (7.2%) |
| $65,000 to $74,999 | 1,351 (5.6%) | 1,637 (7.8%) |
| $75,000 to $99,999 | 3,038 (12.5%) | 2,805 (13.4%) |
| $100,000+ | 9,050 (37.1%) | 3,731 (17.8%) |
| Total | 24,358 (100.0%) | 20,900 (100.0%) |
Earnings by Sex by Educational Attainment in Broomfield County
Average earnings in Broomfield County are $86,368 for men and $57,809 for women, a difference of 33.1%. Men with an educational attainment of graduate degree enjoy the highest average annual earnings of $125,982, while those with less than high school education earn the least with $47,250. Women with an educational attainment of graduate degree earn the most with the average annual earnings of $78,113, while those with less than high school education have the smallest earnings of $28,750.
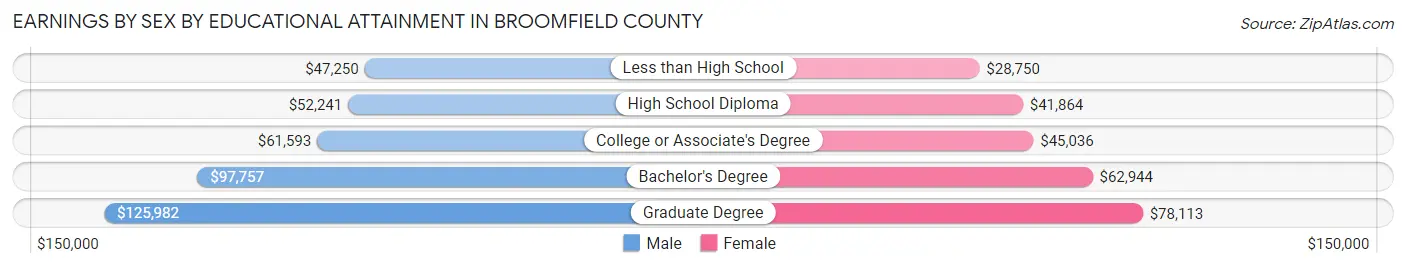
| Educational Attainment | Male Income | Female Income |
| Less than High School | $47,250 | $28,750 |
| High School Diploma | $52,241 | $41,864 |
| College or Associate's Degree | $61,593 | $45,036 |
| Bachelor's Degree | $97,757 | $62,944 |
| Graduate Degree | $125,982 | $78,113 |
| Total | $86,368 | $57,809 |
Family Income in Broomfield County
Family Income Brackets in Broomfield County
According to the Broomfield County family income data, there are 5,838 families falling into the $200,000+ income range, which is the most common income bracket and makes up 30.8% of all families. Conversely, the $10,000 to $14,999 income bracket is the least frequent group with only 76 families (0.4%) belonging to this category.
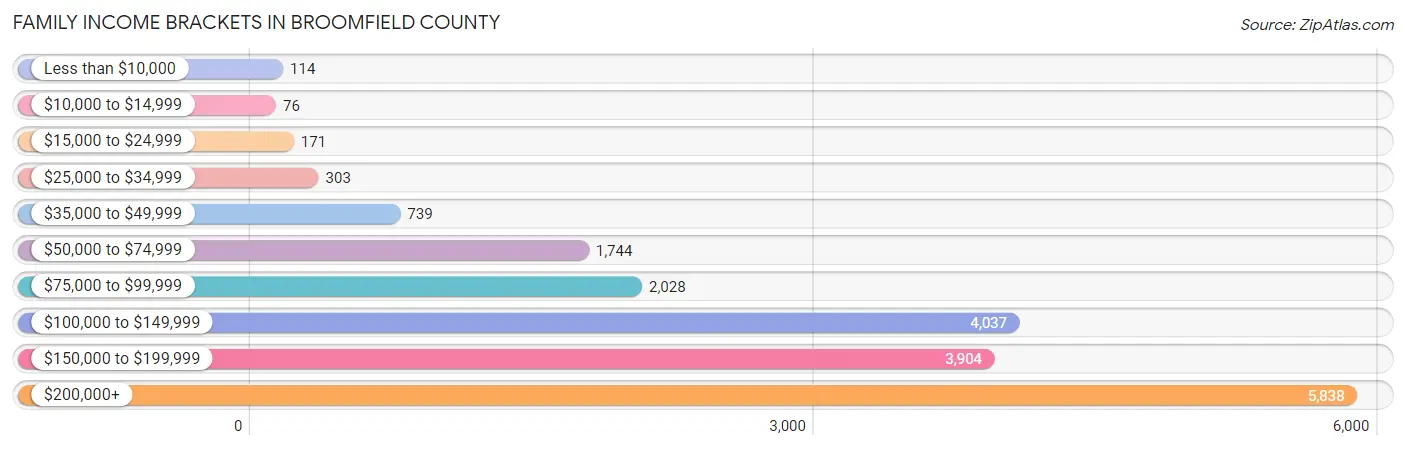
| Income Bracket | # Families | % Families |
| Less than $10,000 | 114 | 0.6% |
| $10,000 to $14,999 | 76 | 0.4% |
| $15,000 to $24,999 | 171 | 0.9% |
| $25,000 to $34,999 | 303 | 1.6% |
| $35,000 to $49,999 | 739 | 3.9% |
| $50,000 to $74,999 | 1,744 | 9.2% |
| $75,000 to $99,999 | 2,028 | 10.7% |
| $100,000 to $149,999 | 4,037 | 21.3% |
| $150,000 to $199,999 | 3,904 | 20.6% |
| $200,000+ | 5,838 | 30.8% |
Family Income by Famaliy Size in Broomfield County
5-person families (1,624 | 8.6%) account for the highest median family income in Broomfield County with $191,618 per family, while 2-person families (8,934 | 47.1%) have the highest median income of $62,998 per family member.
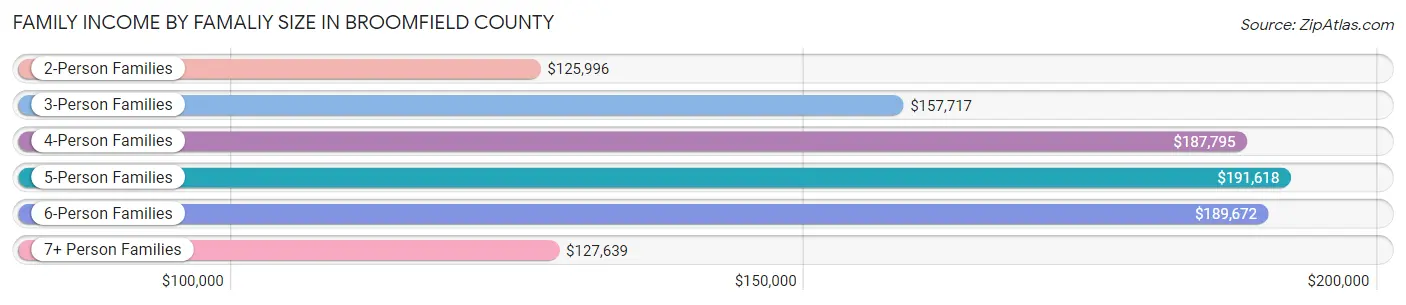
| Income Bracket | # Families | Median Income |
| 2-Person Families | 8,934 (47.1%) | $125,996 |
| 3-Person Families | 3,842 (20.3%) | $157,717 |
| 4-Person Families | 3,933 (20.7%) | $187,795 |
| 5-Person Families | 1,624 (8.6%) | $191,618 |
| 6-Person Families | 414 (2.2%) | $189,672 |
| 7+ Person Families | 206 (1.1%) | $127,639 |
| Total | 18,953 (100.0%) | $154,023 |
Family Income by Number of Earners in Broomfield County
The median family income in Broomfield County is $154,023, with families comprising 3+ earners (2,534) having the highest median family income of $205,682, while families with no earners (2,024) have the lowest median family income of $95,391, accounting for 13.4% and 10.7% of families, respectively.
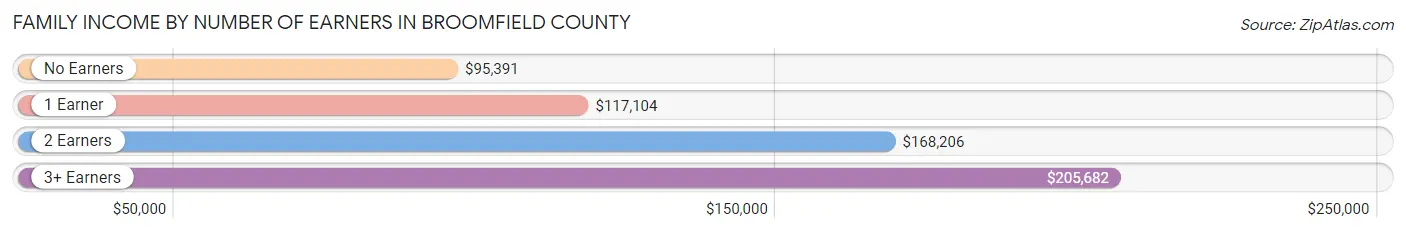
| Number of Earners | # Families | Median Income |
| No Earners | 2,024 (10.7%) | $95,391 |
| 1 Earner | 4,973 (26.2%) | $117,104 |
| 2 Earners | 9,422 (49.7%) | $168,206 |
| 3+ Earners | 2,534 (13.4%) | $205,682 |
| Total | 18,953 (100.0%) | $154,023 |
Household Income in Broomfield County
Household Income Brackets in Broomfield County
With 6,773 households falling in the category, the $200,000+ income range is the most frequent in Broomfield County, accounting for 22.5% of all households. In contrast, only 452 households (1.5%) fall into the $10,000 to $14,999 income bracket, making it the least populous group.
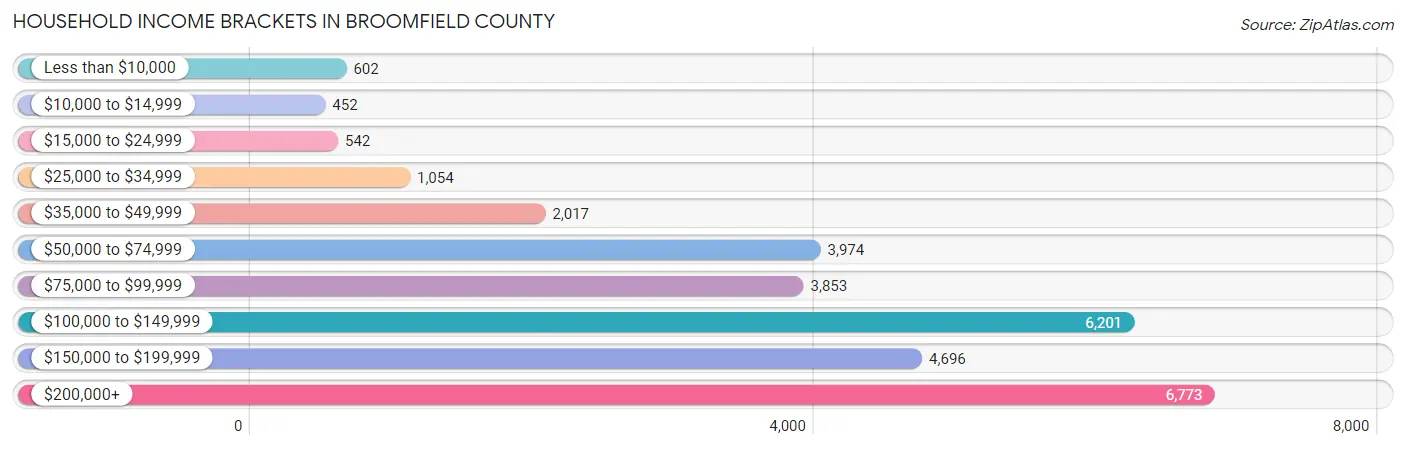
| Income Bracket | # Households | % Households |
| Less than $10,000 | 602 | 2.0% |
| $10,000 to $14,999 | 452 | 1.5% |
| $15,000 to $24,999 | 542 | 1.8% |
| $25,000 to $34,999 | 1,054 | 3.5% |
| $35,000 to $49,999 | 2,017 | 6.7% |
| $50,000 to $74,999 | 3,974 | 13.2% |
| $75,000 to $99,999 | 3,853 | 12.8% |
| $100,000 to $149,999 | 6,201 | 20.6% |
| $150,000 to $199,999 | 4,696 | 15.6% |
| $200,000+ | 6,773 | 22.5% |
Household Income by Householder Age in Broomfield County
The median household income in Broomfield County is $117,541, with the highest median household income of $145,553 found in the 45 to 64 years age bracket for the primary householder. A total of 11,330 households (37.6%) fall into this category. Meanwhile, the 15 to 24 years age bracket for the primary householder has the lowest median household income of $63,068, with 1,371 households (4.5%) in this group.
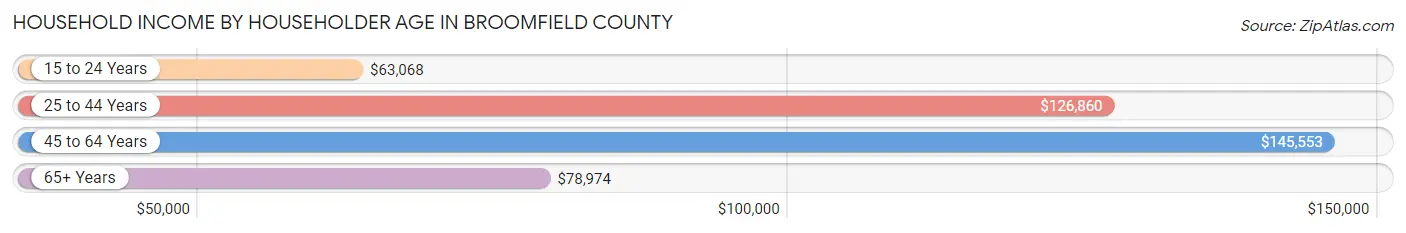
| Income Bracket | # Households | Median Income |
| 15 to 24 Years | 1,371 (4.5%) | $63,068 |
| 25 to 44 Years | 10,961 (36.4%) | $126,860 |
| 45 to 64 Years | 11,330 (37.6%) | $145,553 |
| 65+ Years | 6,441 (21.4%) | $78,974 |
| Total | 30,103 (100.0%) | $117,541 |
Poverty in Broomfield County
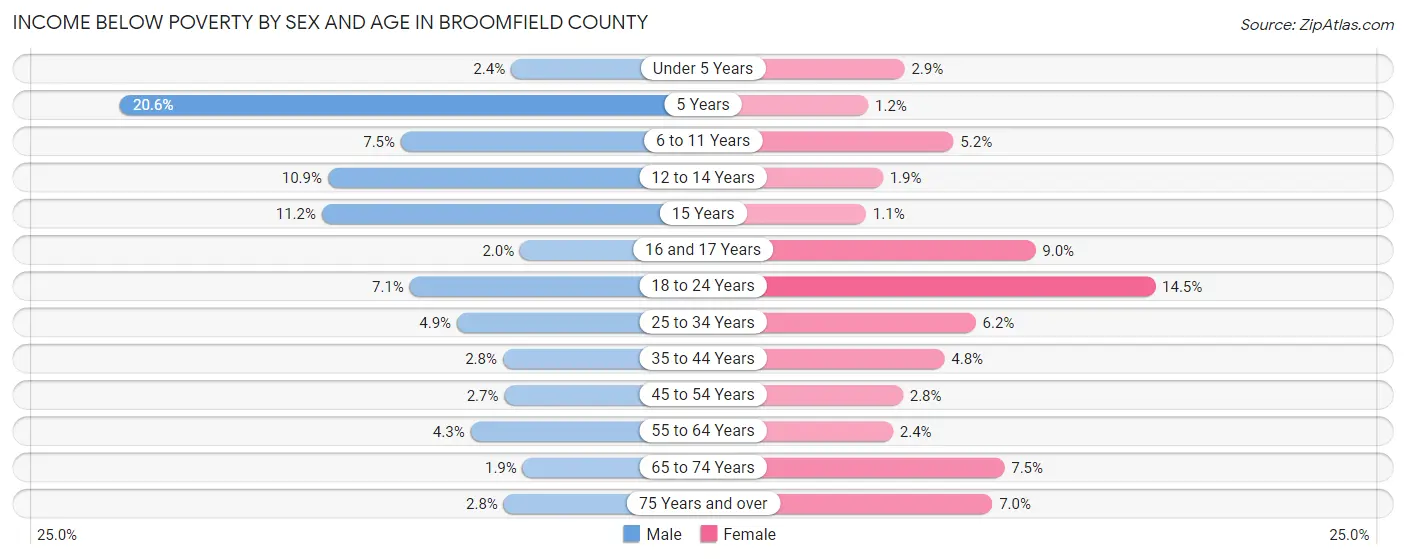
Income Below Poverty by Sex and Age in Broomfield County
With 4.6% poverty level for males and 5.5% for females among the residents of Broomfield County, 5 year old males and 18 to 24 year old females are the most vulnerable to poverty, with 87 males (20.6%) and 415 females (14.5%) in their respective age groups living below the poverty level.
| Age Bracket | Male | Female |
| Under 5 Years | 43 (2.4%) | 50 (2.9%) |
| 5 Years | 87 (20.6%) | 6 (1.2%) |
| 6 to 11 Years | 204 (7.5%) | 128 (5.2%) |
| 12 to 14 Years | 166 (10.9%) | 30 (1.9%) |
| 15 Years | 52 (11.2%) | 5 (1.1%) |
| 16 and 17 Years | 23 (2.0%) | 96 (9.0%) |
| 18 to 24 Years | 218 (7.1%) | 415 (14.5%) |
| 25 to 34 Years | 301 (4.9%) | 334 (6.2%) |
| 35 to 44 Years | 154 (2.8%) | 252 (4.8%) |
| 45 to 54 Years | 146 (2.7%) | 140 (2.8%) |
| 55 to 64 Years | 185 (4.3%) | 102 (2.4%) |
| 65 to 74 Years | 55 (1.9%) | 267 (7.5%) |
| 75 Years and over | 47 (2.8%) | 173 (7.0%) |
| Total | 1,681 (4.6%) | 1,998 (5.5%) |
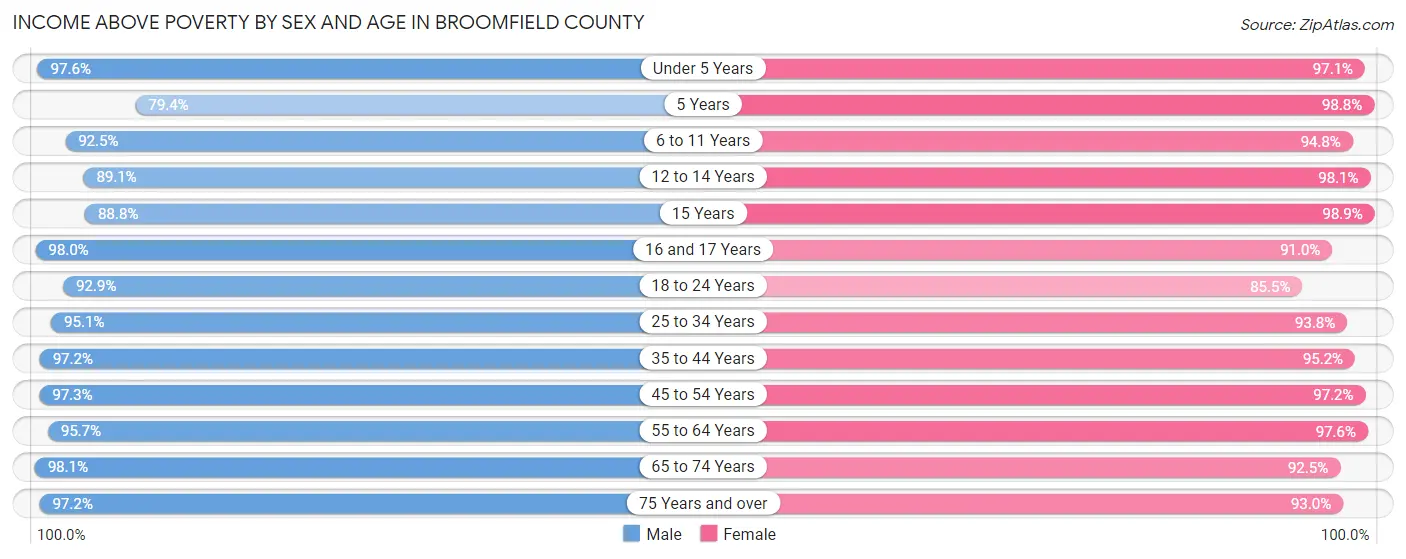
Income Above Poverty by Sex and Age in Broomfield County
According to the poverty statistics in Broomfield County, males aged 65 to 74 years and females aged 15 years are the age groups that are most secure financially, with 98.1% of males and 98.9% of females in these age groups living above the poverty line.
| Age Bracket | Male | Female |
| Under 5 Years | 1,724 (97.6%) | 1,667 (97.1%) |
| 5 Years | 336 (79.4%) | 485 (98.8%) |
| 6 to 11 Years | 2,500 (92.5%) | 2,342 (94.8%) |
| 12 to 14 Years | 1,353 (89.1%) | 1,552 (98.1%) |
| 15 Years | 412 (88.8%) | 440 (98.9%) |
| 16 and 17 Years | 1,121 (98.0%) | 973 (91.0%) |
| 18 to 24 Years | 2,840 (92.9%) | 2,439 (85.5%) |
| 25 to 34 Years | 5,788 (95.1%) | 5,044 (93.8%) |
| 35 to 44 Years | 5,335 (97.2%) | 5,042 (95.2%) |
| 45 to 54 Years | 5,192 (97.3%) | 4,805 (97.2%) |
| 55 to 64 Years | 4,107 (95.7%) | 4,202 (97.6%) |
| 65 to 74 Years | 2,854 (98.1%) | 3,275 (92.5%) |
| 75 Years and over | 1,650 (97.2%) | 2,306 (93.0%) |
| Total | 35,212 (95.4%) | 34,572 (94.5%) |
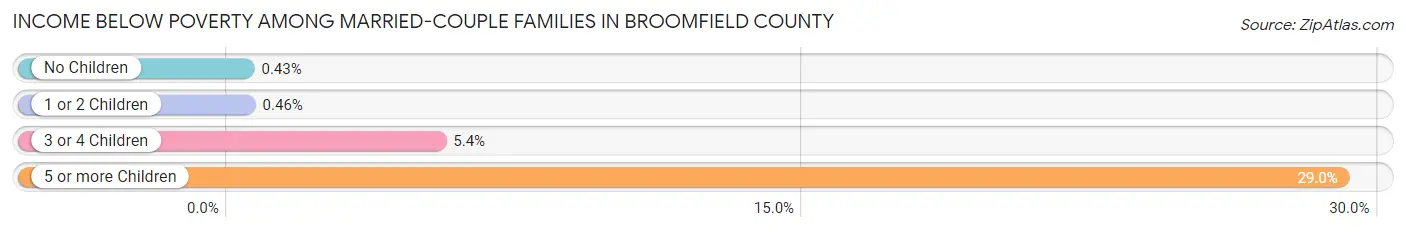
Income Below Poverty Among Married-Couple Families in Broomfield County
The poverty statistics for married-couple families in Broomfield County show that 1.0% or 158 of the total 15,955 families live below the poverty line. Families with 5 or more children have the highest poverty rate of 29.0%, comprising of 36 families. On the other hand, families with no children have the lowest poverty rate of 0.4%, which includes 39 families.
| Children | Above Poverty | Below Poverty |
| No Children | 9,048 (99.6%) | 39 (0.4%) |
| 1 or 2 Children | 5,670 (99.5%) | 26 (0.5%) |
| 3 or 4 Children | 991 (94.6%) | 57 (5.4%) |
| 5 or more Children | 88 (71.0%) | 36 (29.0%) |
| Total | 15,797 (99.0%) | 158 (1.0%) |
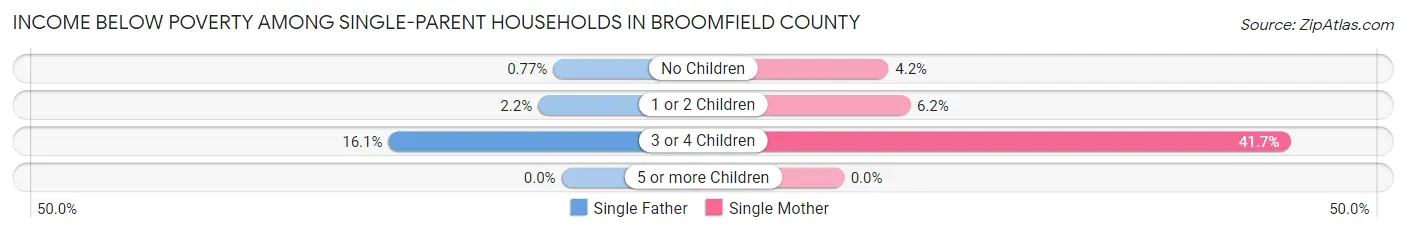
Income Below Poverty Among Single-Parent Households in Broomfield County
According to the poverty data in Broomfield County, 2.9% or 29 single-father households and 8.4% or 168 single-mother households are living below the poverty line. Among single-father households, those with 3 or 4 children have the highest poverty rate, with 15 households (16.1%) experiencing poverty. Likewise, among single-mother households, those with 3 or 4 children have the highest poverty rate, with 70 households (41.7%) falling below the poverty line.
| Children | Single Father | Single Mother |
| No Children | 3 (0.8%) | 33 (4.2%) |
| 1 or 2 Children | 11 (2.2%) | 65 (6.2%) |
| 3 or 4 Children | 15 (16.1%) | 70 (41.7%) |
| 5 or more Children | 0 (0.0%) | 0 (0.0%) |
| Total | 29 (2.9%) | 168 (8.4%) |
Income Below Poverty Among Married-Couple vs Single-Parent Households in Broomfield County
The poverty data for Broomfield County shows that 158 of the married-couple family households (1.0%) and 197 of the single-parent households (6.6%) are living below the poverty level. Within the married-couple family households, those with 5 or more children have the highest poverty rate, with 36 households (29.0%) falling below the poverty line. Among the single-parent households, those with 3 or 4 children have the highest poverty rate, with 85 household (32.6%) living below poverty.
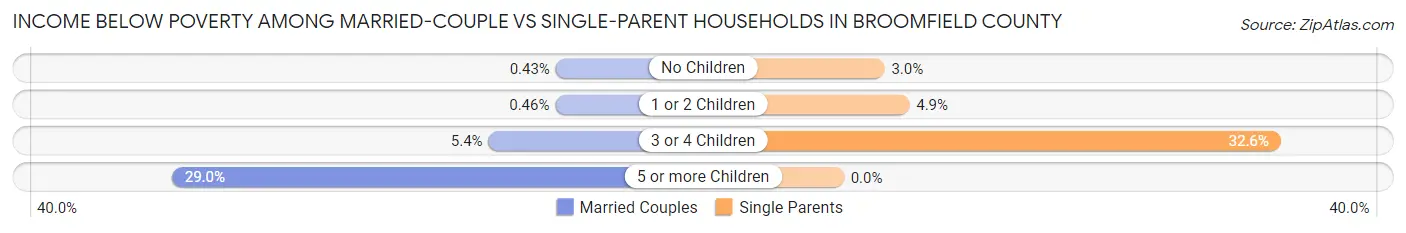
| Children | Married-Couple Families | Single-Parent Households |
| No Children | 39 (0.4%) | 36 (3.0%) |
| 1 or 2 Children | 26 (0.5%) | 76 (4.9%) |
| 3 or 4 Children | 57 (5.4%) | 85 (32.6%) |
| 5 or more Children | 36 (29.0%) | 0 (0.0%) |
| Total | 158 (1.0%) | 197 (6.6%) |
Employment Characteristics in Broomfield County
Employment by Class of Employer in Broomfield County
Among the 41,490 employed individuals in Broomfield County, private company employees (29,427 | 70.9%), local government employees (3,081 | 7.4%), and not-for-profit organizations (2,735 | 6.6%) make up the most common classes of employment.
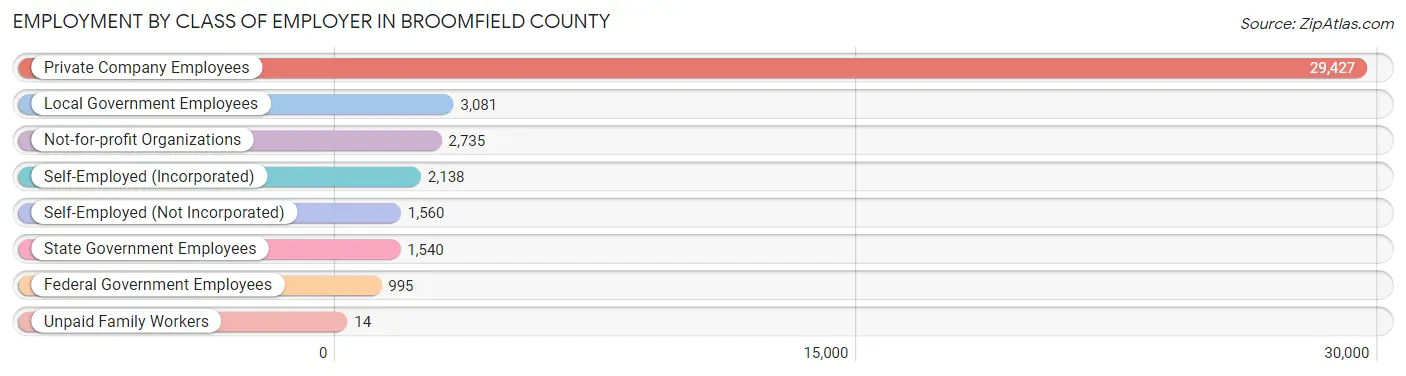
| Employer Class | # Employees | % Employees |
| Private Company Employees | 29,427 | 70.9% |
| Self-Employed (Incorporated) | 2,138 | 5.1% |
| Self-Employed (Not Incorporated) | 1,560 | 3.8% |
| Not-for-profit Organizations | 2,735 | 6.6% |
| Local Government Employees | 3,081 | 7.4% |
| State Government Employees | 1,540 | 3.7% |
| Federal Government Employees | 995 | 2.4% |
| Unpaid Family Workers | 14 | 0.0% |
| Total | 41,490 | 100.0% |
Employment Status by Age in Broomfield County
According to the labor force statistics for Broomfield County, out of the total population over 16 years of age (60,251), 71.9% or 43,320 individuals are in the labor force, with 3.2% or 1,386 of them unemployed. The age group with the highest labor force participation rate is 25 to 29 years, with 92.8% or 5,372 individuals in the labor force. Within the labor force, the 75 years and over age range has the highest percentage of unemployed individuals, with 7.5% or 18 of them being unemployed.
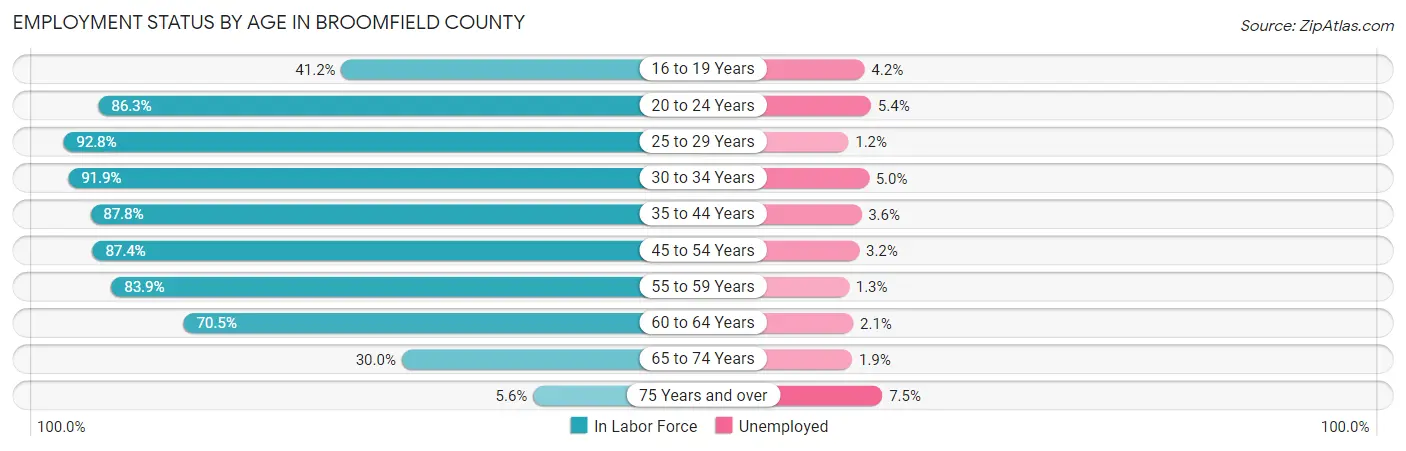
| Age Bracket | In Labor Force | Unemployed |
| 16 to 19 Years | 1,577 (41.2%) | 66 (4.2%) |
| 20 to 24 Years | 3,708 (86.3%) | 200 (5.4%) |
| 25 to 29 Years | 5,372 (92.8%) | 64 (1.2%) |
| 30 to 34 Years | 5,245 (91.9%) | 262 (5.0%) |
| 35 to 44 Years | 9,511 (87.8%) | 342 (3.6%) |
| 45 to 54 Years | 9,001 (87.4%) | 288 (3.2%) |
| 55 to 59 Years | 3,835 (83.9%) | 50 (1.3%) |
| 60 to 64 Years | 2,872 (70.5%) | 60 (2.1%) |
| 65 to 74 Years | 1,962 (30.0%) | 37 (1.9%) |
| 75 Years and over | 242 (5.6%) | 18 (7.5%) |
| Total | 43,320 (71.9%) | 1,386 (3.2%) |
Employment Status by Educational Attainment in Broomfield County
According to labor force statistics for Broomfield County, 86.8% of individuals (35,825) out of the total population between 25 and 64 years of age (41,273) are in the labor force, with 3.0% or 1,075 of them being unemployed. The group with the highest labor force participation rate are those with the educational attainment of bachelor's degree or higher, with 89.8% or 22,763 individuals in the labor force. Within the labor force, individuals with bachelor's degree or higher education have the highest percentage of unemployment, with 3.2% or 728 of them being unemployed.
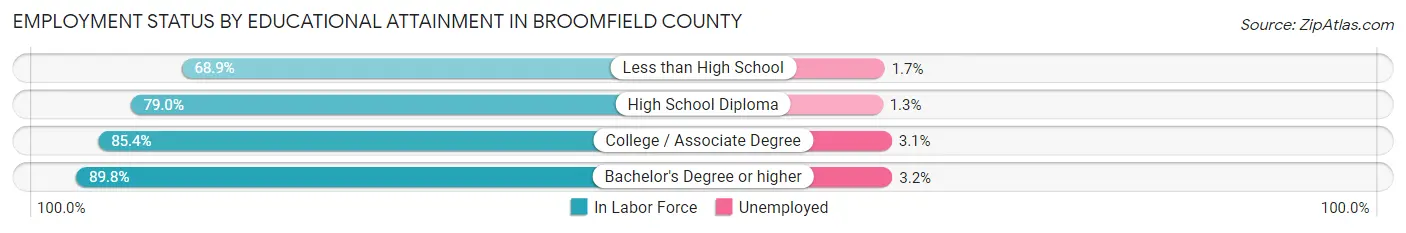
| Educational Attainment | In Labor Force | Unemployed |
| Less than High School | 969 (68.9%) | 24 (1.7%) |
| High School Diploma | 3,572 (79.0%) | 59 (1.3%) |
| College / Associate Degree | 8,537 (85.4%) | 310 (3.1%) |
| Bachelor's Degree or higher | 22,763 (89.8%) | 811 (3.2%) |
| Total | 35,825 (86.8%) | 1,238 (3.0%) |
Employment Occupations by Sex in Broomfield County
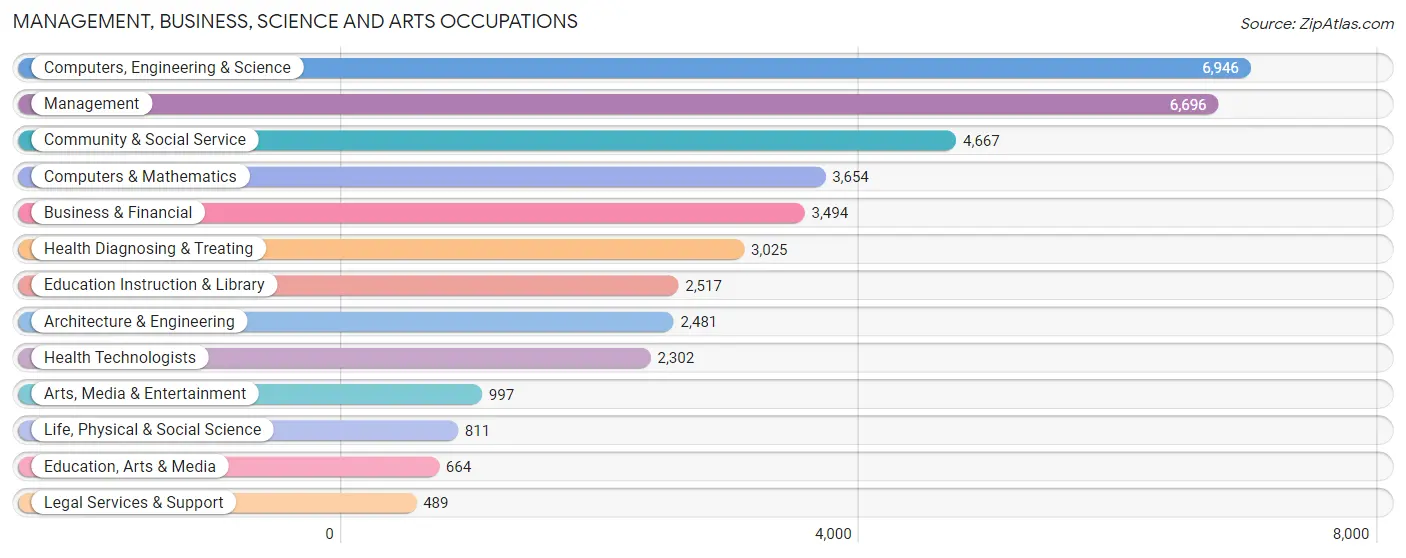
Management, Business, Science and Arts Occupations
The most common Management, Business, Science and Arts occupations in Broomfield County are Computers, Engineering & Science (6,946 | 16.6%), Management (6,696 | 16.0%), Community & Social Service (4,667 | 11.1%), Computers & Mathematics (3,654 | 8.7%), and Business & Financial (3,494 | 8.3%).
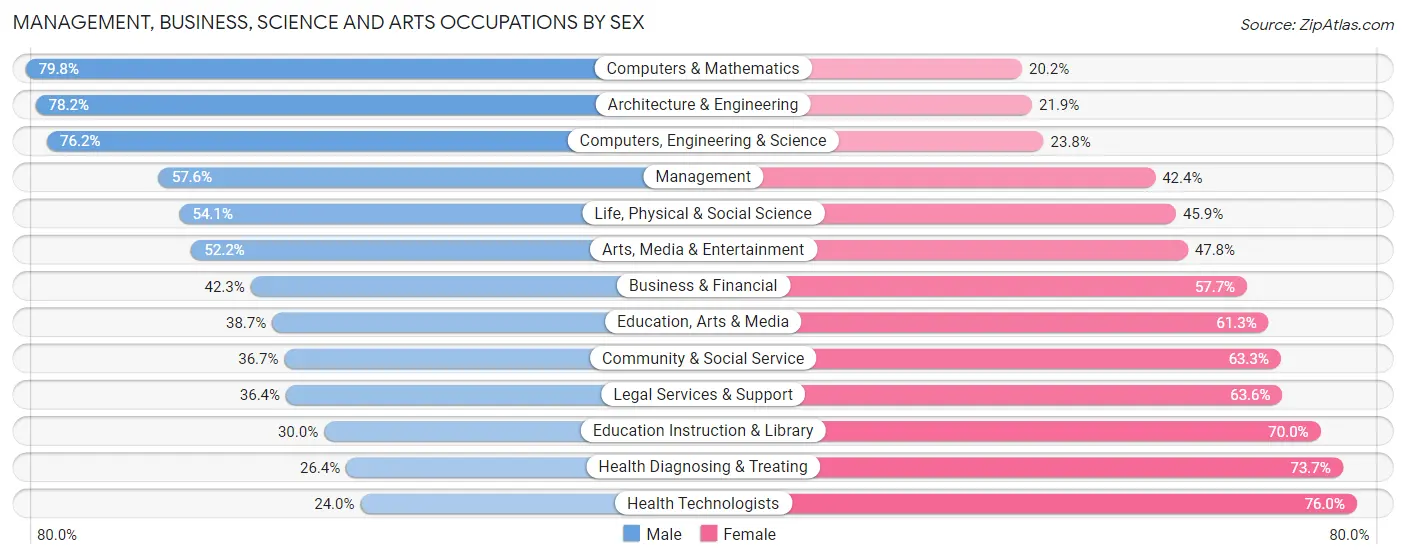
Management, Business, Science and Arts Occupations by Sex
Within the Management, Business, Science and Arts occupations in Broomfield County, the most male-oriented occupations are Computers & Mathematics (79.8%), Architecture & Engineering (78.1%), and Computers, Engineering & Science (76.2%), while the most female-oriented occupations are Health Technologists (76.0%), Health Diagnosing & Treating (73.7%), and Education Instruction & Library (70.0%).
| Occupation | Male | Female |
| Management | 3,857 (57.6%) | 2,839 (42.4%) |
| Business & Financial | 1,478 (42.3%) | 2,016 (57.7%) |
| Computers, Engineering & Science | 5,295 (76.2%) | 1,651 (23.8%) |
| Computers & Mathematics | 2,917 (79.8%) | 737 (20.2%) |
| Architecture & Engineering | 1,939 (78.1%) | 542 (21.8%) |
| Life, Physical & Social Science | 439 (54.1%) | 372 (45.9%) |
| Community & Social Service | 1,711 (36.7%) | 2,956 (63.3%) |
| Education, Arts & Media | 257 (38.7%) | 407 (61.3%) |
| Legal Services & Support | 178 (36.4%) | 311 (63.6%) |
| Education Instruction & Library | 756 (30.0%) | 1,761 (70.0%) |
| Arts, Media & Entertainment | 520 (52.2%) | 477 (47.8%) |
| Health Diagnosing & Treating | 797 (26.4%) | 2,228 (73.7%) |
| Health Technologists | 552 (24.0%) | 1,750 (76.0%) |
| Total (Category) | 13,138 (52.9%) | 11,690 (47.1%) |
| Total (Overall) | 22,798 (54.4%) | 19,081 (45.6%) |
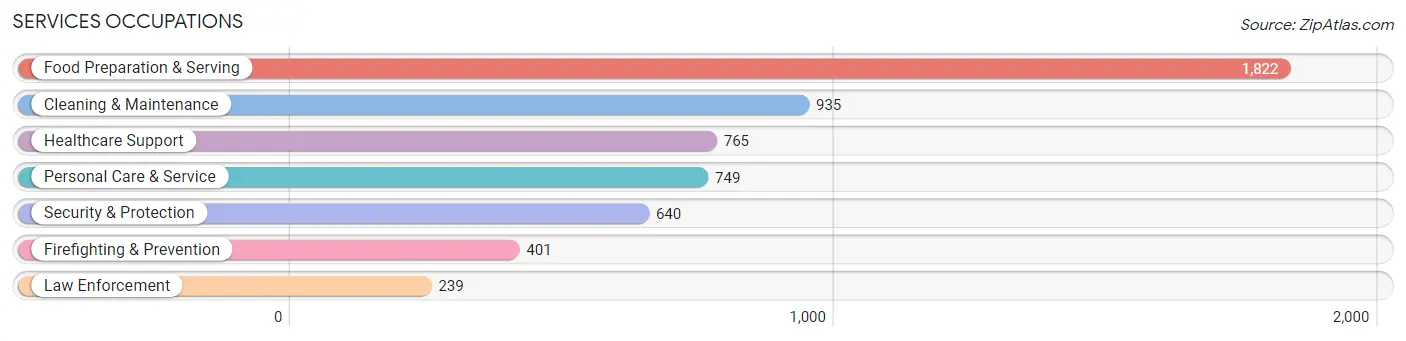
Services Occupations
The most common Services occupations in Broomfield County are Food Preparation & Serving (1,822 | 4.3%), Cleaning & Maintenance (935 | 2.2%), Healthcare Support (765 | 1.8%), Personal Care & Service (749 | 1.8%), and Security & Protection (640 | 1.5%).
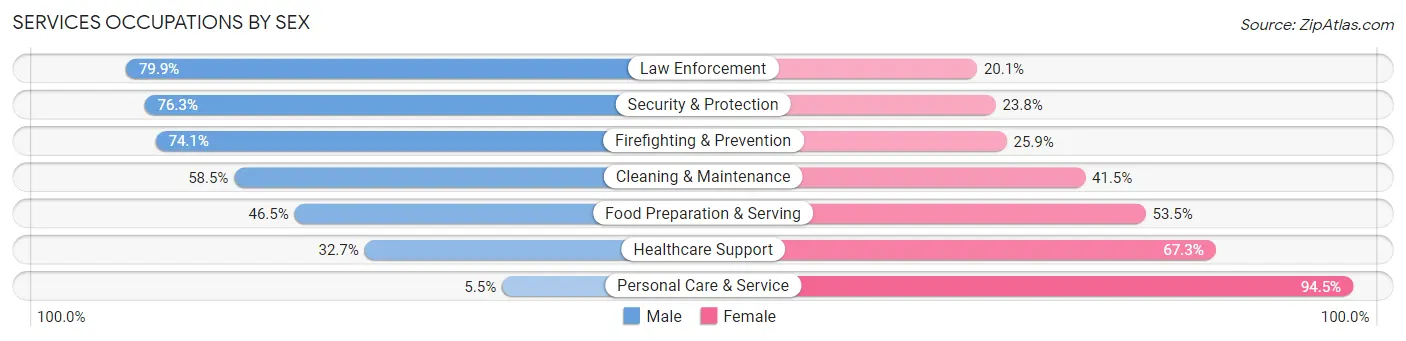
Services Occupations by Sex
Within the Services occupations in Broomfield County, the most male-oriented occupations are Law Enforcement (79.9%), Security & Protection (76.2%), and Firefighting & Prevention (74.1%), while the most female-oriented occupations are Personal Care & Service (94.5%), Healthcare Support (67.3%), and Food Preparation & Serving (53.5%).
| Occupation | Male | Female |
| Healthcare Support | 250 (32.7%) | 515 (67.3%) |
| Security & Protection | 488 (76.2%) | 152 (23.7%) |
| Firefighting & Prevention | 297 (74.1%) | 104 (25.9%) |
| Law Enforcement | 191 (79.9%) | 48 (20.1%) |
| Food Preparation & Serving | 848 (46.5%) | 974 (53.5%) |
| Cleaning & Maintenance | 547 (58.5%) | 388 (41.5%) |
| Personal Care & Service | 41 (5.5%) | 708 (94.5%) |
| Total (Category) | 2,174 (44.3%) | 2,737 (55.7%) |
| Total (Overall) | 22,798 (54.4%) | 19,081 (45.6%) |
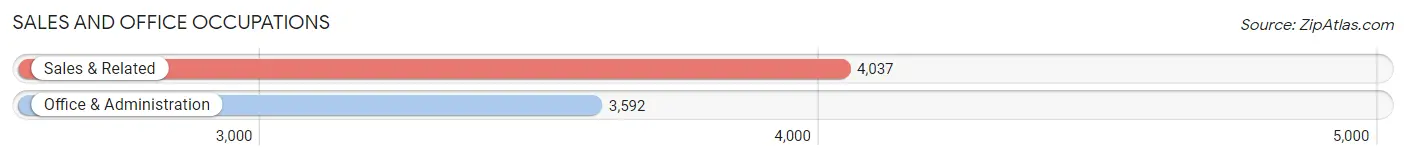
Sales and Office Occupations
The most common Sales and Office occupations in Broomfield County are Sales & Related (4,037 | 9.6%), and Office & Administration (3,592 | 8.6%).
Sales and Office Occupations by Sex
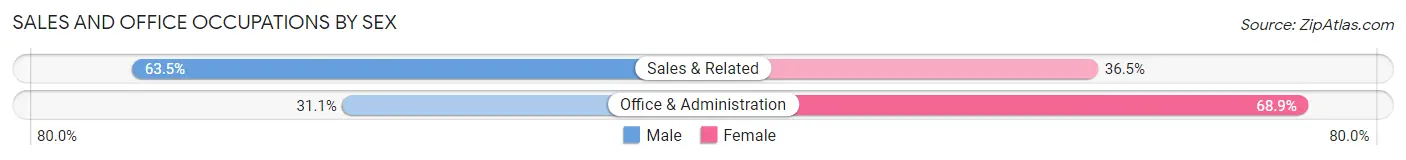
| Occupation | Male | Female |
| Sales & Related | 2,563 (63.5%) | 1,474 (36.5%) |
| Office & Administration | 1,116 (31.1%) | 2,476 (68.9%) |
| Total (Category) | 3,679 (48.2%) | 3,950 (51.8%) |
| Total (Overall) | 22,798 (54.4%) | 19,081 (45.6%) |
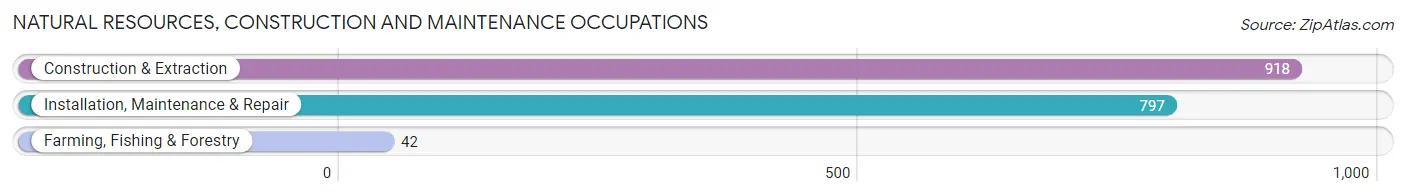
Natural Resources, Construction and Maintenance Occupations
The most common Natural Resources, Construction and Maintenance occupations in Broomfield County are Construction & Extraction (918 | 2.2%), Installation, Maintenance & Repair (797 | 1.9%), and Farming, Fishing & Forestry (42 | 0.1%).
Natural Resources, Construction and Maintenance Occupations by Sex
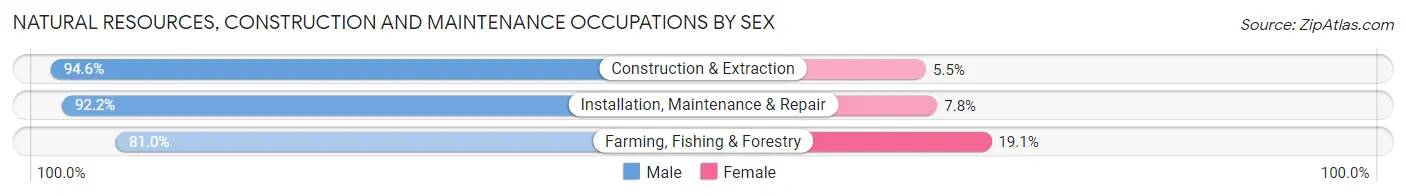
| Occupation | Male | Female |
| Farming, Fishing & Forestry | 34 (80.9%) | 8 (19.1%) |
| Construction & Extraction | 868 (94.6%) | 50 (5.4%) |
| Installation, Maintenance & Repair | 735 (92.2%) | 62 (7.8%) |
| Total (Category) | 1,637 (93.2%) | 120 (6.8%) |
| Total (Overall) | 22,798 (54.4%) | 19,081 (45.6%) |
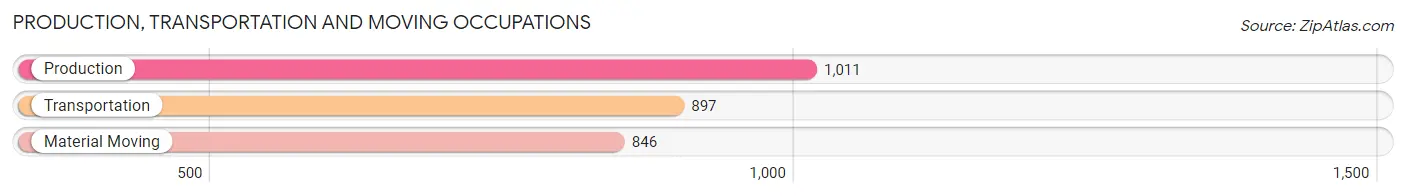
Production, Transportation and Moving Occupations
The most common Production, Transportation and Moving occupations in Broomfield County are Production (1,011 | 2.4%), Transportation (897 | 2.1%), and Material Moving (846 | 2.0%).
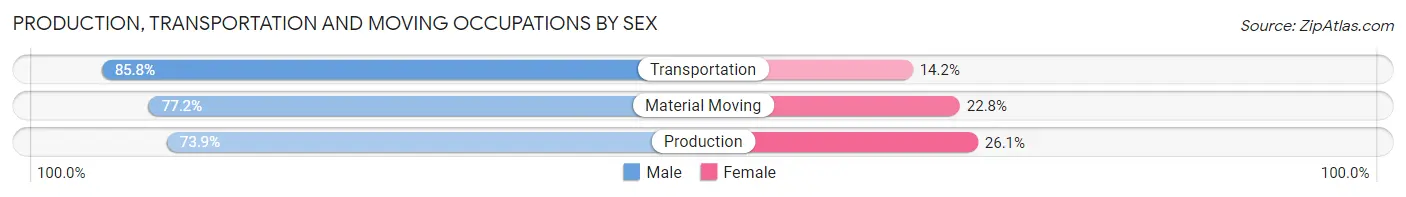
Production, Transportation and Moving Occupations by Sex
| Occupation | Male | Female |
| Production | 747 (73.9%) | 264 (26.1%) |
| Transportation | 770 (85.8%) | 127 (14.2%) |
| Material Moving | 653 (77.2%) | 193 (22.8%) |
| Total (Category) | 2,170 (78.8%) | 584 (21.2%) |
| Total (Overall) | 22,798 (54.4%) | 19,081 (45.6%) |
Employment Industries by Sex in Broomfield County
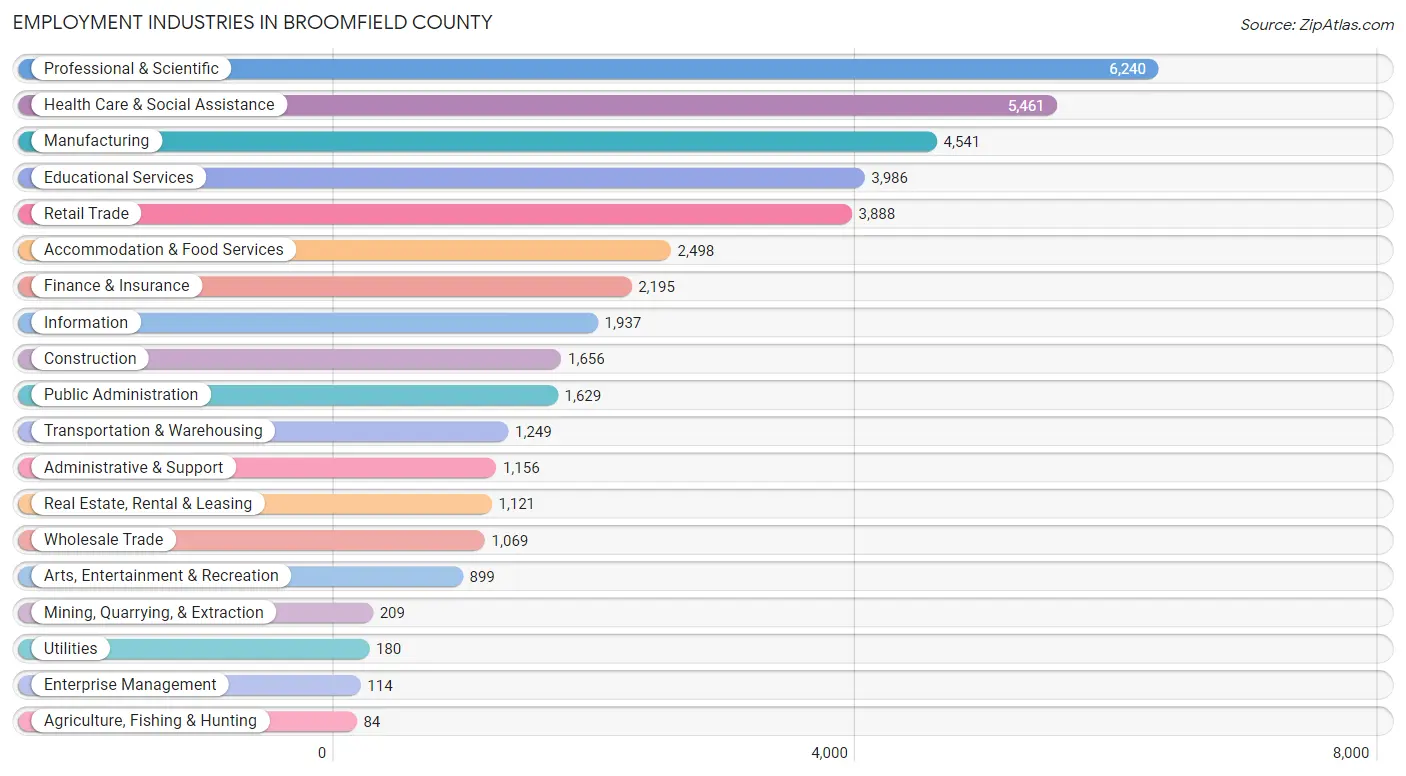
Employment Industries in Broomfield County
The major employment industries in Broomfield County include Professional & Scientific (6,240 | 14.9%), Health Care & Social Assistance (5,461 | 13.0%), Manufacturing (4,541 | 10.8%), Educational Services (3,986 | 9.5%), and Retail Trade (3,888 | 9.3%).
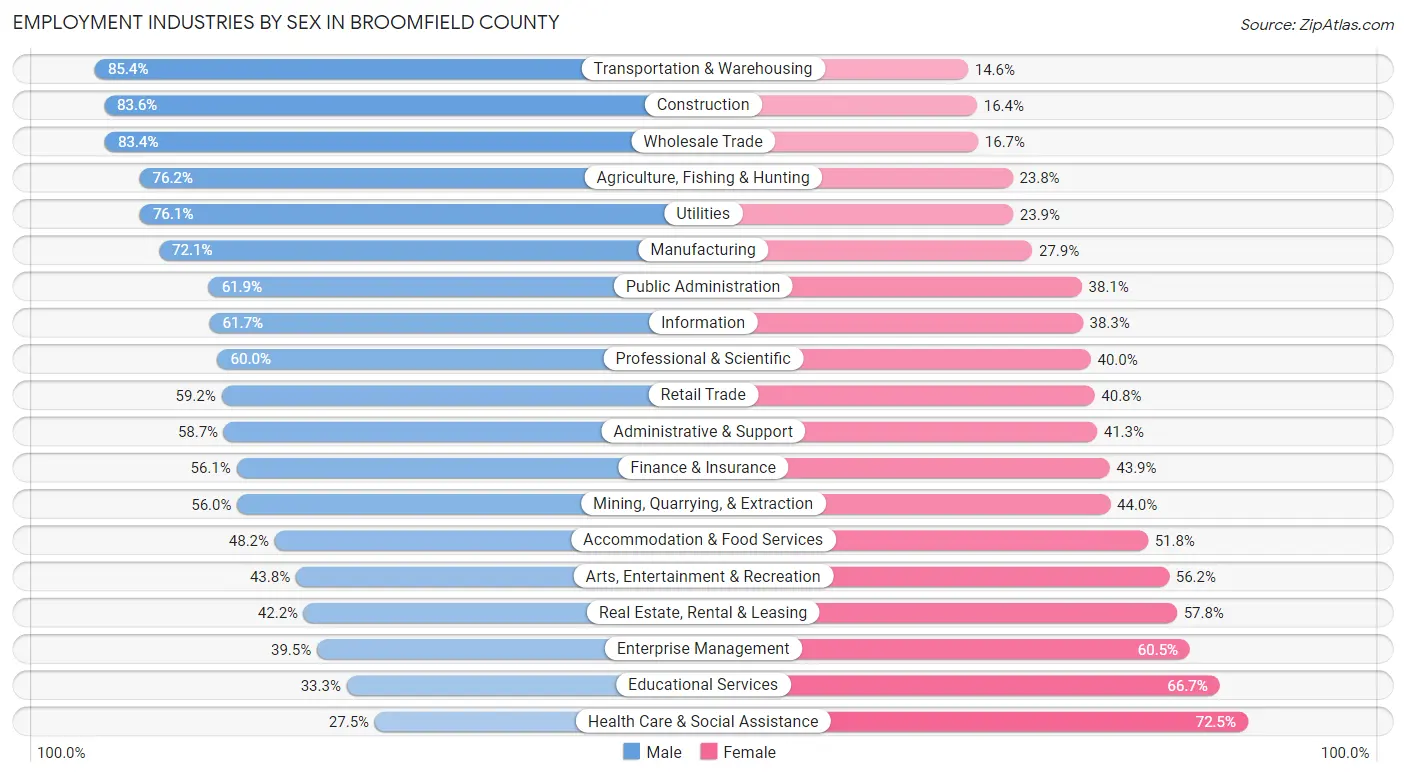
Employment Industries by Sex in Broomfield County
The Broomfield County industries that see more men than women are Transportation & Warehousing (85.4%), Construction (83.6%), and Wholesale Trade (83.4%), whereas the industries that tend to have a higher number of women are Health Care & Social Assistance (72.5%), Educational Services (66.7%), and Enterprise Management (60.5%).
| Industry | Male | Female |
| Agriculture, Fishing & Hunting | 64 (76.2%) | 20 (23.8%) |
| Mining, Quarrying, & Extraction | 117 (56.0%) | 92 (44.0%) |
| Construction | 1,384 (83.6%) | 272 (16.4%) |
| Manufacturing | 3,276 (72.1%) | 1,265 (27.9%) |
| Wholesale Trade | 891 (83.4%) | 178 (16.7%) |
| Retail Trade | 2,303 (59.2%) | 1,585 (40.8%) |
| Transportation & Warehousing | 1,067 (85.4%) | 182 (14.6%) |
| Utilities | 137 (76.1%) | 43 (23.9%) |
| Information | 1,195 (61.7%) | 742 (38.3%) |
| Finance & Insurance | 1,232 (56.1%) | 963 (43.9%) |
| Real Estate, Rental & Leasing | 473 (42.2%) | 648 (57.8%) |
| Professional & Scientific | 3,746 (60.0%) | 2,494 (40.0%) |
| Enterprise Management | 45 (39.5%) | 69 (60.5%) |
| Administrative & Support | 679 (58.7%) | 477 (41.3%) |
| Educational Services | 1,328 (33.3%) | 2,658 (66.7%) |
| Health Care & Social Assistance | 1,501 (27.5%) | 3,960 (72.5%) |
| Arts, Entertainment & Recreation | 394 (43.8%) | 505 (56.2%) |
| Accommodation & Food Services | 1,204 (48.2%) | 1,294 (51.8%) |
| Public Administration | 1,008 (61.9%) | 621 (38.1%) |
| Total | 22,798 (54.4%) | 19,081 (45.6%) |
Education in Broomfield County
School Enrollment in Broomfield County
The most common levels of schooling among the 17,556 students in Broomfield County are high school (4,144 | 23.6%), middle school (3,774 | 21.5%), and college / undergraduate (3,190 | 18.2%).
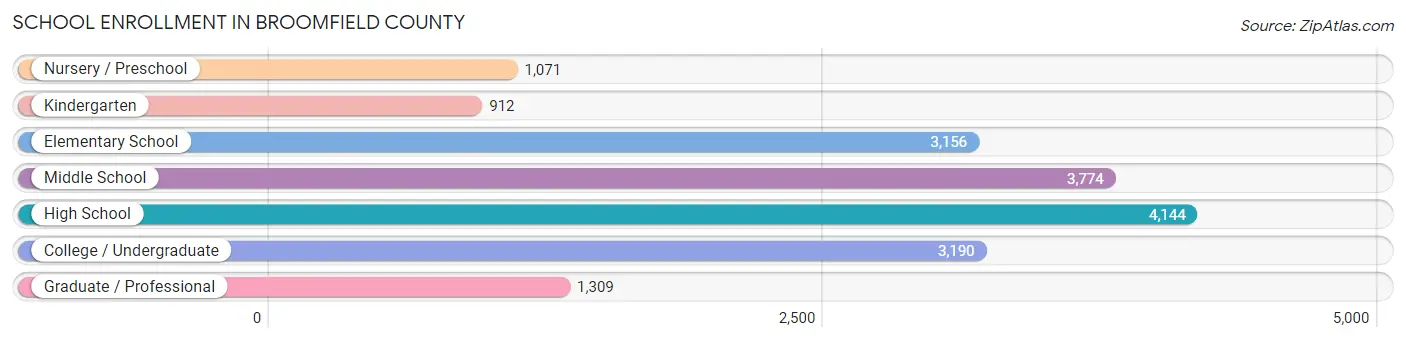
| School Level | # Students | % Students |
| Nursery / Preschool | 1,071 | 6.1% |
| Kindergarten | 912 | 5.2% |
| Elementary School | 3,156 | 18.0% |
| Middle School | 3,774 | 21.5% |
| High School | 4,144 | 23.6% |
| College / Undergraduate | 3,190 | 18.2% |
| Graduate / Professional | 1,309 | 7.5% |
| Total | 17,556 | 100.0% |
School Enrollment by Age by Funding Source in Broomfield County
Out of a total of 17,556 students who are enrolled in schools in Broomfield County, 2,265 (12.9%) attend a private institution, while the remaining 15,291 (87.1%) are enrolled in public schools. The age group of 3 to 4 year olds has the highest likelihood of being enrolled in private schools, with 401 (52.1% in the age bracket) enrolled. Conversely, the age group of 20 to 24 year olds has the lowest likelihood of being enrolled in a private school, with 1,602 (95.6% in the age bracket) attending a public institution.
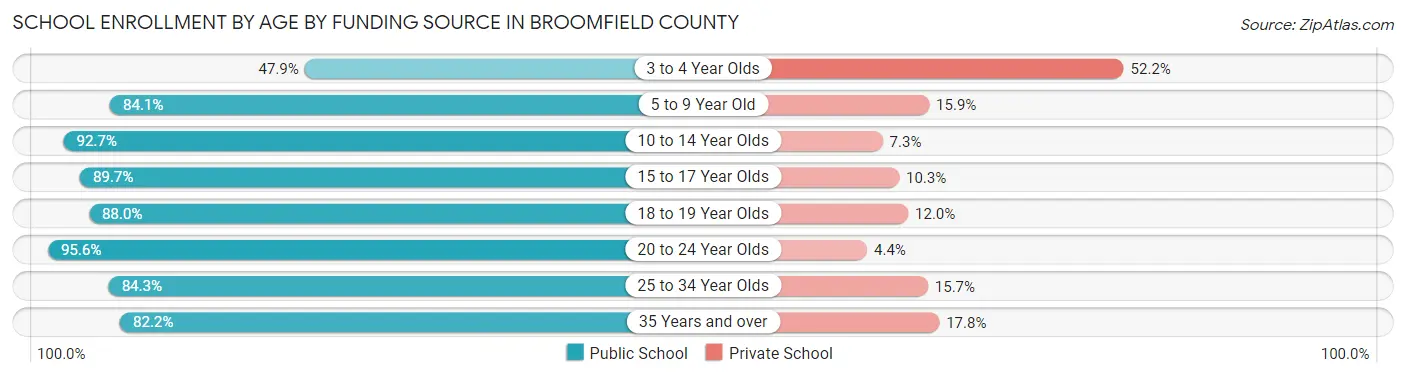
| Age Bracket | Public School | Private School |
| 3 to 4 Year Olds | 368 (47.8%) | 401 (52.1%) |
| 5 to 9 Year Old | 3,364 (84.1%) | 637 (15.9%) |
| 10 to 14 Year Olds | 4,404 (92.7%) | 345 (7.3%) |
| 15 to 17 Year Olds | 2,747 (89.7%) | 316 (10.3%) |
| 18 to 19 Year Olds | 902 (88.0%) | 123 (12.0%) |
| 20 to 24 Year Olds | 1,602 (95.6%) | 73 (4.4%) |
| 25 to 34 Year Olds | 1,065 (84.3%) | 198 (15.7%) |
| 35 Years and over | 831 (82.2%) | 180 (17.8%) |
| Total | 15,291 (87.1%) | 2,265 (12.9%) |
Educational Attainment by Field of Study in Broomfield County
Business (6,844 | 20.5%), engineering (3,818 | 11.4%), science & technology (3,243 | 9.7%), social sciences (2,656 | 7.9%), and bio, nature & agricultural (2,435 | 7.3%) are the most common fields of study among 33,432 individuals in Broomfield County who have obtained a bachelor's degree or higher.
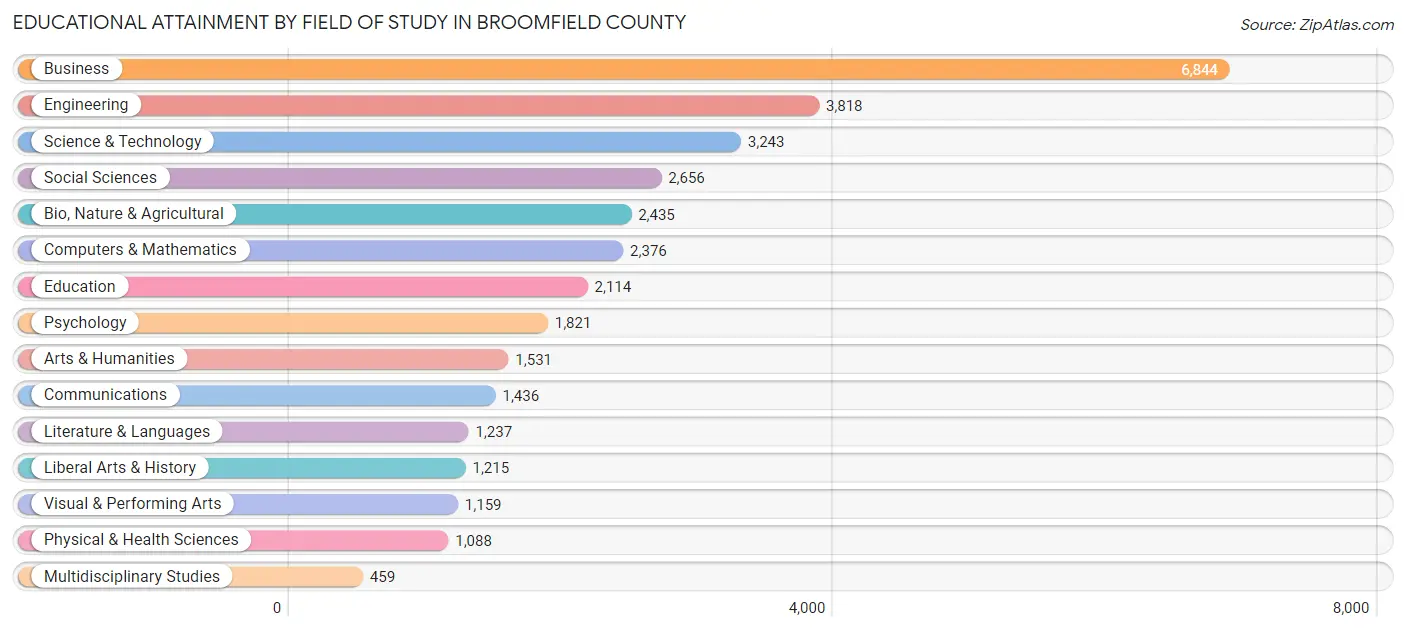
| Field of Study | # Graduates | % Graduates |
| Computers & Mathematics | 2,376 | 7.1% |
| Bio, Nature & Agricultural | 2,435 | 7.3% |
| Physical & Health Sciences | 1,088 | 3.3% |
| Psychology | 1,821 | 5.4% |
| Social Sciences | 2,656 | 7.9% |
| Engineering | 3,818 | 11.4% |
| Multidisciplinary Studies | 459 | 1.4% |
| Science & Technology | 3,243 | 9.7% |
| Business | 6,844 | 20.5% |
| Education | 2,114 | 6.3% |
| Literature & Languages | 1,237 | 3.7% |
| Liberal Arts & History | 1,215 | 3.6% |
| Visual & Performing Arts | 1,159 | 3.5% |
| Communications | 1,436 | 4.3% |
| Arts & Humanities | 1,531 | 4.6% |
| Total | 33,432 | 100.0% |
Transportation & Commute in Broomfield County
Vehicle Availability by Sex in Broomfield County
The most prevalent vehicle ownership categories in Broomfield County are males with 2 vehicles (9,952, accounting for 43.9%) and females with 2 vehicles (8,227, making up 52.9%).
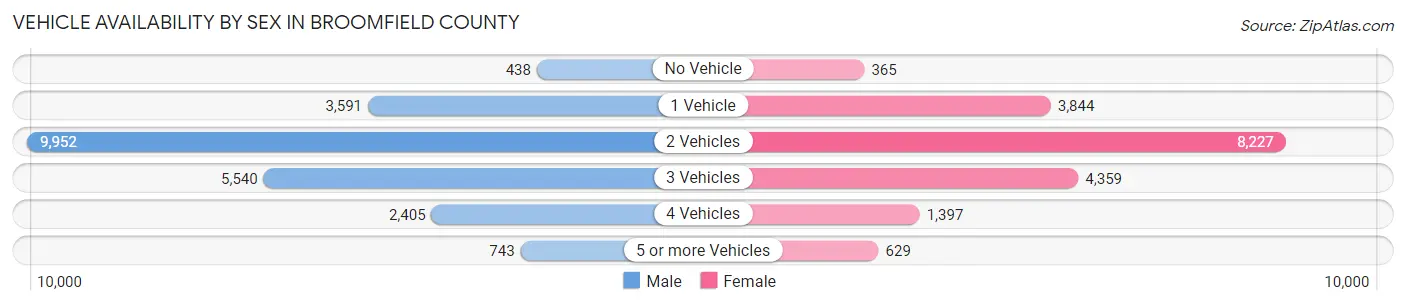
| Vehicles Available | Male | Female |
| No Vehicle | 438 (1.9%) | 365 (1.9%) |
| 1 Vehicle | 3,591 (15.8%) | 3,844 (20.4%) |
| 2 Vehicles | 9,952 (43.9%) | 8,227 (43.7%) |
| 3 Vehicles | 5,540 (24.4%) | 4,359 (23.2%) |
| 4 Vehicles | 2,405 (10.6%) | 1,397 (7.4%) |
| 5 or more Vehicles | 743 (3.3%) | 629 (3.3%) |
| Total | 22,669 (100.0%) | 18,821 (100.0%) |
Commute Time in Broomfield County
The most frequently occuring commute durations in Broomfield County are 30 to 34 minutes (5,853 commuters, 18.3%), 15 to 19 minutes (4,882 commuters, 15.2%), and 20 to 24 minutes (4,656 commuters, 14.5%).
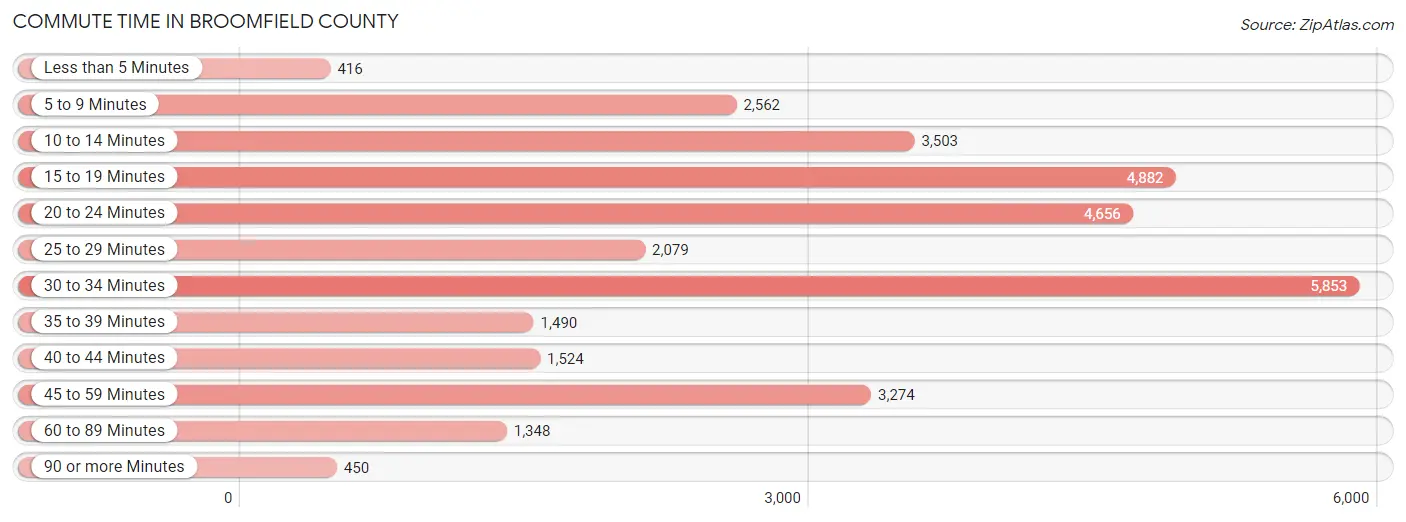
| Commute Time | # Commuters | % Commuters |
| Less than 5 Minutes | 416 | 1.3% |
| 5 to 9 Minutes | 2,562 | 8.0% |
| 10 to 14 Minutes | 3,503 | 10.9% |
| 15 to 19 Minutes | 4,882 | 15.2% |
| 20 to 24 Minutes | 4,656 | 14.5% |
| 25 to 29 Minutes | 2,079 | 6.5% |
| 30 to 34 Minutes | 5,853 | 18.3% |
| 35 to 39 Minutes | 1,490 | 4.6% |
| 40 to 44 Minutes | 1,524 | 4.8% |
| 45 to 59 Minutes | 3,274 | 10.2% |
| 60 to 89 Minutes | 1,348 | 4.2% |
| 90 or more Minutes | 450 | 1.4% |
Commute Time by Sex in Broomfield County
The most common commute times in Broomfield County are 30 to 34 minutes (3,405 commuters, 19.7%) for males and 15 to 19 minutes (2,540 commuters, 17.2%) for females.
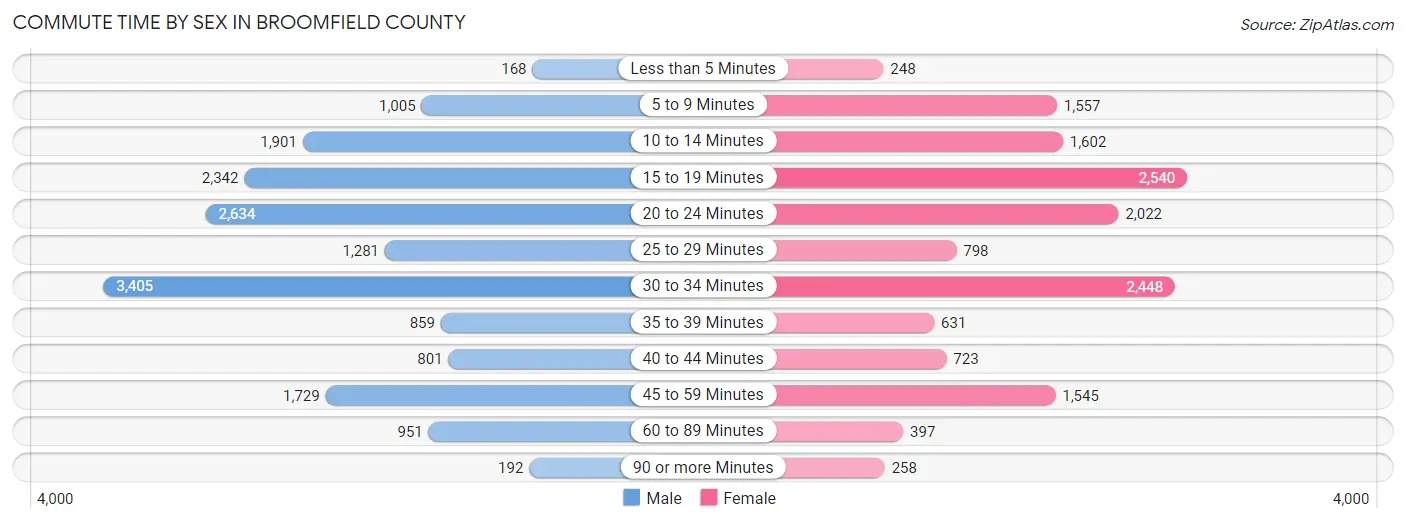
| Commute Time | Male | Female |
| Less than 5 Minutes | 168 (1.0%) | 248 (1.7%) |
| 5 to 9 Minutes | 1,005 (5.8%) | 1,557 (10.5%) |
| 10 to 14 Minutes | 1,901 (11.0%) | 1,602 (10.8%) |
| 15 to 19 Minutes | 2,342 (13.6%) | 2,540 (17.2%) |
| 20 to 24 Minutes | 2,634 (15.2%) | 2,022 (13.7%) |
| 25 to 29 Minutes | 1,281 (7.4%) | 798 (5.4%) |
| 30 to 34 Minutes | 3,405 (19.7%) | 2,448 (16.6%) |
| 35 to 39 Minutes | 859 (5.0%) | 631 (4.3%) |
| 40 to 44 Minutes | 801 (4.6%) | 723 (4.9%) |
| 45 to 59 Minutes | 1,729 (10.0%) | 1,545 (10.5%) |
| 60 to 89 Minutes | 951 (5.5%) | 397 (2.7%) |
| 90 or more Minutes | 192 (1.1%) | 258 (1.8%) |
Time of Departure to Work by Sex in Broomfield County
The most frequent times of departure to work in Broomfield County are 7:00 AM to 7:29 AM (2,725, 15.8%) for males and 7:00 AM to 7:29 AM (2,576, 17.4%) for females.
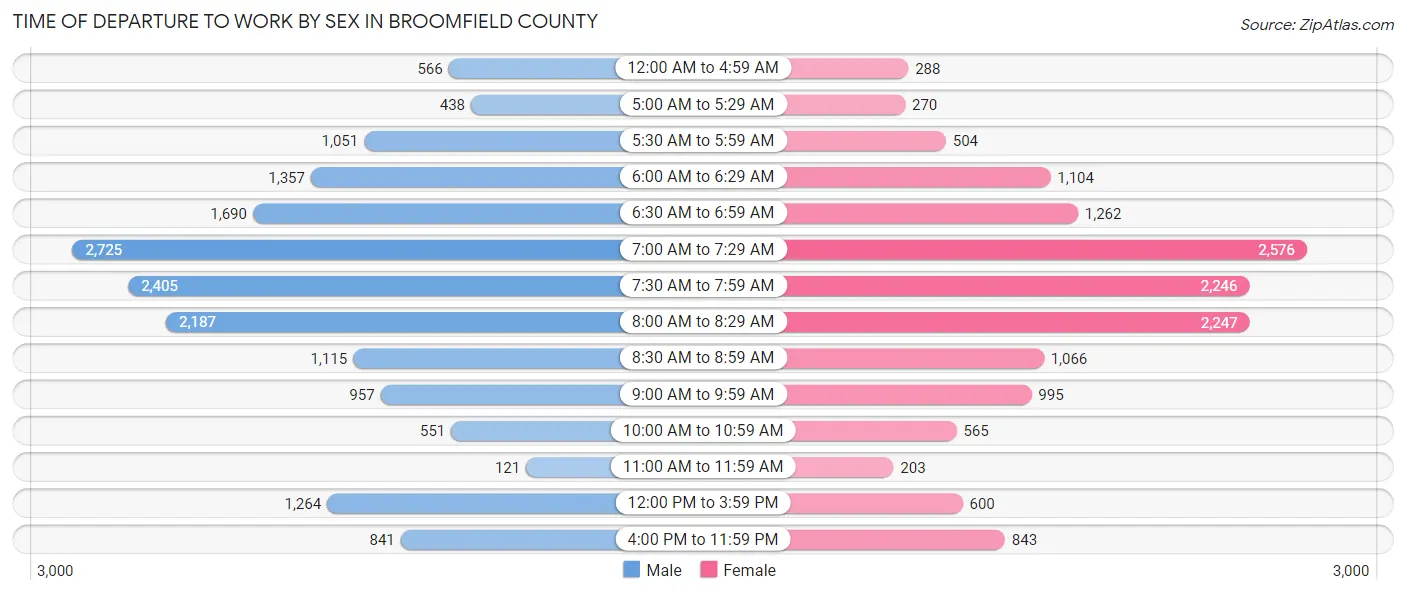
| Time of Departure | Male | Female |
| 12:00 AM to 4:59 AM | 566 (3.3%) | 288 (1.9%) |
| 5:00 AM to 5:29 AM | 438 (2.5%) | 270 (1.8%) |
| 5:30 AM to 5:59 AM | 1,051 (6.1%) | 504 (3.4%) |
| 6:00 AM to 6:29 AM | 1,357 (7.9%) | 1,104 (7.5%) |
| 6:30 AM to 6:59 AM | 1,690 (9.8%) | 1,262 (8.5%) |
| 7:00 AM to 7:29 AM | 2,725 (15.8%) | 2,576 (17.4%) |
| 7:30 AM to 7:59 AM | 2,405 (13.9%) | 2,246 (15.2%) |
| 8:00 AM to 8:29 AM | 2,187 (12.7%) | 2,247 (15.2%) |
| 8:30 AM to 8:59 AM | 1,115 (6.5%) | 1,066 (7.2%) |
| 9:00 AM to 9:59 AM | 957 (5.5%) | 995 (6.7%) |
| 10:00 AM to 10:59 AM | 551 (3.2%) | 565 (3.8%) |
| 11:00 AM to 11:59 AM | 121 (0.7%) | 203 (1.4%) |
| 12:00 PM to 3:59 PM | 1,264 (7.3%) | 600 (4.1%) |
| 4:00 PM to 11:59 PM | 841 (4.9%) | 843 (5.7%) |
| Total | 17,268 (100.0%) | 14,769 (100.0%) |
Housing Occupancy in Broomfield County
Occupancy by Ownership in Broomfield County
Of the total 30,103 dwellings in Broomfield County, owner-occupied units account for 19,247 (63.9%), while renter-occupied units make up 10,856 (36.1%).
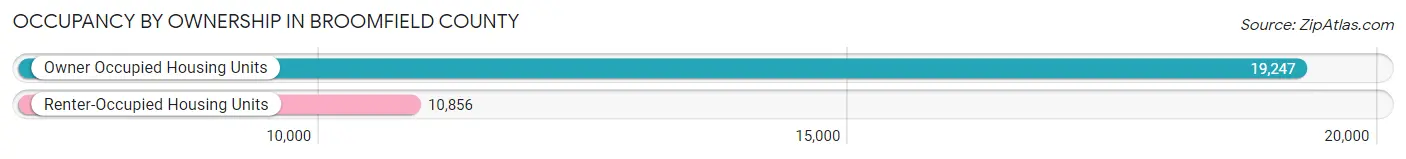
| Occupancy | # Housing Units | % Housing Units |
| Owner Occupied Housing Units | 19,247 | 63.9% |
| Renter-Occupied Housing Units | 10,856 | 36.1% |
| Total Occupied Housing Units | 30,103 | 100.0% |
Occupancy by Household Size in Broomfield County
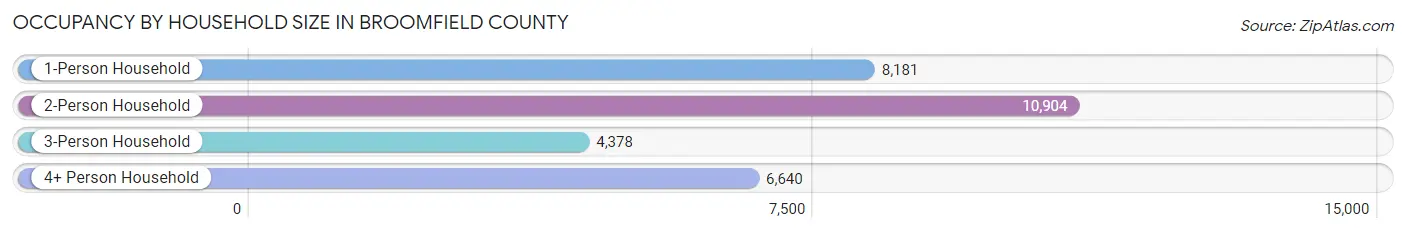
| Household Size | # Housing Units | % Housing Units |
| 1-Person Household | 8,181 | 27.2% |
| 2-Person Household | 10,904 | 36.2% |
| 3-Person Household | 4,378 | 14.5% |
| 4+ Person Household | 6,640 | 22.1% |
| Total Housing Units | 30,103 | 100.0% |
Occupancy by Ownership by Household Size in Broomfield County
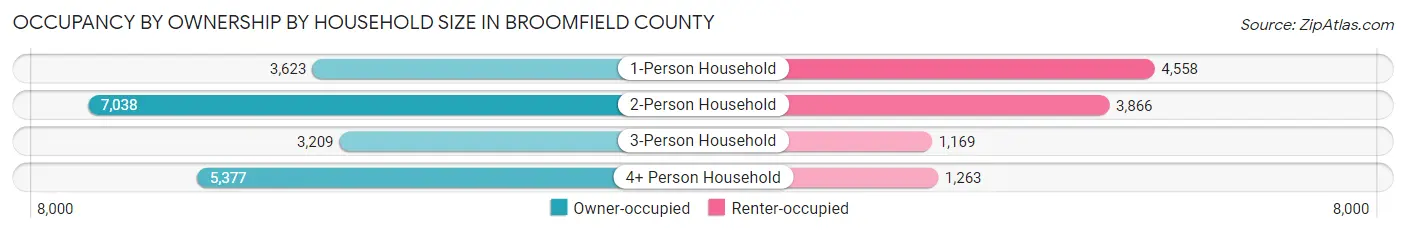
| Household Size | Owner-occupied | Renter-occupied |
| 1-Person Household | 3,623 (44.3%) | 4,558 (55.7%) |
| 2-Person Household | 7,038 (64.5%) | 3,866 (35.4%) |
| 3-Person Household | 3,209 (73.3%) | 1,169 (26.7%) |
| 4+ Person Household | 5,377 (81.0%) | 1,263 (19.0%) |
| Total Housing Units | 19,247 (63.9%) | 10,856 (36.1%) |
Occupancy by Educational Attainment in Broomfield County
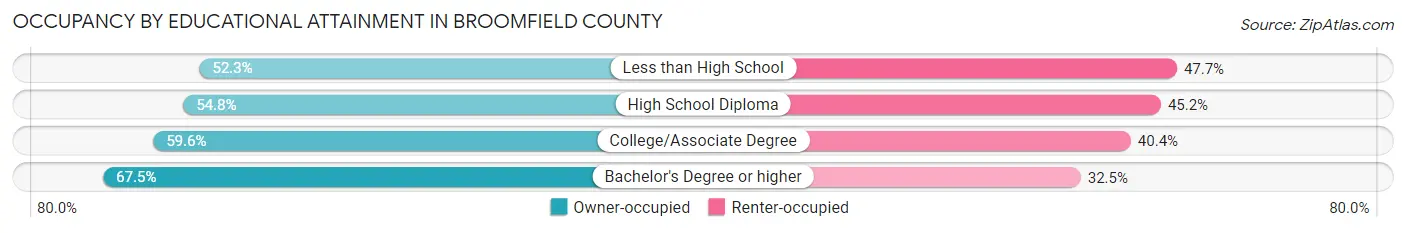
| Household Size | Owner-occupied | Renter-occupied |
| Less than High School | 399 (52.3%) | 364 (47.7%) |
| High School Diploma | 1,663 (54.8%) | 1,370 (45.2%) |
| College/Associate Degree | 4,377 (59.6%) | 2,967 (40.4%) |
| Bachelor's Degree or higher | 12,808 (67.5%) | 6,155 (32.5%) |
Occupancy by Age of Householder in Broomfield County
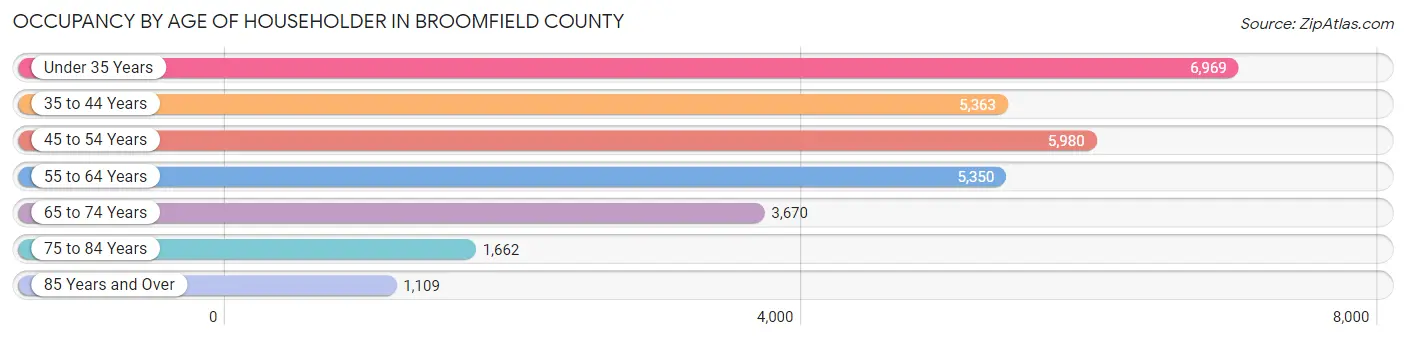
| Age Bracket | # Households | % Households |
| Under 35 Years | 6,969 | 23.2% |
| 35 to 44 Years | 5,363 | 17.8% |
| 45 to 54 Years | 5,980 | 19.9% |
| 55 to 64 Years | 5,350 | 17.8% |
| 65 to 74 Years | 3,670 | 12.2% |
| 75 to 84 Years | 1,662 | 5.5% |
| 85 Years and Over | 1,109 | 3.7% |
| Total | 30,103 | 100.0% |
Housing Finances in Broomfield County
Median Income by Occupancy in Broomfield County
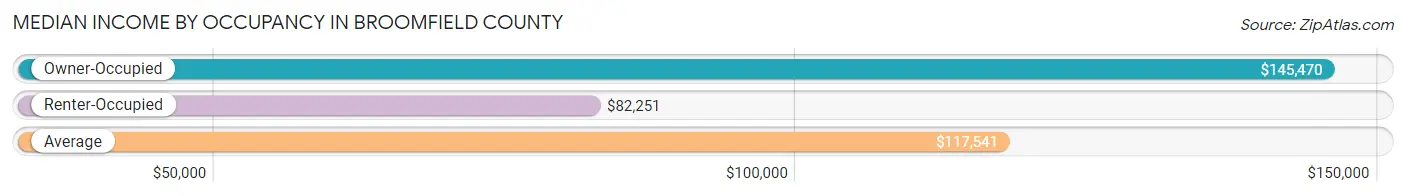
| Occupancy Type | # Households | Median Income |
| Owner-Occupied | 19,247 (63.9%) | $145,470 |
| Renter-Occupied | 10,856 (36.1%) | $82,251 |
| Average | 30,103 (100.0%) | $117,541 |
Occupancy by Householder Income Bracket in Broomfield County
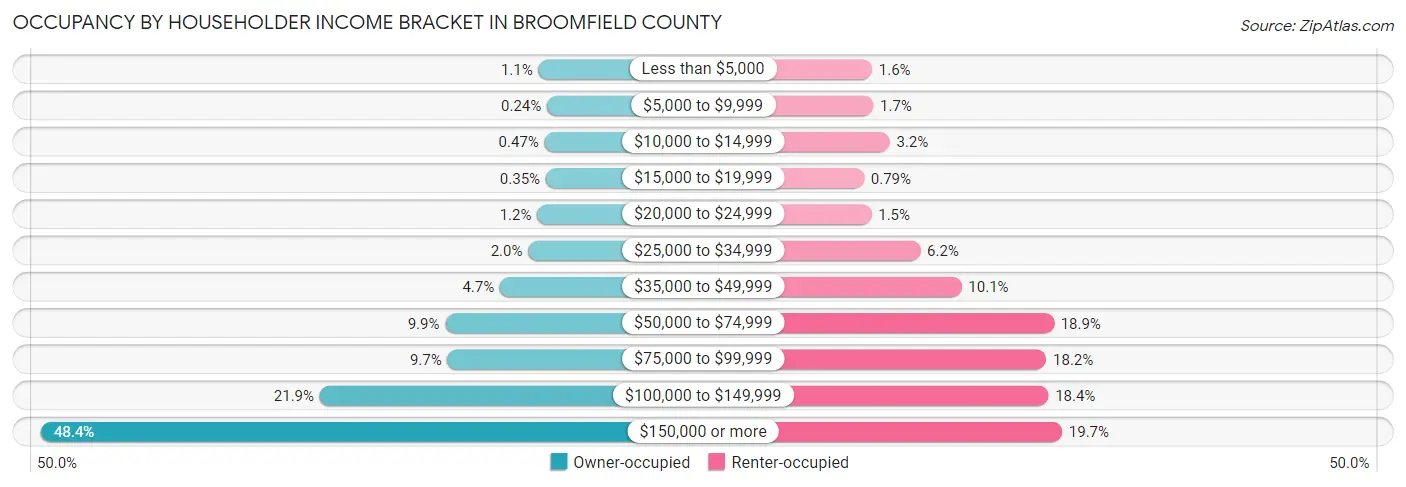
| Income Bracket | Owner-occupied | Renter-occupied |
| Less than $5,000 | 203 (1.1%) | 168 (1.5%) |
| $5,000 to $9,999 | 46 (0.2%) | 181 (1.7%) |
| $10,000 to $14,999 | 90 (0.5%) | 352 (3.2%) |
| $15,000 to $19,999 | 67 (0.4%) | 86 (0.8%) |
| $20,000 to $24,999 | 225 (1.2%) | 163 (1.5%) |
| $25,000 to $34,999 | 391 (2.0%) | 668 (6.1%) |
| $35,000 to $49,999 | 909 (4.7%) | 1,094 (10.1%) |
| $50,000 to $74,999 | 1,911 (9.9%) | 2,049 (18.9%) |
| $75,000 to $99,999 | 1,870 (9.7%) | 1,970 (18.1%) |
| $100,000 to $149,999 | 4,211 (21.9%) | 1,992 (18.3%) |
| $150,000 or more | 9,324 (48.4%) | 2,133 (19.7%) |
| Total | 19,247 (100.0%) | 10,856 (100.0%) |
Monthly Housing Cost Tiers in Broomfield County
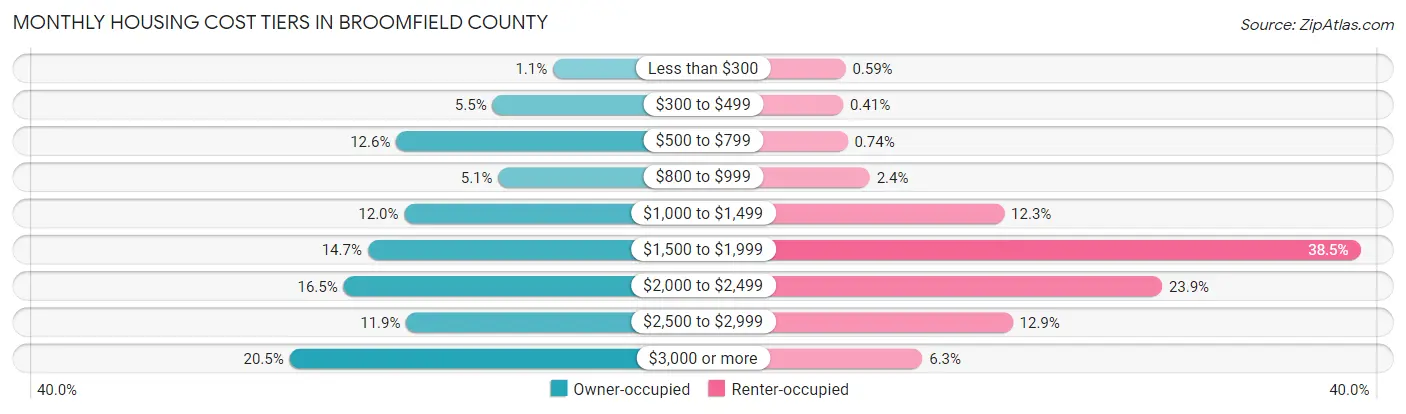
| Monthly Cost | Owner-occupied | Renter-occupied |
| Less than $300 | 207 (1.1%) | 64 (0.6%) |
| $300 to $499 | 1,066 (5.5%) | 45 (0.4%) |
| $500 to $799 | 2,430 (12.6%) | 80 (0.7%) |
| $800 to $999 | 984 (5.1%) | 258 (2.4%) |
| $1,000 to $1,499 | 2,316 (12.0%) | 1,333 (12.3%) |
| $1,500 to $1,999 | 2,835 (14.7%) | 4,181 (38.5%) |
| $2,000 to $2,499 | 3,177 (16.5%) | 2,595 (23.9%) |
| $2,500 to $2,999 | 2,288 (11.9%) | 1,400 (12.9%) |
| $3,000 or more | 3,944 (20.5%) | 678 (6.2%) |
| Total | 19,247 (100.0%) | 10,856 (100.0%) |
Physical Housing Characteristics in Broomfield County
Housing Structures in Broomfield County
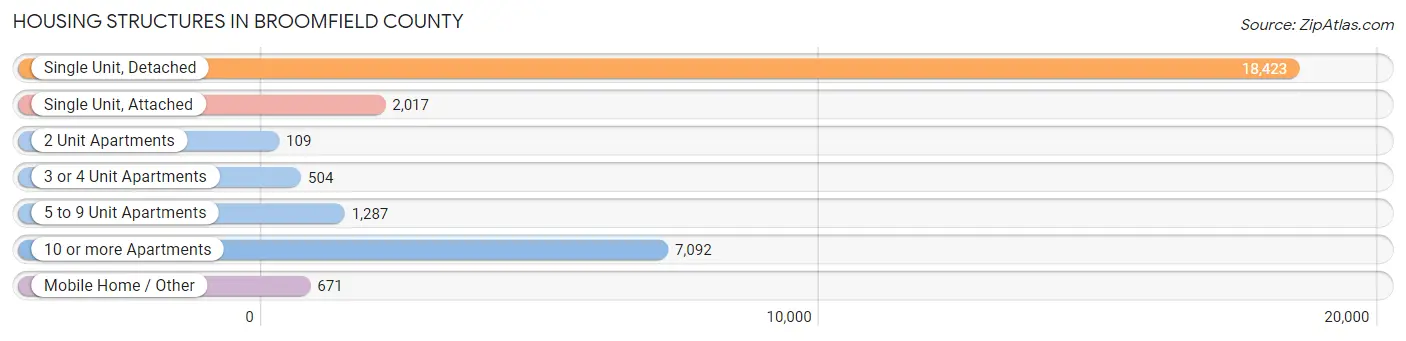
| Structure Type | # Housing Units | % Housing Units |
| Single Unit, Detached | 18,423 | 61.2% |
| Single Unit, Attached | 2,017 | 6.7% |
| 2 Unit Apartments | 109 | 0.4% |
| 3 or 4 Unit Apartments | 504 | 1.7% |
| 5 to 9 Unit Apartments | 1,287 | 4.3% |
| 10 or more Apartments | 7,092 | 23.6% |
| Mobile Home / Other | 671 | 2.2% |
| Total | 30,103 | 100.0% |
Housing Structures by Occupancy in Broomfield County
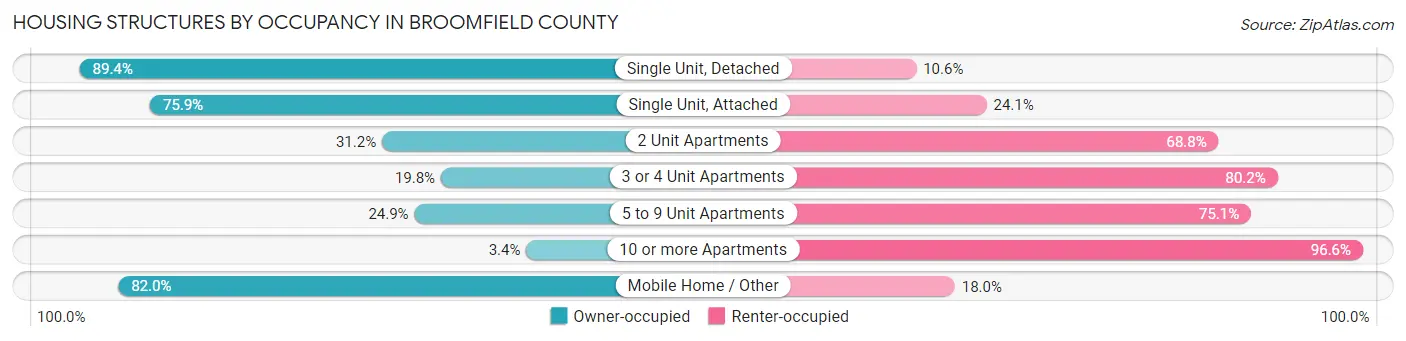
| Structure Type | Owner-occupied | Renter-occupied |
| Single Unit, Detached | 16,470 (89.4%) | 1,953 (10.6%) |
| Single Unit, Attached | 1,530 (75.9%) | 487 (24.1%) |
| 2 Unit Apartments | 34 (31.2%) | 75 (68.8%) |
| 3 or 4 Unit Apartments | 100 (19.8%) | 404 (80.2%) |
| 5 to 9 Unit Apartments | 321 (24.9%) | 966 (75.1%) |
| 10 or more Apartments | 242 (3.4%) | 6,850 (96.6%) |
| Mobile Home / Other | 550 (82.0%) | 121 (18.0%) |
| Total | 19,247 (63.9%) | 10,856 (36.1%) |
Housing Structures by Number of Rooms in Broomfield County
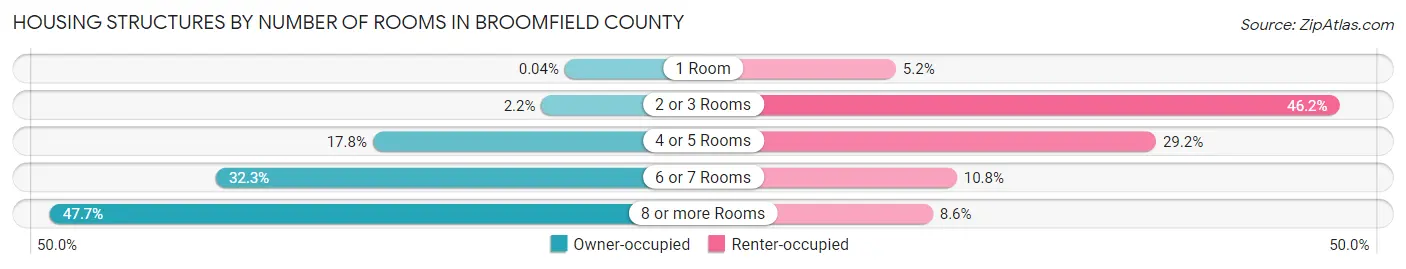
| Number of Rooms | Owner-occupied | Renter-occupied |
| 1 Room | 7 (0.0%) | 562 (5.2%) |
| 2 or 3 Rooms | 425 (2.2%) | 5,014 (46.2%) |
| 4 or 5 Rooms | 3,426 (17.8%) | 3,173 (29.2%) |
| 6 or 7 Rooms | 6,216 (32.3%) | 1,174 (10.8%) |
| 8 or more Rooms | 9,173 (47.7%) | 933 (8.6%) |
| Total | 19,247 (100.0%) | 10,856 (100.0%) |
Housing Structure by Heating Type in Broomfield County
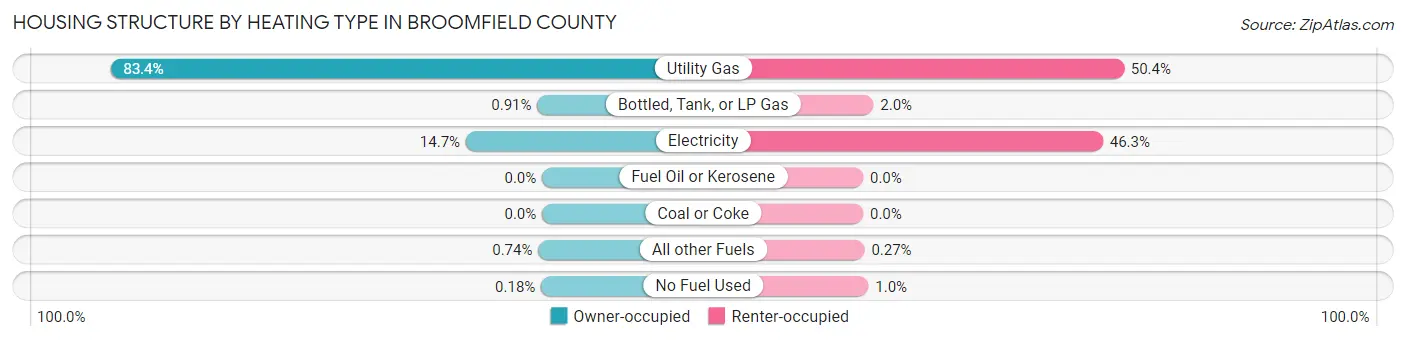
| Heating Type | Owner-occupied | Renter-occupied |
| Utility Gas | 16,060 (83.4%) | 5,469 (50.4%) |
| Bottled, Tank, or LP Gas | 176 (0.9%) | 216 (2.0%) |
| Electricity | 2,834 (14.7%) | 5,030 (46.3%) |
| Fuel Oil or Kerosene | 0 (0.0%) | 0 (0.0%) |
| Coal or Coke | 0 (0.0%) | 0 (0.0%) |
| All other Fuels | 142 (0.7%) | 29 (0.3%) |
| No Fuel Used | 35 (0.2%) | 112 (1.0%) |
| Total | 19,247 (100.0%) | 10,856 (100.0%) |
Household Vehicle Usage in Broomfield County
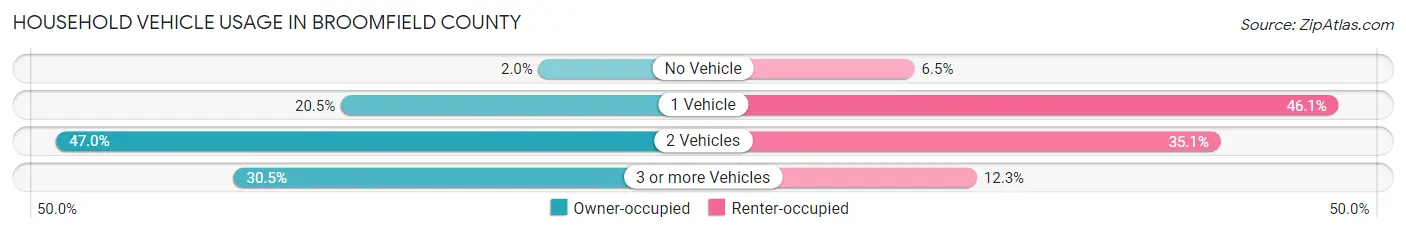
| Vehicles per Household | Owner-occupied | Renter-occupied |
| No Vehicle | 388 (2.0%) | 707 (6.5%) |
| 1 Vehicle | 3,937 (20.5%) | 5,004 (46.1%) |
| 2 Vehicles | 9,054 (47.0%) | 3,808 (35.1%) |
| 3 or more Vehicles | 5,868 (30.5%) | 1,337 (12.3%) |
| Total | 19,247 (100.0%) | 10,856 (100.0%) |
Real Estate & Mortgages in Broomfield County
Real Estate and Mortgage Overview in Broomfield County
| Characteristic | Without Mortgage | With Mortgage |
| Housing Units | 5,378 | 13,869 |
| Median Property Value | $546,200 | $594,100 |
| Median Household Income | $107,515 | $7,615 |
| Monthly Housing Costs | $677 | $3,944 |
| Real Estate Taxes | $3,326 | $134 |
Property Value by Mortgage Status in Broomfield County
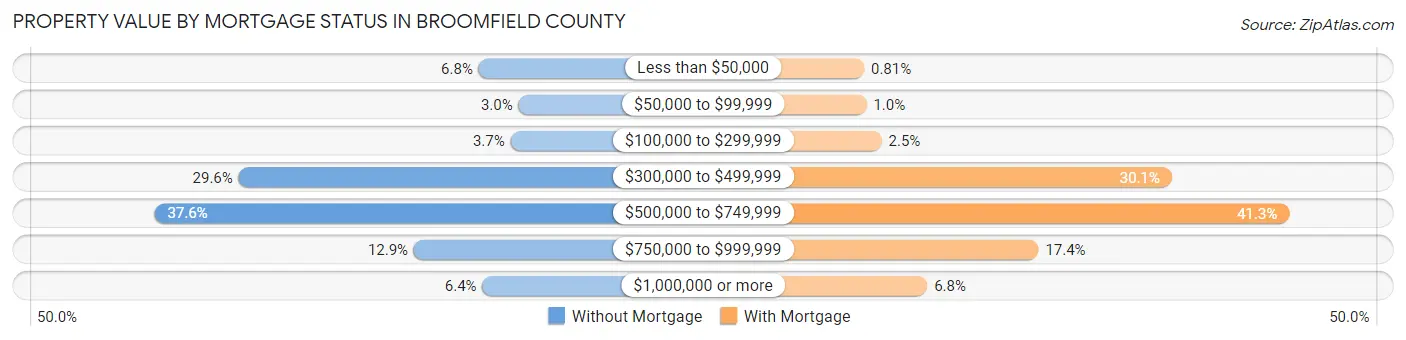
| Property Value | Without Mortgage | With Mortgage |
| Less than $50,000 | 363 (6.8%) | 112 (0.8%) |
| $50,000 to $99,999 | 159 (3.0%) | 144 (1.0%) |
| $100,000 to $299,999 | 200 (3.7%) | 344 (2.5%) |
| $300,000 to $499,999 | 1,593 (29.6%) | 4,178 (30.1%) |
| $500,000 to $749,999 | 2,024 (37.6%) | 5,728 (41.3%) |
| $750,000 to $999,999 | 695 (12.9%) | 2,416 (17.4%) |
| $1,000,000 or more | 344 (6.4%) | 947 (6.8%) |
| Total | 5,378 (100.0%) | 13,869 (100.0%) |
Household Income by Mortgage Status in Broomfield County
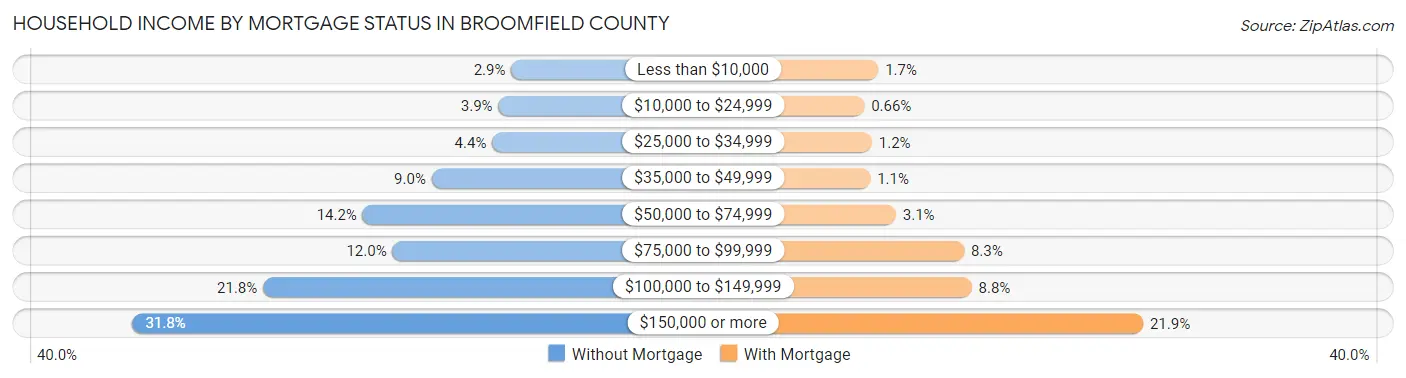
| Household Income | Without Mortgage | With Mortgage |
| Less than $10,000 | 157 (2.9%) | 240 (1.7%) |
| $10,000 to $24,999 | 210 (3.9%) | 92 (0.7%) |
| $25,000 to $34,999 | 235 (4.4%) | 172 (1.2%) |
| $35,000 to $49,999 | 483 (9.0%) | 156 (1.1%) |
| $50,000 to $74,999 | 766 (14.2%) | 426 (3.1%) |
| $75,000 to $99,999 | 644 (12.0%) | 1,145 (8.3%) |
| $100,000 to $149,999 | 1,174 (21.8%) | 1,226 (8.8%) |
| $150,000 or more | 1,709 (31.8%) | 3,037 (21.9%) |
| Total | 5,378 (100.0%) | 13,869 (100.0%) |
Property Value to Household Income Ratio in Broomfield County
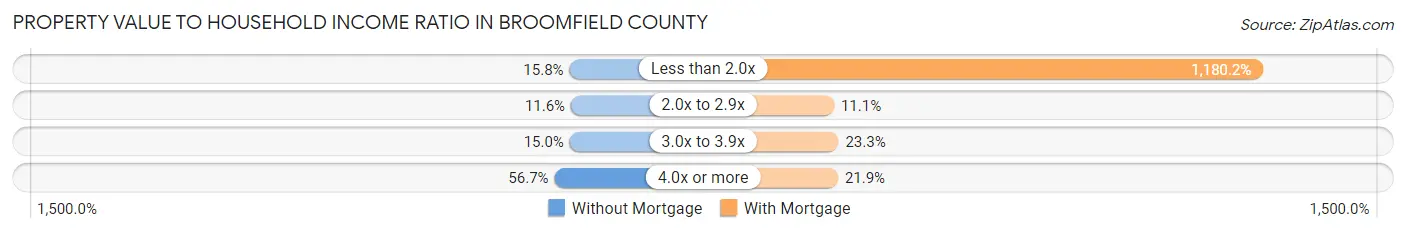
| Value-to-Income Ratio | Without Mortgage | With Mortgage |
| Less than 2.0x | 850 (15.8%) | 163,681 (1,180.2%) |
| 2.0x to 2.9x | 625 (11.6%) | 1,532 (11.1%) |
| 3.0x to 3.9x | 809 (15.0%) | 3,232 (23.3%) |
| 4.0x or more | 3,051 (56.7%) | 3,032 (21.9%) |
| Total | 5,378 (100.0%) | 13,869 (100.0%) |
Real Estate Taxes by Mortgage Status in Broomfield County
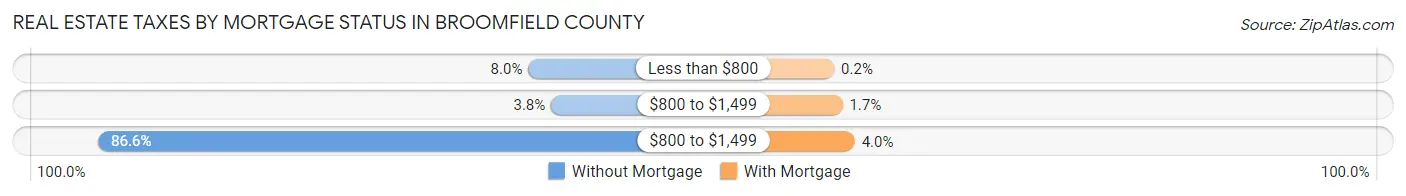
| Property Taxes | Without Mortgage | With Mortgage |
| Less than $800 | 431 (8.0%) | 28 (0.2%) |
| $800 to $1,499 | 206 (3.8%) | 238 (1.7%) |
| $800 to $1,499 | 4,656 (86.6%) | 549 (4.0%) |
| Total | 5,378 (100.0%) | 13,869 (100.0%) |
Health & Disability in Broomfield County
Health Insurance Coverage by Age in Broomfield County
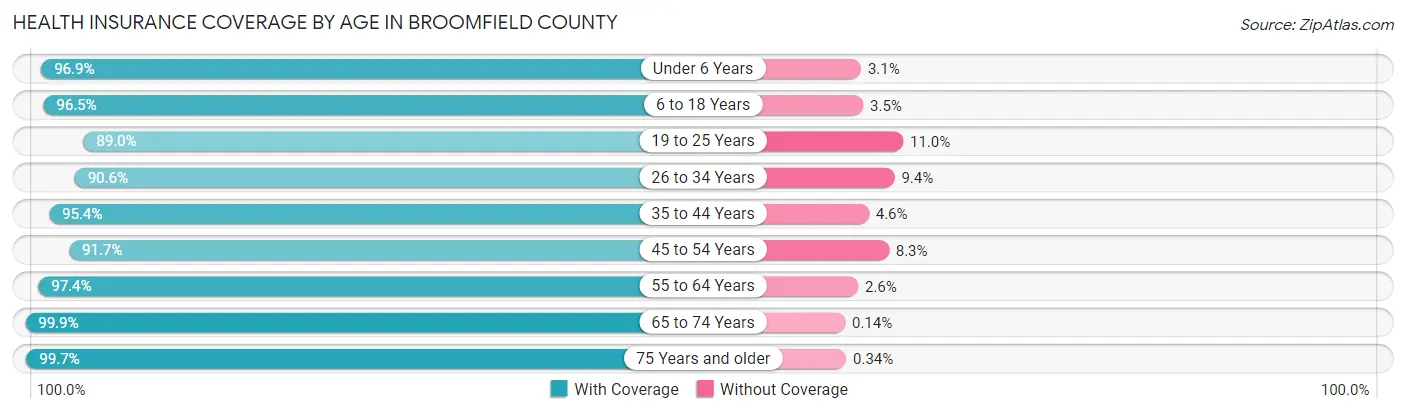
| Age Bracket | With Coverage | Without Coverage |
| Under 6 Years | 4,297 (96.9%) | 138 (3.1%) |
| 6 to 18 Years | 11,925 (96.5%) | 434 (3.5%) |
| 19 to 25 Years | 5,111 (89.0%) | 629 (11.0%) |
| 26 to 34 Years | 9,706 (90.6%) | 1,002 (9.4%) |
| 35 to 44 Years | 10,290 (95.4%) | 493 (4.6%) |
| 45 to 54 Years | 9,418 (91.7%) | 851 (8.3%) |
| 55 to 64 Years | 8,376 (97.4%) | 220 (2.6%) |
| 65 to 74 Years | 6,442 (99.9%) | 9 (0.1%) |
| 75 Years and older | 4,162 (99.7%) | 14 (0.3%) |
| Total | 69,727 (94.8%) | 3,790 (5.2%) |
Health Insurance Coverage by Citizenship Status in Broomfield County
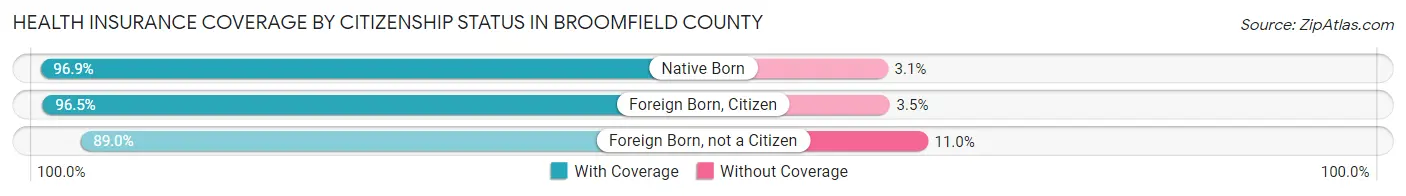
| Citizenship Status | With Coverage | Without Coverage |
| Native Born | 4,297 (96.9%) | 138 (3.1%) |
| Foreign Born, Citizen | 11,925 (96.5%) | 434 (3.5%) |
| Foreign Born, not a Citizen | 5,111 (89.0%) | 629 (11.0%) |
Health Insurance Coverage by Household Income in Broomfield County
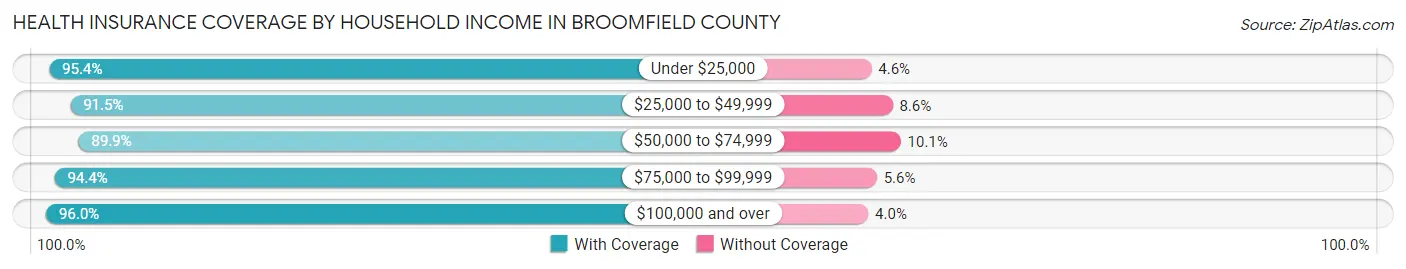
| Household Income | With Coverage | Without Coverage |
| Under $25,000 | 2,054 (95.4%) | 99 (4.6%) |
| $25,000 to $49,999 | 4,868 (91.4%) | 455 (8.6%) |
| $50,000 to $74,999 | 6,884 (89.9%) | 772 (10.1%) |
| $75,000 to $99,999 | 7,599 (94.4%) | 451 (5.6%) |
| $100,000 and over | 48,322 (96.0%) | 2,013 (4.0%) |
Public vs Private Health Insurance Coverage by Age in Broomfield County
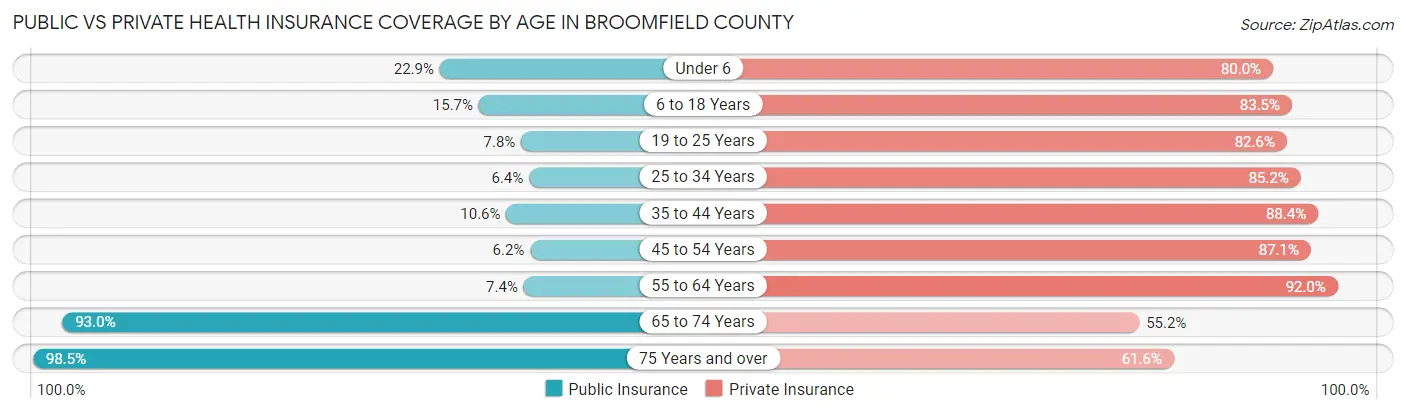
| Age Bracket | Public Insurance | Private Insurance |
| Under 6 | 1,017 (22.9%) | 3,549 (80.0%) |
| 6 to 18 Years | 1,938 (15.7%) | 10,323 (83.5%) |
| 19 to 25 Years | 449 (7.8%) | 4,740 (82.6%) |
| 25 to 34 Years | 680 (6.4%) | 9,120 (85.2%) |
| 35 to 44 Years | 1,141 (10.6%) | 9,532 (88.4%) |
| 45 to 54 Years | 632 (6.1%) | 8,939 (87.1%) |
| 55 to 64 Years | 632 (7.3%) | 7,912 (92.0%) |
| 65 to 74 Years | 6,000 (93.0%) | 3,561 (55.2%) |
| 75 Years and over | 4,112 (98.5%) | 2,573 (61.6%) |
| Total | 16,601 (22.6%) | 60,249 (82.0%) |
Disability Status by Sex by Age in Broomfield County
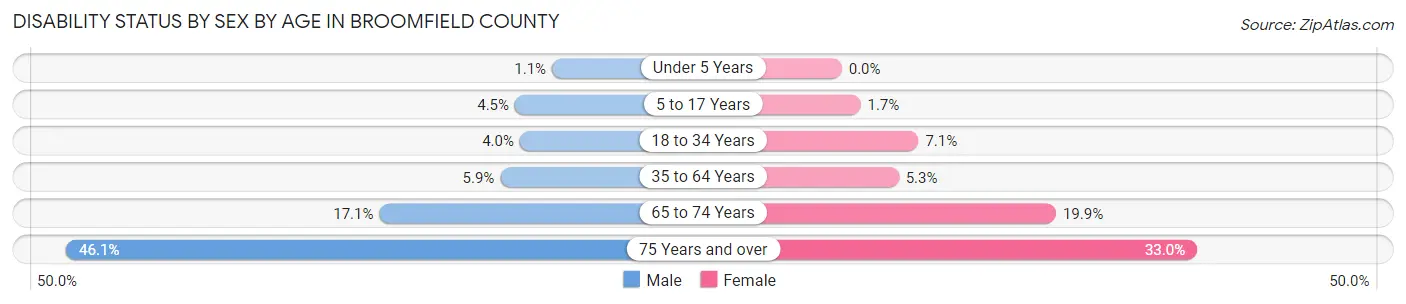
| Age Bracket | Male | Female |
| Under 5 Years | 19 (1.1%) | 0 (0.0%) |
| 5 to 17 Years | 284 (4.5%) | 106 (1.7%) |
| 18 to 34 Years | 368 (4.0%) | 586 (7.1%) |
| 35 to 64 Years | 885 (5.9%) | 768 (5.3%) |
| 65 to 74 Years | 497 (17.1%) | 704 (19.9%) |
| 75 Years and over | 783 (46.1%) | 817 (33.0%) |
Disability Class by Sex by Age in Broomfield County
Disability Class: Hearing Difficulty
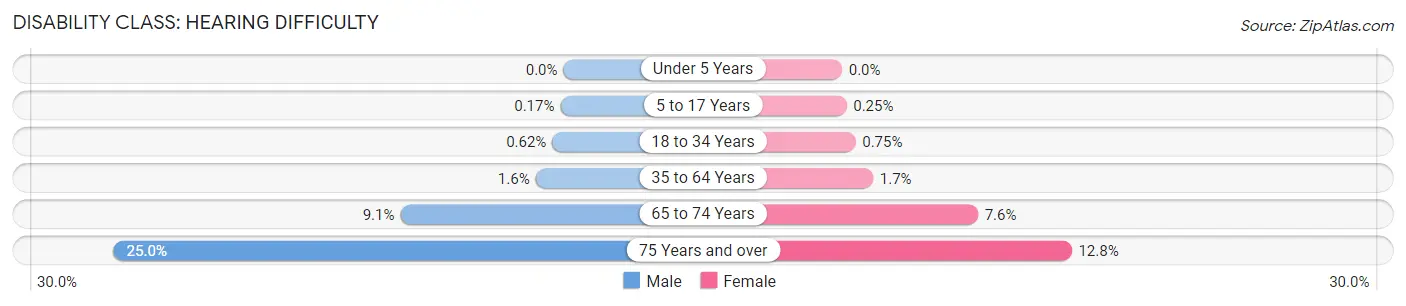
| Age Bracket | Male | Female |
| Under 5 Years | 0 (0.0%) | 0 (0.0%) |
| 5 to 17 Years | 11 (0.2%) | 15 (0.3%) |
| 18 to 34 Years | 56 (0.6%) | 62 (0.7%) |
| 35 to 64 Years | 234 (1.5%) | 252 (1.7%) |
| 65 to 74 Years | 264 (9.1%) | 268 (7.6%) |
| 75 Years and over | 425 (25.0%) | 317 (12.8%) |
Disability Class: Vision Difficulty
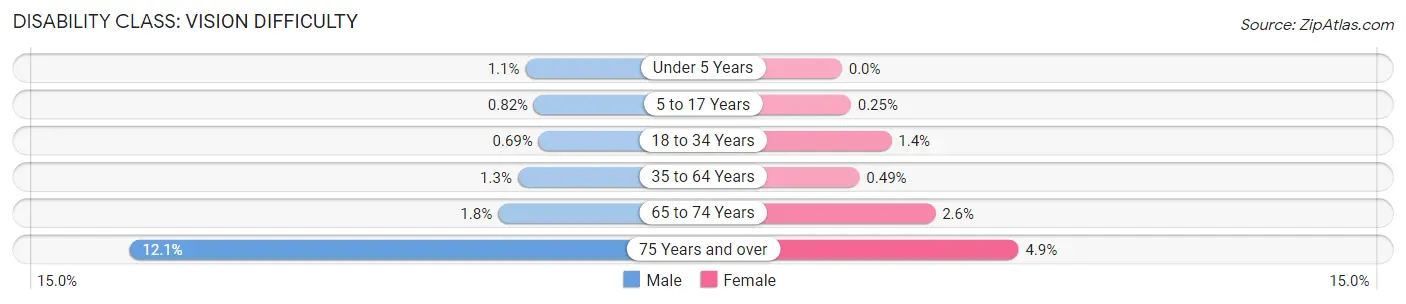
| Age Bracket | Male | Female |
| Under 5 Years | 19 (1.1%) | 0 (0.0%) |
| 5 to 17 Years | 52 (0.8%) | 15 (0.3%) |
| 18 to 34 Years | 63 (0.7%) | 114 (1.4%) |
| 35 to 64 Years | 192 (1.3%) | 71 (0.5%) |
| 65 to 74 Years | 53 (1.8%) | 92 (2.6%) |
| 75 Years and over | 205 (12.1%) | 122 (4.9%) |
Disability Class: Cognitive Difficulty
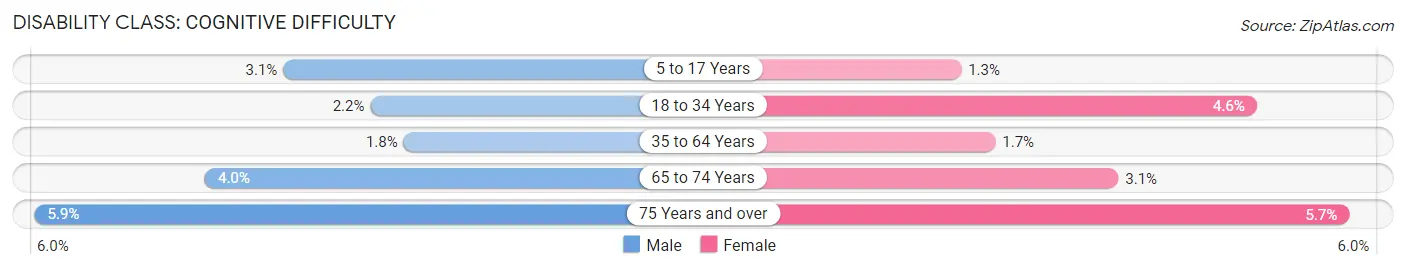
| Age Bracket | Male | Female |
| 5 to 17 Years | 197 (3.1%) | 81 (1.3%) |
| 18 to 34 Years | 196 (2.1%) | 380 (4.6%) |
| 35 to 64 Years | 269 (1.8%) | 249 (1.7%) |
| 65 to 74 Years | 116 (4.0%) | 109 (3.1%) |
| 75 Years and over | 100 (5.9%) | 140 (5.7%) |
Disability Class: Ambulatory Difficulty
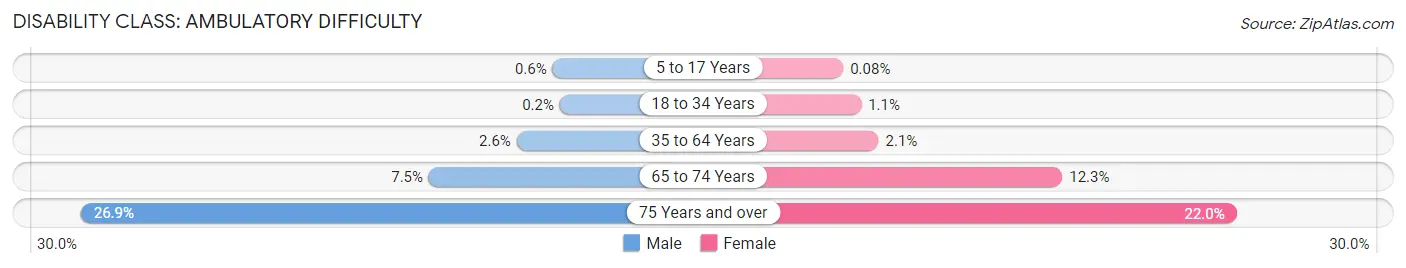
| Age Bracket | Male | Female |
| 5 to 17 Years | 38 (0.6%) | 5 (0.1%) |
| 18 to 34 Years | 18 (0.2%) | 89 (1.1%) |
| 35 to 64 Years | 392 (2.6%) | 298 (2.1%) |
| 65 to 74 Years | 218 (7.5%) | 435 (12.3%) |
| 75 Years and over | 456 (26.9%) | 545 (22.0%) |
Disability Class: Self-Care Difficulty
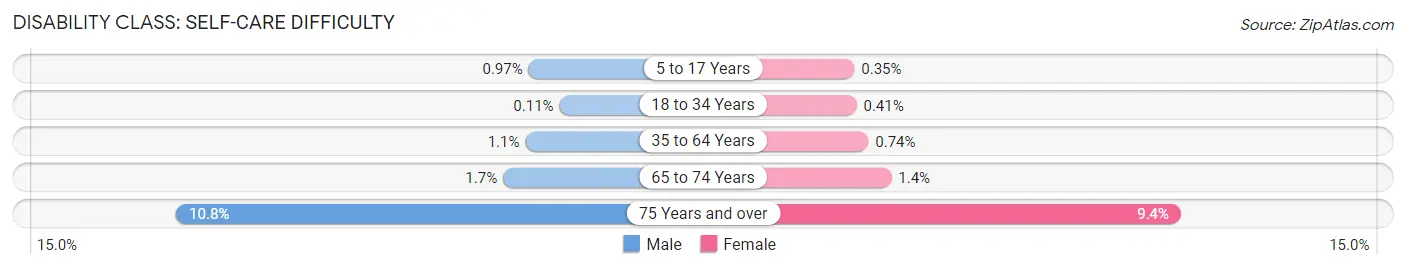
| Age Bracket | Male | Female |
| 5 to 17 Years | 61 (1.0%) | 21 (0.4%) |
| 18 to 34 Years | 10 (0.1%) | 34 (0.4%) |
| 35 to 64 Years | 160 (1.1%) | 107 (0.7%) |
| 65 to 74 Years | 49 (1.7%) | 49 (1.4%) |
| 75 Years and over | 183 (10.8%) | 234 (9.4%) |
Technology Access in Broomfield County
Computing Device Access in Broomfield County
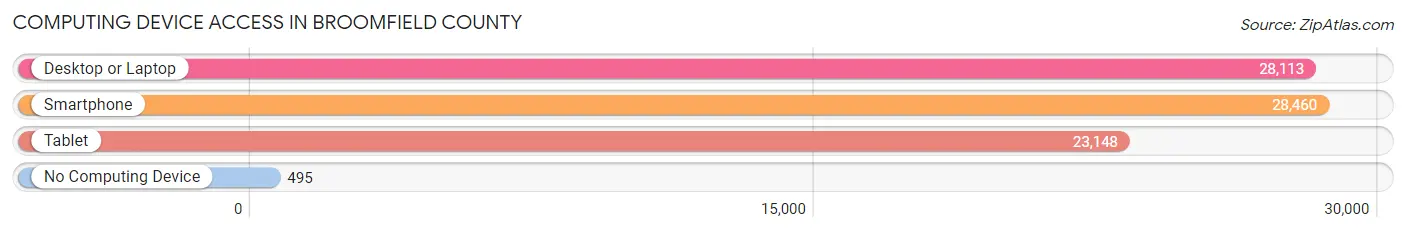
| Device Type | # Households | % Households |
| Desktop or Laptop | 28,113 | 93.4% |
| Smartphone | 28,460 | 94.5% |
| Tablet | 23,148 | 76.9% |
| No Computing Device | 495 | 1.6% |
| Total | 30,103 | 100.0% |
Internet Access in Broomfield County
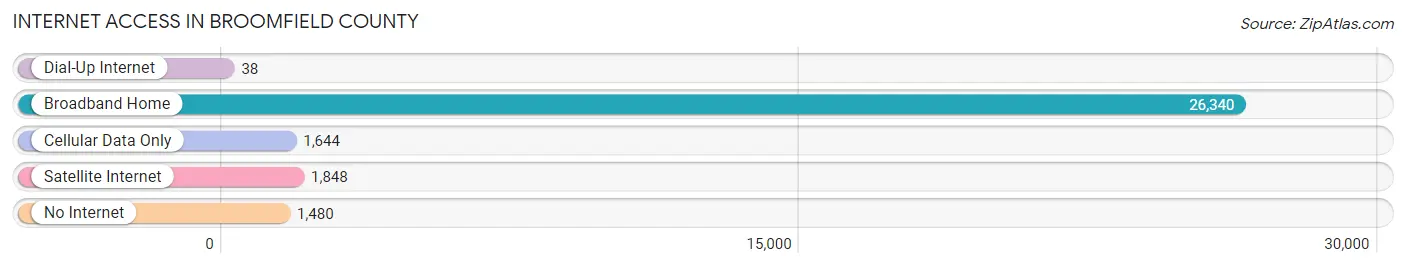
| Internet Type | # Households | % Households |
| Dial-Up Internet | 38 | 0.1% |
| Broadband Home | 26,340 | 87.5% |
| Cellular Data Only | 1,644 | 5.5% |
| Satellite Internet | 1,848 | 6.1% |
| No Internet | 1,480 | 4.9% |
| Total | 30,103 | 100.0% |
Broomfield County Summary
Broomfield County, Colorado is located in the north-central part of the state and is part of the Denver-Aurora-Lakewood Metropolitan Statistical Area. It is the smallest county in Colorado, with an area of only 34 square miles. The county was created in 2001 from parts of Adams, Boulder, Jefferson, and Weld counties. It is bordered by Boulder County to the west, Weld County to the north, Adams County to the east, and Jefferson County to the south.
History
The area that is now Broomfield County was originally inhabited by the Arapaho and Cheyenne Native American tribes. The first European settlers arrived in the area in the mid-1800s, and the area was officially established as Broomfield County in 2001.
The county was named after the town of Broomfield, which was founded in 1874. The town was named after the broomcorn plant, which was used to make brooms. The town was a popular stop on the Denver, South Park, and Pacific Railroad, and it quickly grew into a thriving community.
Geography
Broomfield County is located in the north-central part of Colorado. It is bordered by Boulder County to the west, Weld County to the north, Adams County to the east, and Jefferson County to the south. The county has an area of only 34 square miles, making it the smallest county in Colorado.
The county is located in the foothills of the Rocky Mountains, and it is home to several mountain peaks, including Mount Audubon, Mount Evans, and Mount Bierstadt. The county is also home to several lakes, including Standley Lake, Union Reservoir, and Boulder Reservoir.
Economy
Broomfield County has a diverse economy, with a mix of industries including technology, manufacturing, healthcare, and retail. The county is home to several major employers, including Ball Aerospace, Level 3 Communications, Oracle, and Vail Resorts.
The county is also home to several shopping centers, including the Flatiron Crossing Mall and the Broomfield Town Center. The county is also home to several golf courses, including the Broadlands Golf Course and the Omni Interlocken Golf Course.
Demographics
As of the 2010 census, the population of Broomfield County was 55,889. The population is predominantly white (83.3%), with smaller percentages of Hispanic (7.7%), African American (3.2%), Asian (2.7%), and Native American (0.7%) residents.
The median household income in the county is $90,845, and the median home value is $400,000. The county has a low unemployment rate of 3.2%, and the poverty rate is 6.2%.
Conclusion
Broomfield County is a small county located in the north-central part of Colorado. It was created in 2001 from parts of Adams, Boulder, Jefferson, and Weld counties. The county has a diverse economy, with a mix of industries including technology, manufacturing, healthcare, and retail. The population of the county is predominantly white, with smaller percentages of Hispanic, African American, Asian, and Native American residents. The median household income in the county is $90,845, and the median home value is $400,000. The county has a low unemployment rate of 3.2%, and the poverty rate is 6.2%.
Common Questions
What is the Total Population of Broomfield County?
Total Population of Broomfield County is 73,946.
What is the Total Male Population of Broomfield County?
Total Male Population of Broomfield County is 37,204.
What is the Total Female Population of Broomfield County?
Total Female Population of Broomfield County is 36,742.
What is the Ratio of Males per 100 Females in Broomfield County?
There are 101.26 Males per 100 Females in Broomfield County.
What is the Ratio of Females per 100 Males in Broomfield County?
There are 98.76 Females per 100 Males in Broomfield County.
What is the Median Population Age in Broomfield County?
Median Population Age in Broomfield County is 38.6 Years.
What is the Average Family Size in Broomfield County
Average Family Size in Broomfield County is 3.0 People.
What is the Average Household Size in Broomfield County
Average Household Size in Broomfield County is 2.4 People.
What is Per Capita Income in Broomfield County?
Per Capita income in Broomfield County is $60,862.
What is the Median Family Income in Broomfield County?
Median Family Income in Broomfield County is $154,023.
What is the Median Household income in Broomfield County?
Median Household Income in Broomfield County is $117,541.
What is Income or Wage Gap in Broomfield County?
Income or Wage Gap in Broomfield County is 34.1%.
Women in Broomfield County earn 65.9 cents for every dollar earned by a man.
What is Family Income Deficit in Broomfield County?
Family Income Deficit in Broomfield County is $13,443.
Families that are below poverty line in Broomfield County earn $13,443 less on average than the poverty threshold level.
What is Inequality or Gini Index in Broomfield County?
Inequality or Gini Index in Broomfield County is 0.40.
How Large is the Labor Force in Broomfield County?
There are 43,320 People in the Labor Forcein in Broomfield County.
What is the Percentage of People in the Labor Force in Broomfield County?
71.9% of People are in the Labor Force in Broomfield County.
What is the Unemployment Rate in Broomfield County?
Unemployment Rate in Broomfield County is 3.2%.