Boulder County, CO
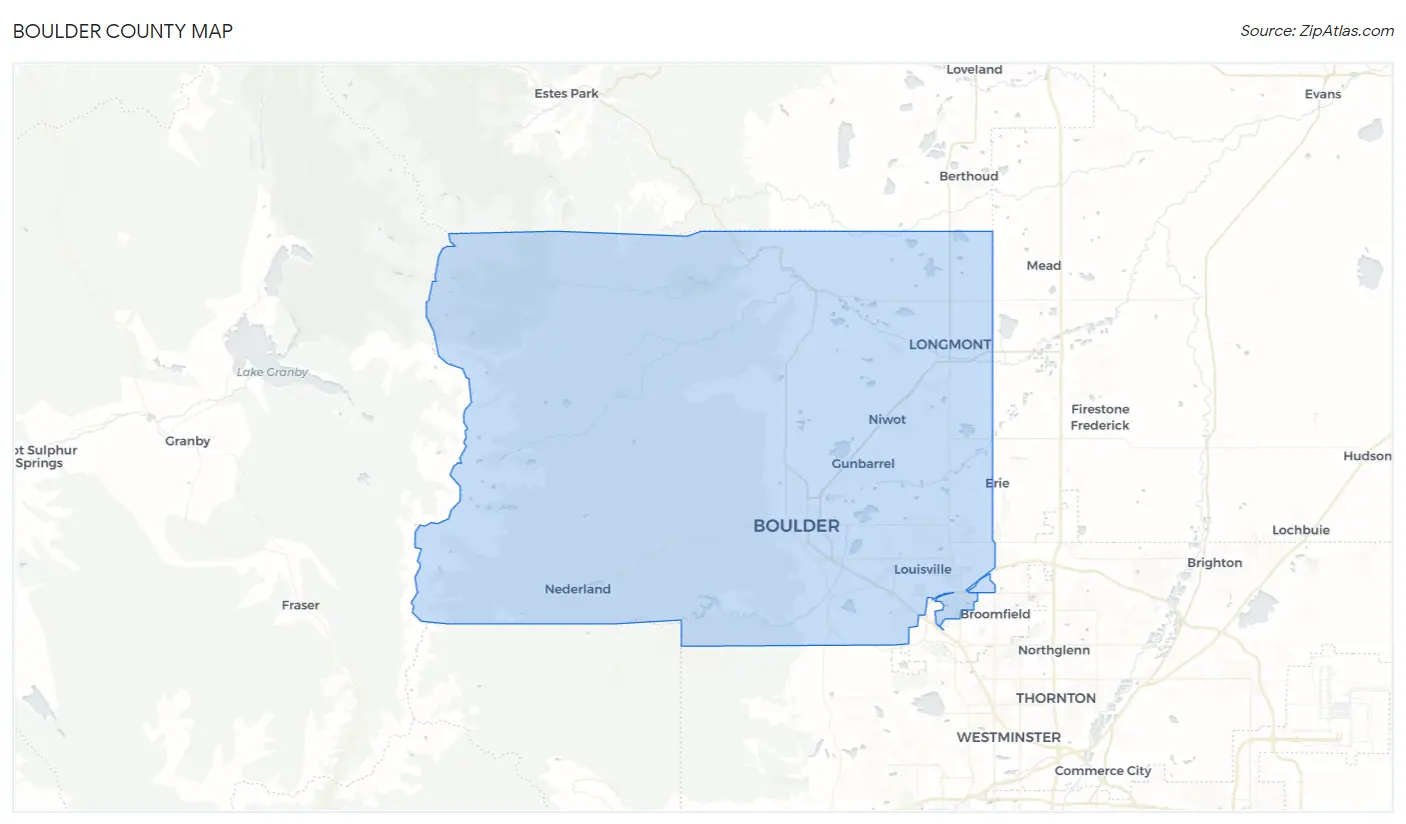
Boulder County Map
Boulder County Overview
328,658
TOTAL POPULATION
166,315
MALE POPULATION
162,343
FEMALE POPULATION
102.45
MALES / 100 FEMALES
97.61
FEMALES / 100 MALES
37.0
MEDIAN AGE
3.0
AVG FAMILY SIZE
2.4
AVG HOUSEHOLD SIZE
$57,339
PER CAPITA INCOME
$136,591
AVG FAMILY INCOME
$99,770
AVG HOUSEHOLD INCOME
38.2%
WAGE / INCOME GAP [ % ]
61.8¢/ $1
WAGE / INCOME GAP [ $ ]
$10,562
FAMILY INCOME DEFICIT
0.49
INEQUALITY / GINI INDEX
186,412
LABOR FORCE [ PEOPLE ]
67.4%
PERCENT IN LABOR FORCE
4.4%
UNEMPLOYMENT RATE
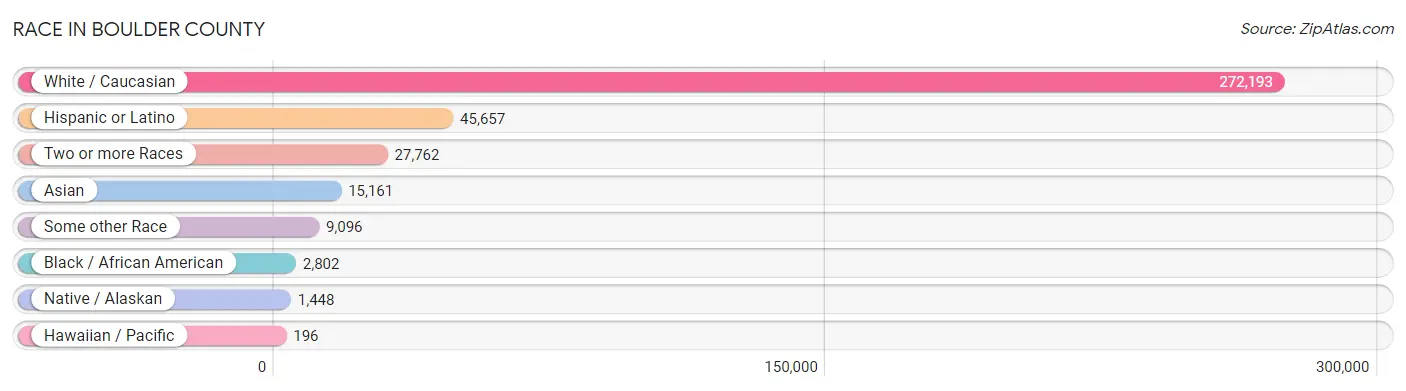
Race in Boulder County
The most populous races in Boulder County are White / Caucasian (272,193 | 82.8%), Hispanic or Latino (45,657 | 13.9%), and Two or more Races (27,762 | 8.5%).
| Race | # Population | % Population |
| Asian | 15,161 | 4.6% |
| Black / African American | 2,802 | 0.9% |
| Hawaiian / Pacific | 196 | 0.1% |
| Hispanic or Latino | 45,657 | 13.9% |
| Native / Alaskan | 1,448 | 0.4% |
| White / Caucasian | 272,193 | 82.8% |
| Two or more Races | 27,762 | 8.5% |
| Some other Race | 9,096 | 2.8% |
| Total | 328,658 | 100.0% |
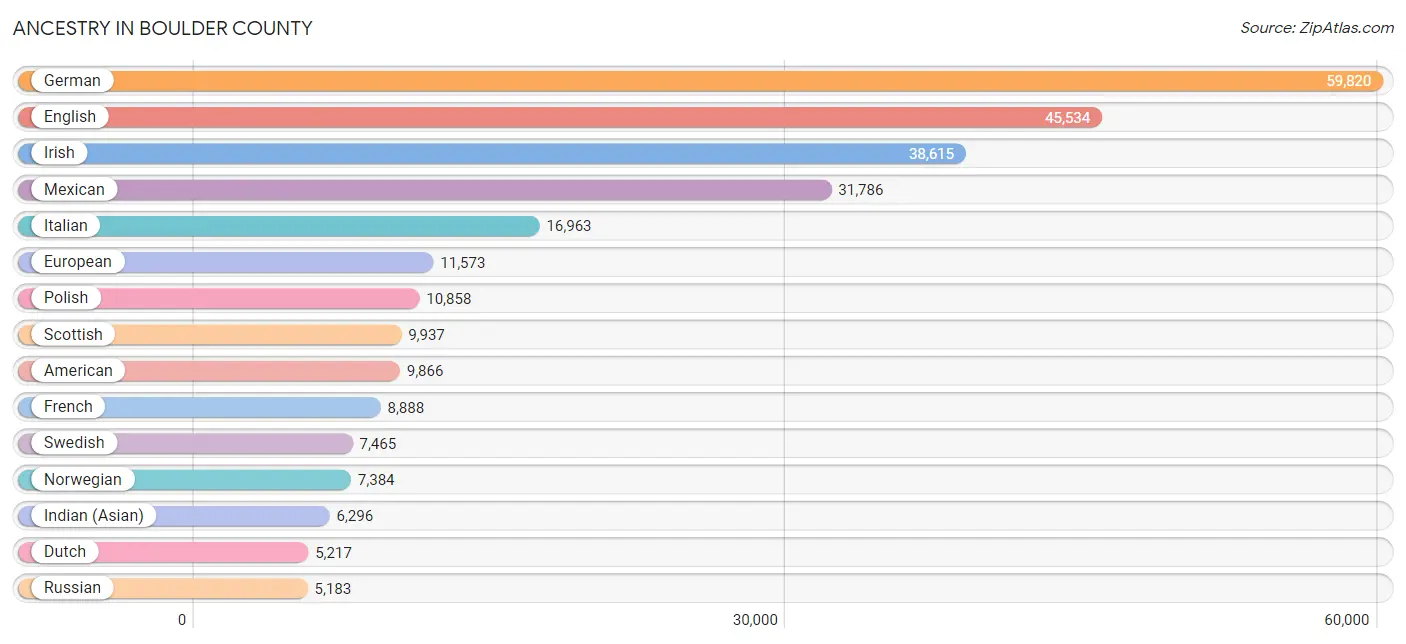
Ancestry in Boulder County
The most populous ancestries reported in Boulder County are German (59,820 | 18.2%), English (45,534 | 13.9%), Irish (38,615 | 11.7%), Mexican (31,786 | 9.7%), and Italian (16,963 | 5.2%), together accounting for 58.6% of all Boulder County residents.
| Ancestry | # Population | % Population |
| Afghan | 61 | 0.0% |
| African | 298 | 0.1% |
| Alaskan Athabascan | 40 | 0.0% |
| Albanian | 94 | 0.0% |
| Alsatian | 29 | 0.0% |
| American | 9,866 | 3.0% |
| Apache | 569 | 0.2% |
| Arab | 1,548 | 0.5% |
| Argentinean | 532 | 0.2% |
| Armenian | 443 | 0.1% |
| Australian | 280 | 0.1% |
| Austrian | 1,774 | 0.5% |
| Bangladeshi | 439 | 0.1% |
| Basque | 127 | 0.0% |
| Belgian | 879 | 0.3% |
| Belizean | 5 | 0.0% |
| Bermudan | 11 | 0.0% |
| Bhutanese | 2,418 | 0.7% |
| Blackfeet | 148 | 0.1% |
| Bolivian | 129 | 0.0% |
| Brazilian | 560 | 0.2% |
| British | 3,885 | 1.2% |
| Bulgarian | 126 | 0.0% |
| Burmese | 2,338 | 0.7% |
| Cajun | 50 | 0.0% |
| Canadian | 1,063 | 0.3% |
| Carpatho Rusyn | 13 | 0.0% |
| Celtic | 211 | 0.1% |
| Central American | 2,637 | 0.8% |
| Central American Indian | 103 | 0.0% |
| Cherokee | 929 | 0.3% |
| Cheyenne | 8 | 0.0% |
| Chickasaw | 21 | 0.0% |
| Chilean | 558 | 0.2% |
| Chinese | 9 | 0.0% |
| Chippewa | 72 | 0.0% |
| Choctaw | 175 | 0.1% |
| Colombian | 775 | 0.2% |
| Comanche | 82 | 0.0% |
| Costa Rican | 87 | 0.0% |
| Creek | 121 | 0.0% |
| Croatian | 614 | 0.2% |
| Cuban | 829 | 0.3% |
| Cypriot | 89 | 0.0% |
| Czech | 2,550 | 0.8% |
| Czechoslovakian | 559 | 0.2% |
| Danish | 3,159 | 1.0% |
| Delaware | 7 | 0.0% |
| Dominican | 100 | 0.0% |
| Dutch | 5,217 | 1.6% |
| Dutch West Indian | 7 | 0.0% |
| Eastern European | 2,268 | 0.7% |
| Ecuadorian | 128 | 0.0% |
| Egyptian | 78 | 0.0% |
| English | 45,534 | 13.9% |
| Estonian | 92 | 0.0% |
| Ethiopian | 299 | 0.1% |
| European | 11,573 | 3.5% |
| Filipino | 386 | 0.1% |
| Finnish | 1,274 | 0.4% |
| French | 8,888 | 2.7% |
| French American Indian | 25 | 0.0% |
| French Canadian | 2,033 | 0.6% |
| German | 59,820 | 18.2% |
| German Russian | 54 | 0.0% |
| Ghanaian | 28 | 0.0% |
| Greek | 1,578 | 0.5% |
| Guamanian / Chamorro | 63 | 0.0% |
| Guatemalan | 518 | 0.2% |
| Haitian | 56 | 0.0% |
| Honduran | 684 | 0.2% |
| Hopi | 12 | 0.0% |
| Hungarian | 1,744 | 0.5% |
| Icelander | 441 | 0.1% |
| Indian (Asian) | 6,296 | 1.9% |
| Indonesian | 20 | 0.0% |
| Iranian | 759 | 0.2% |
| Iraqi | 22 | 0.0% |
| Irish | 38,615 | 11.7% |
| Iroquois | 84 | 0.0% |
| Israeli | 241 | 0.1% |
| Italian | 16,963 | 5.2% |
| Jamaican | 331 | 0.1% |
| Japanese | 345 | 0.1% |
| Jordanian | 27 | 0.0% |
| Kenyan | 16 | 0.0% |
| Korean | 2,096 | 0.6% |
| Laotian | 119 | 0.0% |
| Latvian | 84 | 0.0% |
| Lebanese | 599 | 0.2% |
| Lithuanian | 2,029 | 0.6% |
| Lumbee | 37 | 0.0% |
| Luxembourger | 103 | 0.0% |
| Macedonian | 59 | 0.0% |
| Malaysian | 42 | 0.0% |
| Maltese | 36 | 0.0% |
| Menominee | 34 | 0.0% |
| Mexican | 31,786 | 9.7% |
| Mexican American Indian | 288 | 0.1% |
| Mongolian | 42 | 0.0% |
| Moroccan | 171 | 0.1% |
| Native Hawaiian | 393 | 0.1% |
| Navajo | 196 | 0.1% |
| New Zealander | 85 | 0.0% |
| Nicaraguan | 25 | 0.0% |
| Nigerian | 99 | 0.0% |
| Northern European | 1,432 | 0.4% |
| Norwegian | 7,384 | 2.2% |
| Okinawan | 13 | 0.0% |
| Osage | 6 | 0.0% |
| Pakistani | 355 | 0.1% |
| Palestinian | 25 | 0.0% |
| Panamanian | 152 | 0.1% |
| Paraguayan | 55 | 0.0% |
| Pennsylvania German | 130 | 0.0% |
| Peruvian | 670 | 0.2% |
| Polish | 10,858 | 3.3% |
| Portuguese | 1,177 | 0.4% |
| Potawatomi | 51 | 0.0% |
| Pueblo | 209 | 0.1% |
| Puerto Rican | 1,503 | 0.5% |
| Romanian | 549 | 0.2% |
| Russian | 5,183 | 1.6% |
| Salvadoran | 1,171 | 0.4% |
| Samoan | 69 | 0.0% |
| Scandinavian | 1,863 | 0.6% |
| Scotch-Irish | 4,085 | 1.2% |
| Scottish | 9,937 | 3.0% |
| Seminole | 10 | 0.0% |
| Senegalese | 5 | 0.0% |
| Serbian | 221 | 0.1% |
| Shoshone | 13 | 0.0% |
| Sioux | 393 | 0.1% |
| Slavic | 173 | 0.1% |
| Slovak | 506 | 0.2% |
| Slovene | 253 | 0.1% |
| Somali | 7 | 0.0% |
| South African | 355 | 0.1% |
| South American | 3,172 | 1.0% |
| South American Indian | 21 | 0.0% |
| Spaniard | 1,778 | 0.5% |
| Spanish | 2,284 | 0.7% |
| Spanish American | 44 | 0.0% |
| Sri Lankan | 1,308 | 0.4% |
| Subsaharan African | 1,272 | 0.4% |
| Sudanese | 5 | 0.0% |
| Swedish | 7,465 | 2.3% |
| Swiss | 1,695 | 0.5% |
| Syrian | 25 | 0.0% |
| Thai | 3,664 | 1.1% |
| Tlingit-Haida | 55 | 0.0% |
| Trinidadian and Tobagonian | 45 | 0.0% |
| Turkish | 220 | 0.1% |
| Ukrainian | 1,570 | 0.5% |
| Uruguayan | 154 | 0.1% |
| Ute | 160 | 0.1% |
| Venezuelan | 171 | 0.1% |
| Vietnamese | 36 | 0.0% |
| Welsh | 3,485 | 1.1% |
| West Indian | 64 | 0.0% |
| Yaqui | 12 | 0.0% |
| Yugoslavian | 261 | 0.1% |
| Yuman | 41 | 0.0% | View All 163 Rows |
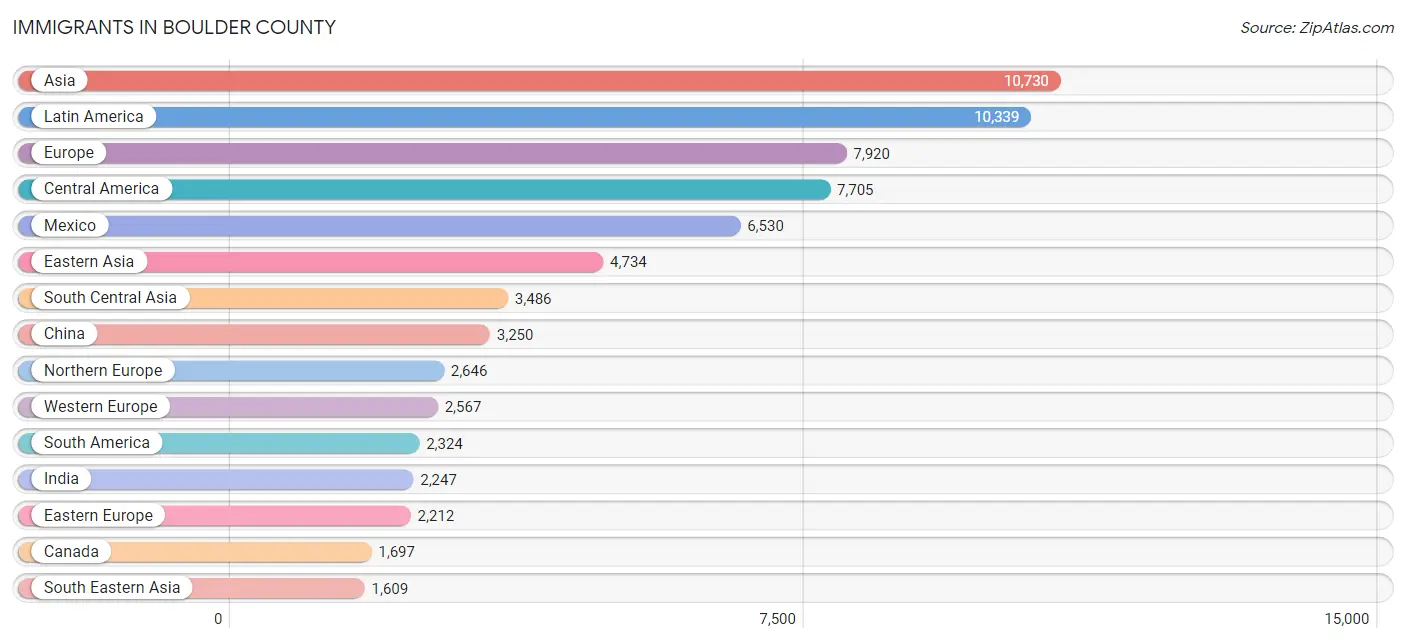
Immigrants in Boulder County
The most numerous immigrant groups reported in Boulder County came from Asia (10,730 | 3.3%), Latin America (10,339 | 3.2%), Europe (7,920 | 2.4%), Central America (7,705 | 2.3%), and Mexico (6,530 | 2.0%), together accounting for 13.2% of all Boulder County residents.
| Immigration Origin | # Population | % Population |
| Africa | 849 | 0.3% |
| Argentina | 428 | 0.1% |
| Asia | 10,730 | 3.3% |
| Australia | 232 | 0.1% |
| Austria | 100 | 0.0% |
| Bangladesh | 44 | 0.0% |
| Barbados | 9 | 0.0% |
| Belgium | 261 | 0.1% |
| Bosnia and Herzegovina | 113 | 0.0% |
| Brazil | 561 | 0.2% |
| Bulgaria | 71 | 0.0% |
| Cambodia | 292 | 0.1% |
| Canada | 1,697 | 0.5% |
| Caribbean | 310 | 0.1% |
| Central America | 7,705 | 2.3% |
| Chile | 219 | 0.1% |
| China | 3,250 | 1.0% |
| Colombia | 400 | 0.1% |
| Costa Rica | 25 | 0.0% |
| Croatia | 23 | 0.0% |
| Cuba | 83 | 0.0% |
| Czechoslovakia | 95 | 0.0% |
| Denmark | 63 | 0.0% |
| Dominica | 6 | 0.0% |
| Dominican Republic | 81 | 0.0% |
| Eastern Africa | 345 | 0.1% |
| Eastern Asia | 4,734 | 1.4% |
| Eastern Europe | 2,212 | 0.7% |
| Ecuador | 89 | 0.0% |
| Egypt | 27 | 0.0% |
| El Salvador | 605 | 0.2% |
| England | 890 | 0.3% |
| Ethiopia | 179 | 0.1% |
| Europe | 7,920 | 2.4% |
| France | 398 | 0.1% |
| Germany | 1,409 | 0.4% |
| Ghana | 13 | 0.0% |
| Greece | 51 | 0.0% |
| Guatemala | 282 | 0.1% |
| Haiti | 35 | 0.0% |
| Honduras | 234 | 0.1% |
| Hong Kong | 92 | 0.0% |
| Hungary | 57 | 0.0% |
| India | 2,247 | 0.7% |
| Indonesia | 63 | 0.0% |
| Iran | 282 | 0.1% |
| Iraq | 12 | 0.0% |
| Ireland | 278 | 0.1% |
| Israel | 224 | 0.1% |
| Italy | 88 | 0.0% |
| Jamaica | 81 | 0.0% |
| Japan | 427 | 0.1% |
| Jordan | 23 | 0.0% |
| Kazakhstan | 15 | 0.0% |
| Kenya | 128 | 0.0% |
| Korea | 1,057 | 0.3% |
| Kuwait | 143 | 0.0% |
| Laos | 61 | 0.0% |
| Latin America | 10,339 | 3.2% |
| Latvia | 14 | 0.0% |
| Lebanon | 150 | 0.1% |
| Liberia | 27 | 0.0% |
| Lithuania | 104 | 0.0% |
| Malaysia | 187 | 0.1% |
| Mexico | 6,530 | 2.0% |
| Morocco | 15 | 0.0% |
| Nepal | 797 | 0.2% |
| Netherlands | 149 | 0.1% |
| Nicaragua | 9 | 0.0% |
| North Macedonia | 27 | 0.0% |
| Northern Africa | 91 | 0.0% |
| Northern Europe | 2,646 | 0.8% |
| Norway | 118 | 0.0% |
| Oceania | 444 | 0.1% |
| Pakistan | 34 | 0.0% |
| Panama | 20 | 0.0% |
| Peru | 353 | 0.1% |
| Philippines | 204 | 0.1% |
| Poland | 270 | 0.1% |
| Portugal | 47 | 0.0% |
| Romania | 94 | 0.0% |
| Russia | 740 | 0.2% |
| Saudi Arabia | 111 | 0.0% |
| Scotland | 133 | 0.0% |
| Serbia | 29 | 0.0% |
| Singapore | 81 | 0.0% |
| South Africa | 252 | 0.1% |
| South America | 2,324 | 0.7% |
| South Central Asia | 3,486 | 1.1% |
| South Eastern Asia | 1,609 | 0.5% |
| Southern Europe | 495 | 0.2% |
| Spain | 309 | 0.1% |
| Sri Lanka | 13 | 0.0% |
| Sudan | 18 | 0.0% |
| Sweden | 149 | 0.1% |
| Switzerland | 250 | 0.1% |
| Syria | 15 | 0.0% |
| Taiwan | 212 | 0.1% |
| Thailand | 214 | 0.1% |
| Turkey | 107 | 0.0% |
| Ukraine | 410 | 0.1% |
| Uruguay | 172 | 0.1% |
| Uzbekistan | 17 | 0.0% |
| Venezuela | 60 | 0.0% |
| Vietnam | 507 | 0.2% |
| Western Africa | 61 | 0.0% |
| Western Asia | 854 | 0.3% |
| Western Europe | 2,567 | 0.8% |
| Zimbabwe | 24 | 0.0% | View All 109 Rows |
Sex and Age in Boulder County
Sex and Age in Boulder County
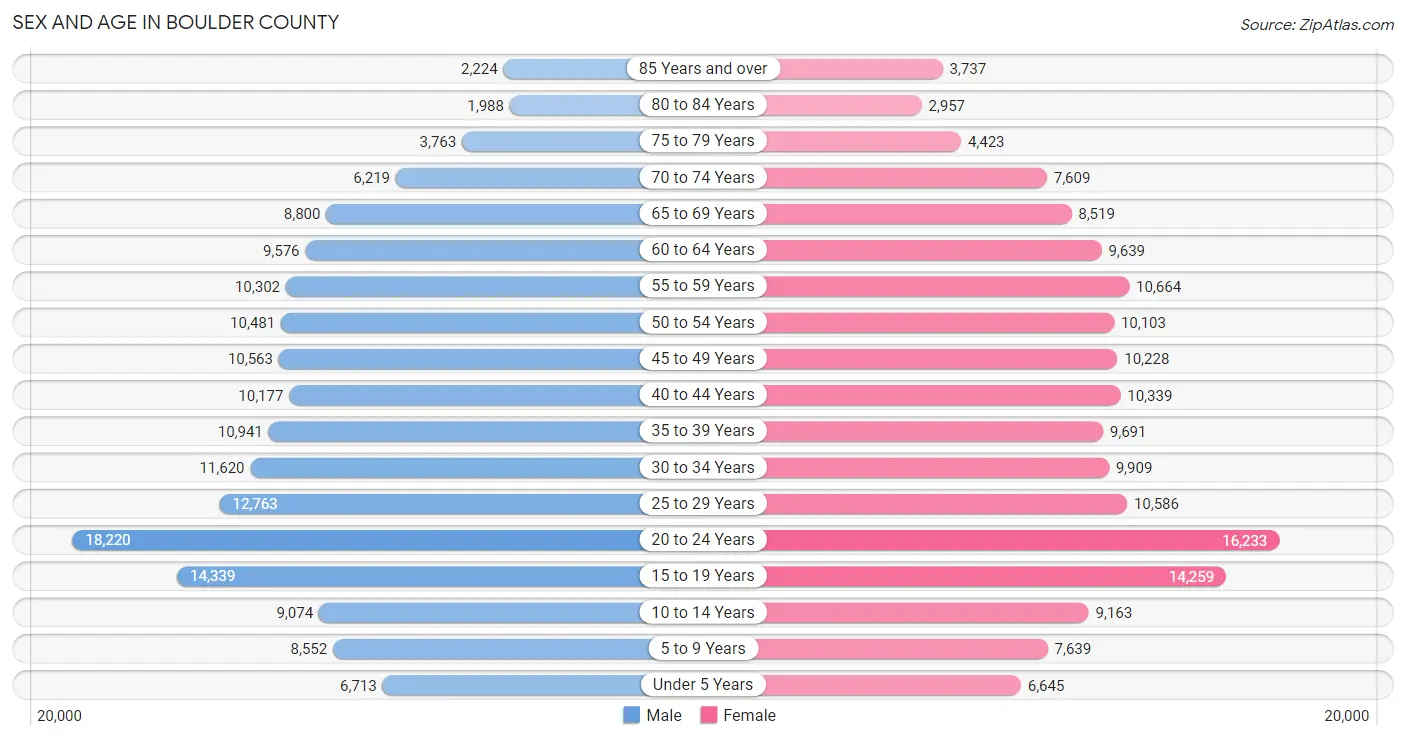
The most populous age groups in Boulder County are 20 to 24 Years (18,220 | 11.0%) for men and 20 to 24 Years (16,233 | 10.0%) for women.
| Age Bracket | Male | Female |
| Under 5 Years | 6,713 (4.0%) | 6,645 (4.1%) |
| 5 to 9 Years | 8,552 (5.1%) | 7,639 (4.7%) |
| 10 to 14 Years | 9,074 (5.5%) | 9,163 (5.6%) |
| 15 to 19 Years | 14,339 (8.6%) | 14,259 (8.8%) |
| 20 to 24 Years | 18,220 (11.0%) | 16,233 (10.0%) |
| 25 to 29 Years | 12,763 (7.7%) | 10,586 (6.5%) |
| 30 to 34 Years | 11,620 (7.0%) | 9,909 (6.1%) |
| 35 to 39 Years | 10,941 (6.6%) | 9,691 (6.0%) |
| 40 to 44 Years | 10,177 (6.1%) | 10,339 (6.4%) |
| 45 to 49 Years | 10,563 (6.4%) | 10,228 (6.3%) |
| 50 to 54 Years | 10,481 (6.3%) | 10,103 (6.2%) |
| 55 to 59 Years | 10,302 (6.2%) | 10,664 (6.6%) |
| 60 to 64 Years | 9,576 (5.8%) | 9,639 (5.9%) |
| 65 to 69 Years | 8,800 (5.3%) | 8,519 (5.2%) |
| 70 to 74 Years | 6,219 (3.7%) | 7,609 (4.7%) |
| 75 to 79 Years | 3,763 (2.3%) | 4,423 (2.7%) |
| 80 to 84 Years | 1,988 (1.2%) | 2,957 (1.8%) |
| 85 Years and over | 2,224 (1.3%) | 3,737 (2.3%) |
| Total | 166,315 (100.0%) | 162,343 (100.0%) |
Families and Households in Boulder County
Median Family Size in Boulder County
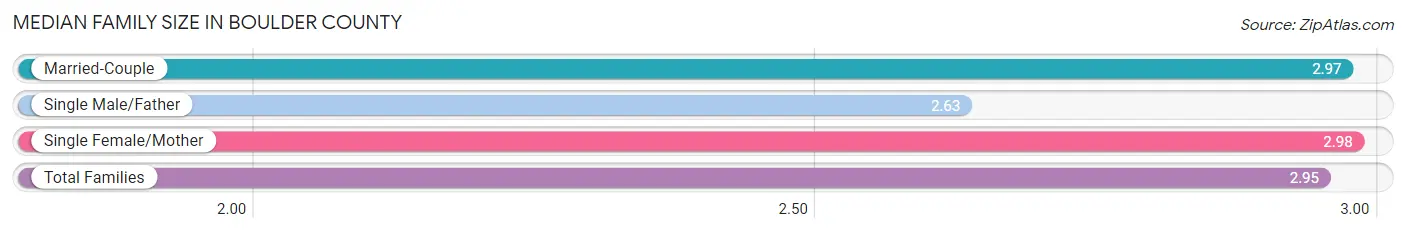
The median family size in Boulder County is 2.95 persons per family, with single female/mother families (9,312 | 12.4%) accounting for the largest median family size of 2.98 persons per family. On the other hand, single male/father families (5,128 | 6.9%) represent the smallest median family size with 2.63 persons per family.
| Family Type | # Families | Family Size |
| Married-Couple | 60,454 (80.7%) | 2.97 |
| Single Male/Father | 5,128 (6.9%) | 2.63 |
| Single Female/Mother | 9,312 (12.4%) | 2.98 |
| Total Families | 74,894 (100.0%) | 2.95 |
Median Household Size in Boulder County
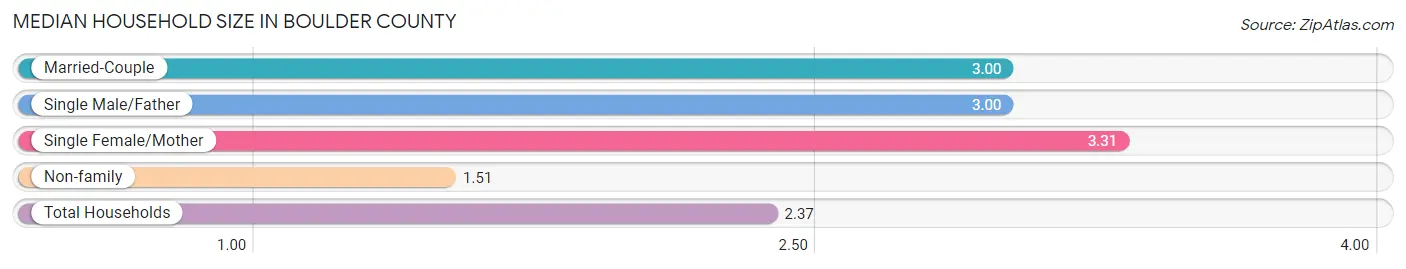
The median household size in Boulder County is 2.37 persons per household, with single female/mother households (9,312 | 7.0%) accounting for the largest median household size of 3.31 persons per household. non-family households (58,496 | 43.9%) represent the smallest median household size with 1.51 persons per household.
| Household Type | # Households | Household Size |
| Married-Couple | 60,454 (45.3%) | 3.00 |
| Single Male/Father | 5,128 (3.8%) | 3.00 |
| Single Female/Mother | 9,312 (7.0%) | 3.31 |
| Non-family | 58,496 (43.9%) | 1.51 |
| Total Households | 133,390 (100.0%) | 2.37 |
Household Size by Marriage Status in Boulder County
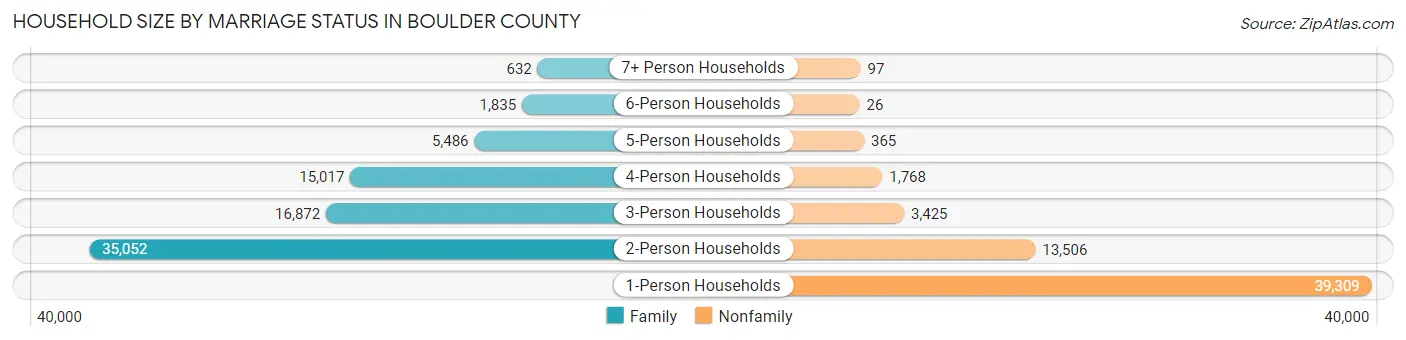
Out of a total of 133,390 households in Boulder County, 74,894 (56.1%) are family households, while 58,496 (43.9%) are nonfamily households. The most numerous type of family households are 2-person households, comprising 35,052, and the most common type of nonfamily households are 1-person households, comprising 39,309.
| Household Size | Family Households | Nonfamily Households |
| 1-Person Households | - | 39,309 (29.5%) |
| 2-Person Households | 35,052 (26.3%) | 13,506 (10.1%) |
| 3-Person Households | 16,872 (12.7%) | 3,425 (2.6%) |
| 4-Person Households | 15,017 (11.3%) | 1,768 (1.3%) |
| 5-Person Households | 5,486 (4.1%) | 365 (0.3%) |
| 6-Person Households | 1,835 (1.4%) | 26 (0.0%) |
| 7+ Person Households | 632 (0.5%) | 97 (0.1%) |
| Total | 74,894 (56.1%) | 58,496 (43.9%) |
Female Fertility in Boulder County
Fertility by Age in Boulder County
Average fertility rate in Boulder County is 36.0 births per 1,000 women. Women in the age bracket of 20 to 34 years have the highest fertility rate with 42.0 births per 1,000 women. Women in the age bracket of 20 to 34 years acount for 52.2% of all women with births.
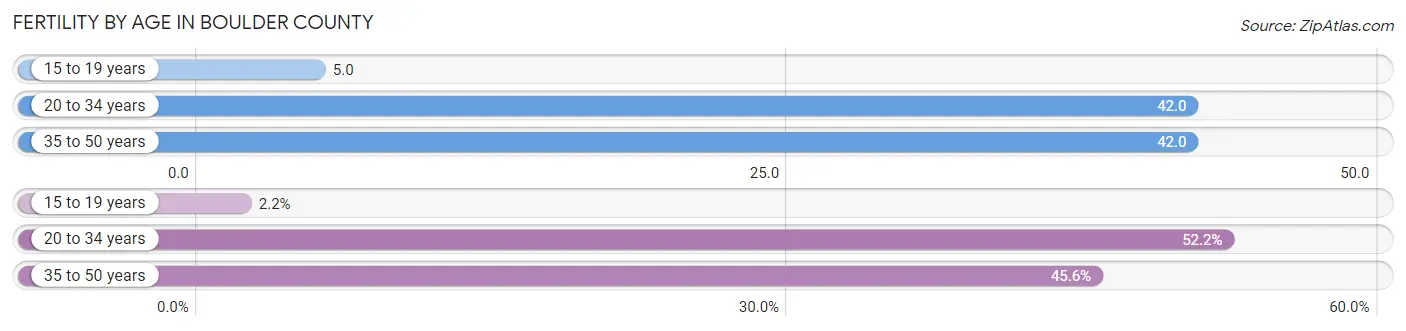
| Age Bracket | Women with Births | Births / 1,000 Women |
| 15 to 19 years | 66 (2.2%) | 5.0 |
| 20 to 34 years | 1,548 (52.2%) | 42.0 |
| 35 to 50 years | 1,350 (45.6%) | 42.0 |
| Total | 2,964 (100.0%) | 36.0 |
Fertility by Age by Marriage Status in Boulder County
81.5% of women with births (2,964) in Boulder County are married. The highest percentage of unmarried women with births falls into 15 to 19 years age bracket with 100.0% of them unmarried at the time of birth, while the lowest percentage of unmarried women with births belong to 35 to 50 years age bracket with 11.3% of them unmarried.
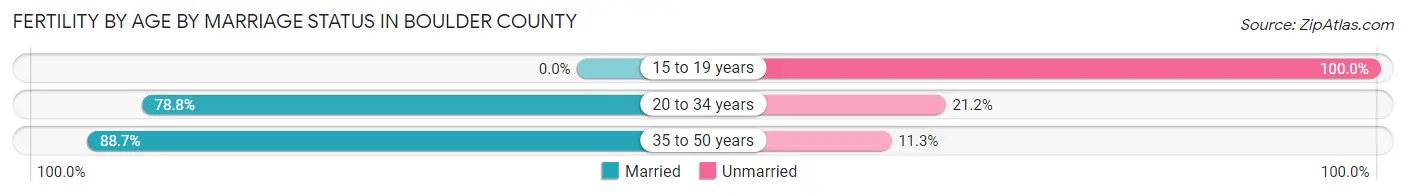
| Age Bracket | Married | Unmarried |
| 15 to 19 years | 0 (0.0%) | 66 (100.0%) |
| 20 to 34 years | 1,220 (78.8%) | 328 (21.2%) |
| 35 to 50 years | 1,197 (88.7%) | 153 (11.3%) |
| Total | 2,416 (81.5%) | 548 (18.5%) |
Fertility by Education in Boulder County
Average fertility rate in Boulder County is 36.0 births per 1,000 women. Women with the education attainment of graduate degree have the highest fertility rate of 63.0 births per 1,000 women, while women with the education attainment of less than high school have the lowest fertility at 13.0 births per 1,000 women. Women with the education attainment of graduate degree represent 32.9% of all women with births.
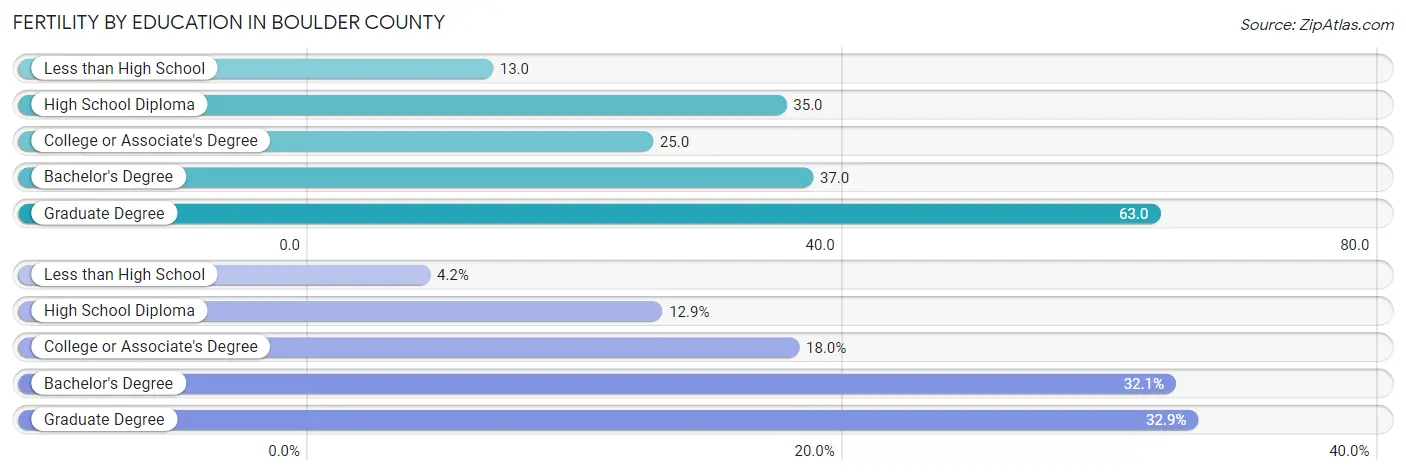
| Educational Attainment | Women with Births | Births / 1,000 Women |
| Less than High School | 123 (4.2%) | 13.0 |
| High School Diploma | 381 (12.9%) | 35.0 |
| College or Associate's Degree | 533 (18.0%) | 25.0 |
| Bachelor's Degree | 951 (32.1%) | 37.0 |
| Graduate Degree | 976 (32.9%) | 63.0 |
| Total | 2,964 (100.0%) | 36.0 |
Fertility by Education by Marriage Status in Boulder County
18.5% of women with births in Boulder County are unmarried. Women with the educational attainment of bachelor's degree are most likely to be married with 97.8% of them married at childbirth, while women with the educational attainment of college or associate's degree are least likely to be married with 54.2% of them unmarried at childbirth.
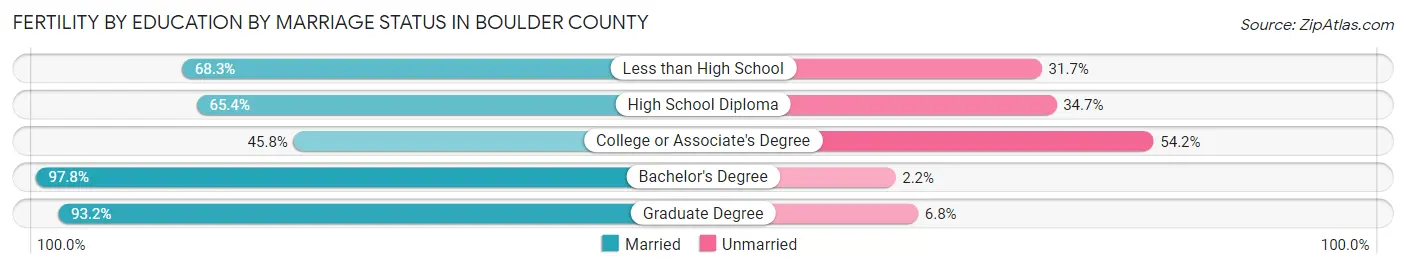
| Educational Attainment | Married | Unmarried |
| Less than High School | 84 (68.3%) | 39 (31.7%) |
| High School Diploma | 249 (65.3%) | 132 (34.6%) |
| College or Associate's Degree | 244 (45.8%) | 289 (54.2%) |
| Bachelor's Degree | 930 (97.8%) | 21 (2.2%) |
| Graduate Degree | 910 (93.2%) | 66 (6.8%) |
| Total | 2,416 (81.5%) | 548 (18.5%) |
Income in Boulder County
Income Overview in Boulder County
Per Capita Income in Boulder County is $57,339, while median incomes of families and households are $136,591 and $99,770 respectively.
| Characteristic | Number | Measure |
| Per Capita Income | 328,658 | $57,339 |
| Median Family Income | 74,894 | $136,591 |
| Mean Family Income | 74,894 | $178,499 |
| Median Household Income | 133,390 | $99,770 |
| Mean Household Income | 133,390 | $139,221 |
| Income Deficit | 74,894 | $10,562 |
| Wage / Income Gap (%) | 328,658 | 38.21% |
| Wage / Income Gap ($) | 328,658 | 61.79¢ per $1 |
| Gini / Inequality Index | 328,658 | 0.49 |
Earnings by Sex in Boulder County
Average Earnings in Boulder County are $44,878, $56,457 for men and $34,885 for women, a difference of 38.2%.
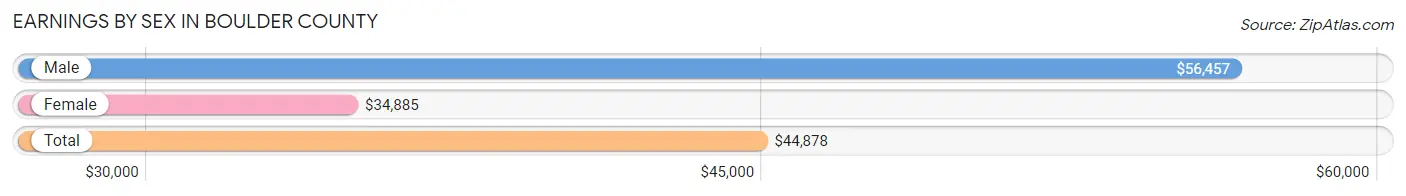
| Sex | Number | Average Earnings |
| Male | 108,441 (53.3%) | $56,457 |
| Female | 94,816 (46.7%) | $34,885 |
| Total | 203,257 (100.0%) | $44,878 |
Earnings by Sex by Income Bracket in Boulder County
The most common earnings brackets in Boulder County are $100,000+ for men (31,613 | 29.1%) and $100,000+ for women (14,206 | 15.0%).
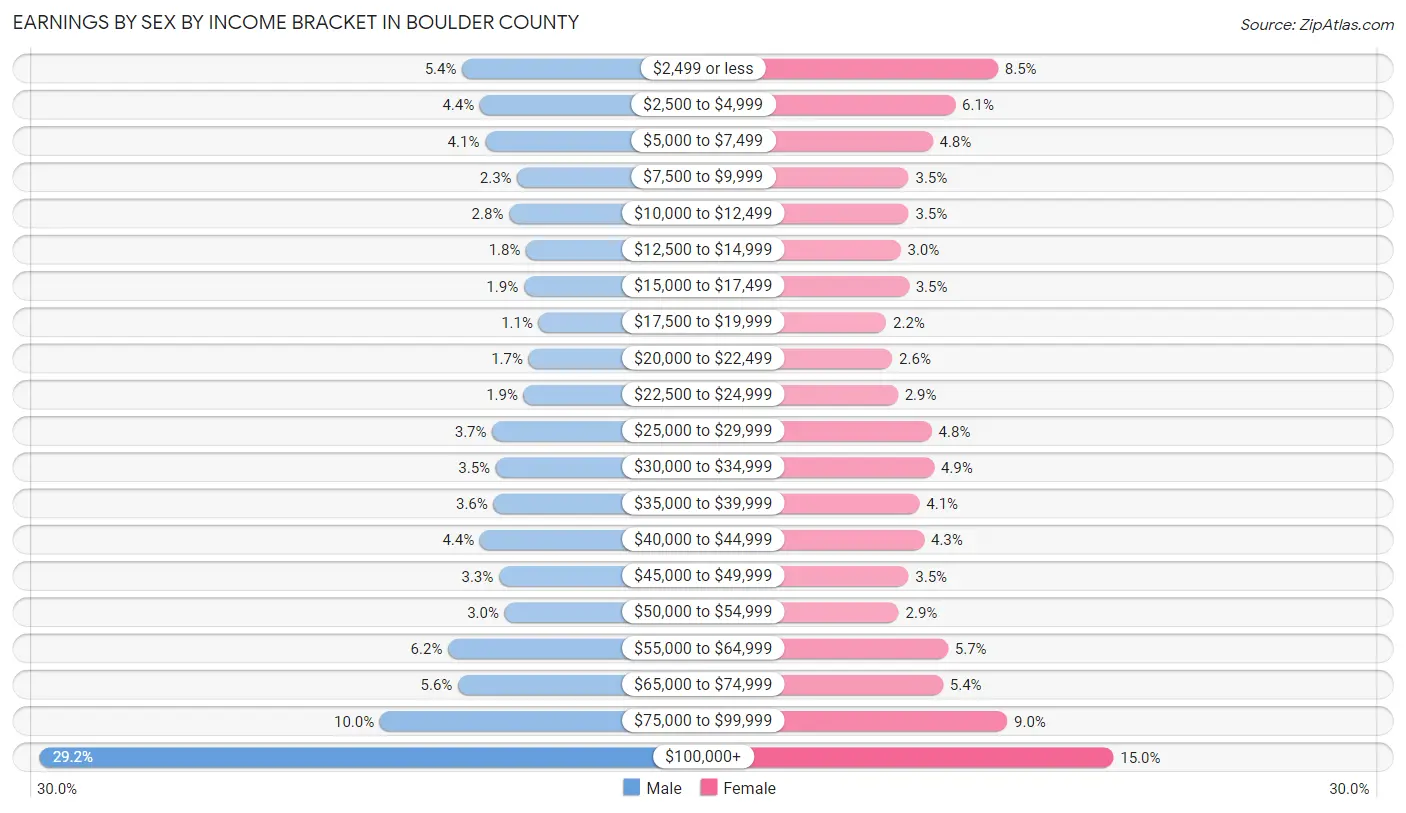
| Income | Male | Female |
| $2,499 or less | 5,858 (5.4%) | 8,048 (8.5%) |
| $2,500 to $4,999 | 4,776 (4.4%) | 5,776 (6.1%) |
| $5,000 to $7,499 | 4,458 (4.1%) | 4,573 (4.8%) |
| $7,500 to $9,999 | 2,493 (2.3%) | 3,294 (3.5%) |
| $10,000 to $12,499 | 2,988 (2.8%) | 3,294 (3.5%) |
| $12,500 to $14,999 | 1,955 (1.8%) | 2,866 (3.0%) |
| $15,000 to $17,499 | 2,091 (1.9%) | 3,297 (3.5%) |
| $17,500 to $19,999 | 1,196 (1.1%) | 2,091 (2.2%) |
| $20,000 to $22,499 | 1,803 (1.7%) | 2,421 (2.5%) |
| $22,500 to $24,999 | 2,106 (1.9%) | 2,711 (2.9%) |
| $25,000 to $29,999 | 4,027 (3.7%) | 4,523 (4.8%) |
| $30,000 to $34,999 | 3,811 (3.5%) | 4,647 (4.9%) |
| $35,000 to $39,999 | 3,950 (3.6%) | 3,865 (4.1%) |
| $40,000 to $44,999 | 4,767 (4.4%) | 4,114 (4.3%) |
| $45,000 to $49,999 | 3,606 (3.3%) | 3,276 (3.5%) |
| $50,000 to $54,999 | 3,267 (3.0%) | 2,759 (2.9%) |
| $55,000 to $64,999 | 6,713 (6.2%) | 5,390 (5.7%) |
| $65,000 to $74,999 | 6,100 (5.6%) | 5,120 (5.4%) |
| $75,000 to $99,999 | 10,863 (10.0%) | 8,545 (9.0%) |
| $100,000+ | 31,613 (29.1%) | 14,206 (15.0%) |
| Total | 108,441 (100.0%) | 94,816 (100.0%) |
Earnings by Sex by Educational Attainment in Boulder County
Average earnings in Boulder County are $72,888 for men and $47,645 for women, a difference of 34.6%. Men with an educational attainment of graduate degree enjoy the highest average annual earnings of $113,048, while those with less than high school education earn the least with $41,416. Women with an educational attainment of graduate degree earn the most with the average annual earnings of $71,246, while those with less than high school education have the smallest earnings of $28,635.
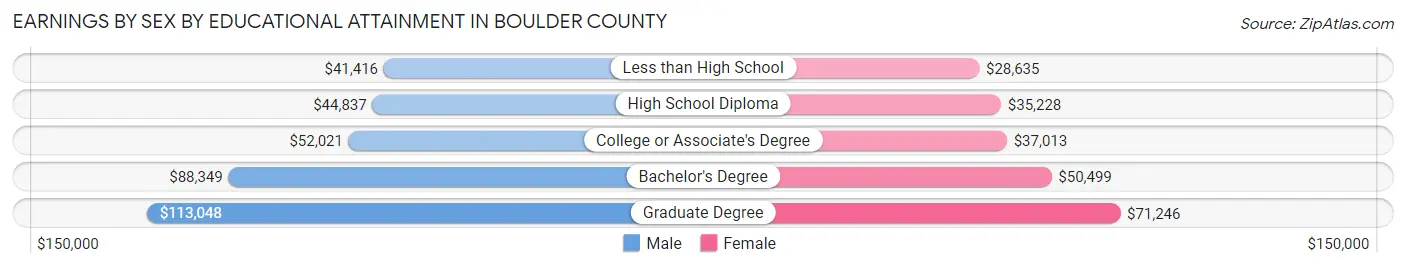
| Educational Attainment | Male Income | Female Income |
| Less than High School | $41,416 | $28,635 |
| High School Diploma | $44,837 | $35,228 |
| College or Associate's Degree | $52,021 | $37,013 |
| Bachelor's Degree | $88,349 | $50,499 |
| Graduate Degree | $113,048 | $71,246 |
| Total | $72,888 | $47,645 |
Family Income in Boulder County
Family Income Brackets in Boulder County
According to the Boulder County family income data, there are 22,019 families falling into the $200,000+ income range, which is the most common income bracket and makes up 29.4% of all families. Conversely, the $10,000 to $14,999 income bracket is the least frequent group with only 524 families (0.7%) belonging to this category.
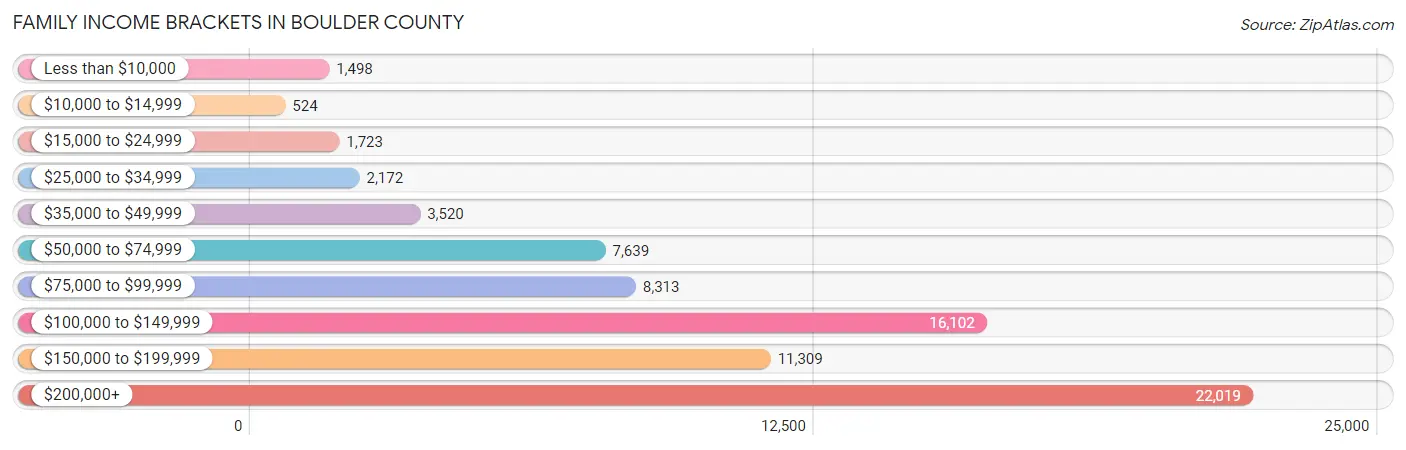
| Income Bracket | # Families | % Families |
| Less than $10,000 | 1,498 | 2.0% |
| $10,000 to $14,999 | 524 | 0.7% |
| $15,000 to $24,999 | 1,723 | 2.3% |
| $25,000 to $34,999 | 2,172 | 2.9% |
| $35,000 to $49,999 | 3,520 | 4.7% |
| $50,000 to $74,999 | 7,639 | 10.2% |
| $75,000 to $99,999 | 8,313 | 11.1% |
| $100,000 to $149,999 | 16,102 | 21.5% |
| $150,000 to $199,999 | 11,309 | 15.1% |
| $200,000+ | 22,019 | 29.4% |
Family Income by Famaliy Size in Boulder County
4-person families (14,299 | 19.1%) account for the highest median family income in Boulder County with $180,384 per family, while 2-person families (37,914 | 50.6%) have the highest median income of $58,776 per family member.
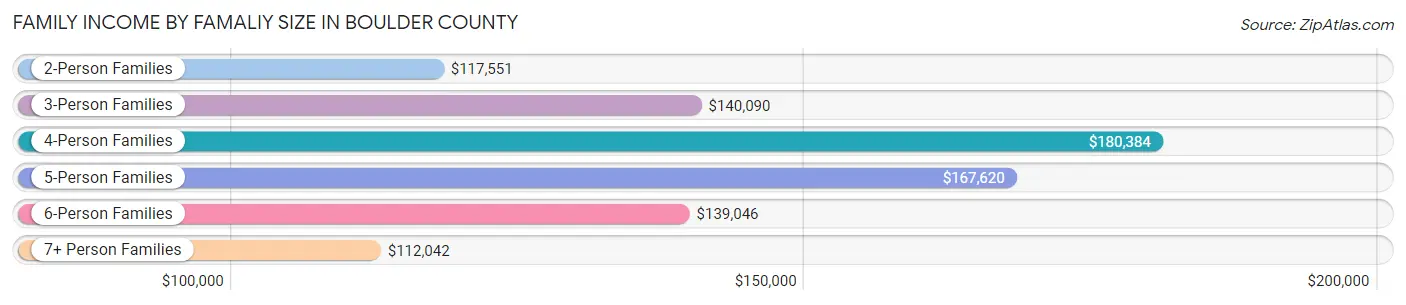
| Income Bracket | # Families | Median Income |
| 2-Person Families | 37,914 (50.6%) | $117,551 |
| 3-Person Families | 15,884 (21.2%) | $140,090 |
| 4-Person Families | 14,299 (19.1%) | $180,384 |
| 5-Person Families | 4,761 (6.4%) | $167,620 |
| 6-Person Families | 1,489 (2.0%) | $139,046 |
| 7+ Person Families | 547 (0.7%) | $112,042 |
| Total | 74,894 (100.0%) | $136,591 |
Family Income by Number of Earners in Boulder County
The median family income in Boulder County is $136,591, with families comprising 3+ earners (8,214) having the highest median family income of $178,941, while families with no earners (8,760) have the lowest median family income of $88,864, accounting for 11.0% and 11.7% of families, respectively.
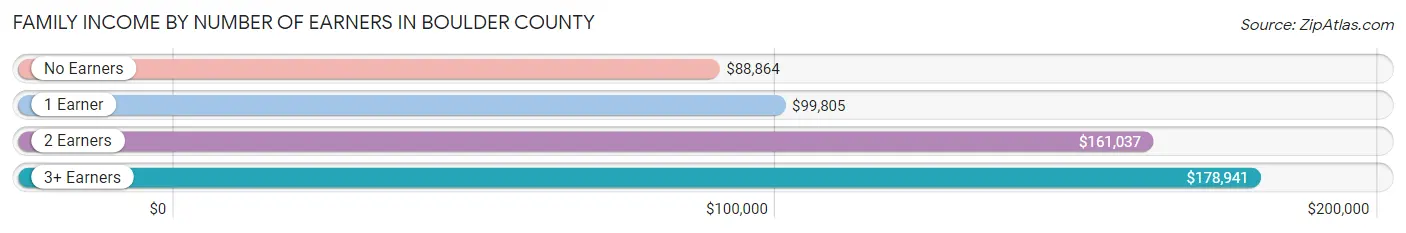
| Number of Earners | # Families | Median Income |
| No Earners | 8,760 (11.7%) | $88,864 |
| 1 Earner | 21,295 (28.4%) | $99,805 |
| 2 Earners | 36,625 (48.9%) | $161,037 |
| 3+ Earners | 8,214 (11.0%) | $178,941 |
| Total | 74,894 (100.0%) | $136,591 |
Household Income in Boulder County
Household Income Brackets in Boulder County
With 27,345 households falling in the category, the $200,000+ income range is the most frequent in Boulder County, accounting for 20.5% of all households. In contrast, only 3,068 households (2.3%) fall into the $10,000 to $14,999 income bracket, making it the least populous group.
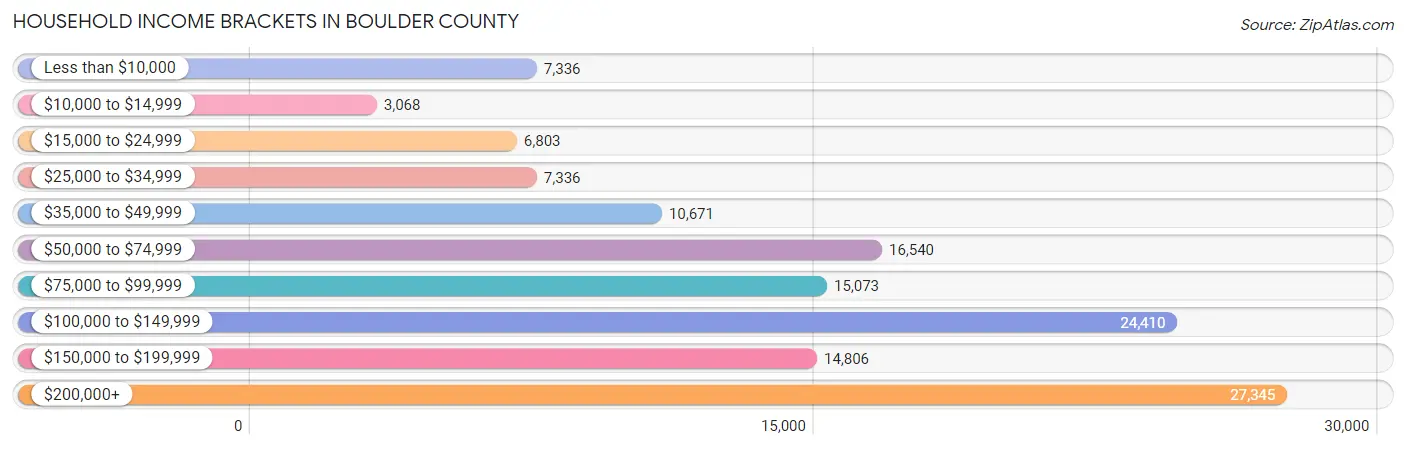
| Income Bracket | # Households | % Households |
| Less than $10,000 | 7,336 | 5.5% |
| $10,000 to $14,999 | 3,068 | 2.3% |
| $15,000 to $24,999 | 6,803 | 5.1% |
| $25,000 to $34,999 | 7,336 | 5.5% |
| $35,000 to $49,999 | 10,671 | 8.0% |
| $50,000 to $74,999 | 16,540 | 12.4% |
| $75,000 to $99,999 | 15,073 | 11.3% |
| $100,000 to $149,999 | 24,410 | 18.3% |
| $150,000 to $199,999 | 14,806 | 11.1% |
| $200,000+ | 27,345 | 20.5% |
Household Income by Householder Age in Boulder County
The median household income in Boulder County is $99,770, with the highest median household income of $134,158 found in the 45 to 64 years age bracket for the primary householder. A total of 45,915 households (34.4%) fall into this category. Meanwhile, the 15 to 24 years age bracket for the primary householder has the lowest median household income of $28,574, with 11,912 households (8.9%) in this group.
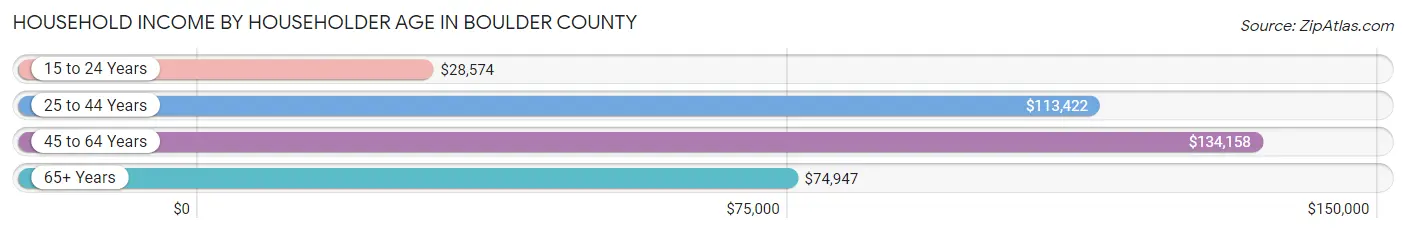
| Income Bracket | # Households | Median Income |
| 15 to 24 Years | 11,912 (8.9%) | $28,574 |
| 25 to 44 Years | 42,653 (32.0%) | $113,422 |
| 45 to 64 Years | 45,915 (34.4%) | $134,158 |
| 65+ Years | 32,910 (24.7%) | $74,947 |
| Total | 133,390 (100.0%) | $99,770 |
Poverty in Boulder County
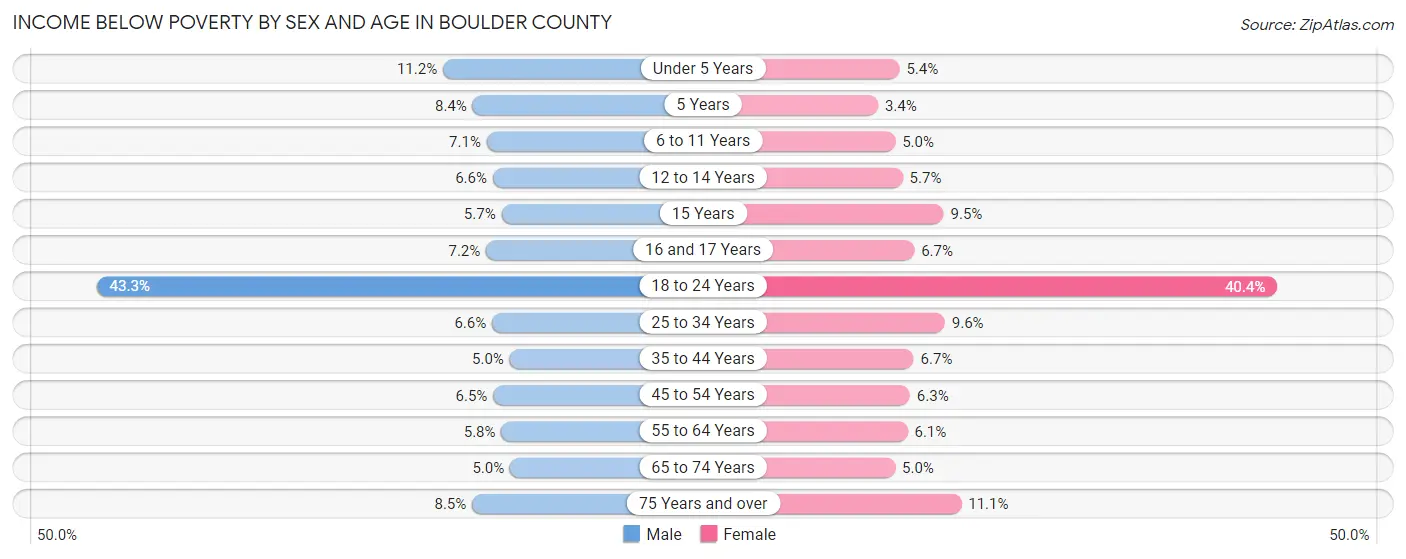
Income Below Poverty by Sex and Age in Boulder County
With 11.4% poverty level for males and 11.2% for females among the residents of Boulder County, 18 to 24 year old males and 18 to 24 year old females are the most vulnerable to poverty, with 9,294 males (43.3%) and 8,102 females (40.4%) in their respective age groups living below the poverty level.
| Age Bracket | Male | Female |
| Under 5 Years | 732 (11.2%) | 354 (5.3%) |
| 5 Years | 122 (8.4%) | 57 (3.4%) |
| 6 to 11 Years | 743 (7.1%) | 464 (5.0%) |
| 12 to 14 Years | 365 (6.6%) | 312 (5.7%) |
| 15 Years | 116 (5.7%) | 215 (9.5%) |
| 16 and 17 Years | 285 (7.2%) | 230 (6.7%) |
| 18 to 24 Years | 9,294 (43.3%) | 8,102 (40.4%) |
| 25 to 34 Years | 1,597 (6.6%) | 1,948 (9.6%) |
| 35 to 44 Years | 1,045 (5.0%) | 1,333 (6.7%) |
| 45 to 54 Years | 1,364 (6.5%) | 1,283 (6.3%) |
| 55 to 64 Years | 1,139 (5.8%) | 1,234 (6.1%) |
| 65 to 74 Years | 739 (5.0%) | 792 (5.0%) |
| 75 Years and over | 647 (8.5%) | 1,162 (11.1%) |
| Total | 18,188 (11.4%) | 17,486 (11.2%) |
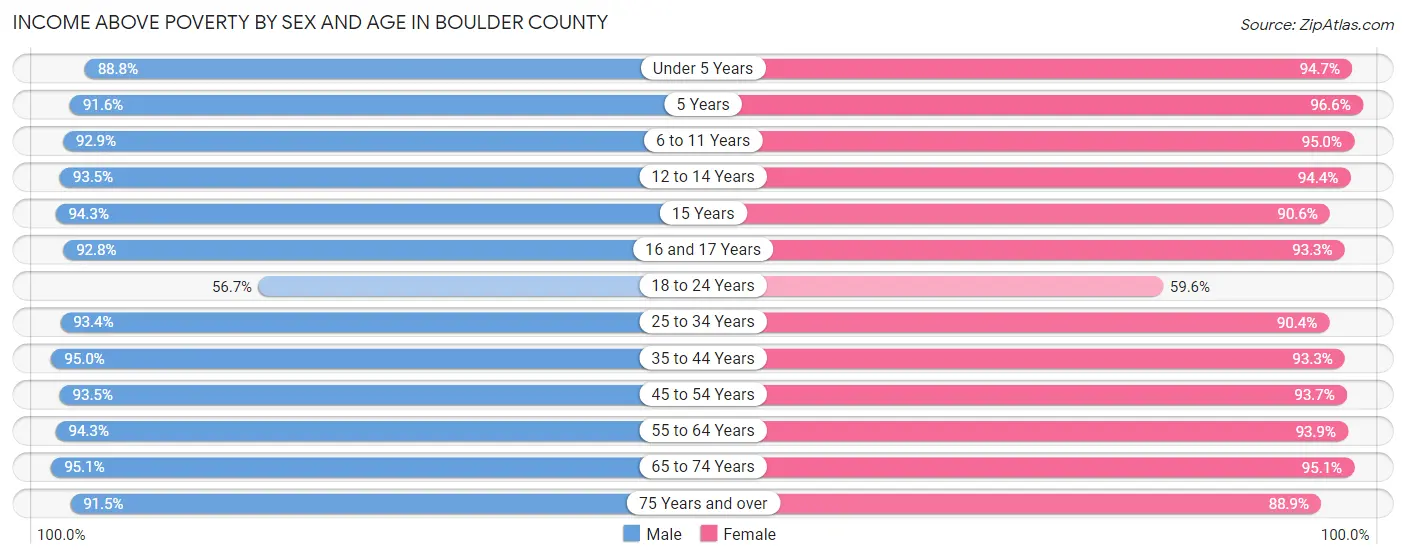
Income Above Poverty by Sex and Age in Boulder County
According to the poverty statistics in Boulder County, males aged 65 to 74 years and females aged 5 years are the age groups that are most secure financially, with 95.1% of males and 96.6% of females in these age groups living above the poverty line.
| Age Bracket | Male | Female |
| Under 5 Years | 5,821 (88.8%) | 6,264 (94.7%) |
| 5 Years | 1,327 (91.6%) | 1,640 (96.6%) |
| 6 to 11 Years | 9,703 (92.9%) | 8,889 (95.0%) |
| 12 to 14 Years | 5,205 (93.4%) | 5,207 (94.4%) |
| 15 Years | 1,905 (94.3%) | 2,059 (90.5%) |
| 16 and 17 Years | 3,688 (92.8%) | 3,195 (93.3%) |
| 18 to 24 Years | 12,165 (56.7%) | 11,948 (59.6%) |
| 25 to 34 Years | 22,510 (93.4%) | 18,436 (90.4%) |
| 35 to 44 Years | 19,926 (95.0%) | 18,652 (93.3%) |
| 45 to 54 Years | 19,595 (93.5%) | 19,026 (93.7%) |
| 55 to 64 Years | 18,658 (94.3%) | 18,991 (93.9%) |
| 65 to 74 Years | 14,202 (95.1%) | 15,197 (95.1%) |
| 75 Years and over | 6,991 (91.5%) | 9,318 (88.9%) |
| Total | 141,696 (88.6%) | 138,822 (88.8%) |
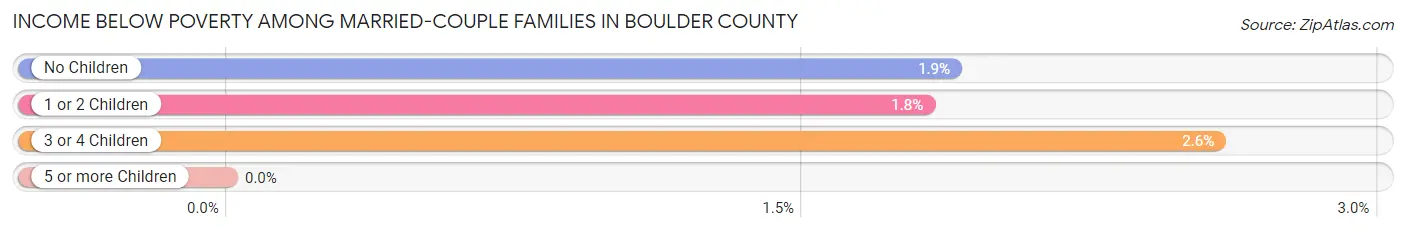
Income Below Poverty Among Married-Couple Families in Boulder County
The poverty statistics for married-couple families in Boulder County show that 1.9% or 1,149 of the total 60,454 families live below the poverty line. Families with 3 or 4 children have the highest poverty rate of 2.6%, comprising of 98 families. On the other hand, families with 5 or more children have the lowest poverty rate of 0.0%, which includes 0 families.
| Children | Above Poverty | Below Poverty |
| No Children | 34,505 (98.1%) | 664 (1.9%) |
| 1 or 2 Children | 20,910 (98.2%) | 387 (1.8%) |
| 3 or 4 Children | 3,695 (97.4%) | 98 (2.6%) |
| 5 or more Children | 195 (100.0%) | 0 (0.0%) |
| Total | 59,305 (98.1%) | 1,149 (1.9%) |
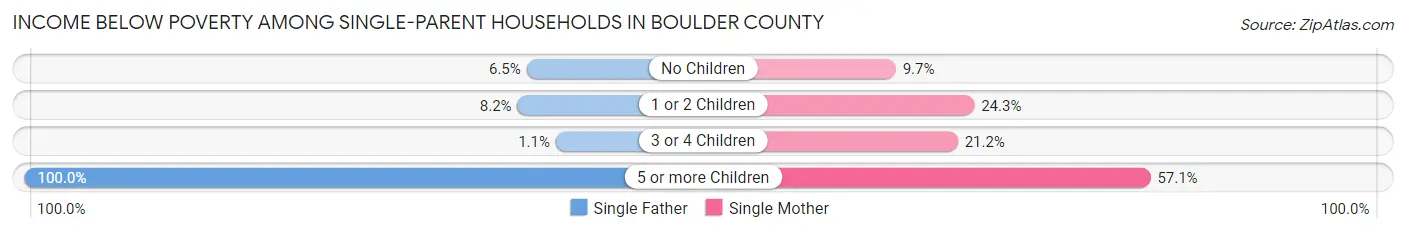
Income Below Poverty Among Single-Parent Households in Boulder County
According to the poverty data in Boulder County, 7.4% or 381 single-father households and 18.9% or 1,755 single-mother households are living below the poverty line. Among single-father households, those with 5 or more children have the highest poverty rate, with 20 households (100.0%) experiencing poverty. Likewise, among single-mother households, those with 5 or more children have the highest poverty rate, with 20 households (57.1%) falling below the poverty line.
| Children | Single Father | Single Mother |
| No Children | 144 (6.5%) | 330 (9.7%) |
| 1 or 2 Children | 214 (8.2%) | 1,248 (24.3%) |
| 3 or 4 Children | 3 (1.1%) | 157 (21.2%) |
| 5 or more Children | 20 (100.0%) | 20 (57.1%) |
| Total | 381 (7.4%) | 1,755 (18.9%) |
Income Below Poverty Among Married-Couple vs Single-Parent Households in Boulder County
The poverty data for Boulder County shows that 1,149 of the married-couple family households (1.9%) and 2,136 of the single-parent households (14.8%) are living below the poverty level. Within the married-couple family households, those with 3 or 4 children have the highest poverty rate, with 98 households (2.6%) falling below the poverty line. Among the single-parent households, those with 5 or more children have the highest poverty rate, with 40 household (72.7%) living below poverty.
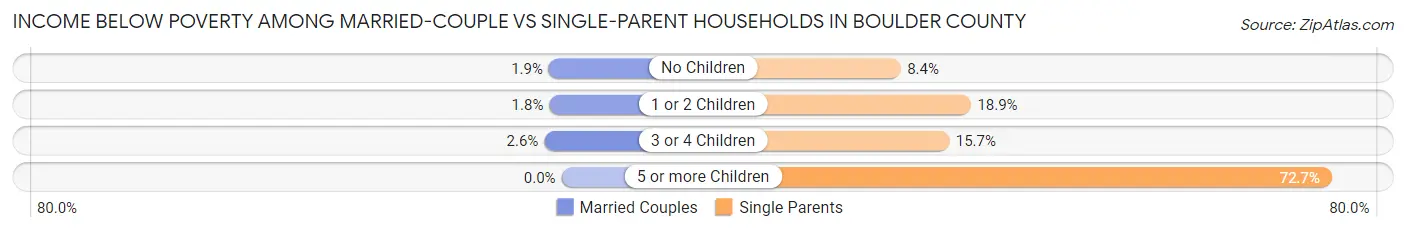
| Children | Married-Couple Families | Single-Parent Households |
| No Children | 664 (1.9%) | 474 (8.4%) |
| 1 or 2 Children | 387 (1.8%) | 1,462 (18.9%) |
| 3 or 4 Children | 98 (2.6%) | 160 (15.7%) |
| 5 or more Children | 0 (0.0%) | 40 (72.7%) |
| Total | 1,149 (1.9%) | 2,136 (14.8%) |
Employment Characteristics in Boulder County
Employment by Class of Employer in Boulder County
Among the 175,188 employed individuals in Boulder County, private company employees (111,317 | 63.5%), not-for-profit organizations (14,952 | 8.5%), and self-employed (not incorporated) (13,006 | 7.4%) make up the most common classes of employment.
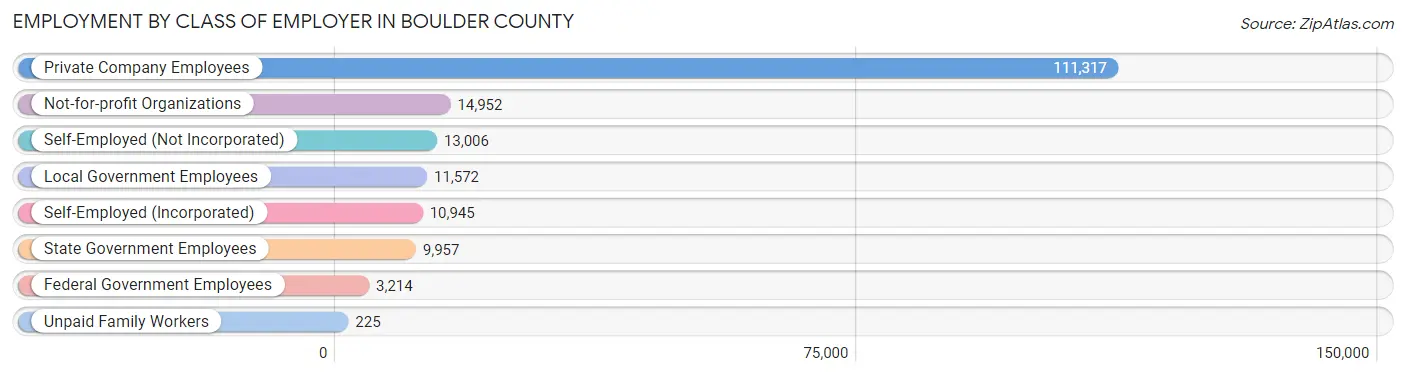
| Employer Class | # Employees | % Employees |
| Private Company Employees | 111,317 | 63.5% |
| Self-Employed (Incorporated) | 10,945 | 6.2% |
| Self-Employed (Not Incorporated) | 13,006 | 7.4% |
| Not-for-profit Organizations | 14,952 | 8.5% |
| Local Government Employees | 11,572 | 6.6% |
| State Government Employees | 9,957 | 5.7% |
| Federal Government Employees | 3,214 | 1.8% |
| Unpaid Family Workers | 225 | 0.1% |
| Total | 175,188 | 100.0% |
Employment Status by Age in Boulder County
According to the labor force statistics for Boulder County, out of the total population over 16 years of age (276,576), 67.4% or 186,412 individuals are in the labor force, with 4.4% or 8,202 of them unemployed. The age group with the highest labor force participation rate is 25 to 29 years, with 88.3% or 20,617 individuals in the labor force. Within the labor force, the 16 to 19 years age range has the highest percentage of unemployed individuals, with 15.3% or 1,510 of them being unemployed.
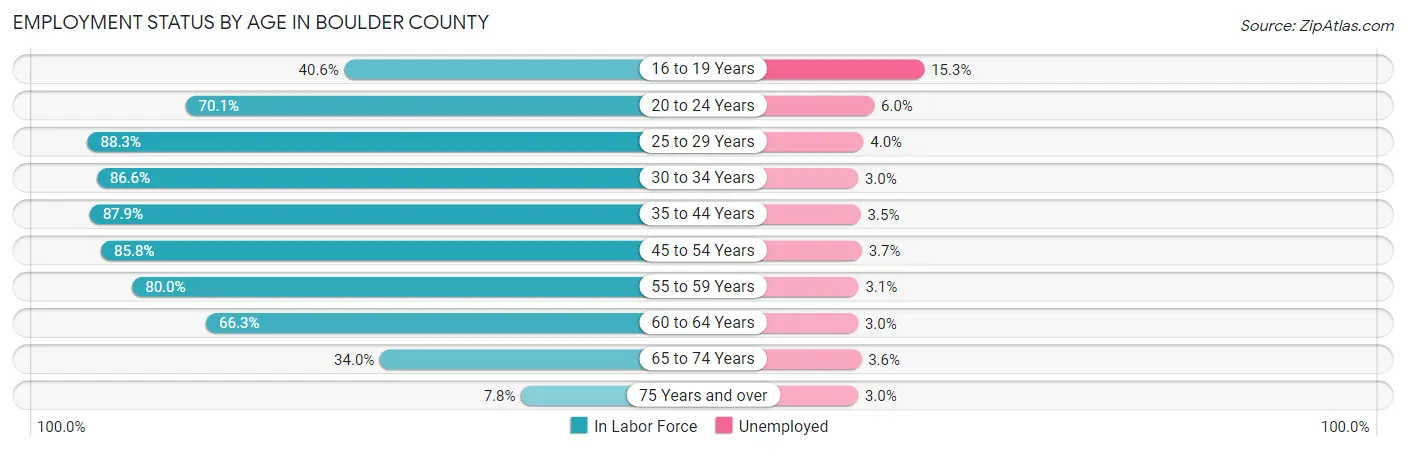
| Age Bracket | In Labor Force | Unemployed |
| 16 to 19 Years | 9,867 (40.6%) | 1,510 (15.3%) |
| 20 to 24 Years | 24,152 (70.1%) | 1,449 (6.0%) |
| 25 to 29 Years | 20,617 (88.3%) | 825 (4.0%) |
| 30 to 34 Years | 18,644 (86.6%) | 559 (3.0%) |
| 35 to 44 Years | 36,169 (87.9%) | 1,266 (3.5%) |
| 45 to 54 Years | 35,500 (85.8%) | 1,314 (3.7%) |
| 55 to 59 Years | 16,773 (80.0%) | 520 (3.1%) |
| 60 to 64 Years | 12,740 (66.3%) | 382 (3.0%) |
| 65 to 74 Years | 10,590 (34.0%) | 381 (3.6%) |
| 75 Years and over | 1,489 (7.8%) | 45 (3.0%) |
| Total | 186,412 (67.4%) | 8,202 (4.4%) |
Employment Status by Educational Attainment in Boulder County
According to labor force statistics for Boulder County, 83.8% of individuals (140,434) out of the total population between 25 and 64 years of age (167,582) are in the labor force, with 3.5% or 4,915 of them being unemployed. The group with the highest labor force participation rate are those with the educational attainment of bachelor's degree or higher, with 86.4% or 94,078 individuals in the labor force. Within the labor force, individuals with less than high school education have the highest percentage of unemployment, with 5.9% or 333 of them being unemployed.
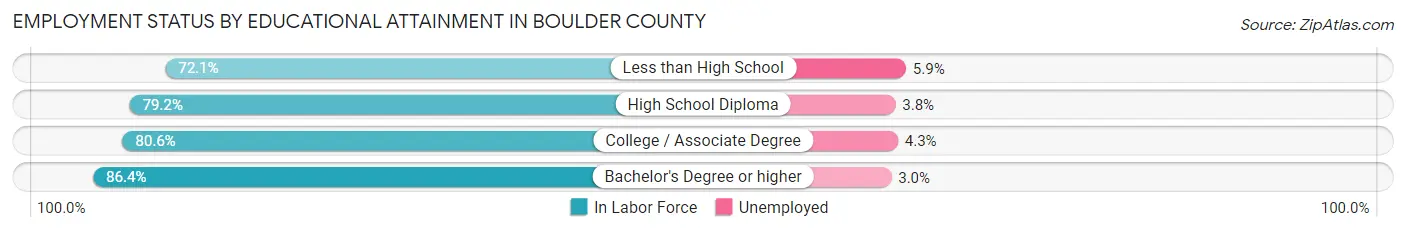
| Educational Attainment | In Labor Force | Unemployed |
| Less than High School | 5,652 (72.1%) | 463 (5.9%) |
| High School Diploma | 13,849 (79.2%) | 664 (3.8%) |
| College / Associate Degree | 26,896 (80.6%) | 1,435 (4.3%) |
| Bachelor's Degree or higher | 94,078 (86.4%) | 3,267 (3.0%) |
| Total | 140,434 (83.8%) | 5,865 (3.5%) |
Employment Occupations by Sex in Boulder County
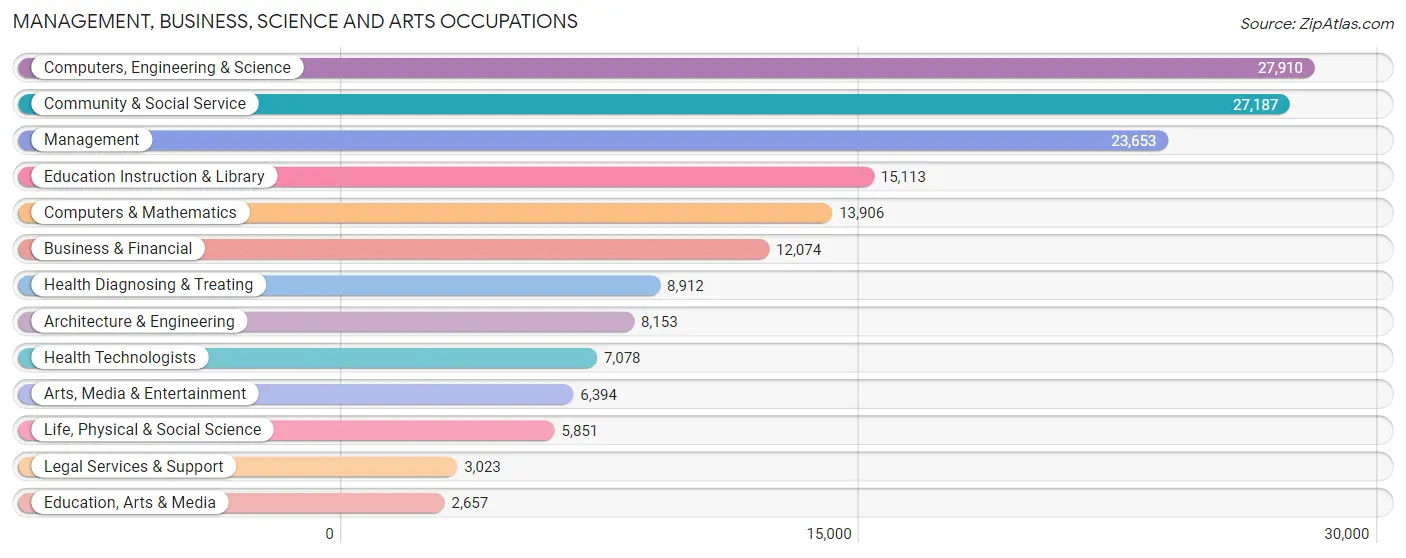
Management, Business, Science and Arts Occupations
The most common Management, Business, Science and Arts occupations in Boulder County are Computers, Engineering & Science (27,910 | 15.7%), Community & Social Service (27,187 | 15.3%), Management (23,653 | 13.3%), Education Instruction & Library (15,113 | 8.5%), and Computers & Mathematics (13,906 | 7.8%).
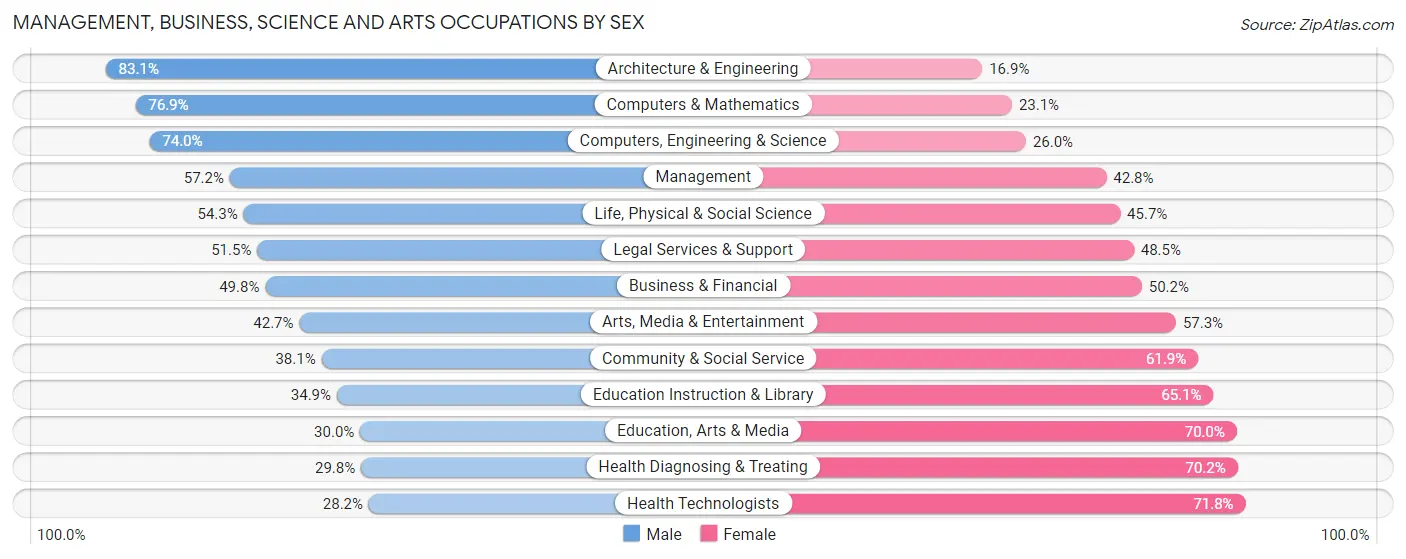
Management, Business, Science and Arts Occupations by Sex
Within the Management, Business, Science and Arts occupations in Boulder County, the most male-oriented occupations are Architecture & Engineering (83.1%), Computers & Mathematics (76.9%), and Computers, Engineering & Science (74.0%), while the most female-oriented occupations are Health Technologists (71.8%), Health Diagnosing & Treating (70.2%), and Education, Arts & Media (70.0%).
| Occupation | Male | Female |
| Management | 13,529 (57.2%) | 10,124 (42.8%) |
| Business & Financial | 6,013 (49.8%) | 6,061 (50.2%) |
| Computers, Engineering & Science | 20,644 (74.0%) | 7,266 (26.0%) |
| Computers & Mathematics | 10,692 (76.9%) | 3,214 (23.1%) |
| Architecture & Engineering | 6,774 (83.1%) | 1,379 (16.9%) |
| Life, Physical & Social Science | 3,178 (54.3%) | 2,673 (45.7%) |
| Community & Social Service | 10,351 (38.1%) | 16,836 (61.9%) |
| Education, Arts & Media | 797 (30.0%) | 1,860 (70.0%) |
| Legal Services & Support | 1,556 (51.5%) | 1,467 (48.5%) |
| Education Instruction & Library | 5,269 (34.9%) | 9,844 (65.1%) |
| Arts, Media & Entertainment | 2,729 (42.7%) | 3,665 (57.3%) |
| Health Diagnosing & Treating | 2,658 (29.8%) | 6,254 (70.2%) |
| Health Technologists | 1,995 (28.2%) | 5,083 (71.8%) |
| Total (Category) | 53,195 (53.3%) | 46,541 (46.7%) |
| Total (Overall) | 94,522 (53.1%) | 83,535 (46.9%) |
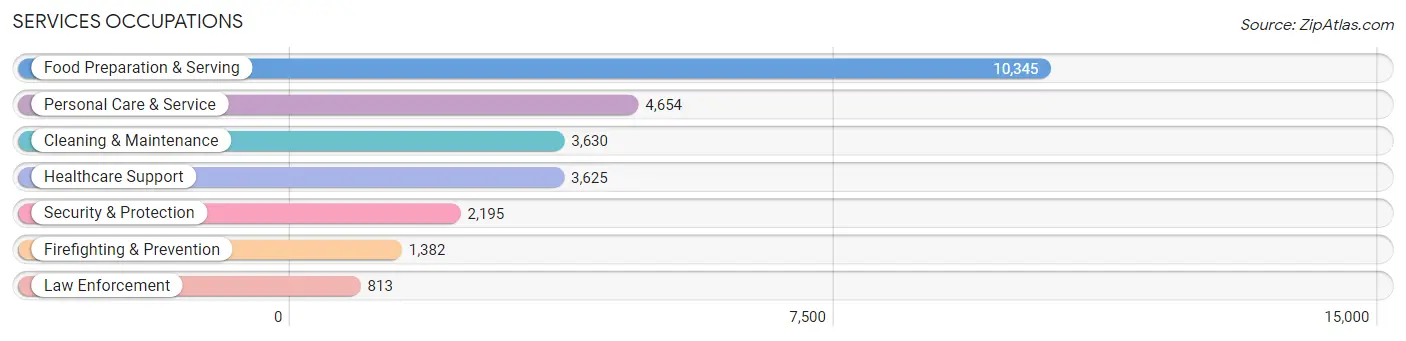
Services Occupations
The most common Services occupations in Boulder County are Food Preparation & Serving (10,345 | 5.8%), Personal Care & Service (4,654 | 2.6%), Cleaning & Maintenance (3,630 | 2.0%), Healthcare Support (3,625 | 2.0%), and Security & Protection (2,195 | 1.2%).
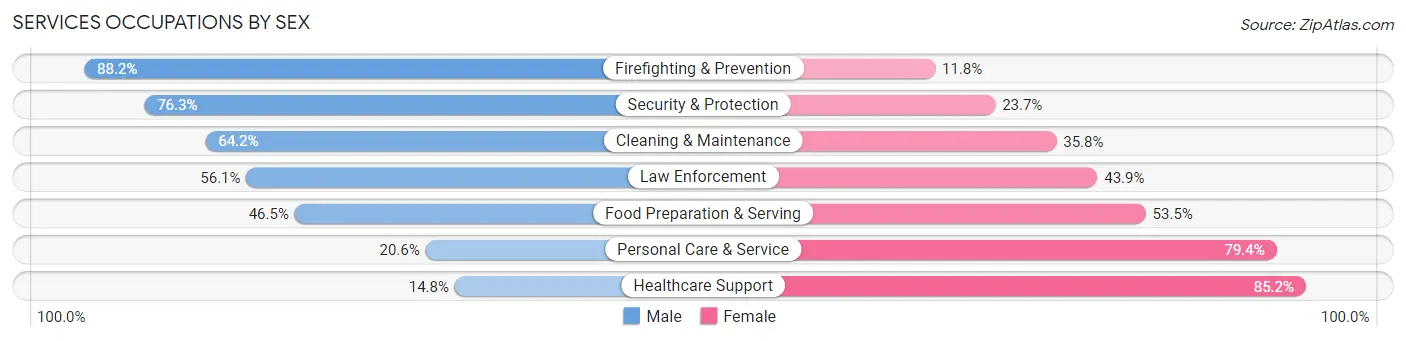
Services Occupations by Sex
Within the Services occupations in Boulder County, the most male-oriented occupations are Firefighting & Prevention (88.2%), Security & Protection (76.3%), and Cleaning & Maintenance (64.2%), while the most female-oriented occupations are Healthcare Support (85.2%), Personal Care & Service (79.4%), and Food Preparation & Serving (53.5%).
| Occupation | Male | Female |
| Healthcare Support | 537 (14.8%) | 3,088 (85.2%) |
| Security & Protection | 1,675 (76.3%) | 520 (23.7%) |
| Firefighting & Prevention | 1,219 (88.2%) | 163 (11.8%) |
| Law Enforcement | 456 (56.1%) | 357 (43.9%) |
| Food Preparation & Serving | 4,811 (46.5%) | 5,534 (53.5%) |
| Cleaning & Maintenance | 2,331 (64.2%) | 1,299 (35.8%) |
| Personal Care & Service | 959 (20.6%) | 3,695 (79.4%) |
| Total (Category) | 10,313 (42.2%) | 14,136 (57.8%) |
| Total (Overall) | 94,522 (53.1%) | 83,535 (46.9%) |
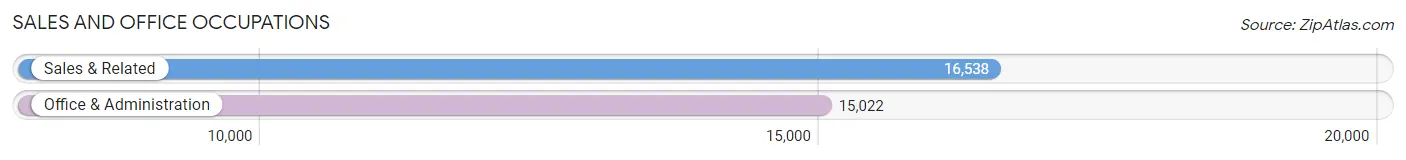
Sales and Office Occupations
The most common Sales and Office occupations in Boulder County are Sales & Related (16,538 | 9.3%), and Office & Administration (15,022 | 8.4%).
Sales and Office Occupations by Sex
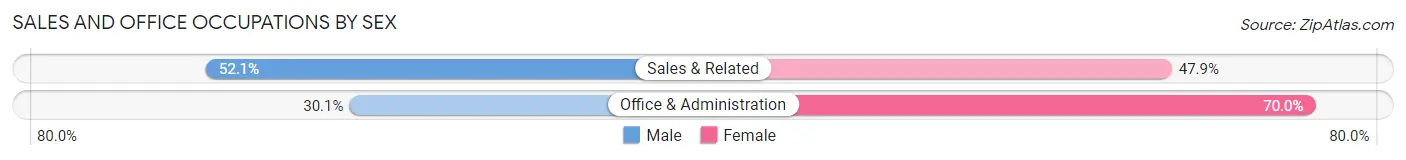
| Occupation | Male | Female |
| Sales & Related | 8,618 (52.1%) | 7,920 (47.9%) |
| Office & Administration | 4,514 (30.0%) | 10,508 (70.0%) |
| Total (Category) | 13,132 (41.6%) | 18,428 (58.4%) |
| Total (Overall) | 94,522 (53.1%) | 83,535 (46.9%) |
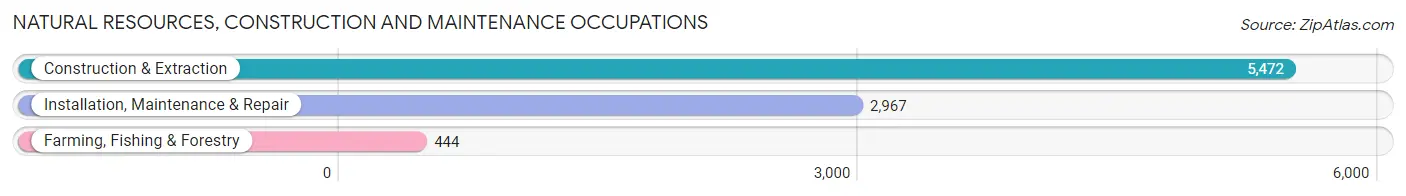
Natural Resources, Construction and Maintenance Occupations
The most common Natural Resources, Construction and Maintenance occupations in Boulder County are Construction & Extraction (5,472 | 3.1%), Installation, Maintenance & Repair (2,967 | 1.7%), and Farming, Fishing & Forestry (444 | 0.3%).
Natural Resources, Construction and Maintenance Occupations by Sex
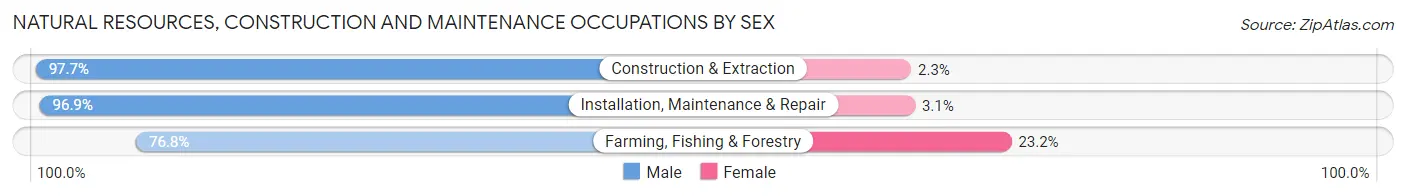
| Occupation | Male | Female |
| Farming, Fishing & Forestry | 341 (76.8%) | 103 (23.2%) |
| Construction & Extraction | 5,345 (97.7%) | 127 (2.3%) |
| Installation, Maintenance & Repair | 2,874 (96.9%) | 93 (3.1%) |
| Total (Category) | 8,560 (96.4%) | 323 (3.6%) |
| Total (Overall) | 94,522 (53.1%) | 83,535 (46.9%) |
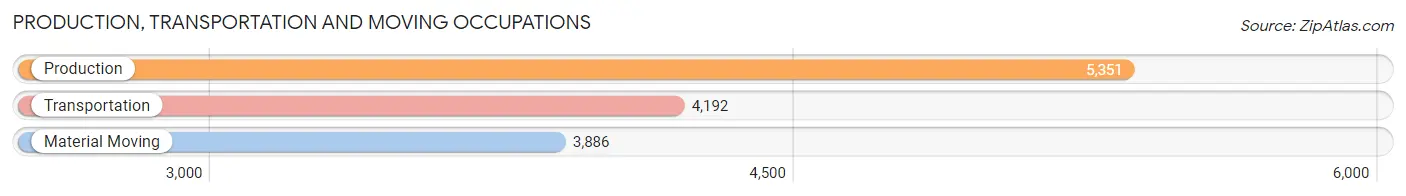
Production, Transportation and Moving Occupations
The most common Production, Transportation and Moving occupations in Boulder County are Production (5,351 | 3.0%), Transportation (4,192 | 2.4%), and Material Moving (3,886 | 2.2%).
Production, Transportation and Moving Occupations by Sex
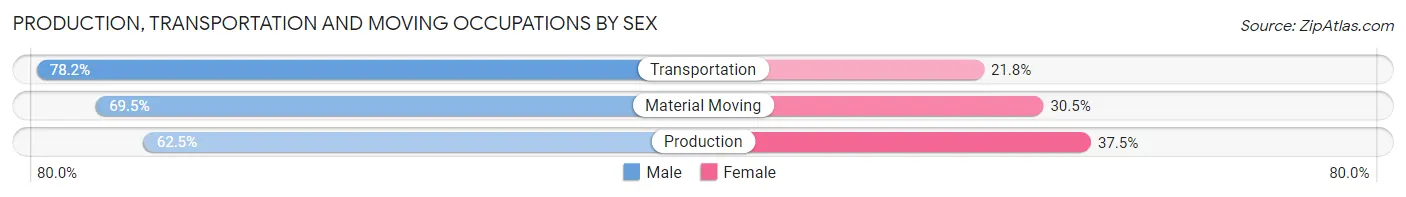
| Occupation | Male | Female |
| Production | 3,344 (62.5%) | 2,007 (37.5%) |
| Transportation | 3,278 (78.2%) | 914 (21.8%) |
| Material Moving | 2,700 (69.5%) | 1,186 (30.5%) |
| Total (Category) | 9,322 (69.4%) | 4,107 (30.6%) |
| Total (Overall) | 94,522 (53.1%) | 83,535 (46.9%) |
Employment Industries by Sex in Boulder County
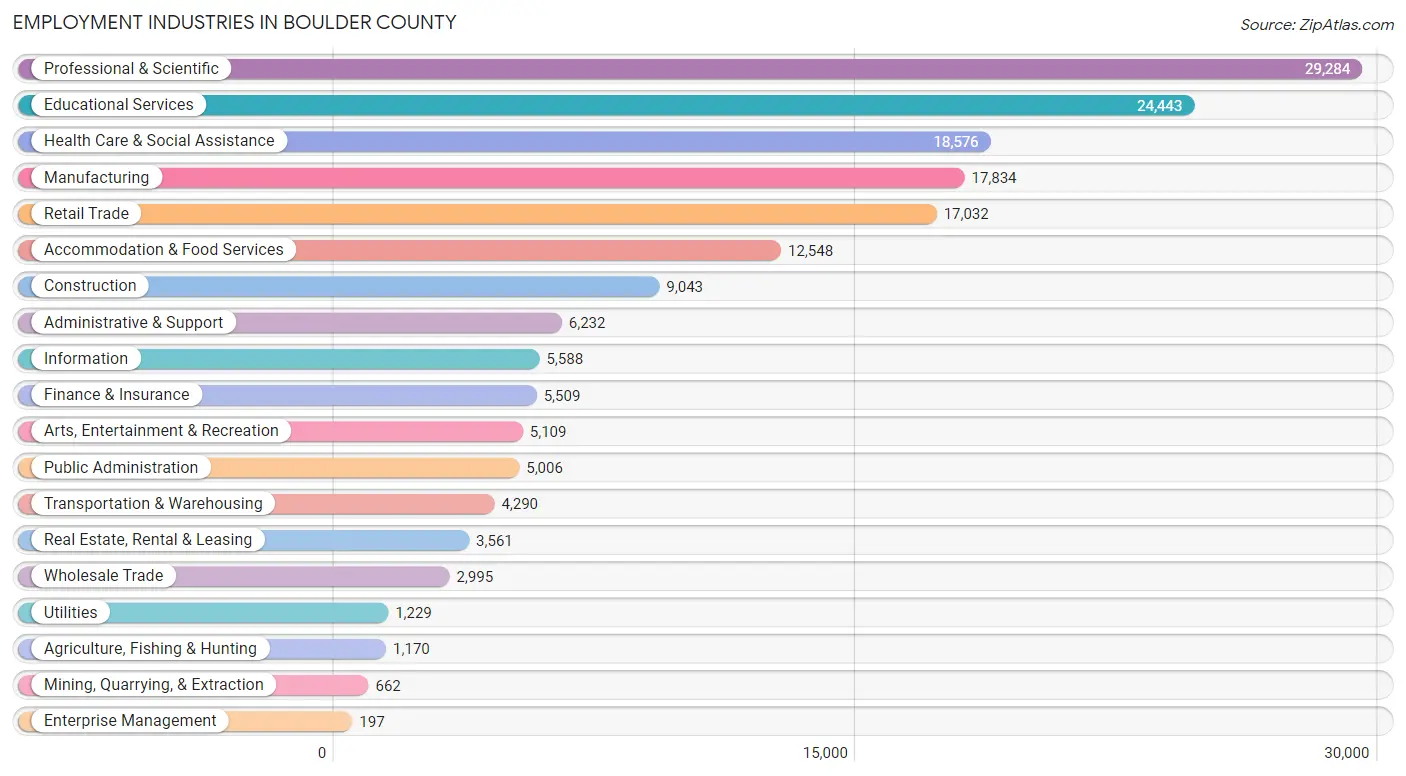
Employment Industries in Boulder County
The major employment industries in Boulder County include Professional & Scientific (29,284 | 16.5%), Educational Services (24,443 | 13.7%), Health Care & Social Assistance (18,576 | 10.4%), Manufacturing (17,834 | 10.0%), and Retail Trade (17,032 | 9.6%).
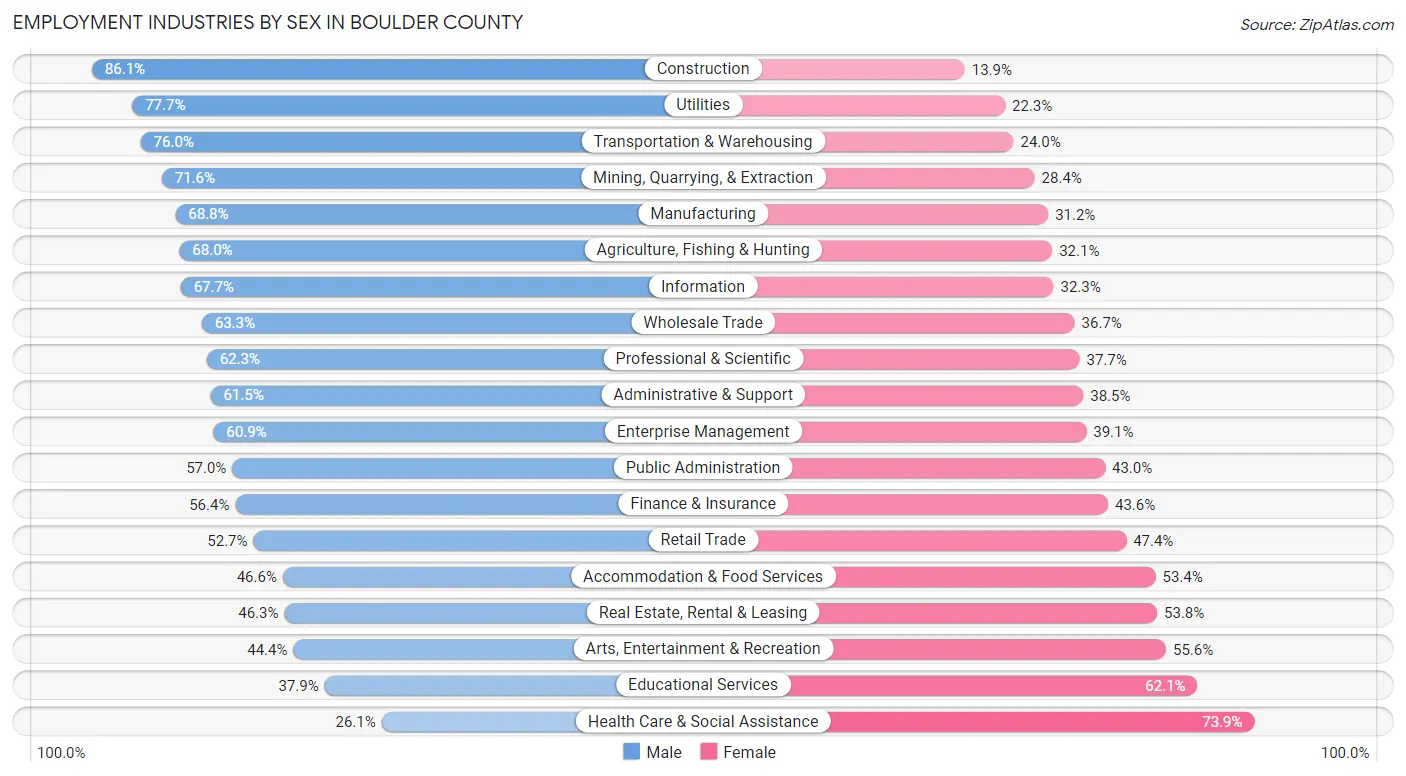
Employment Industries by Sex in Boulder County
The Boulder County industries that see more men than women are Construction (86.1%), Utilities (77.7%), and Transportation & Warehousing (76.0%), whereas the industries that tend to have a higher number of women are Health Care & Social Assistance (73.9%), Educational Services (62.1%), and Arts, Entertainment & Recreation (55.6%).
| Industry | Male | Female |
| Agriculture, Fishing & Hunting | 795 (67.9%) | 375 (32.1%) |
| Mining, Quarrying, & Extraction | 474 (71.6%) | 188 (28.4%) |
| Construction | 7,782 (86.1%) | 1,261 (13.9%) |
| Manufacturing | 12,268 (68.8%) | 5,566 (31.2%) |
| Wholesale Trade | 1,896 (63.3%) | 1,099 (36.7%) |
| Retail Trade | 8,968 (52.6%) | 8,064 (47.3%) |
| Transportation & Warehousing | 3,259 (76.0%) | 1,031 (24.0%) |
| Utilities | 955 (77.7%) | 274 (22.3%) |
| Information | 3,782 (67.7%) | 1,806 (32.3%) |
| Finance & Insurance | 3,107 (56.4%) | 2,402 (43.6%) |
| Real Estate, Rental & Leasing | 1,647 (46.3%) | 1,914 (53.7%) |
| Professional & Scientific | 18,244 (62.3%) | 11,040 (37.7%) |
| Enterprise Management | 120 (60.9%) | 77 (39.1%) |
| Administrative & Support | 3,834 (61.5%) | 2,398 (38.5%) |
| Educational Services | 9,268 (37.9%) | 15,175 (62.1%) |
| Health Care & Social Assistance | 4,852 (26.1%) | 13,724 (73.9%) |
| Arts, Entertainment & Recreation | 2,268 (44.4%) | 2,841 (55.6%) |
| Accommodation & Food Services | 5,844 (46.6%) | 6,704 (53.4%) |
| Public Administration | 2,855 (57.0%) | 2,151 (43.0%) |
| Total | 94,522 (53.1%) | 83,535 (46.9%) |
Education in Boulder County
School Enrollment in Boulder County
The most common levels of schooling among the 97,501 students in Boulder County are college / undergraduate (36,490 | 37.4%), high school (16,429 | 16.9%), and middle school (14,787 | 15.2%).
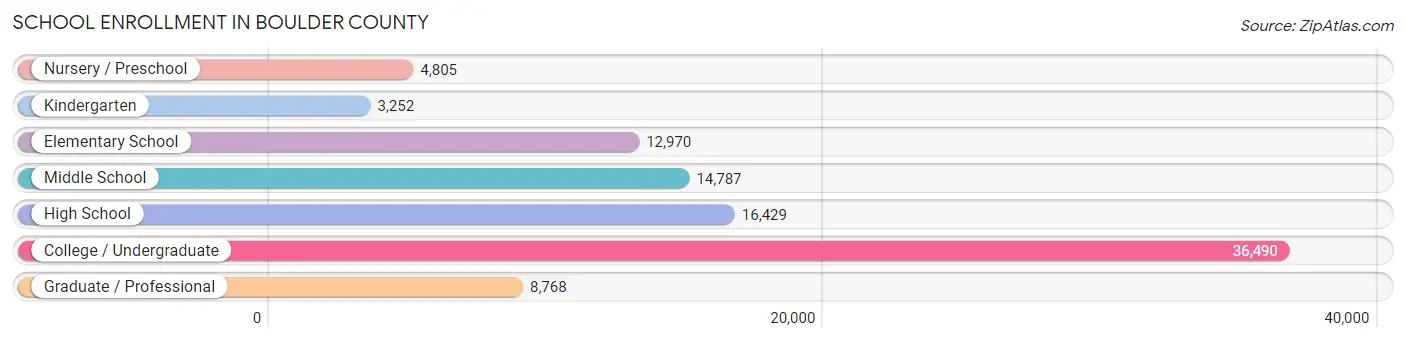
| School Level | # Students | % Students |
| Nursery / Preschool | 4,805 | 4.9% |
| Kindergarten | 3,252 | 3.3% |
| Elementary School | 12,970 | 13.3% |
| Middle School | 14,787 | 15.2% |
| High School | 16,429 | 16.9% |
| College / Undergraduate | 36,490 | 37.4% |
| Graduate / Professional | 8,768 | 9.0% |
| Total | 97,501 | 100.0% |
School Enrollment by Age by Funding Source in Boulder County
Out of a total of 97,501 students who are enrolled in schools in Boulder County, 10,433 (10.7%) attend a private institution, while the remaining 87,068 (89.3%) are enrolled in public schools. The age group of 3 to 4 year olds has the highest likelihood of being enrolled in private schools, with 2,167 (56.3% in the age bracket) enrolled. Conversely, the age group of 18 to 19 year olds has the lowest likelihood of being enrolled in a private school, with 13,621 (95.3% in the age bracket) attending a public institution.
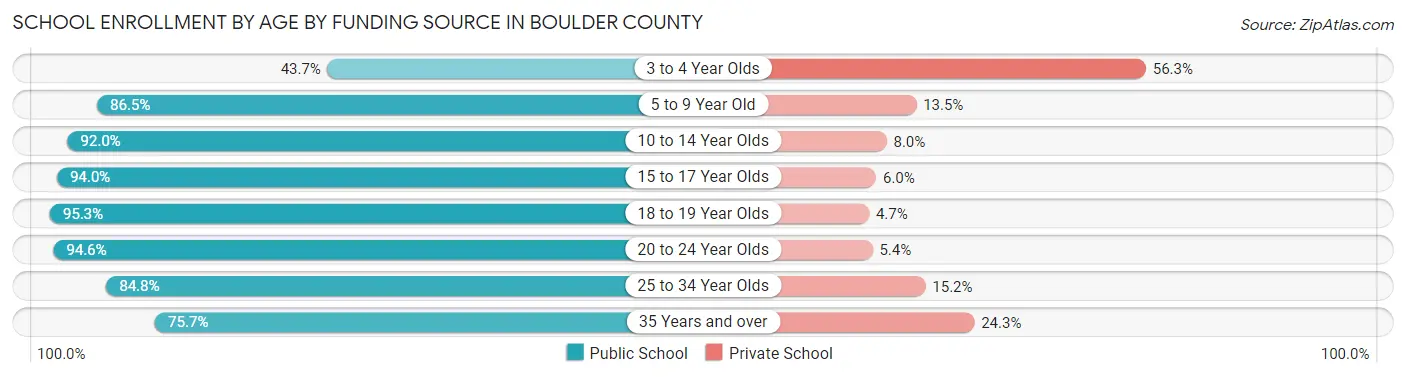
| Age Bracket | Public School | Private School |
| 3 to 4 Year Olds | 1,684 (43.7%) | 2,167 (56.3%) |
| 5 to 9 Year Old | 13,660 (86.5%) | 2,134 (13.5%) |
| 10 to 14 Year Olds | 16,541 (92.0%) | 1,435 (8.0%) |
| 15 to 17 Year Olds | 10,994 (94.0%) | 705 (6.0%) |
| 18 to 19 Year Olds | 13,621 (95.3%) | 673 (4.7%) |
| 20 to 24 Year Olds | 21,497 (94.6%) | 1,217 (5.4%) |
| 25 to 34 Year Olds | 6,060 (84.8%) | 1,088 (15.2%) |
| 35 Years and over | 3,046 (75.7%) | 979 (24.3%) |
| Total | 87,068 (89.3%) | 10,433 (10.7%) |
Educational Attainment by Field of Study in Boulder County
Business (19,276 | 12.7%), engineering (17,211 | 11.3%), social sciences (15,434 | 10.1%), bio, nature & agricultural (12,289 | 8.1%), and literature & languages (10,750 | 7.1%) are the most common fields of study among 152,201 individuals in Boulder County who have obtained a bachelor's degree or higher.
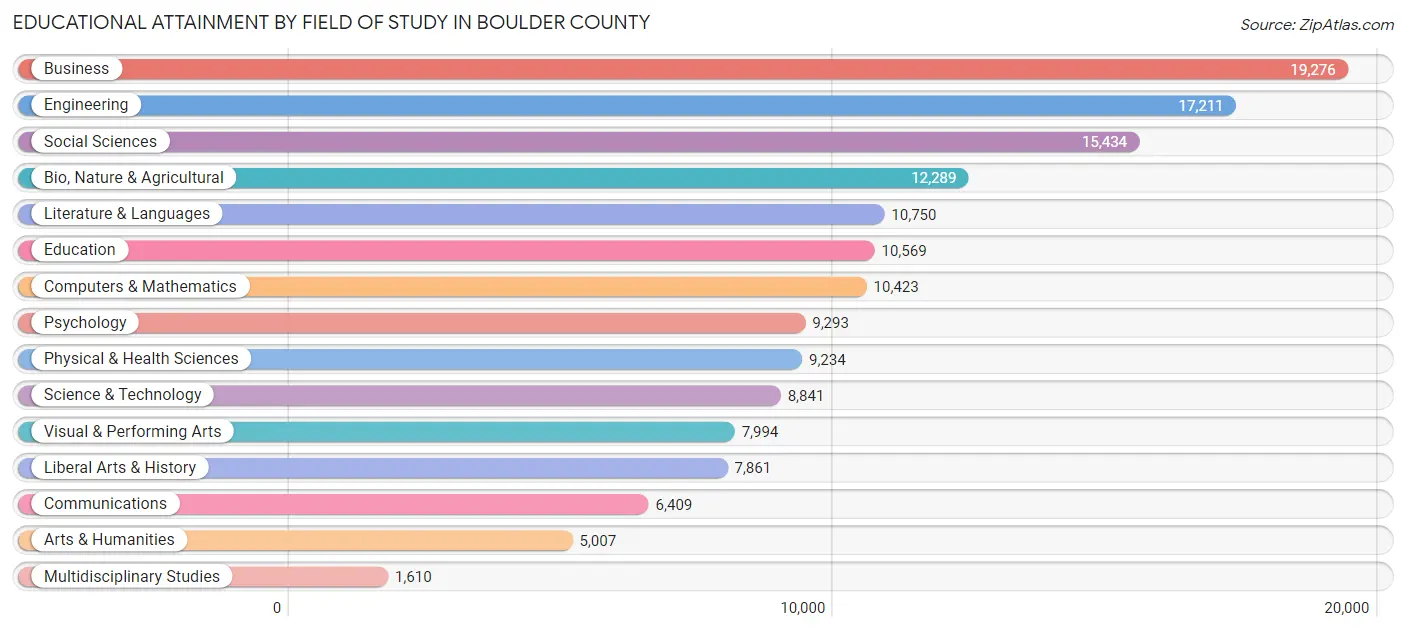
| Field of Study | # Graduates | % Graduates |
| Computers & Mathematics | 10,423 | 6.9% |
| Bio, Nature & Agricultural | 12,289 | 8.1% |
| Physical & Health Sciences | 9,234 | 6.1% |
| Psychology | 9,293 | 6.1% |
| Social Sciences | 15,434 | 10.1% |
| Engineering | 17,211 | 11.3% |
| Multidisciplinary Studies | 1,610 | 1.1% |
| Science & Technology | 8,841 | 5.8% |
| Business | 19,276 | 12.7% |
| Education | 10,569 | 6.9% |
| Literature & Languages | 10,750 | 7.1% |
| Liberal Arts & History | 7,861 | 5.2% |
| Visual & Performing Arts | 7,994 | 5.2% |
| Communications | 6,409 | 4.2% |
| Arts & Humanities | 5,007 | 3.3% |
| Total | 152,201 | 100.0% |
Transportation & Commute in Boulder County
Vehicle Availability by Sex in Boulder County
The most prevalent vehicle ownership categories in Boulder County are males with 2 vehicles (40,199, accounting for 43.9%) and females with 2 vehicles (35,030, making up 50.0%).
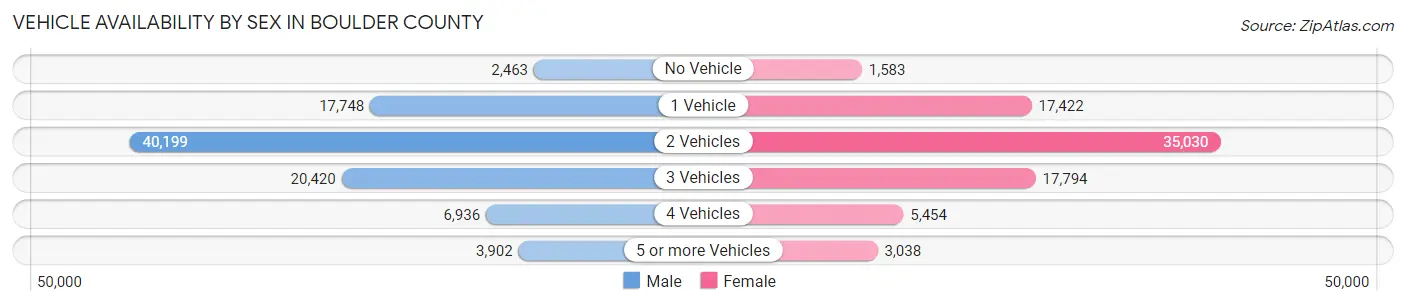
| Vehicles Available | Male | Female |
| No Vehicle | 2,463 (2.7%) | 1,583 (2.0%) |
| 1 Vehicle | 17,748 (19.4%) | 17,422 (21.7%) |
| 2 Vehicles | 40,199 (43.9%) | 35,030 (43.6%) |
| 3 Vehicles | 20,420 (22.3%) | 17,794 (22.2%) |
| 4 Vehicles | 6,936 (7.6%) | 5,454 (6.8%) |
| 5 or more Vehicles | 3,902 (4.3%) | 3,038 (3.8%) |
| Total | 91,668 (100.0%) | 80,321 (100.0%) |
Commute Time in Boulder County
The most frequently occuring commute durations in Boulder County are 10 to 14 minutes (22,976 commuters, 17.4%), 15 to 19 minutes (22,613 commuters, 17.1%), and 20 to 24 minutes (19,024 commuters, 14.4%).
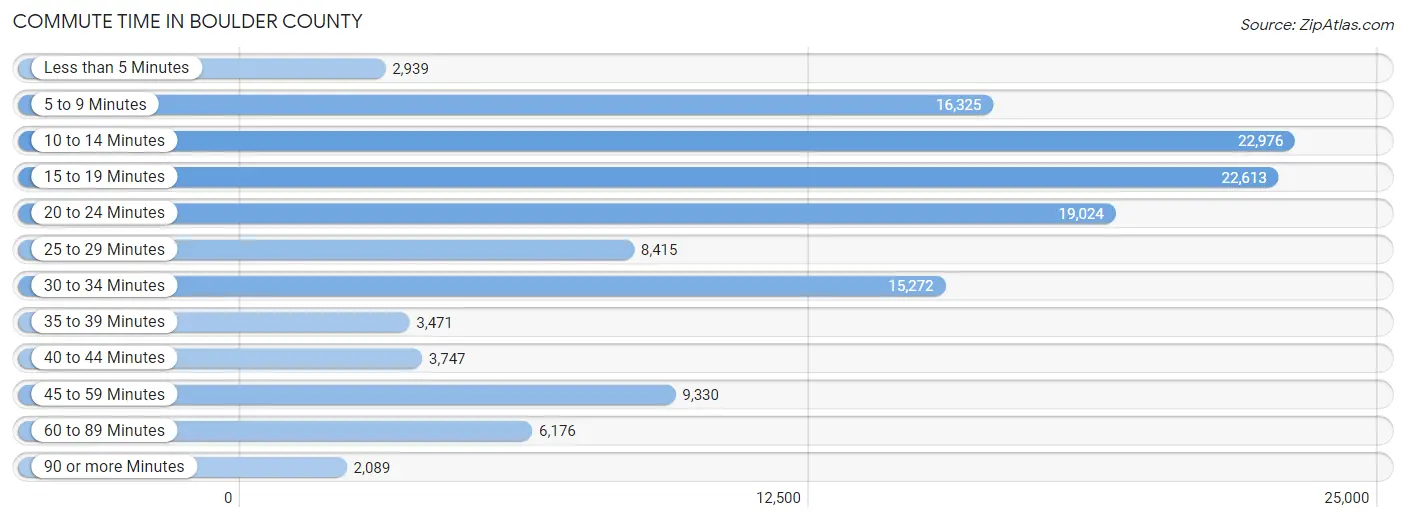
| Commute Time | # Commuters | % Commuters |
| Less than 5 Minutes | 2,939 | 2.2% |
| 5 to 9 Minutes | 16,325 | 12.3% |
| 10 to 14 Minutes | 22,976 | 17.4% |
| 15 to 19 Minutes | 22,613 | 17.1% |
| 20 to 24 Minutes | 19,024 | 14.4% |
| 25 to 29 Minutes | 8,415 | 6.4% |
| 30 to 34 Minutes | 15,272 | 11.5% |
| 35 to 39 Minutes | 3,471 | 2.6% |
| 40 to 44 Minutes | 3,747 | 2.8% |
| 45 to 59 Minutes | 9,330 | 7.0% |
| 60 to 89 Minutes | 6,176 | 4.7% |
| 90 or more Minutes | 2,089 | 1.6% |
Commute Time by Sex in Boulder County
The most common commute times in Boulder County are 15 to 19 minutes (12,074 commuters, 17.0%) for males and 10 to 14 minutes (11,051 commuters, 18.0%) for females.
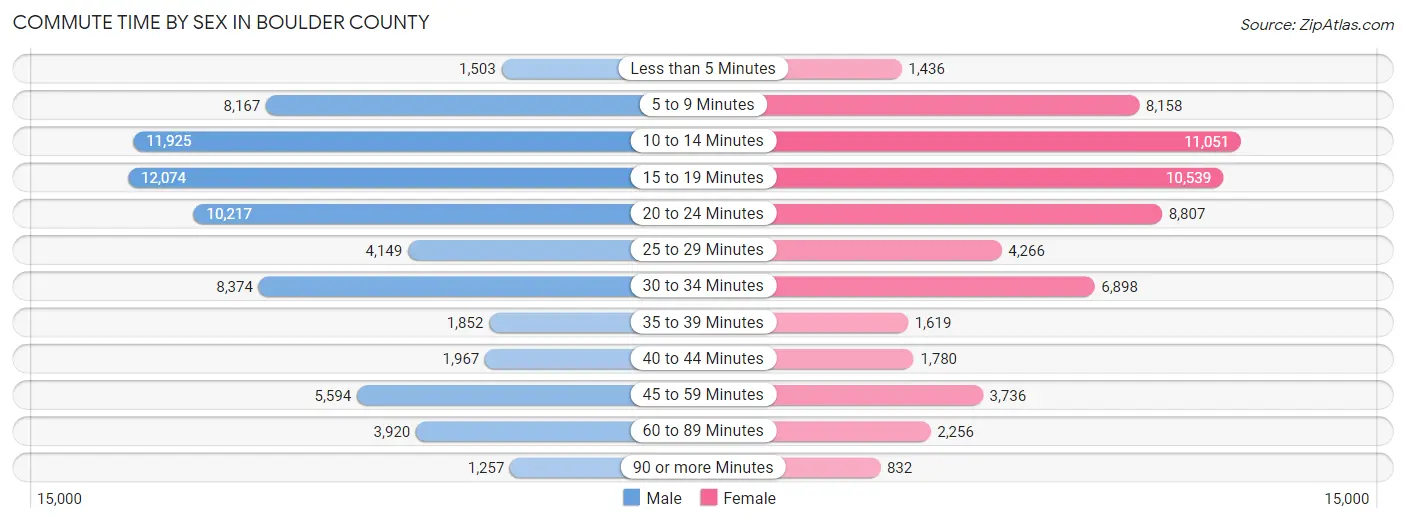
| Commute Time | Male | Female |
| Less than 5 Minutes | 1,503 (2.1%) | 1,436 (2.3%) |
| 5 to 9 Minutes | 8,167 (11.5%) | 8,158 (13.3%) |
| 10 to 14 Minutes | 11,925 (16.8%) | 11,051 (18.0%) |
| 15 to 19 Minutes | 12,074 (17.0%) | 10,539 (17.2%) |
| 20 to 24 Minutes | 10,217 (14.4%) | 8,807 (14.3%) |
| 25 to 29 Minutes | 4,149 (5.8%) | 4,266 (7.0%) |
| 30 to 34 Minutes | 8,374 (11.8%) | 6,898 (11.2%) |
| 35 to 39 Minutes | 1,852 (2.6%) | 1,619 (2.6%) |
| 40 to 44 Minutes | 1,967 (2.8%) | 1,780 (2.9%) |
| 45 to 59 Minutes | 5,594 (7.9%) | 3,736 (6.1%) |
| 60 to 89 Minutes | 3,920 (5.5%) | 2,256 (3.7%) |
| 90 or more Minutes | 1,257 (1.8%) | 832 (1.4%) |
Time of Departure to Work by Sex in Boulder County
The most frequent times of departure to work in Boulder County are 8:00 AM to 8:29 AM (11,259, 15.9%) for males and 7:30 AM to 7:59 AM (10,721, 17.5%) for females.
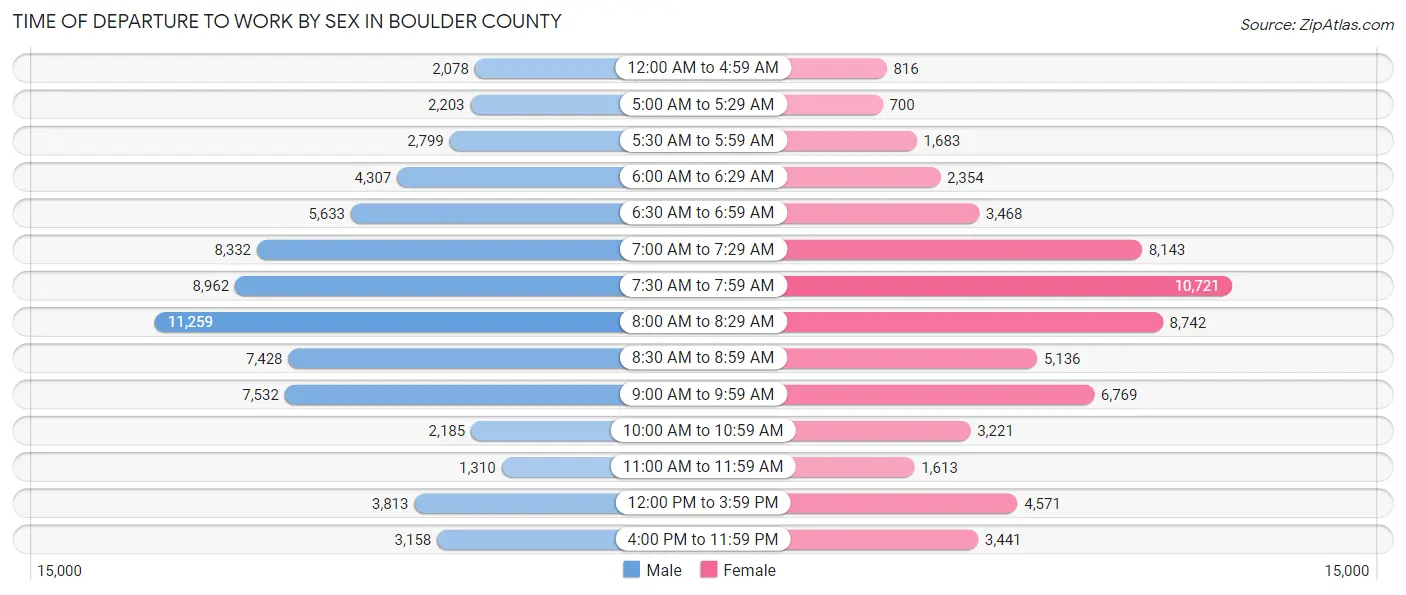
| Time of Departure | Male | Female |
| 12:00 AM to 4:59 AM | 2,078 (2.9%) | 816 (1.3%) |
| 5:00 AM to 5:29 AM | 2,203 (3.1%) | 700 (1.1%) |
| 5:30 AM to 5:59 AM | 2,799 (3.9%) | 1,683 (2.7%) |
| 6:00 AM to 6:29 AM | 4,307 (6.1%) | 2,354 (3.8%) |
| 6:30 AM to 6:59 AM | 5,633 (7.9%) | 3,468 (5.7%) |
| 7:00 AM to 7:29 AM | 8,332 (11.7%) | 8,143 (13.3%) |
| 7:30 AM to 7:59 AM | 8,962 (12.6%) | 10,721 (17.5%) |
| 8:00 AM to 8:29 AM | 11,259 (15.9%) | 8,742 (14.2%) |
| 8:30 AM to 8:59 AM | 7,428 (10.5%) | 5,136 (8.4%) |
| 9:00 AM to 9:59 AM | 7,532 (10.6%) | 6,769 (11.0%) |
| 10:00 AM to 10:59 AM | 2,185 (3.1%) | 3,221 (5.2%) |
| 11:00 AM to 11:59 AM | 1,310 (1.8%) | 1,613 (2.6%) |
| 12:00 PM to 3:59 PM | 3,813 (5.4%) | 4,571 (7.4%) |
| 4:00 PM to 11:59 PM | 3,158 (4.4%) | 3,441 (5.6%) |
| Total | 70,999 (100.0%) | 61,378 (100.0%) |
Housing Occupancy in Boulder County
Occupancy by Ownership in Boulder County
Of the total 133,390 dwellings in Boulder County, owner-occupied units account for 83,066 (62.3%), while renter-occupied units make up 50,324 (37.7%).
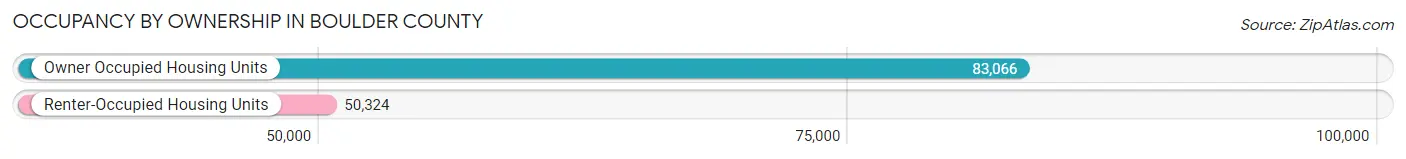
| Occupancy | # Housing Units | % Housing Units |
| Owner Occupied Housing Units | 83,066 | 62.3% |
| Renter-Occupied Housing Units | 50,324 | 37.7% |
| Total Occupied Housing Units | 133,390 | 100.0% |
Occupancy by Household Size in Boulder County
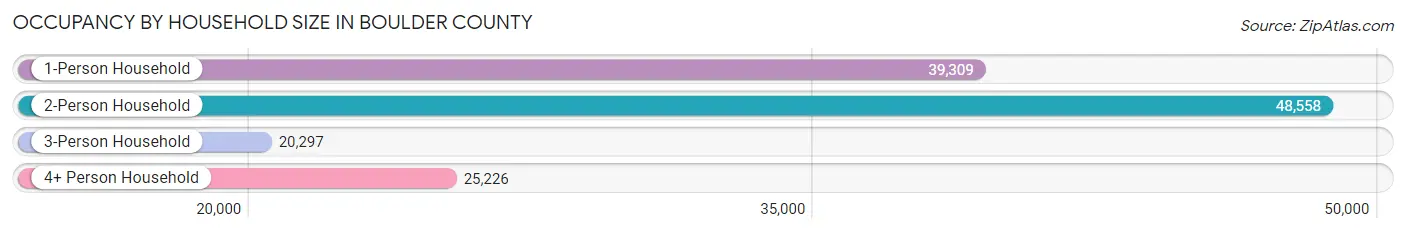
| Household Size | # Housing Units | % Housing Units |
| 1-Person Household | 39,309 | 29.5% |
| 2-Person Household | 48,558 | 36.4% |
| 3-Person Household | 20,297 | 15.2% |
| 4+ Person Household | 25,226 | 18.9% |
| Total Housing Units | 133,390 | 100.0% |
Occupancy by Ownership by Household Size in Boulder County
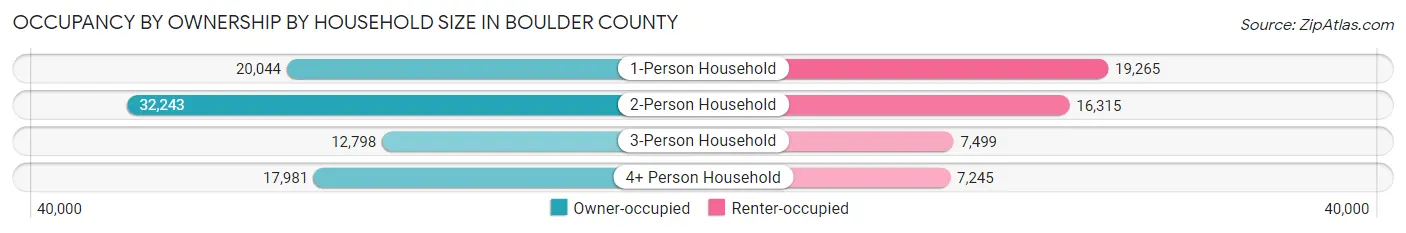
| Household Size | Owner-occupied | Renter-occupied |
| 1-Person Household | 20,044 (51.0%) | 19,265 (49.0%) |
| 2-Person Household | 32,243 (66.4%) | 16,315 (33.6%) |
| 3-Person Household | 12,798 (63.0%) | 7,499 (36.9%) |
| 4+ Person Household | 17,981 (71.3%) | 7,245 (28.7%) |
| Total Housing Units | 83,066 (62.3%) | 50,324 (37.7%) |
Occupancy by Educational Attainment in Boulder County
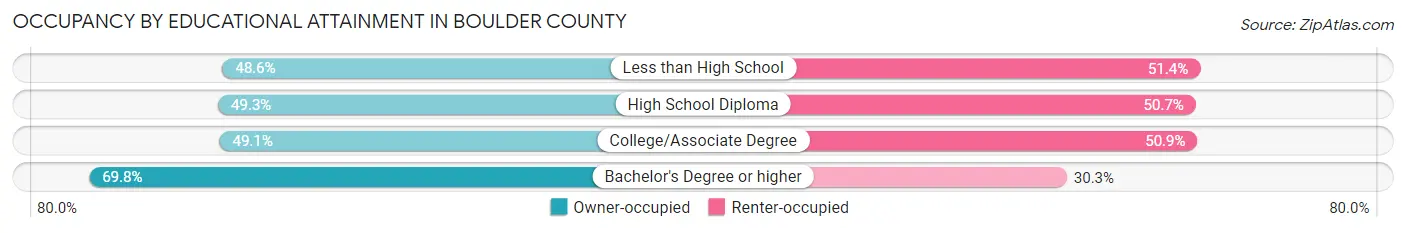
| Household Size | Owner-occupied | Renter-occupied |
| Less than High School | 2,164 (48.6%) | 2,285 (51.4%) |
| High School Diploma | 6,194 (49.3%) | 6,363 (50.7%) |
| College/Associate Degree | 15,359 (49.1%) | 15,938 (50.9%) |
| Bachelor's Degree or higher | 59,349 (69.8%) | 25,738 (30.2%) |
Occupancy by Age of Householder in Boulder County
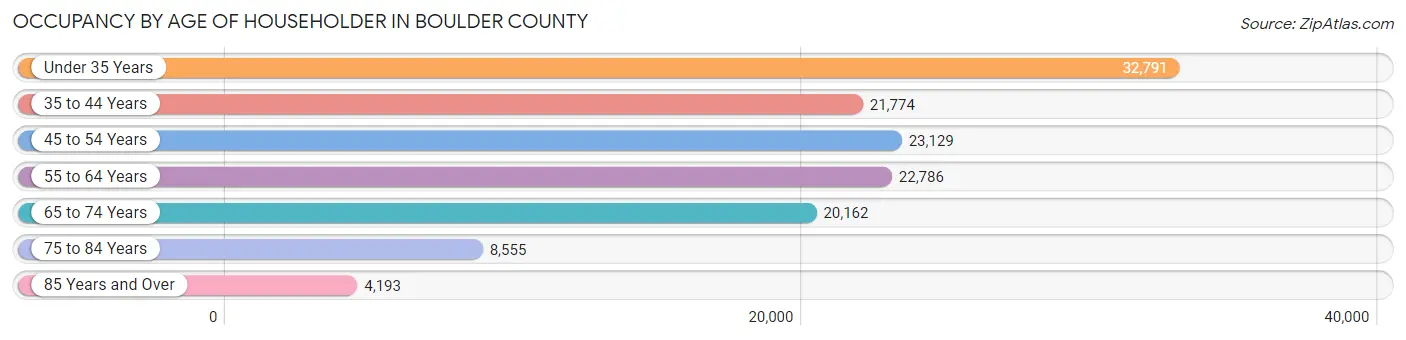
| Age Bracket | # Households | % Households |
| Under 35 Years | 32,791 | 24.6% |
| 35 to 44 Years | 21,774 | 16.3% |
| 45 to 54 Years | 23,129 | 17.3% |
| 55 to 64 Years | 22,786 | 17.1% |
| 65 to 74 Years | 20,162 | 15.1% |
| 75 to 84 Years | 8,555 | 6.4% |
| 85 Years and Over | 4,193 | 3.1% |
| Total | 133,390 | 100.0% |
Housing Finances in Boulder County
Median Income by Occupancy in Boulder County
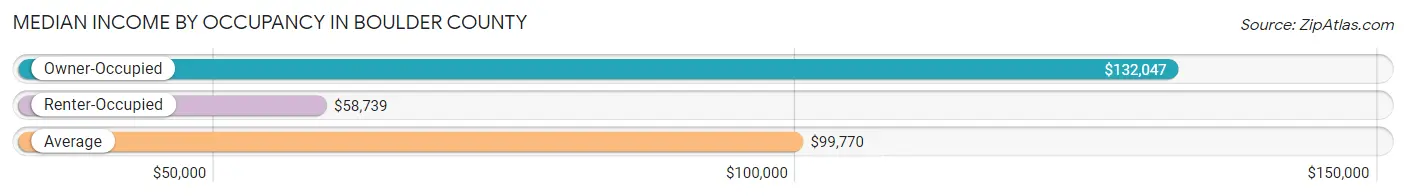
| Occupancy Type | # Households | Median Income |
| Owner-Occupied | 83,066 (62.3%) | $132,047 |
| Renter-Occupied | 50,324 (37.7%) | $58,739 |
| Average | 133,390 (100.0%) | $99,770 |
Occupancy by Householder Income Bracket in Boulder County
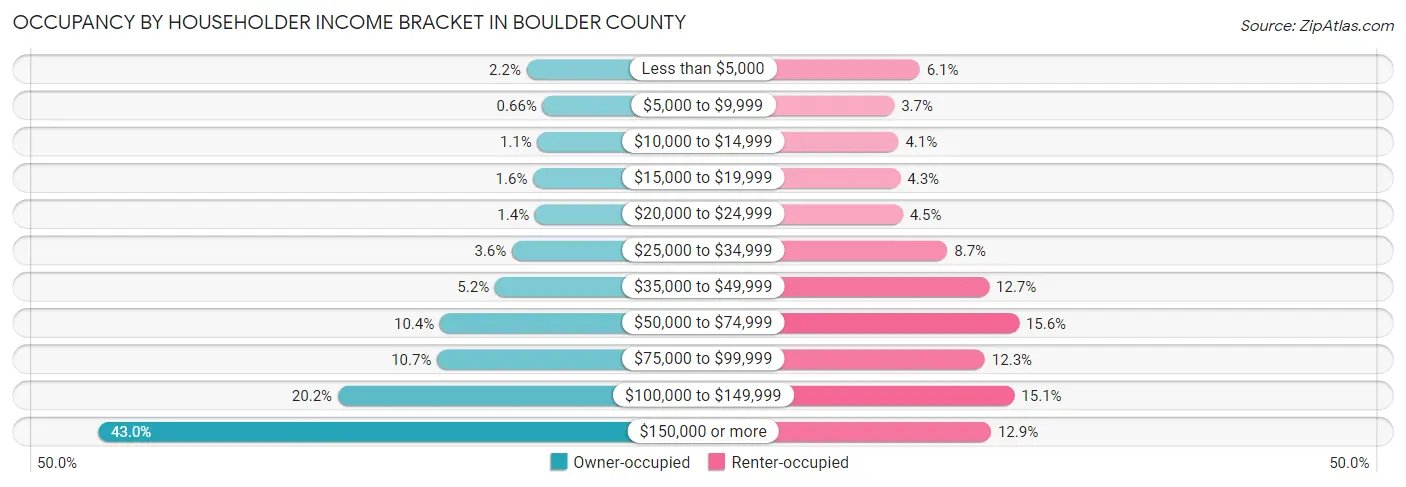
| Income Bracket | Owner-occupied | Renter-occupied |
| Less than $5,000 | 1,813 (2.2%) | 3,074 (6.1%) |
| $5,000 to $9,999 | 546 (0.7%) | 1,852 (3.7%) |
| $10,000 to $14,999 | 947 (1.1%) | 2,057 (4.1%) |
| $15,000 to $19,999 | 1,299 (1.6%) | 2,148 (4.3%) |
| $20,000 to $24,999 | 1,152 (1.4%) | 2,261 (4.5%) |
| $25,000 to $34,999 | 2,963 (3.6%) | 4,396 (8.7%) |
| $35,000 to $49,999 | 4,323 (5.2%) | 6,403 (12.7%) |
| $50,000 to $74,999 | 8,664 (10.4%) | 7,830 (15.6%) |
| $75,000 to $99,999 | 8,887 (10.7%) | 6,198 (12.3%) |
| $100,000 to $149,999 | 16,745 (20.2%) | 7,614 (15.1%) |
| $150,000 or more | 35,727 (43.0%) | 6,491 (12.9%) |
| Total | 83,066 (100.0%) | 50,324 (100.0%) |
Monthly Housing Cost Tiers in Boulder County
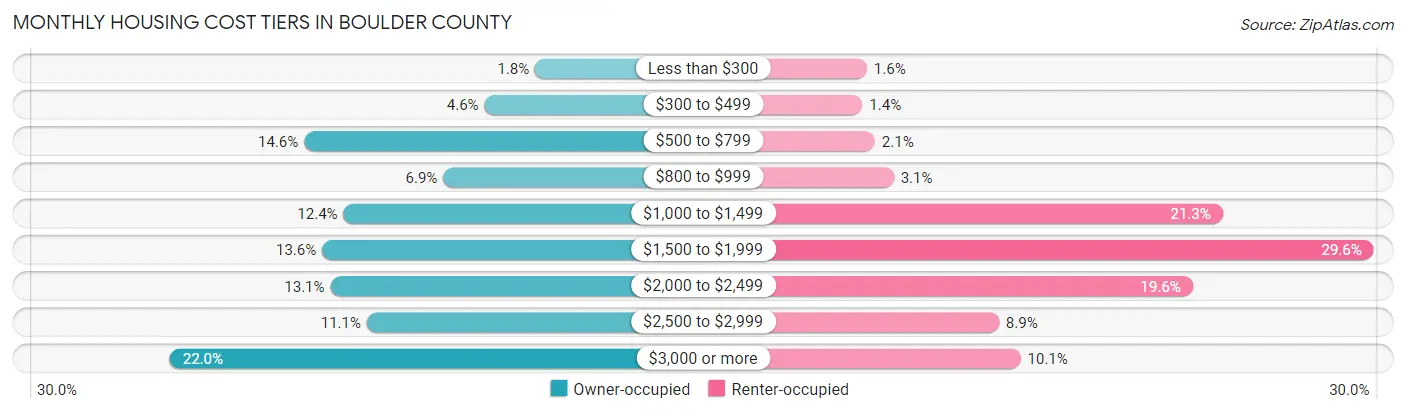
| Monthly Cost | Owner-occupied | Renter-occupied |
| Less than $300 | 1,494 (1.8%) | 822 (1.6%) |
| $300 to $499 | 3,822 (4.6%) | 695 (1.4%) |
| $500 to $799 | 12,096 (14.6%) | 1,042 (2.1%) |
| $800 to $999 | 5,715 (6.9%) | 1,565 (3.1%) |
| $1,000 to $1,499 | 10,292 (12.4%) | 10,706 (21.3%) |
| $1,500 to $1,999 | 11,275 (13.6%) | 14,899 (29.6%) |
| $2,000 to $2,499 | 10,891 (13.1%) | 9,873 (19.6%) |
| $2,500 to $2,999 | 9,220 (11.1%) | 4,489 (8.9%) |
| $3,000 or more | 18,261 (22.0%) | 5,094 (10.1%) |
| Total | 83,066 (100.0%) | 50,324 (100.0%) |
Physical Housing Characteristics in Boulder County
Housing Structures in Boulder County
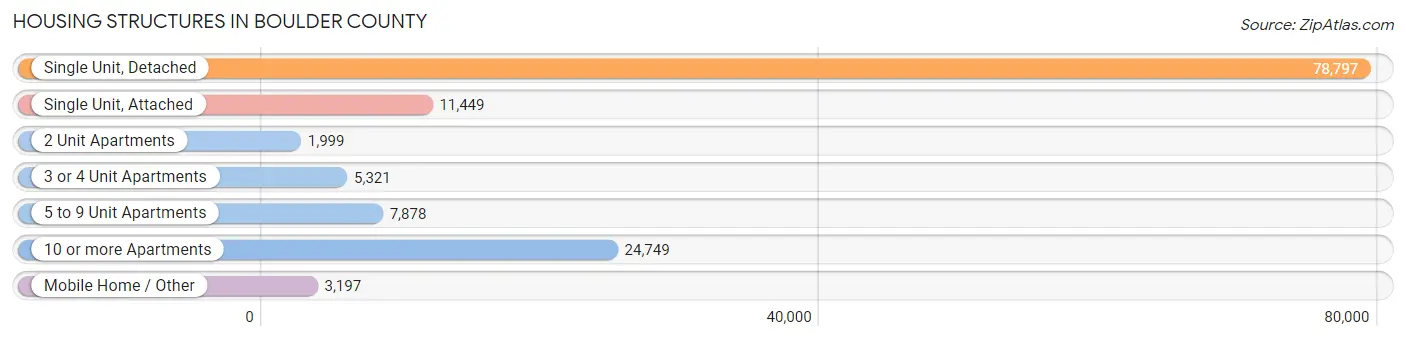
| Structure Type | # Housing Units | % Housing Units |
| Single Unit, Detached | 78,797 | 59.1% |
| Single Unit, Attached | 11,449 | 8.6% |
| 2 Unit Apartments | 1,999 | 1.5% |
| 3 or 4 Unit Apartments | 5,321 | 4.0% |
| 5 to 9 Unit Apartments | 7,878 | 5.9% |
| 10 or more Apartments | 24,749 | 18.5% |
| Mobile Home / Other | 3,197 | 2.4% |
| Total | 133,390 | 100.0% |
Housing Structures by Occupancy in Boulder County
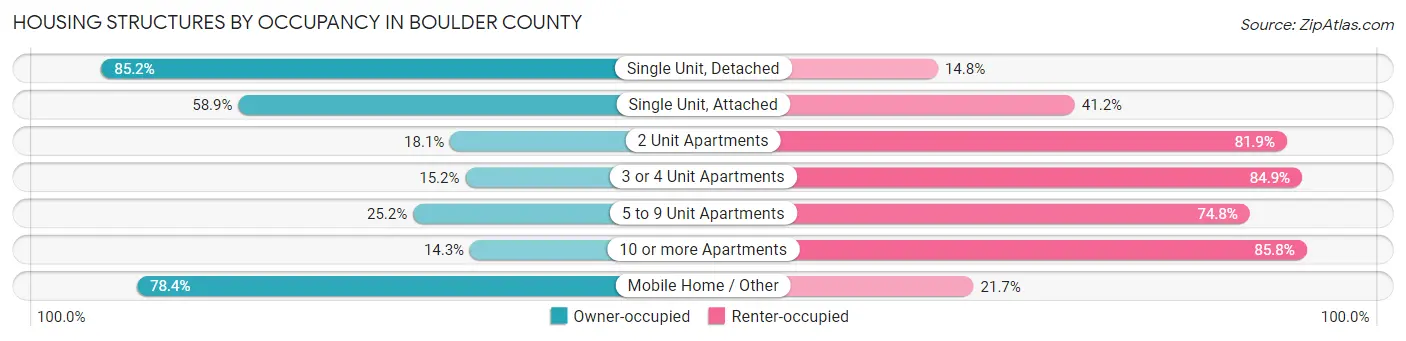
| Structure Type | Owner-occupied | Renter-occupied |
| Single Unit, Detached | 67,144 (85.2%) | 11,653 (14.8%) |
| Single Unit, Attached | 6,738 (58.9%) | 4,711 (41.1%) |
| 2 Unit Apartments | 361 (18.1%) | 1,638 (81.9%) |
| 3 or 4 Unit Apartments | 806 (15.1%) | 4,515 (84.9%) |
| 5 to 9 Unit Apartments | 1,986 (25.2%) | 5,892 (74.8%) |
| 10 or more Apartments | 3,526 (14.2%) | 21,223 (85.8%) |
| Mobile Home / Other | 2,505 (78.3%) | 692 (21.6%) |
| Total | 83,066 (62.3%) | 50,324 (37.7%) |
Housing Structures by Number of Rooms in Boulder County
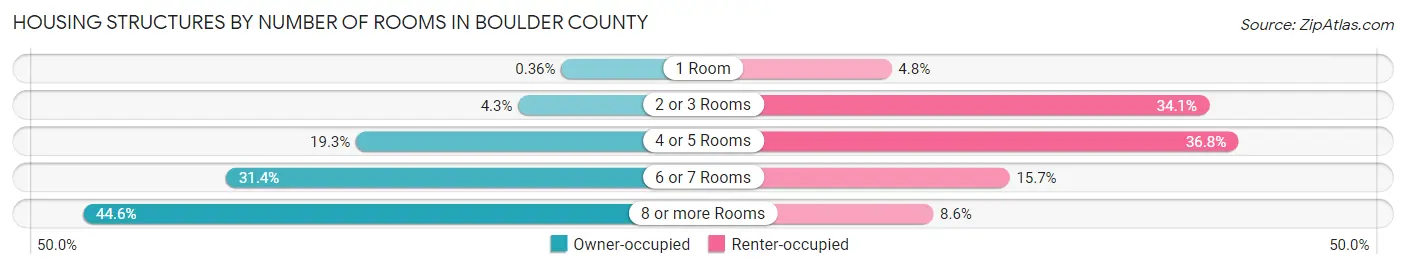
| Number of Rooms | Owner-occupied | Renter-occupied |
| 1 Room | 295 (0.4%) | 2,396 (4.8%) |
| 2 or 3 Rooms | 3,607 (4.3%) | 17,172 (34.1%) |
| 4 or 5 Rooms | 16,064 (19.3%) | 18,526 (36.8%) |
| 6 or 7 Rooms | 26,066 (31.4%) | 7,891 (15.7%) |
| 8 or more Rooms | 37,034 (44.6%) | 4,339 (8.6%) |
| Total | 83,066 (100.0%) | 50,324 (100.0%) |
Housing Structure by Heating Type in Boulder County
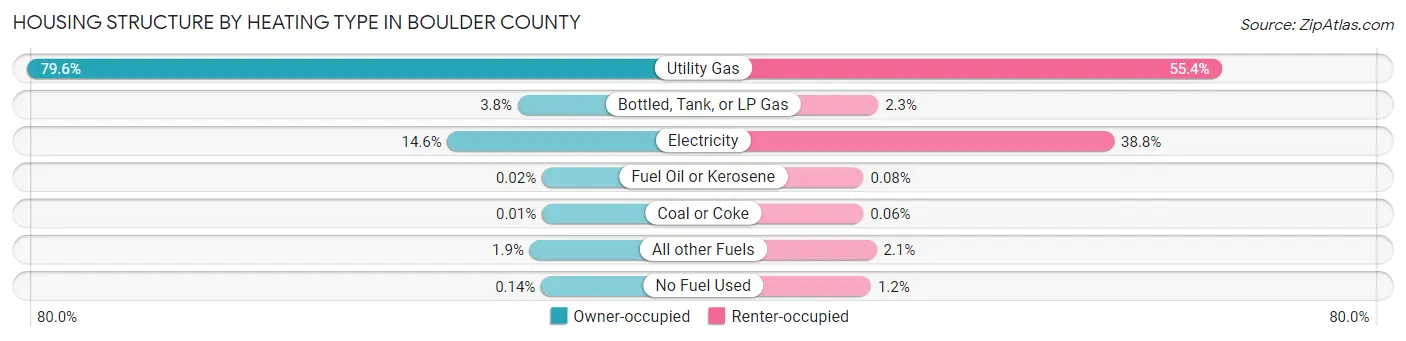
| Heating Type | Owner-occupied | Renter-occupied |
| Utility Gas | 66,076 (79.5%) | 27,882 (55.4%) |
| Bottled, Tank, or LP Gas | 3,122 (3.8%) | 1,178 (2.3%) |
| Electricity | 12,141 (14.6%) | 19,531 (38.8%) |
| Fuel Oil or Kerosene | 18 (0.0%) | 42 (0.1%) |
| Coal or Coke | 5 (0.0%) | 32 (0.1%) |
| All other Fuels | 1,587 (1.9%) | 1,042 (2.1%) |
| No Fuel Used | 117 (0.1%) | 617 (1.2%) |
| Total | 83,066 (100.0%) | 50,324 (100.0%) |
Household Vehicle Usage in Boulder County
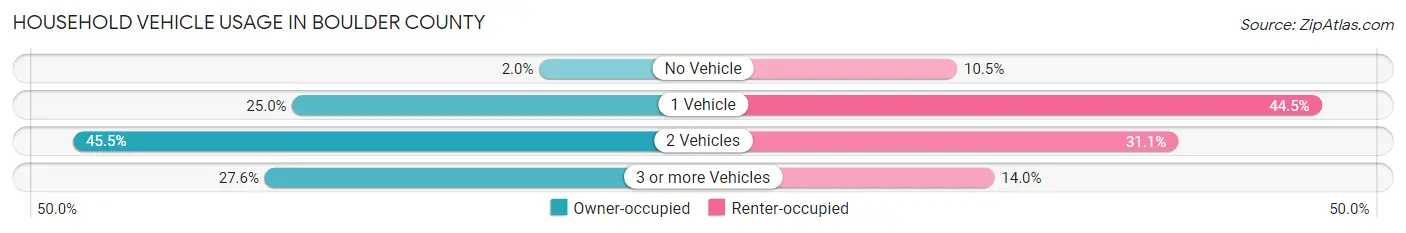
| Vehicles per Household | Owner-occupied | Renter-occupied |
| No Vehicle | 1,617 (1.9%) | 5,267 (10.5%) |
| 1 Vehicle | 20,765 (25.0%) | 22,382 (44.5%) |
| 2 Vehicles | 37,775 (45.5%) | 15,653 (31.1%) |
| 3 or more Vehicles | 22,909 (27.6%) | 7,022 (14.0%) |
| Total | 83,066 (100.0%) | 50,324 (100.0%) |
Real Estate & Mortgages in Boulder County
Real Estate and Mortgage Overview in Boulder County
| Characteristic | Without Mortgage | With Mortgage |
| Housing Units | 27,341 | 55,725 |
| Median Property Value | $657,300 | $677,000 |
| Median Household Income | $97,117 | $27,350 |
| Monthly Housing Costs | $724 | $18,119 |
| Real Estate Taxes | $3,511 | $664 |
Property Value by Mortgage Status in Boulder County
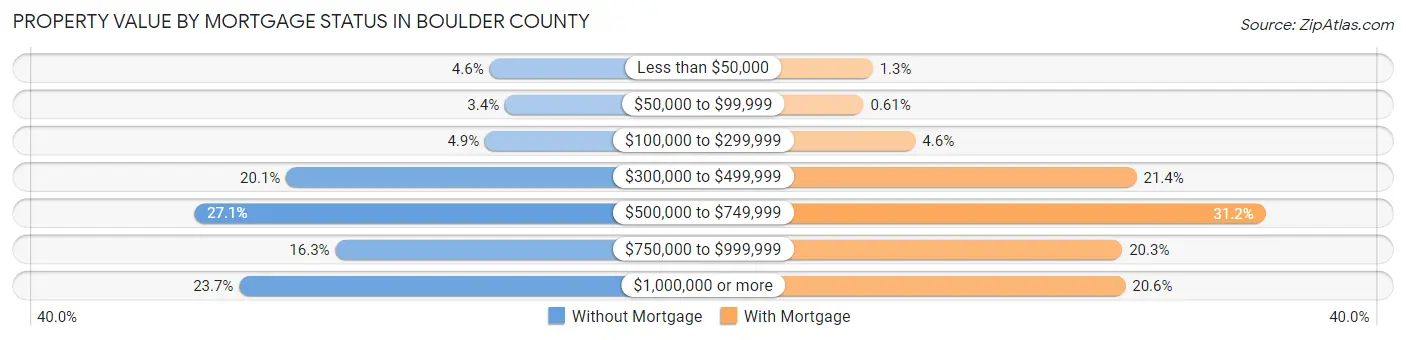
| Property Value | Without Mortgage | With Mortgage |
| Less than $50,000 | 1,251 (4.6%) | 729 (1.3%) |
| $50,000 to $99,999 | 929 (3.4%) | 342 (0.6%) |
| $100,000 to $299,999 | 1,344 (4.9%) | 2,540 (4.6%) |
| $300,000 to $499,999 | 5,486 (20.1%) | 11,929 (21.4%) |
| $500,000 to $749,999 | 7,405 (27.1%) | 17,407 (31.2%) |
| $750,000 to $999,999 | 4,461 (16.3%) | 11,324 (20.3%) |
| $1,000,000 or more | 6,465 (23.6%) | 11,454 (20.5%) |
| Total | 27,341 (100.0%) | 55,725 (100.0%) |
Household Income by Mortgage Status in Boulder County
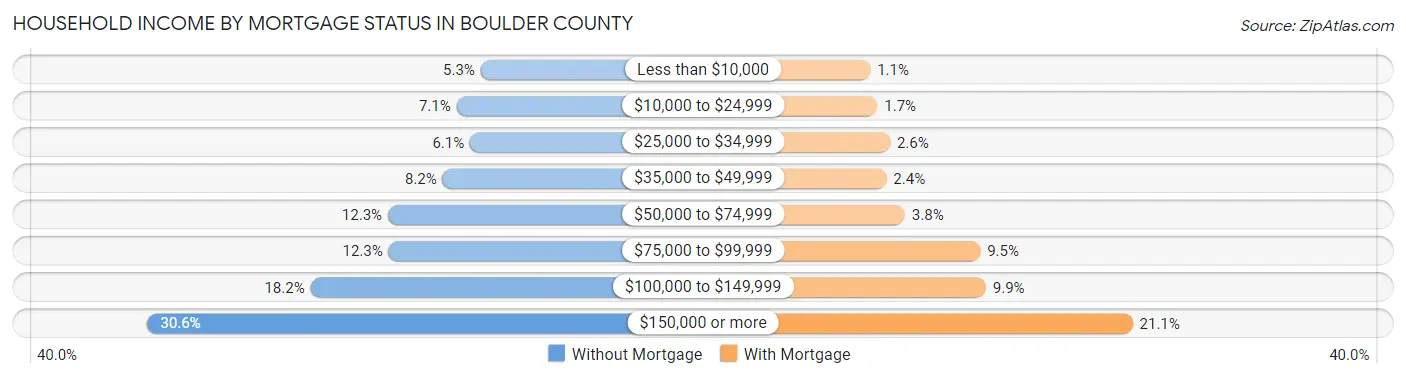
| Household Income | Without Mortgage | With Mortgage |
| Less than $10,000 | 1,436 (5.2%) | 622 (1.1%) |
| $10,000 to $24,999 | 1,938 (7.1%) | 923 (1.7%) |
| $25,000 to $34,999 | 1,656 (6.1%) | 1,460 (2.6%) |
| $35,000 to $49,999 | 2,229 (8.2%) | 1,307 (2.4%) |
| $50,000 to $74,999 | 3,369 (12.3%) | 2,094 (3.8%) |
| $75,000 to $99,999 | 3,354 (12.3%) | 5,295 (9.5%) |
| $100,000 to $149,999 | 4,982 (18.2%) | 5,533 (9.9%) |
| $150,000 or more | 8,377 (30.6%) | 11,763 (21.1%) |
| Total | 27,341 (100.0%) | 55,725 (100.0%) |
Property Value to Household Income Ratio in Boulder County
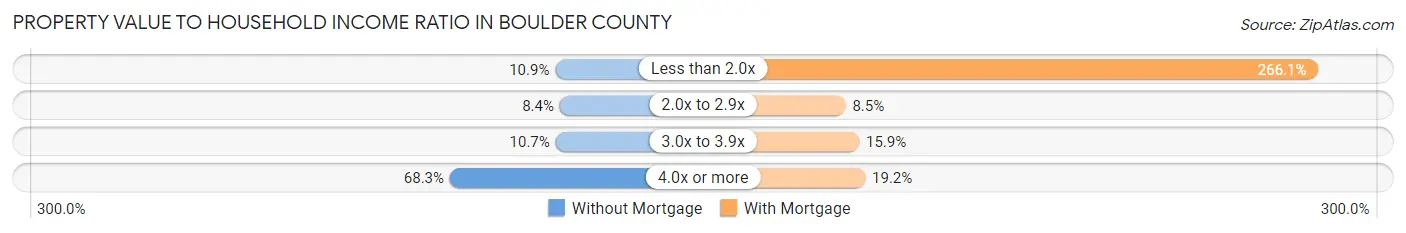
| Value-to-Income Ratio | Without Mortgage | With Mortgage |
| Less than 2.0x | 2,978 (10.9%) | 148,271 (266.1%) |
| 2.0x to 2.9x | 2,301 (8.4%) | 4,714 (8.5%) |
| 3.0x to 3.9x | 2,924 (10.7%) | 8,851 (15.9%) |
| 4.0x or more | 18,672 (68.3%) | 10,685 (19.2%) |
| Total | 27,341 (100.0%) | 55,725 (100.0%) |
Real Estate Taxes by Mortgage Status in Boulder County
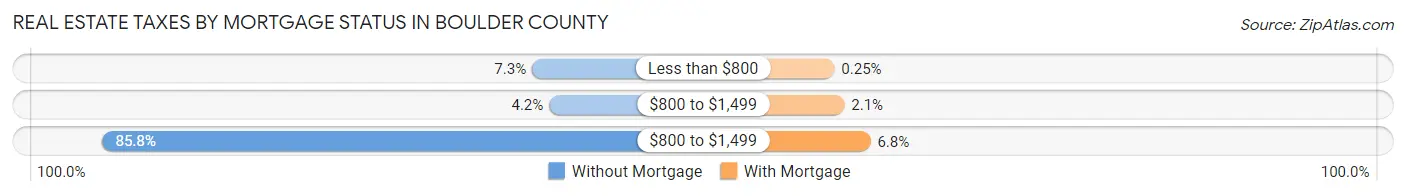
| Property Taxes | Without Mortgage | With Mortgage |
| Less than $800 | 2,003 (7.3%) | 142 (0.3%) |
| $800 to $1,499 | 1,148 (4.2%) | 1,154 (2.1%) |
| $800 to $1,499 | 23,448 (85.8%) | 3,813 (6.8%) |
| Total | 27,341 (100.0%) | 55,725 (100.0%) |
Health & Disability in Boulder County
Health Insurance Coverage by Age in Boulder County
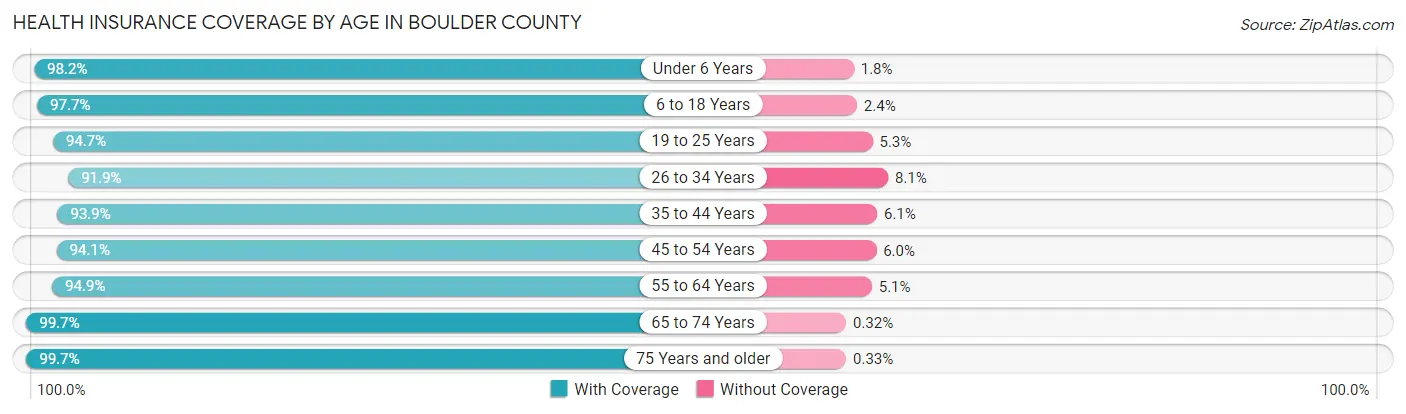
| Age Bracket | With Coverage | Without Coverage |
| Under 6 Years | 16,233 (98.2%) | 292 (1.8%) |
| 6 to 18 Years | 50,136 (97.7%) | 1,205 (2.4%) |
| 19 to 25 Years | 44,577 (94.7%) | 2,478 (5.3%) |
| 26 to 34 Years | 36,960 (91.9%) | 3,277 (8.1%) |
| 35 to 44 Years | 38,447 (93.9%) | 2,504 (6.1%) |
| 45 to 54 Years | 38,791 (94.1%) | 2,453 (5.9%) |
| 55 to 64 Years | 37,972 (94.9%) | 2,053 (5.1%) |
| 65 to 74 Years | 30,832 (99.7%) | 98 (0.3%) |
| 75 Years and older | 18,058 (99.7%) | 60 (0.3%) |
| Total | 312,006 (95.6%) | 14,420 (4.4%) |
Health Insurance Coverage by Citizenship Status in Boulder County
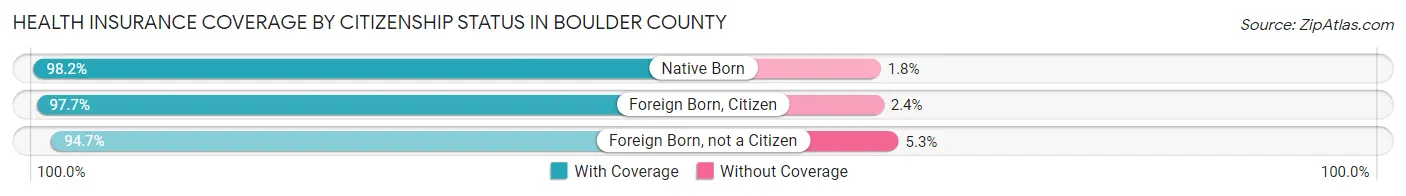
| Citizenship Status | With Coverage | Without Coverage |
| Native Born | 16,233 (98.2%) | 292 (1.8%) |
| Foreign Born, Citizen | 50,136 (97.7%) | 1,205 (2.4%) |
| Foreign Born, not a Citizen | 44,577 (94.7%) | 2,478 (5.3%) |
Health Insurance Coverage by Household Income in Boulder County
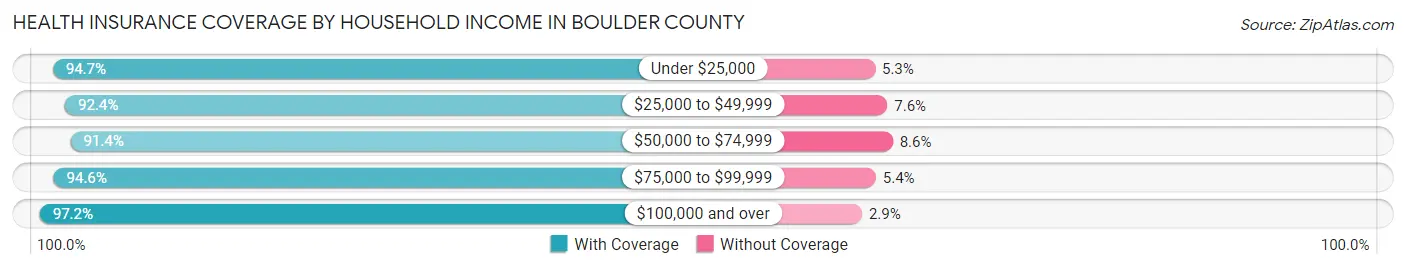
| Household Income | With Coverage | Without Coverage |
| Under $25,000 | 26,682 (94.7%) | 1,489 (5.3%) |
| $25,000 to $49,999 | 30,086 (92.4%) | 2,472 (7.6%) |
| $50,000 to $74,999 | 31,371 (91.4%) | 2,951 (8.6%) |
| $75,000 to $99,999 | 33,844 (94.6%) | 1,948 (5.4%) |
| $100,000 and over | 179,487 (97.2%) | 5,264 (2.9%) |
Public vs Private Health Insurance Coverage by Age in Boulder County
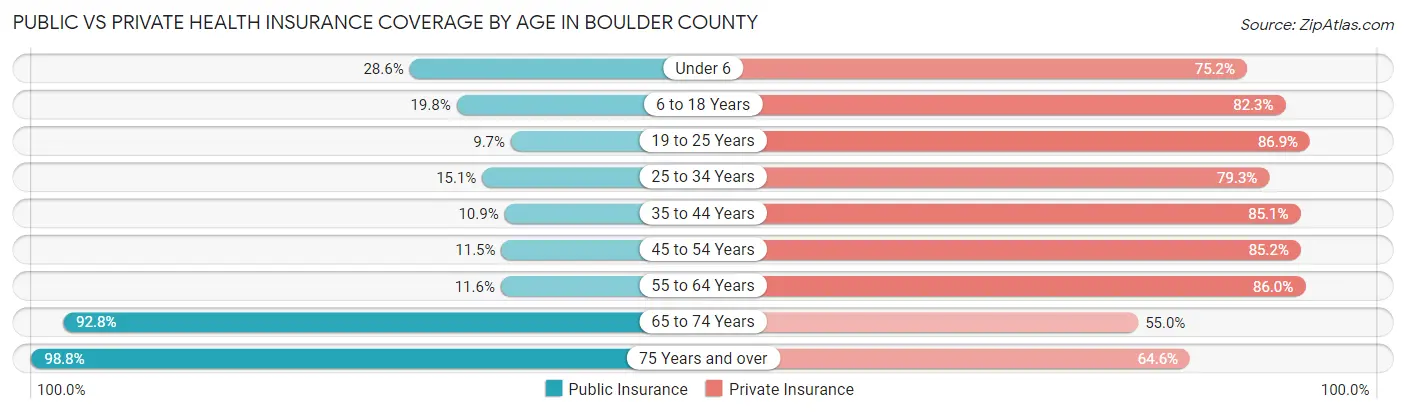
| Age Bracket | Public Insurance | Private Insurance |
| Under 6 | 4,719 (28.6%) | 12,424 (75.2%) |
| 6 to 18 Years | 10,184 (19.8%) | 42,267 (82.3%) |
| 19 to 25 Years | 4,584 (9.7%) | 40,886 (86.9%) |
| 25 to 34 Years | 6,058 (15.1%) | 31,914 (79.3%) |
| 35 to 44 Years | 4,477 (10.9%) | 34,845 (85.1%) |
| 45 to 54 Years | 4,748 (11.5%) | 35,133 (85.2%) |
| 55 to 64 Years | 4,649 (11.6%) | 34,417 (86.0%) |
| 65 to 74 Years | 28,715 (92.8%) | 17,018 (55.0%) |
| 75 Years and over | 17,891 (98.8%) | 11,706 (64.6%) |
| Total | 86,025 (26.4%) | 260,610 (79.8%) |
Disability Status by Sex by Age in Boulder County
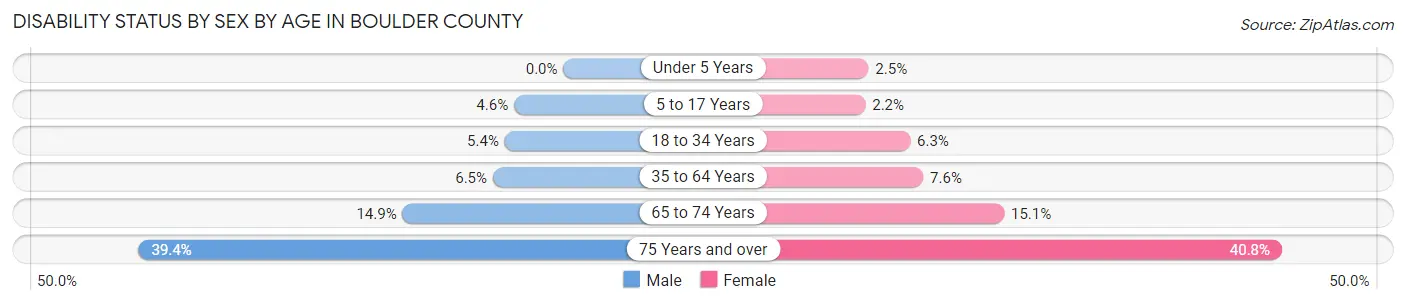
| Age Bracket | Male | Female |
| Under 5 Years | 0 (0.0%) | 164 (2.5%) |
| 5 to 17 Years | 1,083 (4.6%) | 491 (2.2%) |
| 18 to 34 Years | 2,742 (5.4%) | 2,865 (6.3%) |
| 35 to 64 Years | 4,037 (6.5%) | 4,571 (7.5%) |
| 65 to 74 Years | 2,230 (14.9%) | 2,408 (15.1%) |
| 75 Years and over | 3,012 (39.4%) | 4,280 (40.8%) |
Disability Class by Sex by Age in Boulder County
Disability Class: Hearing Difficulty
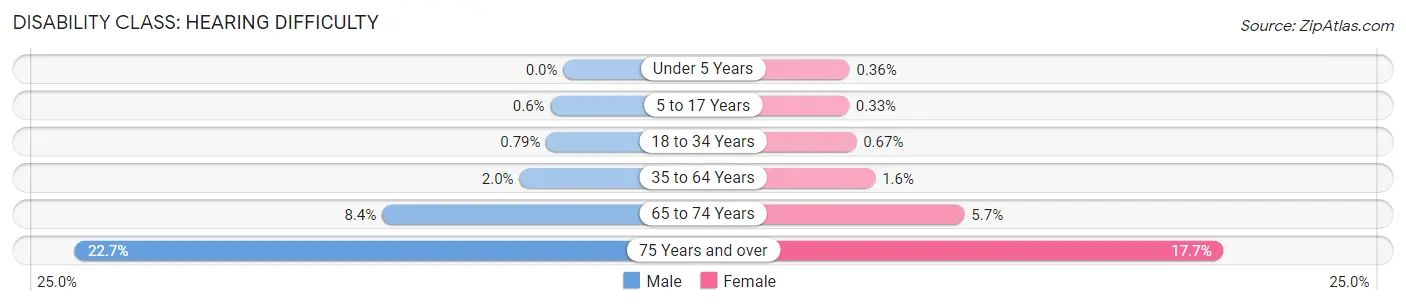
| Age Bracket | Male | Female |
| Under 5 Years | 0 (0.0%) | 24 (0.4%) |
| 5 to 17 Years | 143 (0.6%) | 74 (0.3%) |
| 18 to 34 Years | 397 (0.8%) | 303 (0.7%) |
| 35 to 64 Years | 1,258 (2.0%) | 938 (1.5%) |
| 65 to 74 Years | 1,257 (8.4%) | 909 (5.7%) |
| 75 Years and over | 1,731 (22.7%) | 1,856 (17.7%) |
Disability Class: Vision Difficulty
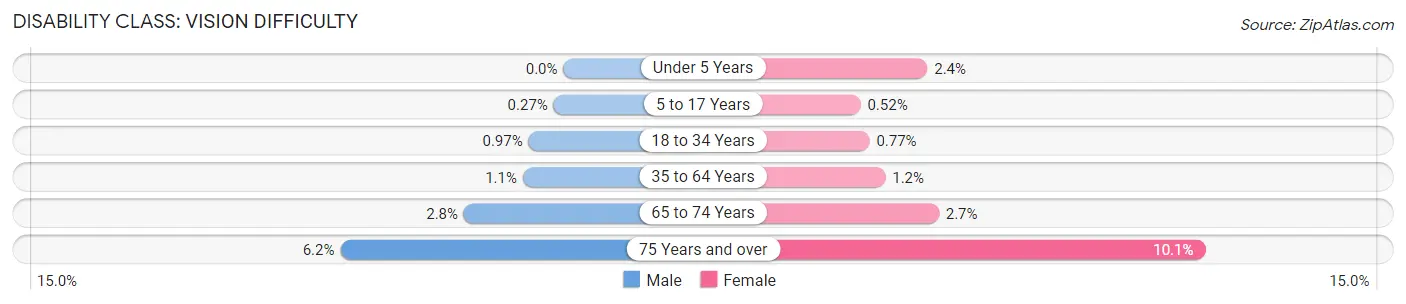
| Age Bracket | Male | Female |
| Under 5 Years | 0 (0.0%) | 158 (2.4%) |
| 5 to 17 Years | 65 (0.3%) | 118 (0.5%) |
| 18 to 34 Years | 489 (1.0%) | 349 (0.8%) |
| 35 to 64 Years | 699 (1.1%) | 733 (1.2%) |
| 65 to 74 Years | 414 (2.8%) | 431 (2.7%) |
| 75 Years and over | 474 (6.2%) | 1,061 (10.1%) |
Disability Class: Cognitive Difficulty
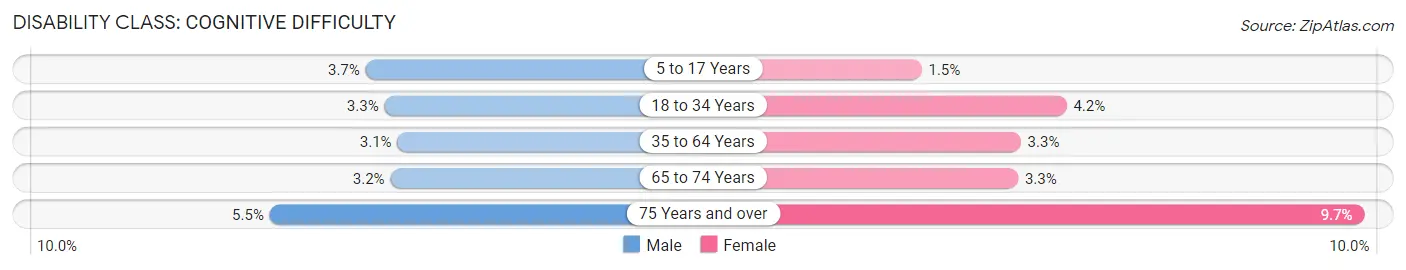
| Age Bracket | Male | Female |
| 5 to 17 Years | 868 (3.7%) | 334 (1.5%) |
| 18 to 34 Years | 1,675 (3.3%) | 1,884 (4.2%) |
| 35 to 64 Years | 1,901 (3.1%) | 2,010 (3.3%) |
| 65 to 74 Years | 479 (3.2%) | 523 (3.3%) |
| 75 Years and over | 416 (5.4%) | 1,017 (9.7%) |
Disability Class: Ambulatory Difficulty
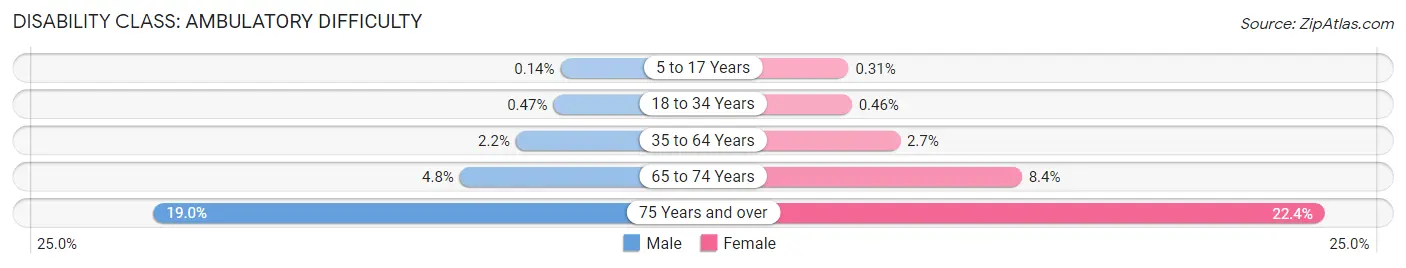
| Age Bracket | Male | Female |
| 5 to 17 Years | 32 (0.1%) | 69 (0.3%) |
| 18 to 34 Years | 238 (0.5%) | 206 (0.5%) |
| 35 to 64 Years | 1,363 (2.2%) | 1,636 (2.7%) |
| 65 to 74 Years | 719 (4.8%) | 1,335 (8.4%) |
| 75 Years and over | 1,452 (19.0%) | 2,347 (22.4%) |
Disability Class: Self-Care Difficulty
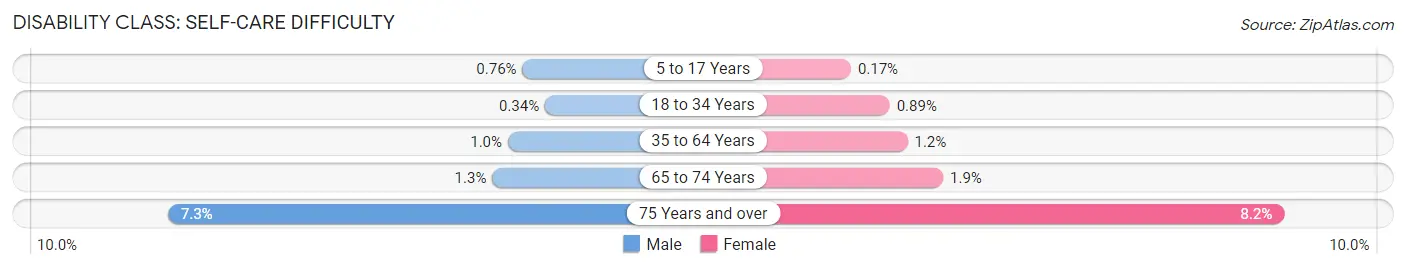
| Age Bracket | Male | Female |
| 5 to 17 Years | 179 (0.8%) | 39 (0.2%) |
| 18 to 34 Years | 174 (0.3%) | 404 (0.9%) |
| 35 to 64 Years | 635 (1.0%) | 738 (1.2%) |
| 65 to 74 Years | 197 (1.3%) | 301 (1.9%) |
| 75 Years and over | 561 (7.3%) | 860 (8.2%) |
Technology Access in Boulder County
Computing Device Access in Boulder County
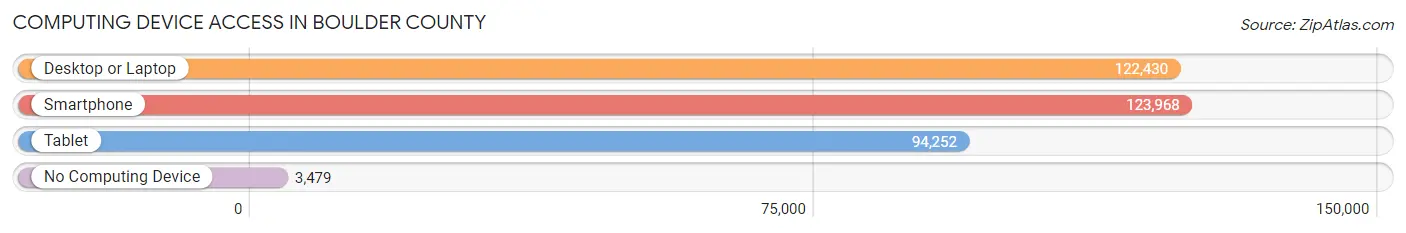
| Device Type | # Households | % Households |
| Desktop or Laptop | 122,430 | 91.8% |
| Smartphone | 123,968 | 92.9% |
| Tablet | 94,252 | 70.7% |
| No Computing Device | 3,479 | 2.6% |
| Total | 133,390 | 100.0% |
Internet Access in Boulder County
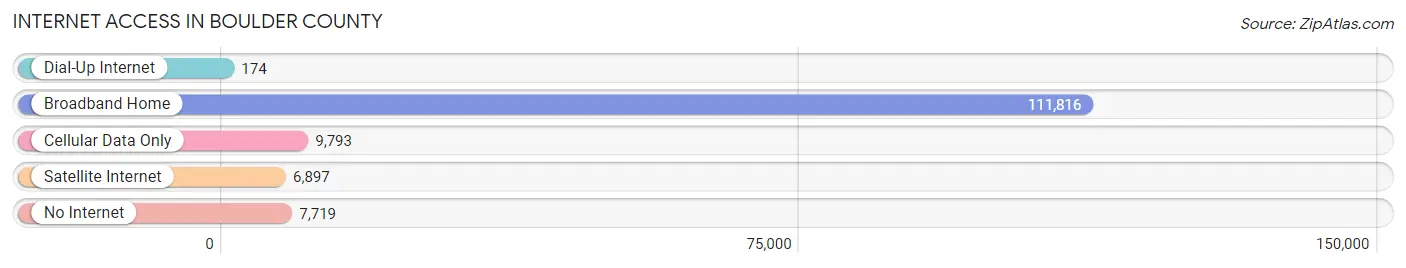
| Internet Type | # Households | % Households |
| Dial-Up Internet | 174 | 0.1% |
| Broadband Home | 111,816 | 83.8% |
| Cellular Data Only | 9,793 | 7.3% |
| Satellite Internet | 6,897 | 5.2% |
| No Internet | 7,719 | 5.8% |
| Total | 133,390 | 100.0% |
Boulder County Summary
Boulder County, Colorado is located in the north-central part of the state and is home to over 300,000 people. It is bordered by Larimer County to the north, Weld County to the east, Broomfield County to the south, and Gilpin and Clear Creek counties to the west. Boulder County is part of the Denver-Aurora-Lakewood Metropolitan Statistical Area and is the 11th most populous county in Colorado.
History
Boulder County was established in 1861 as one of the original 17 counties of the Colorado Territory. The county was named after Boulder Creek, which was named for the large boulders that lined the banks of the creek. The county seat is Boulder, which was founded in 1858 and is the largest city in the county.
The area was originally inhabited by the Arapaho and Ute Native American tribes. The first European settlers arrived in the area in the mid-1800s, and the county was officially established in 1861. The county was originally part of Weld County, but was split off in 1877.
Geography
Boulder County is located in the north-central part of Colorado and covers an area of 740 square miles. The county is bordered by Larimer County to the north, Weld County to the east, Broomfield County to the south, and Gilpin and Clear Creek counties to the west.
The county is located in the foothills of the Rocky Mountains and is home to several mountain ranges, including the Front Range, the Indian Peaks, and the Flatirons. The county is also home to several rivers, including the South Platte River, Boulder Creek, and St. Vrain Creek.
The county has a total area of 740 square miles, of which 739 square miles is land and 1 square mile is water. The highest point in the county is Green Mountain, which has an elevation of 8,144 feet.
Economy
Boulder County has a diverse economy that is driven by the technology, education, and healthcare sectors. The county is home to several major employers, including the University of Colorado Boulder, IBM, Ball Aerospace, and Google.
The county is also home to several major industries, including aerospace, biotechnology, software, and renewable energy. The county is also home to several major research institutions, including the National Center for Atmospheric Research and the National Institute of Standards and Technology.
Demographics
As of the 2010 census, Boulder County had a population of 294,567. The population was estimated to be 315,876 in 2019. The county is home to a diverse population, with the largest racial/ethnic groups being White (77.2%), Hispanic or Latino (13.2%), Asian (4.7%), and Black or African American (2.7%).
The median household income in the county is $77,837, and the median family income is $95,945. The per capita income in the county is $41,945. The poverty rate in the county is 8.2%.
The largest age group in the county is 25-44 (30.2%), followed by 45-64 (27.2%), and under 18 (25.2%). The median age in the county is 36.7.
Common Questions
What is the Total Population of Boulder County?
Total Population of Boulder County is 328,658.
What is the Total Male Population of Boulder County?
Total Male Population of Boulder County is 166,315.
What is the Total Female Population of Boulder County?
Total Female Population of Boulder County is 162,343.
What is the Ratio of Males per 100 Females in Boulder County?
There are 102.45 Males per 100 Females in Boulder County.
What is the Ratio of Females per 100 Males in Boulder County?
There are 97.61 Females per 100 Males in Boulder County.
What is the Median Population Age in Boulder County?
Median Population Age in Boulder County is 37.0 Years.
What is the Average Family Size in Boulder County
Average Family Size in Boulder County is 3.0 People.
What is the Average Household Size in Boulder County
Average Household Size in Boulder County is 2.4 People.
What is Per Capita Income in Boulder County?
Per Capita income in Boulder County is $57,339.
What is the Median Family Income in Boulder County?
Median Family Income in Boulder County is $136,591.
What is the Median Household income in Boulder County?
Median Household Income in Boulder County is $99,770.
What is Income or Wage Gap in Boulder County?
Income or Wage Gap in Boulder County is 38.2%.
Women in Boulder County earn 61.8 cents for every dollar earned by a man.
What is Family Income Deficit in Boulder County?
Family Income Deficit in Boulder County is $10,562.
Families that are below poverty line in Boulder County earn $10,562 less on average than the poverty threshold level.
What is Inequality or Gini Index in Boulder County?
Inequality or Gini Index in Boulder County is 0.49.
How Large is the Labor Force in Boulder County?
There are 186,412 People in the Labor Forcein in Boulder County.
What is the Percentage of People in the Labor Force in Boulder County?
67.4% of People are in the Labor Force in Boulder County.
What is the Unemployment Rate in Boulder County?
Unemployment Rate in Boulder County is 4.4%.