Arapahoe County, CO
Arapahoe County Overview
654,453
TOTAL POPULATION
327,156
MALE POPULATION
327,297
FEMALE POPULATION
99.96
MALES / 100 FEMALES
100.04
FEMALES / 100 MALES
37.1
MEDIAN AGE
3.2
AVG FAMILY SIZE
2.6
AVG HOUSEHOLD SIZE
$49,530
PER CAPITA INCOME
$114,803
AVG FAMILY INCOME
$92,292
AVG HOUSEHOLD INCOME
25.6%
WAGE / INCOME GAP [ % ]
74.4¢/ $1
WAGE / INCOME GAP [ $ ]
$12,012
FAMILY INCOME DEFICIT
0.46
INEQUALITY / GINI INDEX
373,410
LABOR FORCE [ PEOPLE ]
71.4%
PERCENT IN LABOR FORCE
4.6%
UNEMPLOYMENT RATE
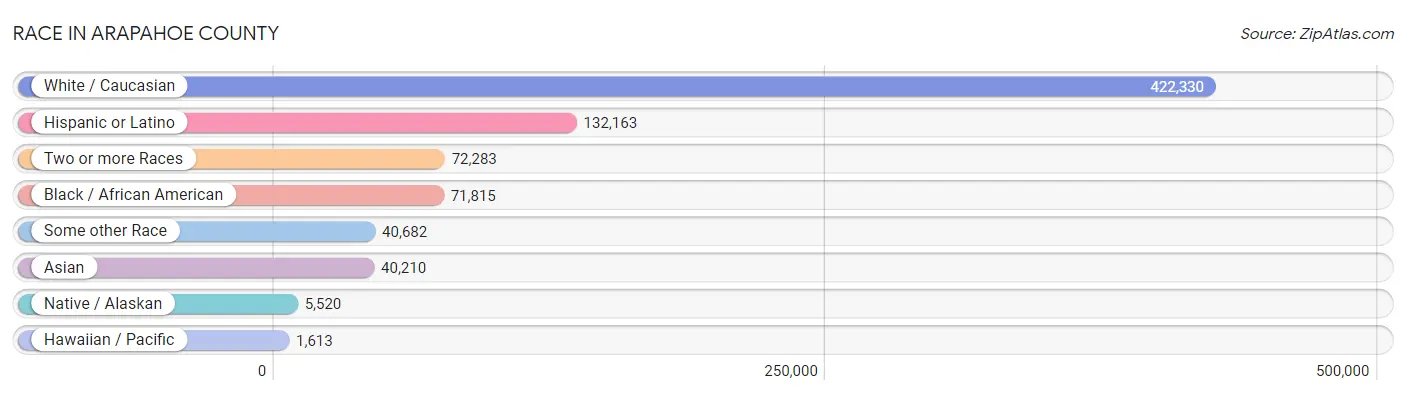
Race in Arapahoe County
The most populous races in Arapahoe County are White / Caucasian (422,330 | 64.5%), Hispanic or Latino (132,163 | 20.2%), and Two or more Races (72,283 | 11.0%).
| Race | # Population | % Population |
| Asian | 40,210 | 6.1% |
| Black / African American | 71,815 | 11.0% |
| Hawaiian / Pacific | 1,613 | 0.3% |
| Hispanic or Latino | 132,163 | 20.2% |
| Native / Alaskan | 5,520 | 0.8% |
| White / Caucasian | 422,330 | 64.5% |
| Two or more Races | 72,283 | 11.0% |
| Some other Race | 40,682 | 6.2% |
| Total | 654,453 | 100.0% |
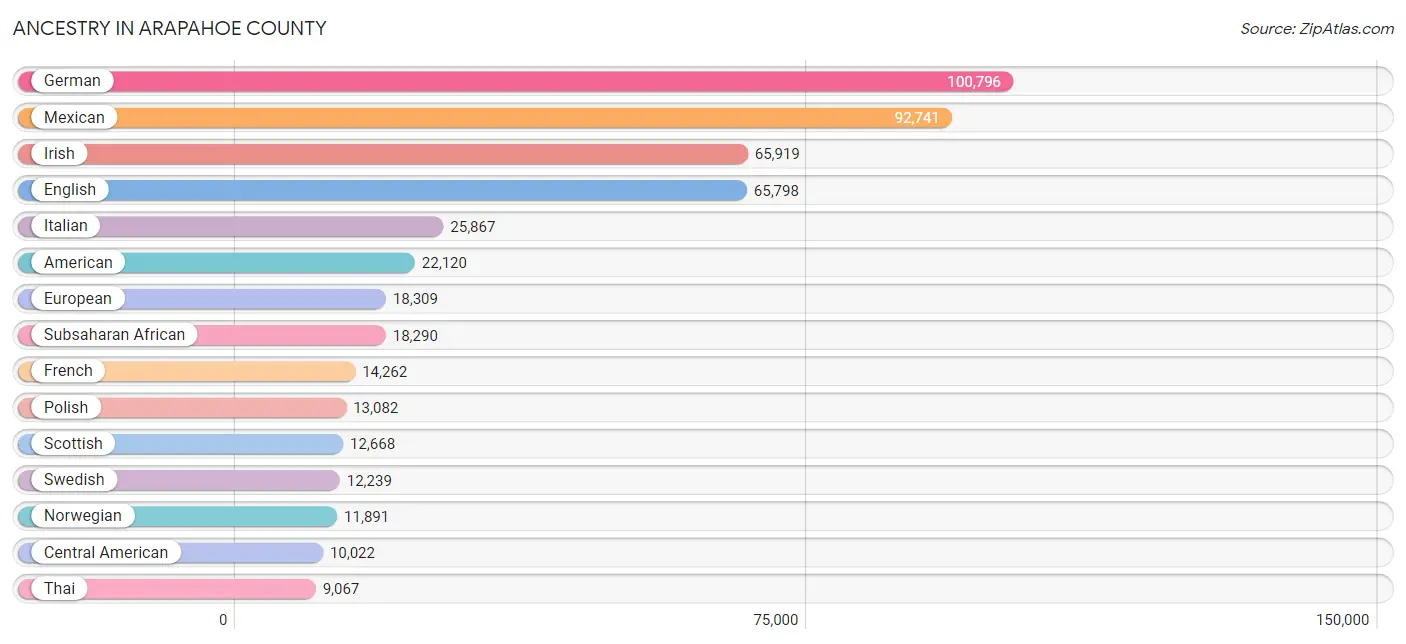
Ancestry in Arapahoe County
The most populous ancestries reported in Arapahoe County are German (100,796 | 15.4%), Mexican (92,741 | 14.2%), Irish (65,919 | 10.1%), English (65,798 | 10.1%), and Italian (25,867 | 4.0%), together accounting for 53.6% of all Arapahoe County residents.
| Ancestry | # Population | % Population |
| Afghan | 335 | 0.1% |
| African | 3,961 | 0.6% |
| Alaska Native | 23 | 0.0% |
| Albanian | 473 | 0.1% |
| Alsatian | 7 | 0.0% |
| American | 22,120 | 3.4% |
| Apache | 705 | 0.1% |
| Arab | 5,821 | 0.9% |
| Arapaho | 110 | 0.0% |
| Argentinean | 819 | 0.1% |
| Armenian | 974 | 0.2% |
| Assyrian / Chaldean / Syriac | 8 | 0.0% |
| Australian | 239 | 0.0% |
| Austrian | 1,709 | 0.3% |
| Bangladeshi | 182 | 0.0% |
| Barbadian | 52 | 0.0% |
| Basque | 126 | 0.0% |
| Belgian | 465 | 0.1% |
| Belizean | 17 | 0.0% |
| Bhutanese | 3,784 | 0.6% |
| Blackfeet | 418 | 0.1% |
| Bolivian | 98 | 0.0% |
| Brazilian | 541 | 0.1% |
| British | 4,329 | 0.7% |
| British West Indian | 115 | 0.0% |
| Bulgarian | 506 | 0.1% |
| Burmese | 8,734 | 1.3% |
| Cajun | 164 | 0.0% |
| Cambodian | 197 | 0.0% |
| Canadian | 1,957 | 0.3% |
| Cape Verdean | 10 | 0.0% |
| Celtic | 285 | 0.0% |
| Central American | 10,022 | 1.5% |
| Central American Indian | 556 | 0.1% |
| Cherokee | 2,062 | 0.3% |
| Cheyenne | 152 | 0.0% |
| Chickasaw | 181 | 0.0% |
| Chilean | 504 | 0.1% |
| Chinese | 13 | 0.0% |
| Chippewa | 133 | 0.0% |
| Choctaw | 581 | 0.1% |
| Colombian | 1,123 | 0.2% |
| Colville | 12 | 0.0% |
| Comanche | 30 | 0.0% |
| Costa Rican | 251 | 0.0% |
| Creek | 369 | 0.1% |
| Croatian | 840 | 0.1% |
| Crow | 31 | 0.0% |
| Cuban | 1,456 | 0.2% |
| Czech | 3,350 | 0.5% |
| Czechoslovakian | 461 | 0.1% |
| Danish | 3,675 | 0.6% |
| Delaware | 4 | 0.0% |
| Dominican | 809 | 0.1% |
| Dutch | 8,374 | 1.3% |
| Dutch West Indian | 10 | 0.0% |
| Eastern European | 2,544 | 0.4% |
| Ecuadorian | 564 | 0.1% |
| Egyptian | 300 | 0.1% |
| English | 65,798 | 10.1% |
| Estonian | 21 | 0.0% |
| Ethiopian | 6,755 | 1.0% |
| European | 18,309 | 2.8% |
| Fijian | 37 | 0.0% |
| Filipino | 518 | 0.1% |
| Finnish | 959 | 0.2% |
| French | 14,262 | 2.2% |
| French American Indian | 13 | 0.0% |
| French Canadian | 2,488 | 0.4% |
| German | 100,796 | 15.4% |
| German Russian | 117 | 0.0% |
| Ghanaian | 1,125 | 0.2% |
| Greek | 2,953 | 0.4% |
| Guamanian / Chamorro | 470 | 0.1% |
| Guatemalan | 1,890 | 0.3% |
| Guyanese | 32 | 0.0% |
| Haitian | 126 | 0.0% |
| Honduran | 3,683 | 0.6% |
| Houma | 8 | 0.0% |
| Hungarian | 2,439 | 0.4% |
| Icelander | 170 | 0.0% |
| Indian (Asian) | 8,882 | 1.4% |
| Indonesian | 834 | 0.1% |
| Inupiat | 105 | 0.0% |
| Iranian | 1,152 | 0.2% |
| Iraqi | 635 | 0.1% |
| Irish | 65,919 | 10.1% |
| Iroquois | 136 | 0.0% |
| Israeli | 184 | 0.0% |
| Italian | 25,867 | 4.0% |
| Jamaican | 654 | 0.1% |
| Japanese | 719 | 0.1% |
| Jordanian | 255 | 0.0% |
| Kenyan | 604 | 0.1% |
| Kiowa | 12 | 0.0% |
| Korean | 6,837 | 1.0% |
| Laotian | 761 | 0.1% |
| Latvian | 234 | 0.0% |
| Lebanese | 939 | 0.1% |
| Liberian | 203 | 0.0% |
| Lithuanian | 1,090 | 0.2% |
| Lumbee | 15 | 0.0% |
| Luxembourger | 82 | 0.0% |
| Macedonian | 106 | 0.0% |
| Malaysian | 470 | 0.1% |
| Maltese | 30 | 0.0% |
| Marshallese | 166 | 0.0% |
| Mexican | 92,741 | 14.2% |
| Mexican American Indian | 1,348 | 0.2% |
| Mongolian | 26 | 0.0% |
| Moroccan | 747 | 0.1% |
| Native Hawaiian | 1,385 | 0.2% |
| Navajo | 1,100 | 0.2% |
| New Zealander | 8 | 0.0% |
| Nicaraguan | 329 | 0.1% |
| Nigerian | 976 | 0.2% |
| Northern European | 1,479 | 0.2% |
| Norwegian | 11,891 | 1.8% |
| Okinawan | 183 | 0.0% |
| Osage | 187 | 0.0% |
| Paiute | 1 | 0.0% |
| Pakistani | 663 | 0.1% |
| Palestinian | 766 | 0.1% |
| Panamanian | 422 | 0.1% |
| Paraguayan | 73 | 0.0% |
| Pennsylvania German | 90 | 0.0% |
| Peruvian | 1,833 | 0.3% |
| Pima | 20 | 0.0% |
| Polish | 13,082 | 2.0% |
| Portuguese | 1,799 | 0.3% |
| Potawatomi | 33 | 0.0% |
| Pueblo | 452 | 0.1% |
| Puerto Rican | 6,199 | 0.9% |
| Puget Sound Salish | 10 | 0.0% |
| Romanian | 957 | 0.2% |
| Russian | 7,898 | 1.2% |
| Salvadoran | 3,410 | 0.5% |
| Samoan | 541 | 0.1% |
| Scandinavian | 3,212 | 0.5% |
| Scotch-Irish | 6,559 | 1.0% |
| Scottish | 12,668 | 1.9% |
| Seminole | 46 | 0.0% |
| Senegalese | 225 | 0.0% |
| Serbian | 296 | 0.1% |
| Sierra Leonean | 139 | 0.0% |
| Sioux | 800 | 0.1% |
| Slavic | 378 | 0.1% |
| Slovak | 1,005 | 0.2% |
| Slovene | 373 | 0.1% |
| Somali | 1,012 | 0.2% |
| South African | 99 | 0.0% |
| South American | 6,345 | 1.0% |
| South American Indian | 75 | 0.0% |
| Soviet Union | 3 | 0.0% |
| Spaniard | 4,468 | 0.7% |
| Spanish | 3,884 | 0.6% |
| Spanish American | 214 | 0.0% |
| Spanish American Indian | 122 | 0.0% |
| Sri Lankan | 7,033 | 1.1% |
| Subsaharan African | 18,290 | 2.8% |
| Sudanese | 1,102 | 0.2% |
| Swedish | 12,239 | 1.9% |
| Swiss | 1,974 | 0.3% |
| Syrian | 120 | 0.0% |
| Thai | 9,067 | 1.4% |
| Tongan | 340 | 0.1% |
| Trinidadian and Tobagonian | 54 | 0.0% |
| Turkish | 347 | 0.1% |
| Ugandan | 156 | 0.0% |
| Ukrainian | 2,012 | 0.3% |
| Uruguayan | 63 | 0.0% |
| Ute | 692 | 0.1% |
| Venezuelan | 1,254 | 0.2% |
| Vietnamese | 344 | 0.1% |
| Welsh | 4,341 | 0.7% |
| West Indian | 340 | 0.1% |
| Yaqui | 28 | 0.0% |
| Yugoslavian | 438 | 0.1% | View All 178 Rows |
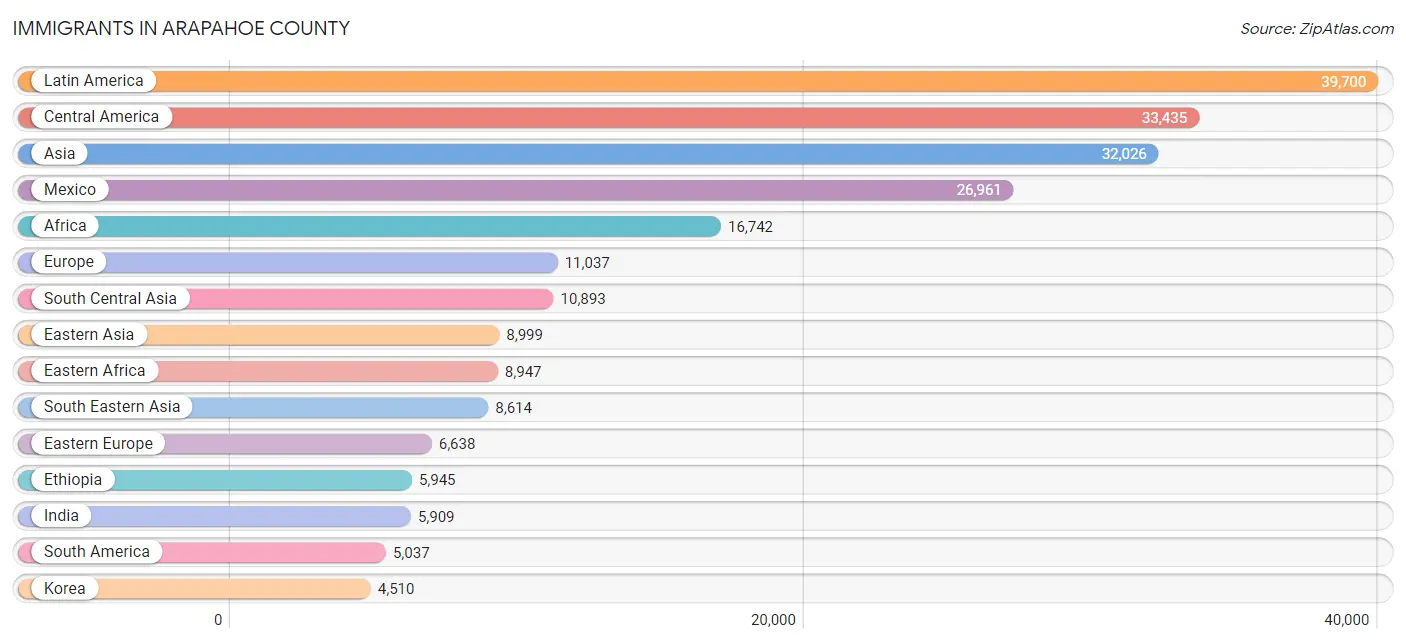
Immigrants in Arapahoe County
The most numerous immigrant groups reported in Arapahoe County came from Latin America (39,700 | 6.1%), Central America (33,435 | 5.1%), Asia (32,026 | 4.9%), Mexico (26,961 | 4.1%), and Africa (16,742 | 2.6%), together accounting for 22.8% of all Arapahoe County residents.
| Immigration Origin | # Population | % Population |
| Afghanistan | 350 | 0.1% |
| Africa | 16,742 | 2.6% |
| Albania | 24 | 0.0% |
| Argentina | 323 | 0.1% |
| Armenia | 127 | 0.0% |
| Asia | 32,026 | 4.9% |
| Australia | 397 | 0.1% |
| Austria | 66 | 0.0% |
| Azores | 11 | 0.0% |
| Bangladesh | 742 | 0.1% |
| Barbados | 20 | 0.0% |
| Belarus | 454 | 0.1% |
| Belgium | 225 | 0.0% |
| Belize | 81 | 0.0% |
| Bolivia | 33 | 0.0% |
| Bosnia and Herzegovina | 187 | 0.0% |
| Brazil | 588 | 0.1% |
| Bulgaria | 447 | 0.1% |
| Cabo Verde | 30 | 0.0% |
| Cambodia | 570 | 0.1% |
| Cameroon | 119 | 0.0% |
| Canada | 1,793 | 0.3% |
| Caribbean | 1,228 | 0.2% |
| Central America | 33,435 | 5.1% |
| Chile | 449 | 0.1% |
| China | 3,694 | 0.6% |
| Colombia | 691 | 0.1% |
| Congo | 419 | 0.1% |
| Costa Rica | 81 | 0.0% |
| Croatia | 48 | 0.0% |
| Cuba | 396 | 0.1% |
| Czechoslovakia | 218 | 0.0% |
| Denmark | 31 | 0.0% |
| Dominica | 16 | 0.0% |
| Dominican Republic | 345 | 0.1% |
| Eastern Africa | 8,947 | 1.4% |
| Eastern Asia | 8,999 | 1.4% |
| Eastern Europe | 6,638 | 1.0% |
| Ecuador | 374 | 0.1% |
| Egypt | 176 | 0.0% |
| El Salvador | 2,299 | 0.4% |
| England | 787 | 0.1% |
| Eritrea | 1,261 | 0.2% |
| Ethiopia | 5,945 | 0.9% |
| Europe | 11,037 | 1.7% |
| France | 338 | 0.1% |
| Germany | 1,282 | 0.2% |
| Ghana | 1,588 | 0.2% |
| Greece | 206 | 0.0% |
| Grenada | 12 | 0.0% |
| Guatemala | 1,246 | 0.2% |
| Guyana | 63 | 0.0% |
| Haiti | 93 | 0.0% |
| Honduras | 2,402 | 0.4% |
| Hong Kong | 162 | 0.0% |
| Hungary | 145 | 0.0% |
| India | 5,909 | 0.9% |
| Indonesia | 393 | 0.1% |
| Iran | 802 | 0.1% |
| Iraq | 1,655 | 0.3% |
| Ireland | 145 | 0.0% |
| Israel | 160 | 0.0% |
| Italy | 116 | 0.0% |
| Jamaica | 251 | 0.0% |
| Japan | 636 | 0.1% |
| Jordan | 166 | 0.0% |
| Kazakhstan | 66 | 0.0% |
| Kenya | 869 | 0.1% |
| Korea | 4,510 | 0.7% |
| Kuwait | 38 | 0.0% |
| Laos | 283 | 0.0% |
| Latin America | 39,700 | 6.1% |
| Latvia | 78 | 0.0% |
| Lebanon | 210 | 0.0% |
| Liberia | 311 | 0.1% |
| Lithuania | 171 | 0.0% |
| Malaysia | 214 | 0.0% |
| Mexico | 26,961 | 4.1% |
| Micronesia | 79 | 0.0% |
| Middle Africa | 705 | 0.1% |
| Moldova | 236 | 0.0% |
| Morocco | 734 | 0.1% |
| Nepal | 1,153 | 0.2% |
| Netherlands | 149 | 0.0% |
| Nicaragua | 254 | 0.0% |
| Nigeria | 674 | 0.1% |
| North Macedonia | 62 | 0.0% |
| Northern Africa | 2,507 | 0.4% |
| Northern Europe | 1,842 | 0.3% |
| Norway | 161 | 0.0% |
| Oceania | 686 | 0.1% |
| Pakistan | 558 | 0.1% |
| Panama | 111 | 0.0% |
| Peru | 1,189 | 0.2% |
| Philippines | 2,657 | 0.4% |
| Poland | 417 | 0.1% |
| Portugal | 55 | 0.0% |
| Romania | 257 | 0.0% |
| Russia | 2,085 | 0.3% |
| Saudi Arabia | 143 | 0.0% |
| Scotland | 38 | 0.0% |
| Senegal | 242 | 0.0% |
| Serbia | 29 | 0.0% |
| Sierra Leone | 114 | 0.0% |
| Singapore | 94 | 0.0% |
| Somalia | 291 | 0.0% |
| South Africa | 266 | 0.0% |
| South America | 5,037 | 0.8% |
| South Central Asia | 10,893 | 1.7% |
| South Eastern Asia | 8,614 | 1.3% |
| Southern Europe | 436 | 0.1% |
| Spain | 52 | 0.0% |
| Sri Lanka | 12 | 0.0% |
| St. Vincent and the Grenadines | 19 | 0.0% |
| Sudan | 1,176 | 0.2% |
| Sweden | 53 | 0.0% |
| Switzerland | 61 | 0.0% |
| Syria | 169 | 0.0% |
| Taiwan | 662 | 0.1% |
| Thailand | 391 | 0.1% |
| Trinidad and Tobago | 15 | 0.0% |
| Turkey | 207 | 0.0% |
| Uganda | 123 | 0.0% |
| Ukraine | 1,157 | 0.2% |
| Uruguay | 34 | 0.0% |
| Uzbekistan | 126 | 0.0% |
| Venezuela | 1,194 | 0.2% |
| Vietnam | 3,447 | 0.5% |
| Western Africa | 3,979 | 0.6% |
| Western Asia | 3,358 | 0.5% |
| Western Europe | 2,121 | 0.3% |
| Yemen | 59 | 0.0% |
| Zaire | 112 | 0.0% |
| Zimbabwe | 33 | 0.0% | View All 134 Rows |
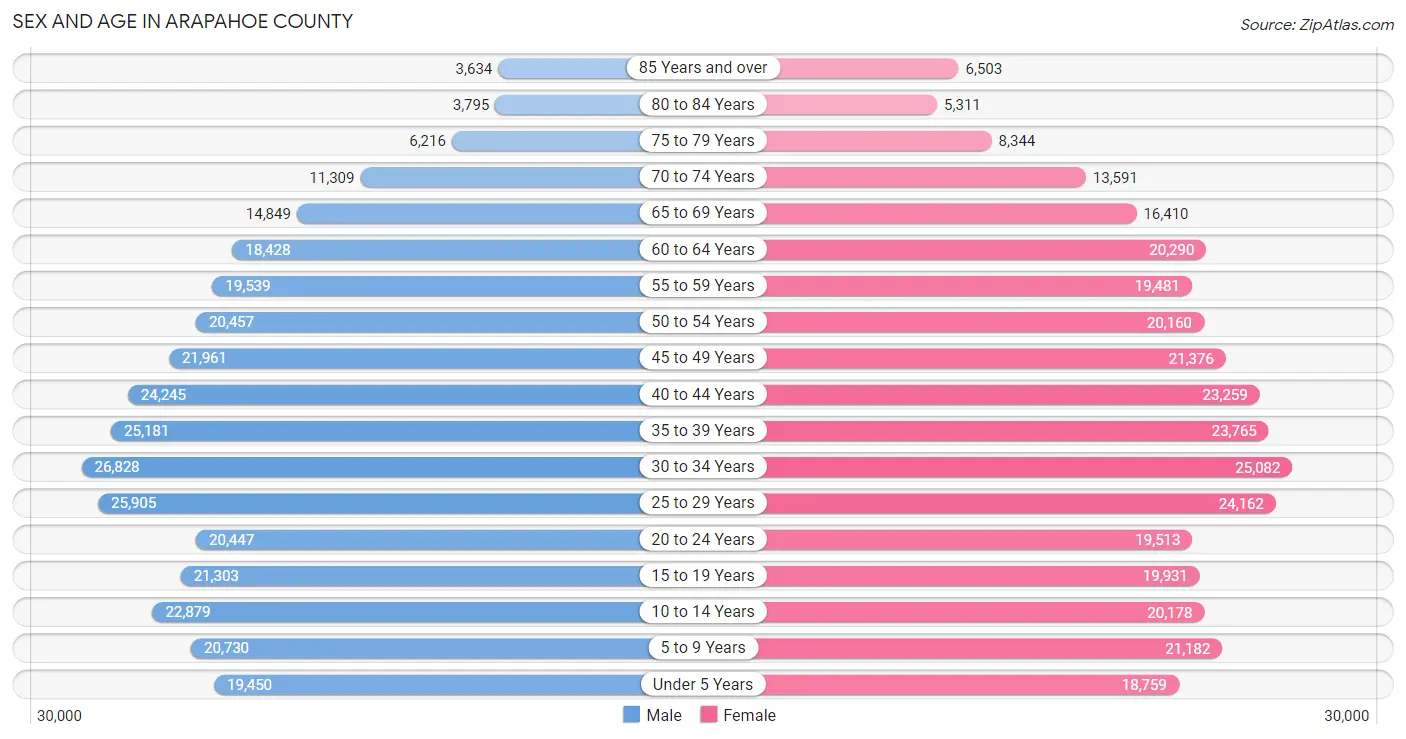
Sex and Age in Arapahoe County
Sex and Age in Arapahoe County
The most populous age groups in Arapahoe County are 30 to 34 Years (26,828 | 8.2%) for men and 30 to 34 Years (25,082 | 7.7%) for women.
| Age Bracket | Male | Female |
| Under 5 Years | 19,450 (5.9%) | 18,759 (5.7%) |
| 5 to 9 Years | 20,730 (6.3%) | 21,182 (6.5%) |
| 10 to 14 Years | 22,879 (7.0%) | 20,178 (6.2%) |
| 15 to 19 Years | 21,303 (6.5%) | 19,931 (6.1%) |
| 20 to 24 Years | 20,447 (6.2%) | 19,513 (6.0%) |
| 25 to 29 Years | 25,905 (7.9%) | 24,162 (7.4%) |
| 30 to 34 Years | 26,828 (8.2%) | 25,082 (7.7%) |
| 35 to 39 Years | 25,181 (7.7%) | 23,765 (7.3%) |
| 40 to 44 Years | 24,245 (7.4%) | 23,259 (7.1%) |
| 45 to 49 Years | 21,961 (6.7%) | 21,376 (6.5%) |
| 50 to 54 Years | 20,457 (6.2%) | 20,160 (6.2%) |
| 55 to 59 Years | 19,539 (6.0%) | 19,481 (5.9%) |
| 60 to 64 Years | 18,428 (5.6%) | 20,290 (6.2%) |
| 65 to 69 Years | 14,849 (4.5%) | 16,410 (5.0%) |
| 70 to 74 Years | 11,309 (3.5%) | 13,591 (4.2%) |
| 75 to 79 Years | 6,216 (1.9%) | 8,344 (2.5%) |
| 80 to 84 Years | 3,795 (1.2%) | 5,311 (1.6%) |
| 85 Years and over | 3,634 (1.1%) | 6,503 (2.0%) |
| Total | 327,156 (100.0%) | 327,297 (100.0%) |
Families and Households in Arapahoe County
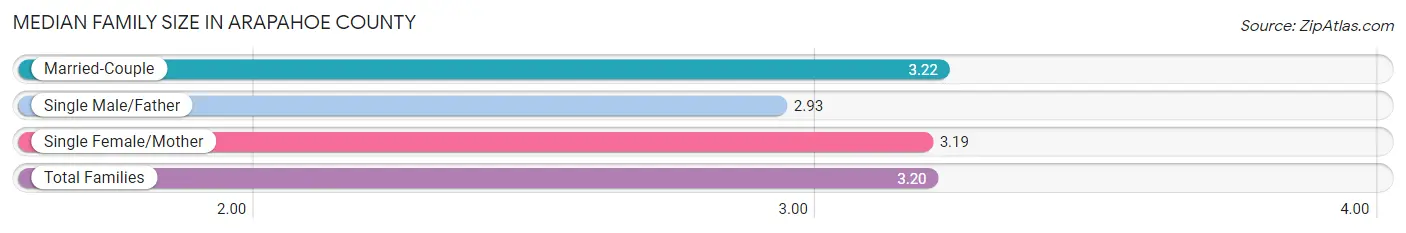
Median Family Size in Arapahoe County
The median family size in Arapahoe County is 3.20 persons per family, with married-couple families (122,352 | 75.7%) accounting for the largest median family size of 3.22 persons per family. On the other hand, single male/father families (12,263 | 7.6%) represent the smallest median family size with 2.93 persons per family.
| Family Type | # Families | Family Size |
| Married-Couple | 122,352 (75.7%) | 3.22 |
| Single Male/Father | 12,263 (7.6%) | 2.93 |
| Single Female/Mother | 26,966 (16.7%) | 3.19 |
| Total Families | 161,581 (100.0%) | 3.20 |
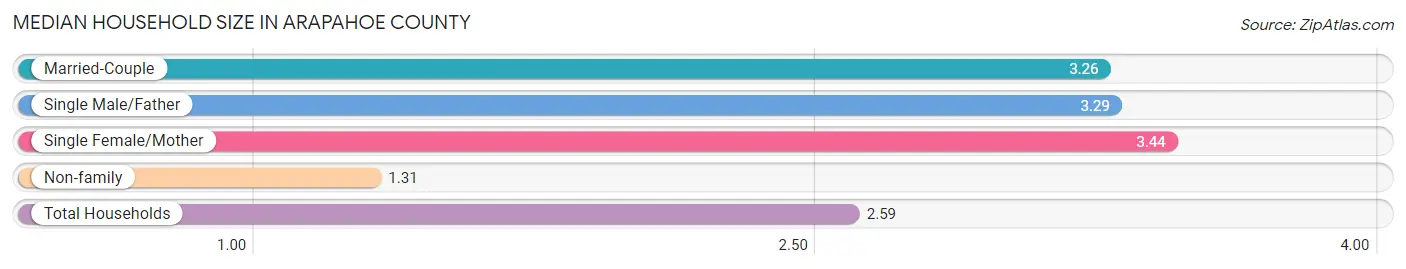
Median Household Size in Arapahoe County
The median household size in Arapahoe County is 2.59 persons per household, with single female/mother households (26,966 | 10.7%) accounting for the largest median household size of 3.44 persons per household. non-family households (89,170 | 35.6%) represent the smallest median household size with 1.31 persons per household.
| Household Type | # Households | Household Size |
| Married-Couple | 122,352 (48.8%) | 3.26 |
| Single Male/Father | 12,263 (4.9%) | 3.29 |
| Single Female/Mother | 26,966 (10.7%) | 3.44 |
| Non-family | 89,170 (35.6%) | 1.31 |
| Total Households | 250,751 (100.0%) | 2.59 |
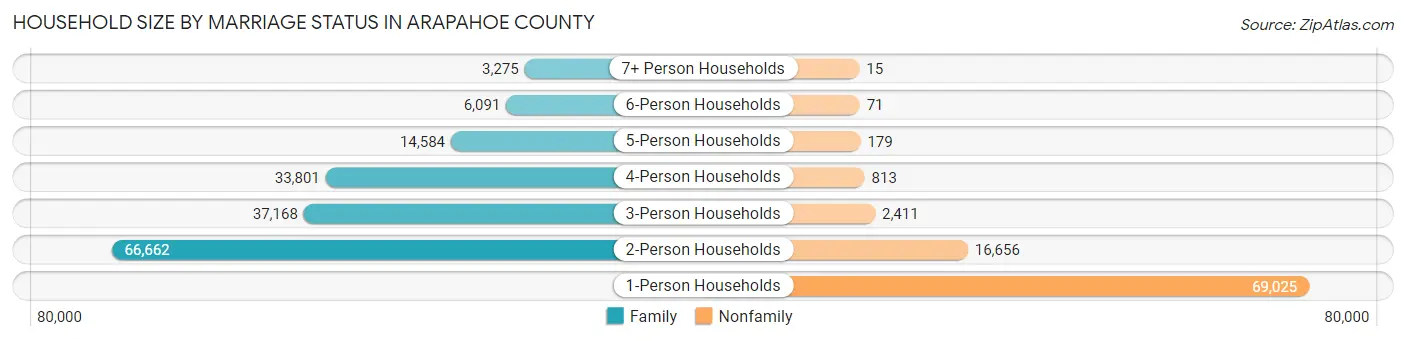
Household Size by Marriage Status in Arapahoe County
Out of a total of 250,751 households in Arapahoe County, 161,581 (64.4%) are family households, while 89,170 (35.6%) are nonfamily households. The most numerous type of family households are 2-person households, comprising 66,662, and the most common type of nonfamily households are 1-person households, comprising 69,025.
| Household Size | Family Households | Nonfamily Households |
| 1-Person Households | - | 69,025 (27.5%) |
| 2-Person Households | 66,662 (26.6%) | 16,656 (6.6%) |
| 3-Person Households | 37,168 (14.8%) | 2,411 (1.0%) |
| 4-Person Households | 33,801 (13.5%) | 813 (0.3%) |
| 5-Person Households | 14,584 (5.8%) | 179 (0.1%) |
| 6-Person Households | 6,091 (2.4%) | 71 (0.0%) |
| 7+ Person Households | 3,275 (1.3%) | 15 (0.0%) |
| Total | 161,581 (64.4%) | 89,170 (35.6%) |
Female Fertility in Arapahoe County
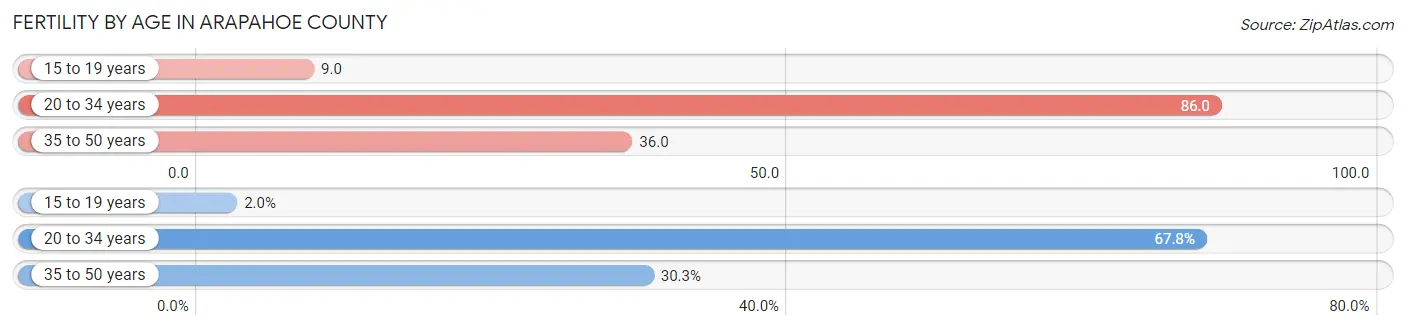
Fertility by Age in Arapahoe County
Average fertility rate in Arapahoe County is 54.0 births per 1,000 women. Women in the age bracket of 20 to 34 years have the highest fertility rate with 86.0 births per 1,000 women. Women in the age bracket of 20 to 34 years acount for 67.8% of all women with births.
| Age Bracket | Women with Births | Births / 1,000 Women |
| 15 to 19 years | 172 (2.0%) | 9.0 |
| 20 to 34 years | 5,898 (67.8%) | 86.0 |
| 35 to 50 years | 2,633 (30.2%) | 36.0 |
| Total | 8,703 (100.0%) | 54.0 |
Fertility by Age by Marriage Status in Arapahoe County
77.2% of women with births (8,703) in Arapahoe County are married. The highest percentage of unmarried women with births falls into 15 to 19 years age bracket with 82.0% of them unmarried at the time of birth, while the lowest percentage of unmarried women with births belong to 35 to 50 years age bracket with 19.4% of them unmarried.
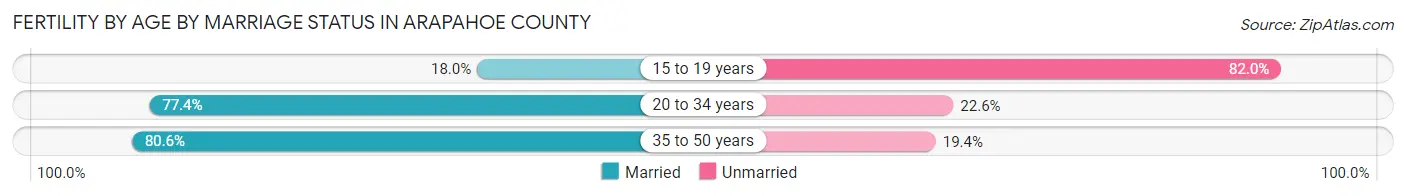
| Age Bracket | Married | Unmarried |
| 15 to 19 years | 31 (18.0%) | 141 (82.0%) |
| 20 to 34 years | 4,565 (77.4%) | 1,333 (22.6%) |
| 35 to 50 years | 2,122 (80.6%) | 511 (19.4%) |
| Total | 6,719 (77.2%) | 1,984 (22.8%) |
Fertility by Education in Arapahoe County
Average fertility rate in Arapahoe County is 54.0 births per 1,000 women. Women with the education attainment of graduate degree have the highest fertility rate of 63.0 births per 1,000 women, while women with the education attainment of less than high school have the lowest fertility at 41.0 births per 1,000 women. Women with the education attainment of college or associate's degree represent 28.1% of all women with births.
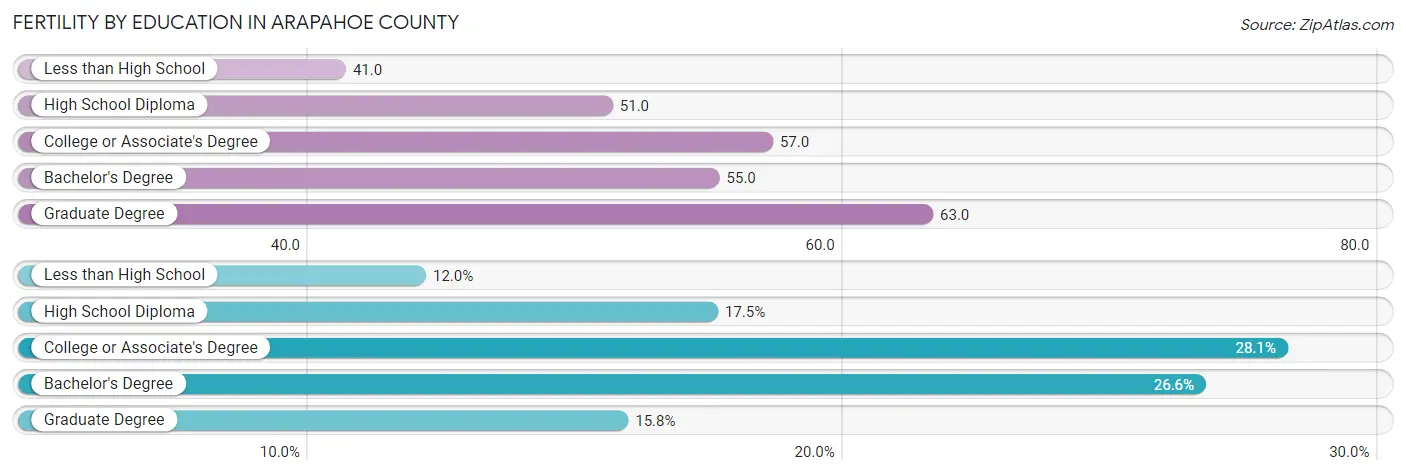
| Educational Attainment | Women with Births | Births / 1,000 Women |
| Less than High School | 1,044 (12.0%) | 41.0 |
| High School Diploma | 1,520 (17.5%) | 51.0 |
| College or Associate's Degree | 2,449 (28.1%) | 57.0 |
| Bachelor's Degree | 2,316 (26.6%) | 55.0 |
| Graduate Degree | 1,374 (15.8%) | 63.0 |
| Total | 8,703 (100.0%) | 54.0 |
Fertility by Education by Marriage Status in Arapahoe County
22.8% of women with births in Arapahoe County are unmarried. Women with the educational attainment of graduate degree are most likely to be married with 95.6% of them married at childbirth, while women with the educational attainment of less than high school are least likely to be married with 41.9% of them unmarried at childbirth.
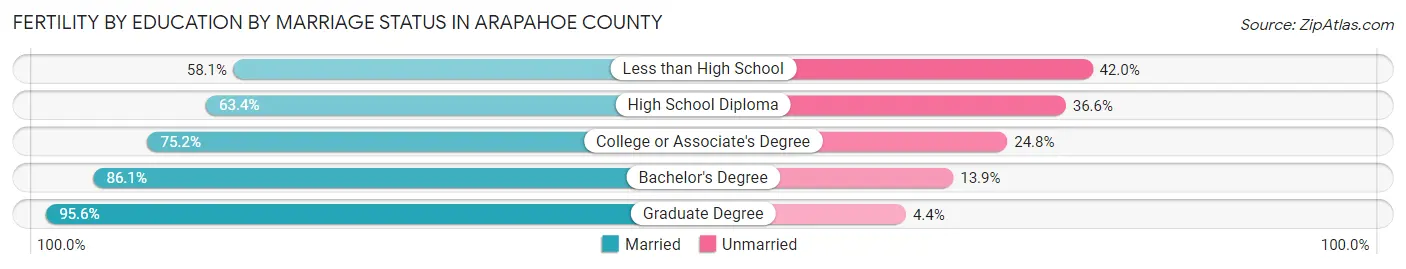
| Educational Attainment | Married | Unmarried |
| Less than High School | 606 (58.1%) | 438 (41.9%) |
| High School Diploma | 964 (63.4%) | 556 (36.6%) |
| College or Associate's Degree | 1,842 (75.2%) | 607 (24.8%) |
| Bachelor's Degree | 1,994 (86.1%) | 322 (13.9%) |
| Graduate Degree | 1,314 (95.6%) | 60 (4.4%) |
| Total | 6,719 (77.2%) | 1,984 (22.8%) |
Income in Arapahoe County
Income Overview in Arapahoe County
Per Capita Income in Arapahoe County is $49,530, while median incomes of families and households are $114,803 and $92,292 respectively.
| Characteristic | Number | Measure |
| Per Capita Income | 654,453 | $49,530 |
| Median Family Income | 161,581 | $114,803 |
| Mean Family Income | 161,581 | $149,945 |
| Median Household Income | 250,751 | $92,292 |
| Mean Household Income | 250,751 | $126,187 |
| Income Deficit | 161,581 | $12,012 |
| Wage / Income Gap (%) | 654,453 | 25.56% |
| Wage / Income Gap ($) | 654,453 | 74.44¢ per $1 |
| Gini / Inequality Index | 654,453 | 0.46 |
Earnings by Sex in Arapahoe County
Average Earnings in Arapahoe County are $48,261, $55,768 for men and $41,512 for women, a difference of 25.6%.

| Sex | Number | Average Earnings |
| Male | 206,549 (53.1%) | $55,768 |
| Female | 182,049 (46.9%) | $41,512 |
| Total | 388,598 (100.0%) | $48,261 |
Earnings by Sex by Income Bracket in Arapahoe County
The most common earnings brackets in Arapahoe County are $100,000+ for men (47,632 | 23.1%) and $100,000+ for women (22,998 | 12.6%).
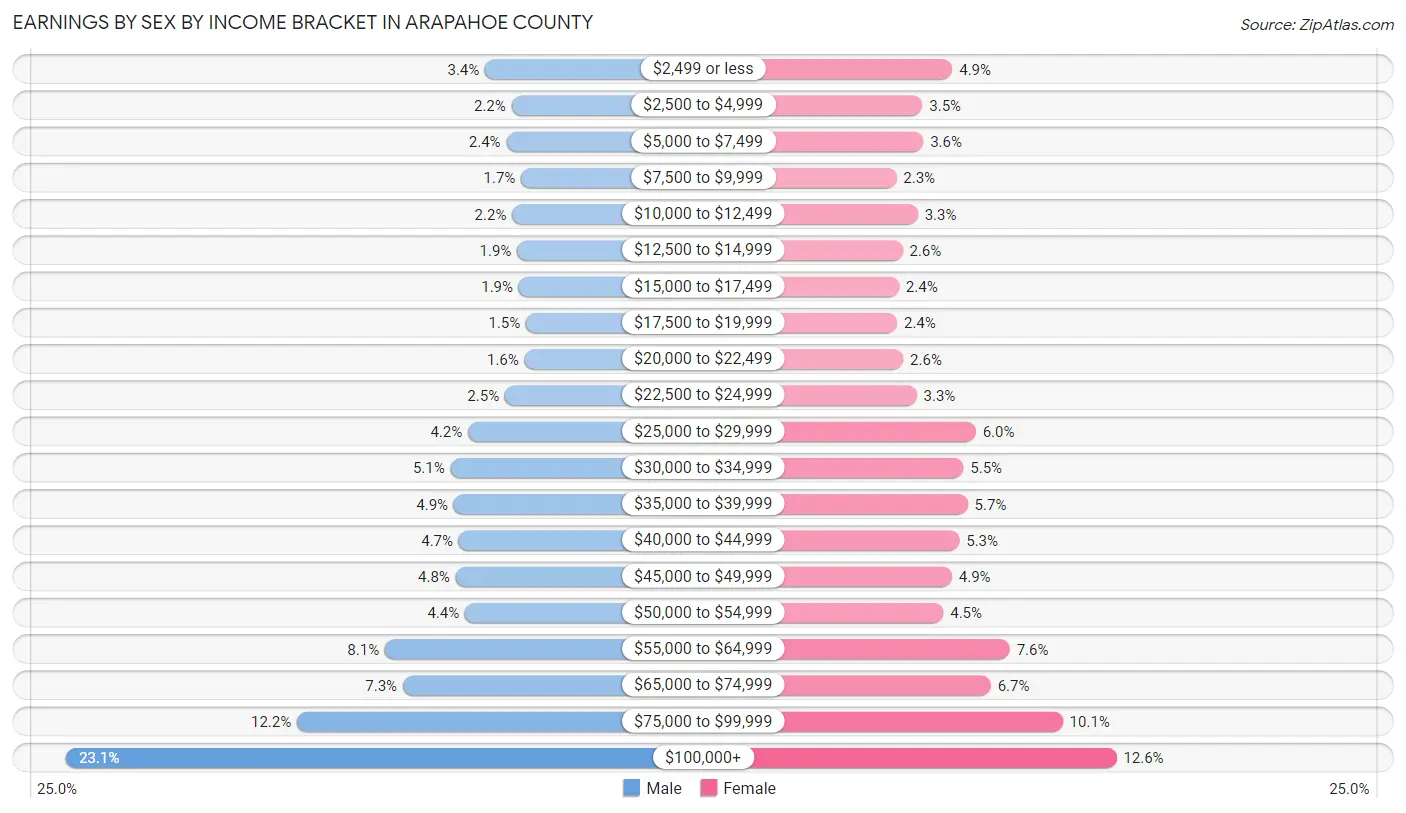
| Income | Male | Female |
| $2,499 or less | 7,078 (3.4%) | 8,987 (4.9%) |
| $2,500 to $4,999 | 4,514 (2.2%) | 6,445 (3.5%) |
| $5,000 to $7,499 | 5,023 (2.4%) | 6,510 (3.6%) |
| $7,500 to $9,999 | 3,593 (1.7%) | 4,231 (2.3%) |
| $10,000 to $12,499 | 4,461 (2.2%) | 6,047 (3.3%) |
| $12,500 to $14,999 | 3,986 (1.9%) | 4,751 (2.6%) |
| $15,000 to $17,499 | 3,811 (1.8%) | 4,449 (2.4%) |
| $17,500 to $19,999 | 3,113 (1.5%) | 4,275 (2.4%) |
| $20,000 to $22,499 | 3,259 (1.6%) | 4,805 (2.6%) |
| $22,500 to $24,999 | 5,166 (2.5%) | 5,949 (3.3%) |
| $25,000 to $29,999 | 8,731 (4.2%) | 10,994 (6.0%) |
| $30,000 to $34,999 | 10,434 (5.1%) | 9,948 (5.5%) |
| $35,000 to $39,999 | 10,090 (4.9%) | 10,312 (5.7%) |
| $40,000 to $44,999 | 9,623 (4.7%) | 9,598 (5.3%) |
| $45,000 to $49,999 | 9,943 (4.8%) | 8,948 (4.9%) |
| $50,000 to $54,999 | 9,020 (4.4%) | 8,233 (4.5%) |
| $55,000 to $64,999 | 16,762 (8.1%) | 13,892 (7.6%) |
| $65,000 to $74,999 | 15,027 (7.3%) | 12,277 (6.7%) |
| $75,000 to $99,999 | 25,283 (12.2%) | 18,400 (10.1%) |
| $100,000+ | 47,632 (23.1%) | 22,998 (12.6%) |
| Total | 206,549 (100.0%) | 182,049 (100.0%) |
Earnings by Sex by Educational Attainment in Arapahoe County
Average earnings in Arapahoe County are $62,904 for men and $47,118 for women, a difference of 25.1%. Men with an educational attainment of graduate degree enjoy the highest average annual earnings of $103,015, while those with less than high school education earn the least with $41,759. Women with an educational attainment of graduate degree earn the most with the average annual earnings of $75,161, while those with less than high school education have the smallest earnings of $26,236.
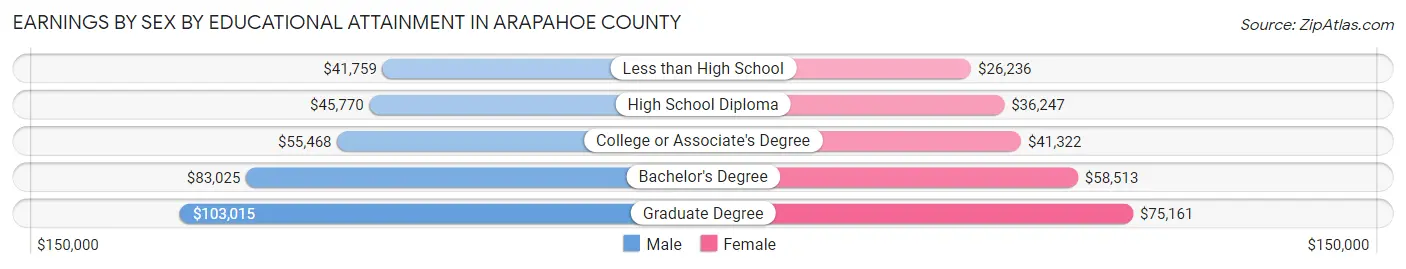
| Educational Attainment | Male Income | Female Income |
| Less than High School | $41,759 | $26,236 |
| High School Diploma | $45,770 | $36,247 |
| College or Associate's Degree | $55,468 | $41,322 |
| Bachelor's Degree | $83,025 | $58,513 |
| Graduate Degree | $103,015 | $75,161 |
| Total | $62,904 | $47,118 |
Family Income in Arapahoe County
Family Income Brackets in Arapahoe County
According to the Arapahoe County family income data, there are 36,679 families falling into the $100,000 to $149,999 income range, which is the most common income bracket and makes up 22.7% of all families. Conversely, the $10,000 to $14,999 income bracket is the least frequent group with only 1,777 families (1.1%) belonging to this category.
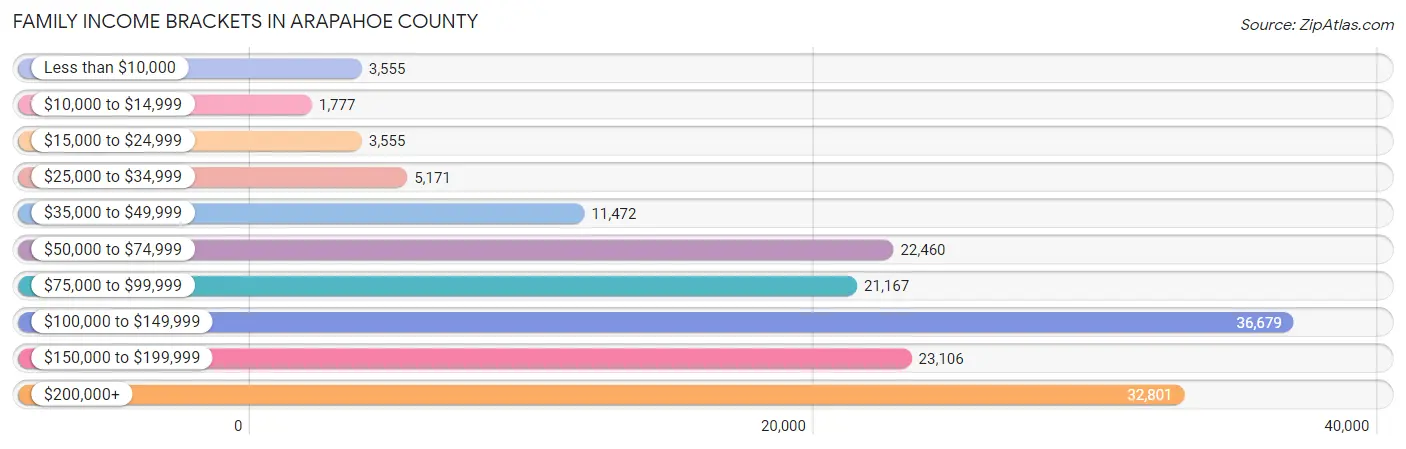
| Income Bracket | # Families | % Families |
| Less than $10,000 | 3,555 | 2.2% |
| $10,000 to $14,999 | 1,777 | 1.1% |
| $15,000 to $24,999 | 3,555 | 2.2% |
| $25,000 to $34,999 | 5,171 | 3.2% |
| $35,000 to $49,999 | 11,472 | 7.1% |
| $50,000 to $74,999 | 22,460 | 13.9% |
| $75,000 to $99,999 | 21,167 | 13.1% |
| $100,000 to $149,999 | 36,679 | 22.7% |
| $150,000 to $199,999 | 23,106 | 14.3% |
| $200,000+ | 32,801 | 20.3% |
Family Income by Famaliy Size in Arapahoe County
4-person families (31,692 | 19.6%) account for the highest median family income in Arapahoe County with $133,808 per family, while 2-person families (71,653 | 44.3%) have the highest median income of $51,978 per family member.

| Income Bracket | # Families | Median Income |
| 2-Person Families | 71,653 (44.3%) | $103,955 |
| 3-Person Families | 36,646 (22.7%) | $114,777 |
| 4-Person Families | 31,692 (19.6%) | $133,808 |
| 5-Person Families | 13,732 (8.5%) | $125,810 |
| 6-Person Families | 5,067 (3.1%) | $118,603 |
| 7+ Person Families | 2,791 (1.7%) | $122,684 |
| Total | 161,581 (100.0%) | $114,803 |
Family Income by Number of Earners in Arapahoe County
The median family income in Arapahoe County is $114,803, with families comprising 3+ earners (22,760) having the highest median family income of $154,877, while families with no earners (15,577) have the lowest median family income of $70,239, accounting for 14.1% and 9.6% of families, respectively.
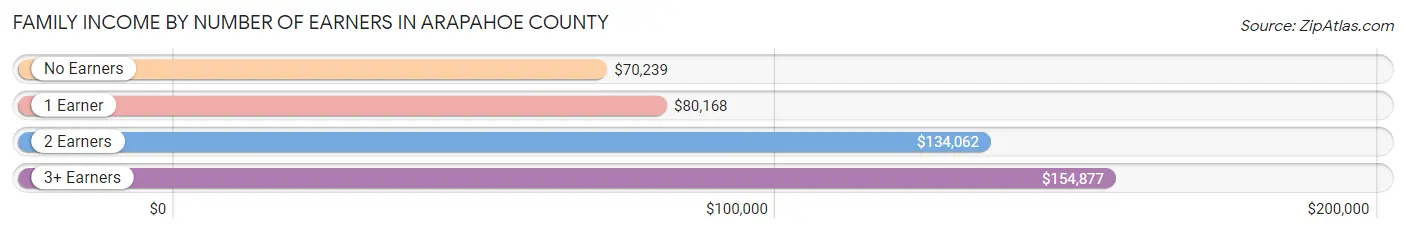
| Number of Earners | # Families | Median Income |
| No Earners | 15,577 (9.6%) | $70,239 |
| 1 Earner | 47,548 (29.4%) | $80,168 |
| 2 Earners | 75,696 (46.9%) | $134,062 |
| 3+ Earners | 22,760 (14.1%) | $154,877 |
| Total | 161,581 (100.0%) | $114,803 |
Household Income in Arapahoe County
Household Income Brackets in Arapahoe County
With 49,899 households falling in the category, the $100,000 to $149,999 income range is the most frequent in Arapahoe County, accounting for 19.9% of all households. In contrast, only 6,018 households (2.4%) fall into the $10,000 to $14,999 income bracket, making it the least populous group.
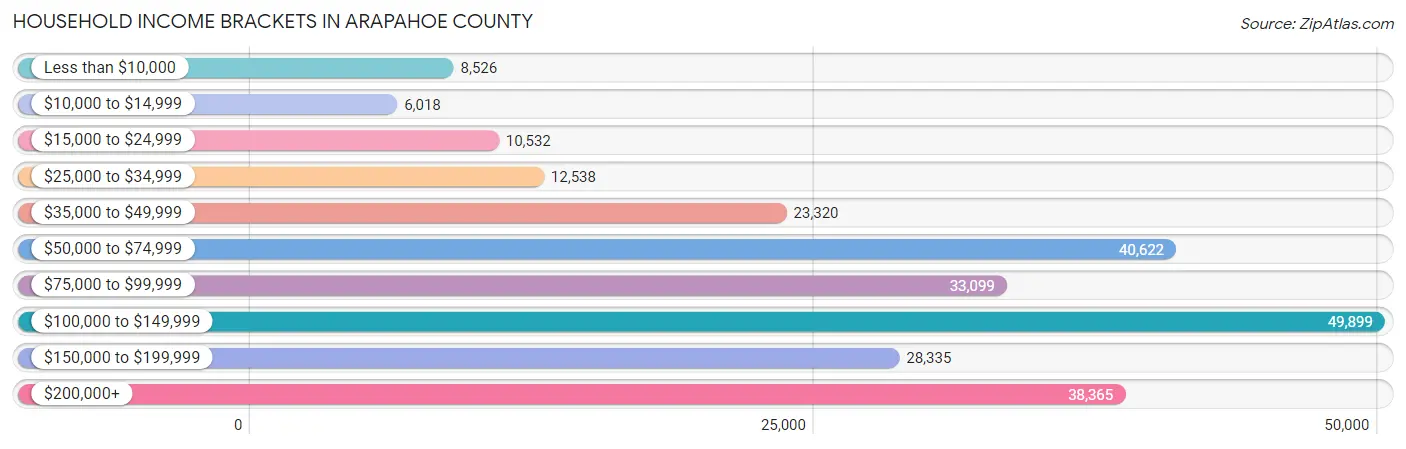
| Income Bracket | # Households | % Households |
| Less than $10,000 | 8,526 | 3.4% |
| $10,000 to $14,999 | 6,018 | 2.4% |
| $15,000 to $24,999 | 10,532 | 4.2% |
| $25,000 to $34,999 | 12,538 | 5.0% |
| $35,000 to $49,999 | 23,320 | 9.3% |
| $50,000 to $74,999 | 40,622 | 16.2% |
| $75,000 to $99,999 | 33,099 | 13.2% |
| $100,000 to $149,999 | 49,899 | 19.9% |
| $150,000 to $199,999 | 28,335 | 11.3% |
| $200,000+ | 38,365 | 15.3% |
Household Income by Householder Age in Arapahoe County
The median household income in Arapahoe County is $92,292, with the highest median household income of $108,880 found in the 45 to 64 years age bracket for the primary householder. A total of 92,631 households (36.9%) fall into this category. Meanwhile, the 15 to 24 years age bracket for the primary householder has the lowest median household income of $57,744, with 9,343 households (3.7%) in this group.
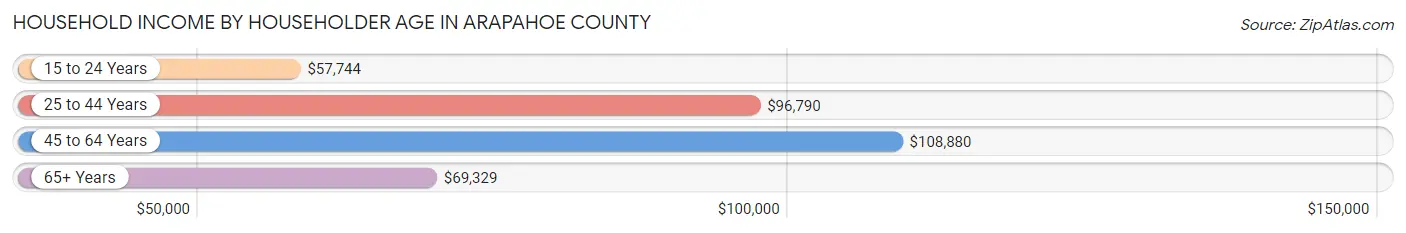
| Income Bracket | # Households | Median Income |
| 15 to 24 Years | 9,343 (3.7%) | $57,744 |
| 25 to 44 Years | 94,824 (37.8%) | $96,790 |
| 45 to 64 Years | 92,631 (36.9%) | $108,880 |
| 65+ Years | 53,953 (21.5%) | $69,329 |
| Total | 250,751 (100.0%) | $92,292 |
Poverty in Arapahoe County
Income Below Poverty by Sex and Age in Arapahoe County
With 7.5% poverty level for males and 8.5% for females among the residents of Arapahoe County, 5 year old males and 6 to 11 year old females are the most vulnerable to poverty, with 568 males (14.7%) and 2,719 females (11.3%) in their respective age groups living below the poverty level.
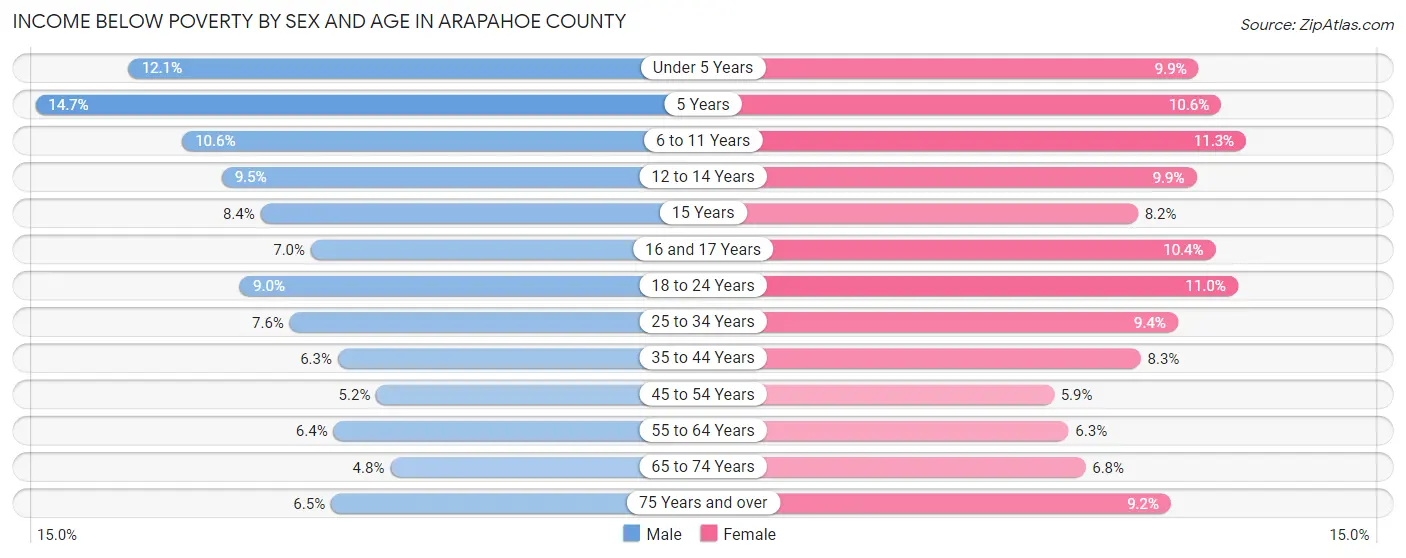
| Age Bracket | Male | Female |
| Under 5 Years | 2,309 (12.1%) | 1,847 (9.9%) |
| 5 Years | 568 (14.7%) | 439 (10.6%) |
| 6 to 11 Years | 2,675 (10.6%) | 2,719 (11.3%) |
| 12 to 14 Years | 1,334 (9.5%) | 1,231 (9.9%) |
| 15 Years | 332 (8.4%) | 349 (8.2%) |
| 16 and 17 Years | 658 (7.0%) | 906 (10.4%) |
| 18 to 24 Years | 2,484 (9.0%) | 2,915 (11.0%) |
| 25 to 34 Years | 3,992 (7.6%) | 4,594 (9.3%) |
| 35 to 44 Years | 3,081 (6.3%) | 3,908 (8.3%) |
| 45 to 54 Years | 2,200 (5.2%) | 2,447 (5.9%) |
| 55 to 64 Years | 2,416 (6.4%) | 2,496 (6.3%) |
| 65 to 74 Years | 1,255 (4.8%) | 2,008 (6.8%) |
| 75 Years and over | 849 (6.5%) | 1,754 (9.2%) |
| Total | 24,153 (7.5%) | 27,613 (8.5%) |
Income Above Poverty by Sex and Age in Arapahoe County
According to the poverty statistics in Arapahoe County, males aged 65 to 74 years and females aged 45 to 54 years are the age groups that are most secure financially, with 95.2% of males and 94.1% of females in these age groups living above the poverty line.
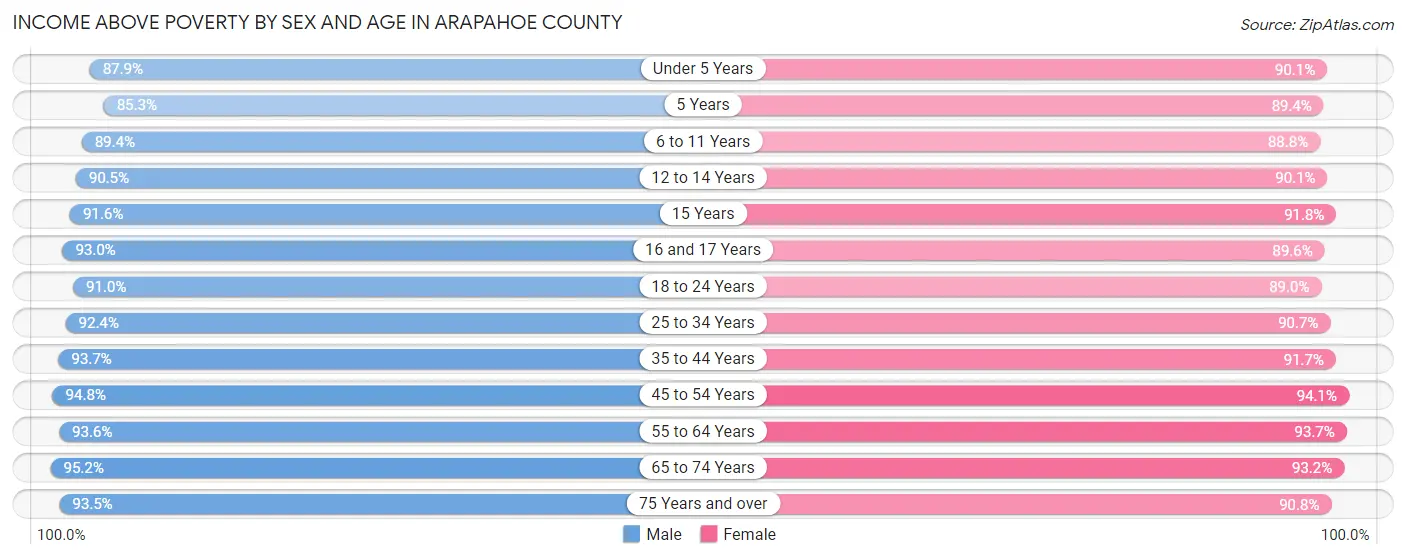
| Age Bracket | Male | Female |
| Under 5 Years | 16,766 (87.9%) | 16,754 (90.1%) |
| 5 Years | 3,296 (85.3%) | 3,719 (89.4%) |
| 6 to 11 Years | 22,534 (89.4%) | 21,440 (88.7%) |
| 12 to 14 Years | 12,698 (90.5%) | 11,244 (90.1%) |
| 15 Years | 3,604 (91.6%) | 3,884 (91.8%) |
| 16 and 17 Years | 8,705 (93.0%) | 7,802 (89.6%) |
| 18 to 24 Years | 25,114 (91.0%) | 23,542 (89.0%) |
| 25 to 34 Years | 48,379 (92.4%) | 44,549 (90.6%) |
| 35 to 44 Years | 46,016 (93.7%) | 43,053 (91.7%) |
| 45 to 54 Years | 39,993 (94.8%) | 39,060 (94.1%) |
| 55 to 64 Years | 35,343 (93.6%) | 37,064 (93.7%) |
| 65 to 74 Years | 24,789 (95.2%) | 27,611 (93.2%) |
| 75 Years and over | 12,281 (93.5%) | 17,396 (90.8%) |
| Total | 299,518 (92.5%) | 297,118 (91.5%) |
Income Below Poverty Among Married-Couple Families in Arapahoe County
The poverty statistics for married-couple families in Arapahoe County show that 3.0% or 3,657 of the total 122,352 families live below the poverty line. Families with 5 or more children have the highest poverty rate of 10.4%, comprising of 85 families. On the other hand, families with no children have the lowest poverty rate of 2.1%, which includes 1,431 families.
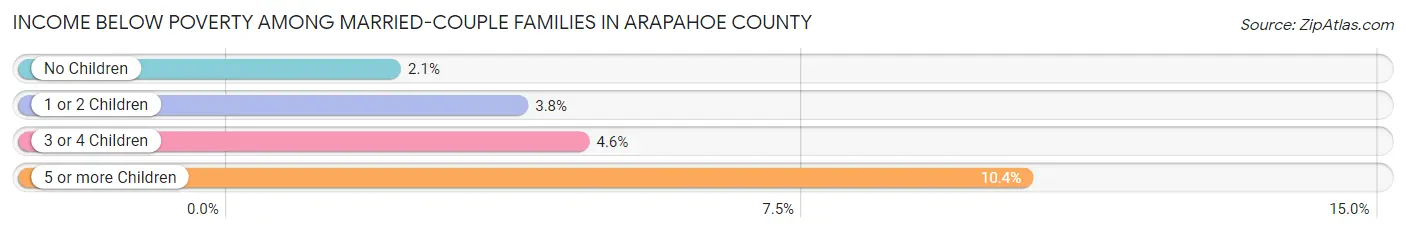
| Children | Above Poverty | Below Poverty |
| No Children | 65,822 (97.9%) | 1,431 (2.1%) |
| 1 or 2 Children | 42,174 (96.2%) | 1,662 (3.8%) |
| 3 or 4 Children | 9,965 (95.4%) | 479 (4.6%) |
| 5 or more Children | 734 (89.6%) | 85 (10.4%) |
| Total | 118,695 (97.0%) | 3,657 (3.0%) |
Income Below Poverty Among Single-Parent Households in Arapahoe County
According to the poverty data in Arapahoe County, 7.9% or 974 single-father households and 15.1% or 4,079 single-mother households are living below the poverty line. Among single-father households, those with 3 or 4 children have the highest poverty rate, with 272 households (26.4%) experiencing poverty. Likewise, among single-mother households, those with 3 or 4 children have the highest poverty rate, with 1,110 households (46.9%) falling below the poverty line.

| Children | Single Father | Single Mother |
| No Children | 109 (2.1%) | 485 (4.5%) |
| 1 or 2 Children | 593 (9.7%) | 2,430 (17.6%) |
| 3 or 4 Children | 272 (26.4%) | 1,110 (46.9%) |
| 5 or more Children | 0 (0.0%) | 54 (36.5%) |
| Total | 974 (7.9%) | 4,079 (15.1%) |
Income Below Poverty Among Married-Couple vs Single-Parent Households in Arapahoe County
The poverty data for Arapahoe County shows that 3,657 of the married-couple family households (3.0%) and 5,053 of the single-parent households (12.9%) are living below the poverty level. Within the married-couple family households, those with 5 or more children have the highest poverty rate, with 85 households (10.4%) falling below the poverty line. Among the single-parent households, those with 3 or 4 children have the highest poverty rate, with 1,382 household (40.7%) living below poverty.
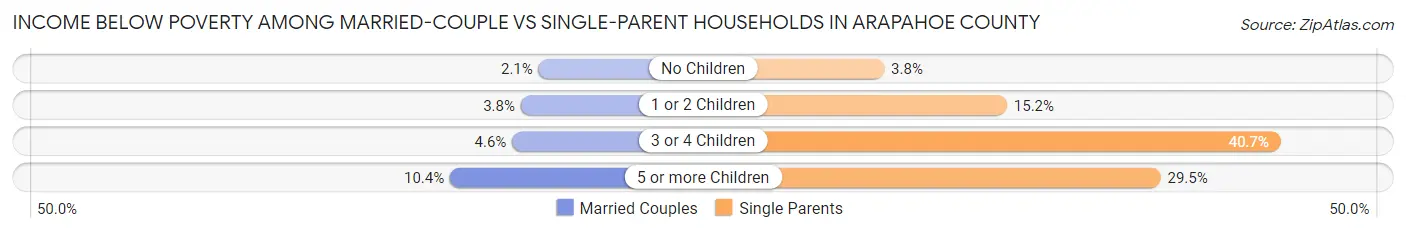
| Children | Married-Couple Families | Single-Parent Households |
| No Children | 1,431 (2.1%) | 594 (3.8%) |
| 1 or 2 Children | 1,662 (3.8%) | 3,023 (15.2%) |
| 3 or 4 Children | 479 (4.6%) | 1,382 (40.7%) |
| 5 or more Children | 85 (10.4%) | 54 (29.5%) |
| Total | 3,657 (3.0%) | 5,053 (12.9%) |
Employment Characteristics in Arapahoe County
Employment by Class of Employer in Arapahoe County
Among the 349,283 employed individuals in Arapahoe County, private company employees (241,556 | 69.2%), not-for-profit organizations (26,694 | 7.6%), and local government employees (21,463 | 6.1%) make up the most common classes of employment.
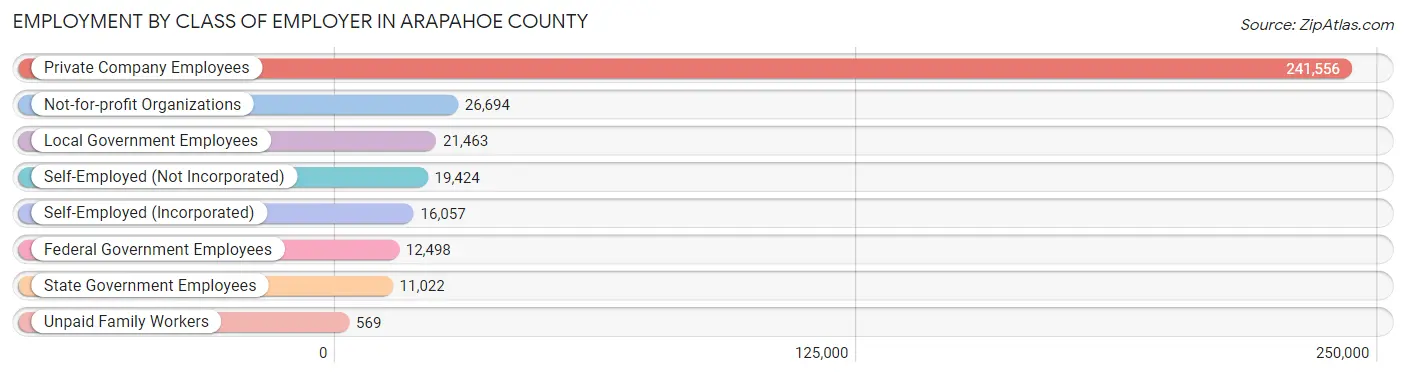
| Employer Class | # Employees | % Employees |
| Private Company Employees | 241,556 | 69.2% |
| Self-Employed (Incorporated) | 16,057 | 4.6% |
| Self-Employed (Not Incorporated) | 19,424 | 5.6% |
| Not-for-profit Organizations | 26,694 | 7.6% |
| Local Government Employees | 21,463 | 6.1% |
| State Government Employees | 11,022 | 3.2% |
| Federal Government Employees | 12,498 | 3.6% |
| Unpaid Family Workers | 569 | 0.2% |
| Total | 349,283 | 100.0% |
Employment Status by Age in Arapahoe County
According to the labor force statistics for Arapahoe County, out of the total population over 16 years of age (522,983), 71.4% or 373,410 individuals are in the labor force, with 4.6% or 17,177 of them unemployed. The age group with the highest labor force participation rate is 25 to 29 years, with 88.5% or 44,309 individuals in the labor force. Within the labor force, the 16 to 19 years age range has the highest percentage of unemployed individuals, with 15.7% or 2,431 of them being unemployed.
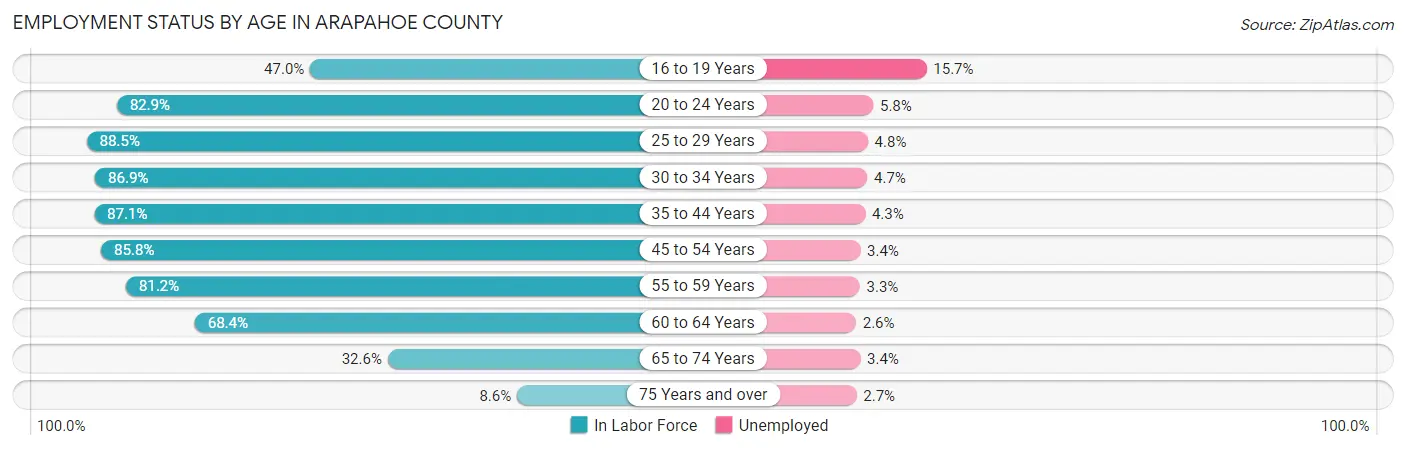
| Age Bracket | In Labor Force | Unemployed |
| 16 to 19 Years | 15,483 (47.0%) | 2,431 (15.7%) |
| 20 to 24 Years | 33,127 (82.9%) | 1,921 (5.8%) |
| 25 to 29 Years | 44,309 (88.5%) | 2,127 (4.8%) |
| 30 to 34 Years | 45,110 (86.9%) | 2,120 (4.7%) |
| 35 to 44 Years | 84,008 (87.1%) | 3,612 (4.3%) |
| 45 to 54 Years | 72,033 (85.8%) | 2,449 (3.4%) |
| 55 to 59 Years | 31,684 (81.2%) | 1,046 (3.3%) |
| 60 to 64 Years | 26,483 (68.4%) | 689 (2.6%) |
| 65 to 74 Years | 18,308 (32.6%) | 622 (3.4%) |
| 75 Years and over | 2,907 (8.6%) | 78 (2.7%) |
| Total | 373,410 (71.4%) | 17,177 (4.6%) |
Employment Status by Educational Attainment in Arapahoe County
According to labor force statistics for Arapahoe County, 84.3% of individuals (303,580) out of the total population between 25 and 64 years of age (360,119) are in the labor force, with 4.0% or 12,143 of them being unemployed. The group with the highest labor force participation rate are those with the educational attainment of bachelor's degree or higher, with 88.6% or 143,369 individuals in the labor force. Within the labor force, individuals with high school diploma education have the highest percentage of unemployment, with 5.4% or 2,937 of them being unemployed.
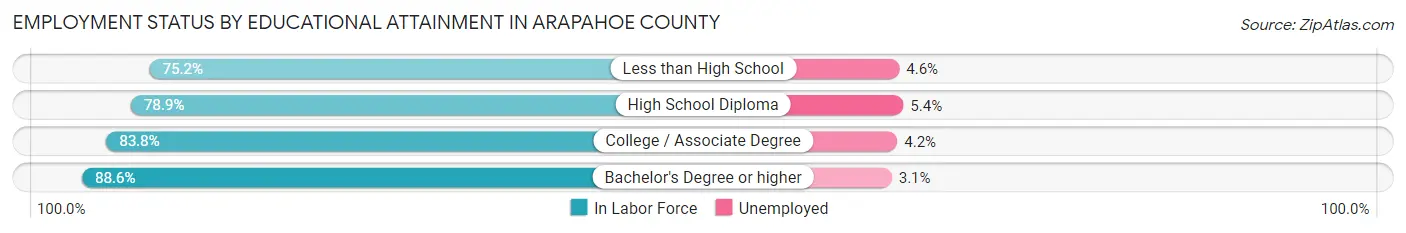
| Educational Attainment | In Labor Force | Unemployed |
| Less than High School | 21,806 (75.2%) | 1,334 (4.6%) |
| High School Diploma | 54,390 (78.9%) | 3,722 (5.4%) |
| College / Associate Degree | 84,110 (83.8%) | 4,216 (4.2%) |
| Bachelor's Degree or higher | 143,369 (88.6%) | 5,016 (3.1%) |
| Total | 303,580 (84.3%) | 14,405 (4.0%) |
Employment Occupations by Sex in Arapahoe County
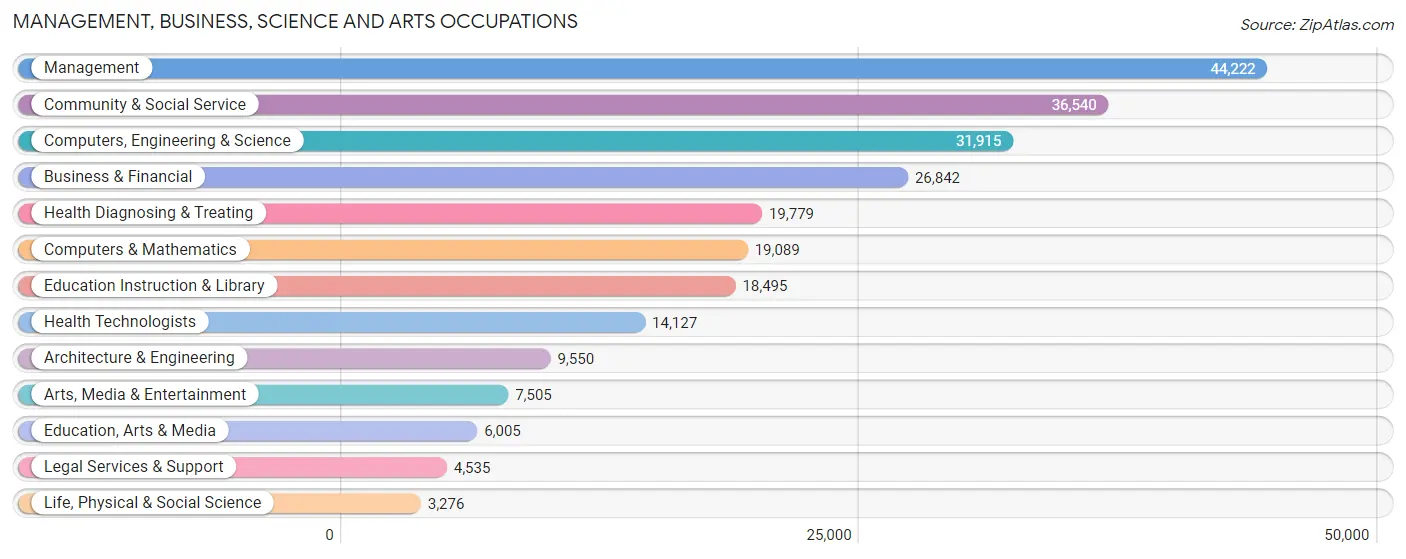
Management, Business, Science and Arts Occupations
The most common Management, Business, Science and Arts occupations in Arapahoe County are Management (44,222 | 12.5%), Community & Social Service (36,540 | 10.3%), Computers, Engineering & Science (31,915 | 9.0%), Business & Financial (26,842 | 7.6%), and Health Diagnosing & Treating (19,779 | 5.6%).
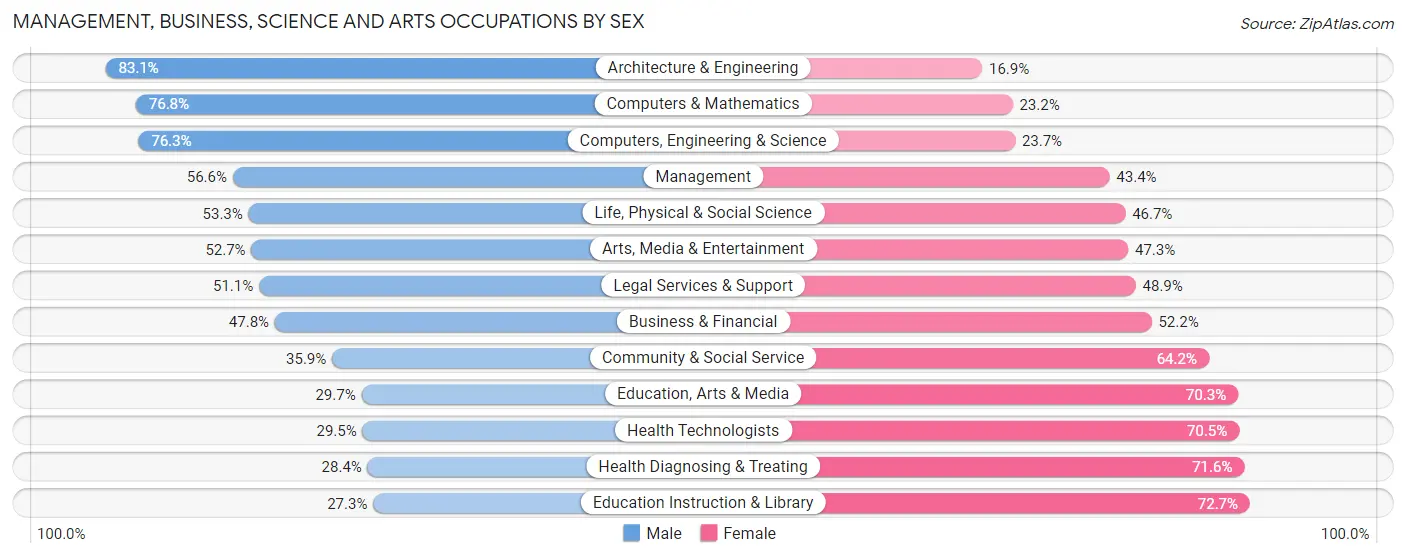
Management, Business, Science and Arts Occupations by Sex
Within the Management, Business, Science and Arts occupations in Arapahoe County, the most male-oriented occupations are Architecture & Engineering (83.1%), Computers & Mathematics (76.8%), and Computers, Engineering & Science (76.3%), while the most female-oriented occupations are Education Instruction & Library (72.7%), Health Diagnosing & Treating (71.6%), and Health Technologists (70.5%).
| Occupation | Male | Female |
| Management | 25,013 (56.6%) | 19,209 (43.4%) |
| Business & Financial | 12,824 (47.8%) | 14,018 (52.2%) |
| Computers, Engineering & Science | 24,340 (76.3%) | 7,575 (23.7%) |
| Computers & Mathematics | 14,656 (76.8%) | 4,433 (23.2%) |
| Architecture & Engineering | 7,939 (83.1%) | 1,611 (16.9%) |
| Life, Physical & Social Science | 1,745 (53.3%) | 1,531 (46.7%) |
| Community & Social Service | 13,099 (35.8%) | 23,441 (64.1%) |
| Education, Arts & Media | 1,785 (29.7%) | 4,220 (70.3%) |
| Legal Services & Support | 2,317 (51.1%) | 2,218 (48.9%) |
| Education Instruction & Library | 5,043 (27.3%) | 13,452 (72.7%) |
| Arts, Media & Entertainment | 3,954 (52.7%) | 3,551 (47.3%) |
| Health Diagnosing & Treating | 5,626 (28.4%) | 14,153 (71.6%) |
| Health Technologists | 4,169 (29.5%) | 9,958 (70.5%) |
| Total (Category) | 80,902 (50.8%) | 78,396 (49.2%) |
| Total (Overall) | 189,109 (53.4%) | 165,308 (46.6%) |
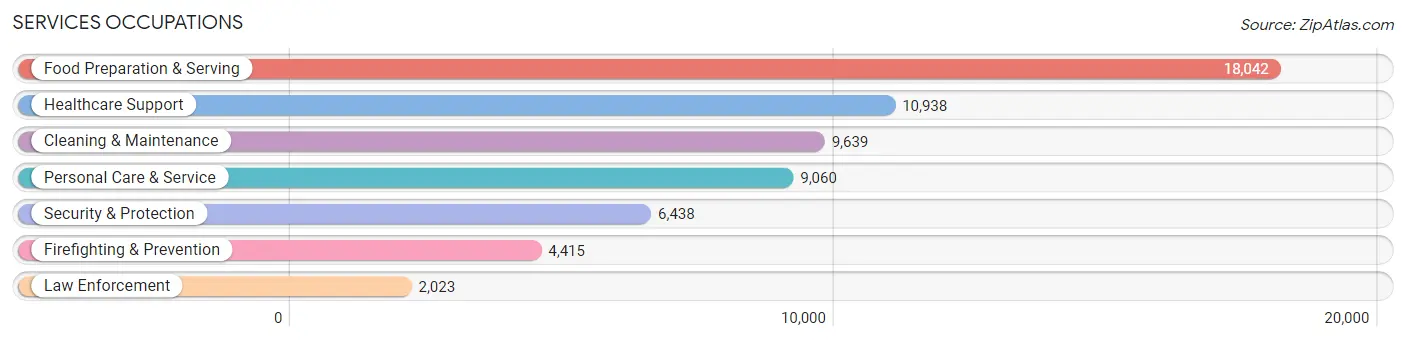
Services Occupations
The most common Services occupations in Arapahoe County are Food Preparation & Serving (18,042 | 5.1%), Healthcare Support (10,938 | 3.1%), Cleaning & Maintenance (9,639 | 2.7%), Personal Care & Service (9,060 | 2.6%), and Security & Protection (6,438 | 1.8%).
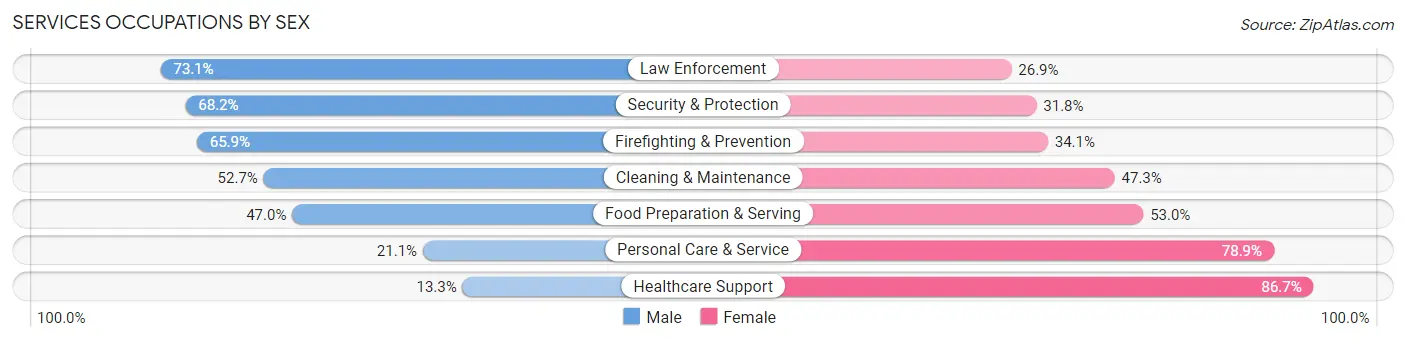
Services Occupations by Sex
Within the Services occupations in Arapahoe County, the most male-oriented occupations are Law Enforcement (73.1%), Security & Protection (68.2%), and Firefighting & Prevention (65.9%), while the most female-oriented occupations are Healthcare Support (86.7%), Personal Care & Service (78.9%), and Food Preparation & Serving (53.0%).
| Occupation | Male | Female |
| Healthcare Support | 1,452 (13.3%) | 9,486 (86.7%) |
| Security & Protection | 4,388 (68.2%) | 2,050 (31.8%) |
| Firefighting & Prevention | 2,909 (65.9%) | 1,506 (34.1%) |
| Law Enforcement | 1,479 (73.1%) | 544 (26.9%) |
| Food Preparation & Serving | 8,480 (47.0%) | 9,562 (53.0%) |
| Cleaning & Maintenance | 5,076 (52.7%) | 4,563 (47.3%) |
| Personal Care & Service | 1,914 (21.1%) | 7,146 (78.9%) |
| Total (Category) | 21,310 (39.4%) | 32,807 (60.6%) |
| Total (Overall) | 189,109 (53.4%) | 165,308 (46.6%) |
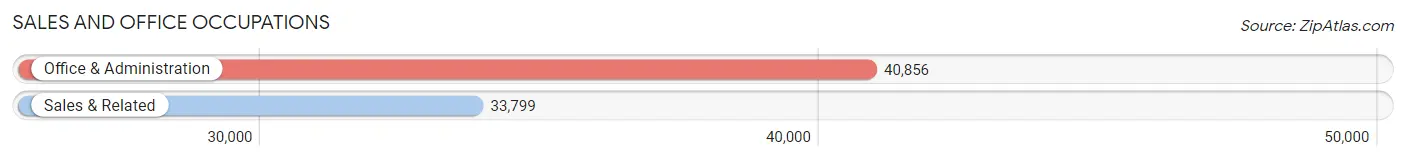
Sales and Office Occupations
The most common Sales and Office occupations in Arapahoe County are Office & Administration (40,856 | 11.5%), and Sales & Related (33,799 | 9.5%).
Sales and Office Occupations by Sex
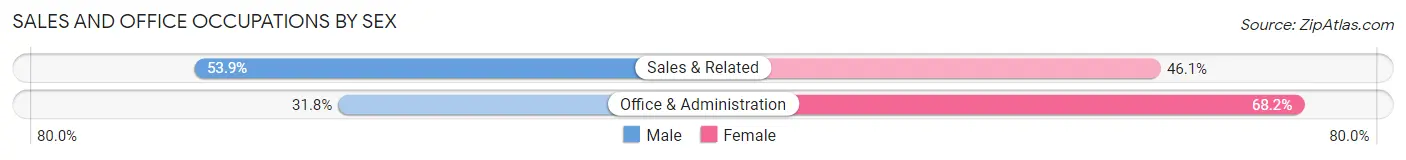
| Occupation | Male | Female |
| Sales & Related | 18,231 (53.9%) | 15,568 (46.1%) |
| Office & Administration | 12,979 (31.8%) | 27,877 (68.2%) |
| Total (Category) | 31,210 (41.8%) | 43,445 (58.2%) |
| Total (Overall) | 189,109 (53.4%) | 165,308 (46.6%) |
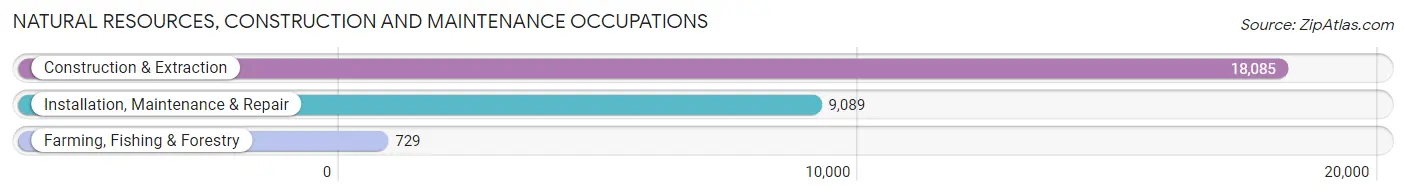
Natural Resources, Construction and Maintenance Occupations
The most common Natural Resources, Construction and Maintenance occupations in Arapahoe County are Construction & Extraction (18,085 | 5.1%), Installation, Maintenance & Repair (9,089 | 2.6%), and Farming, Fishing & Forestry (729 | 0.2%).
Natural Resources, Construction and Maintenance Occupations by Sex

| Occupation | Male | Female |
| Farming, Fishing & Forestry | 503 (69.0%) | 226 (31.0%) |
| Construction & Extraction | 17,125 (94.7%) | 960 (5.3%) |
| Installation, Maintenance & Repair | 8,552 (94.1%) | 537 (5.9%) |
| Total (Category) | 26,180 (93.8%) | 1,723 (6.2%) |
| Total (Overall) | 189,109 (53.4%) | 165,308 (46.6%) |
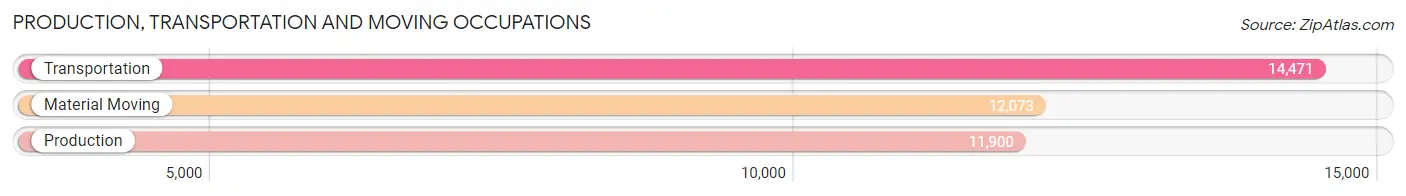
Production, Transportation and Moving Occupations
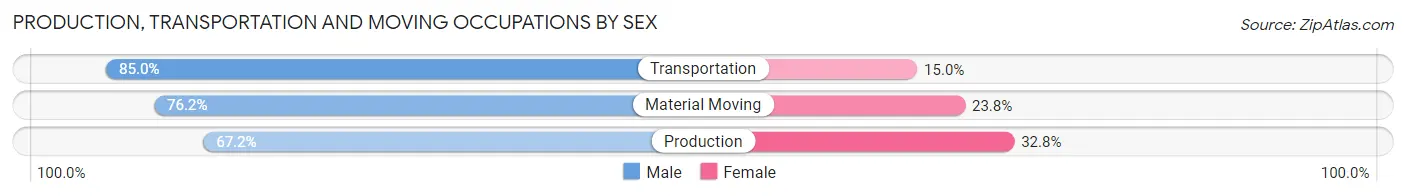
The most common Production, Transportation and Moving occupations in Arapahoe County are Transportation (14,471 | 4.1%), Material Moving (12,073 | 3.4%), and Production (11,900 | 3.4%).
Production, Transportation and Moving Occupations by Sex
| Occupation | Male | Female |
| Production | 7,998 (67.2%) | 3,902 (32.8%) |
| Transportation | 12,304 (85.0%) | 2,167 (15.0%) |
| Material Moving | 9,205 (76.2%) | 2,868 (23.8%) |
| Total (Category) | 29,507 (76.7%) | 8,937 (23.3%) |
| Total (Overall) | 189,109 (53.4%) | 165,308 (46.6%) |
Employment Industries by Sex in Arapahoe County
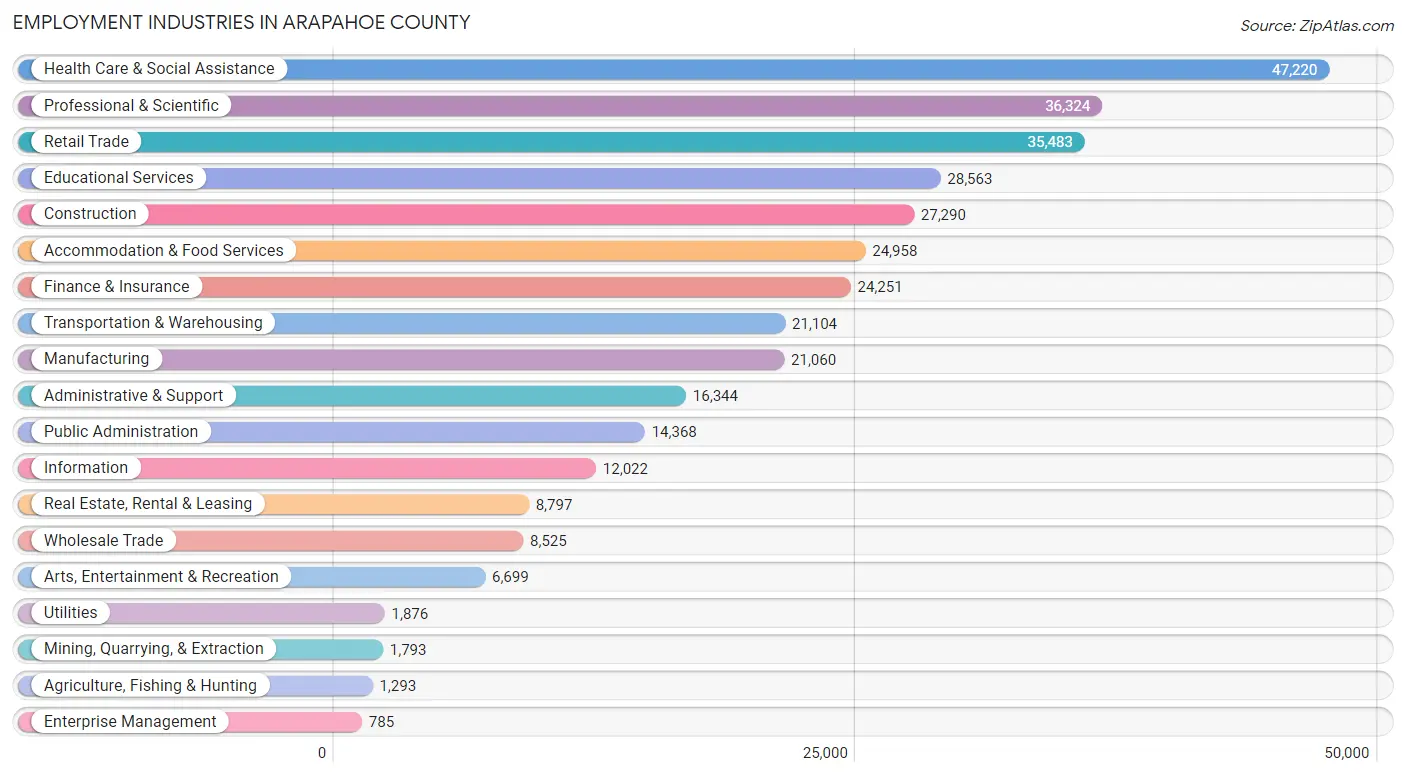
Employment Industries in Arapahoe County
The major employment industries in Arapahoe County include Health Care & Social Assistance (47,220 | 13.3%), Professional & Scientific (36,324 | 10.2%), Retail Trade (35,483 | 10.0%), Educational Services (28,563 | 8.1%), and Construction (27,290 | 7.7%).
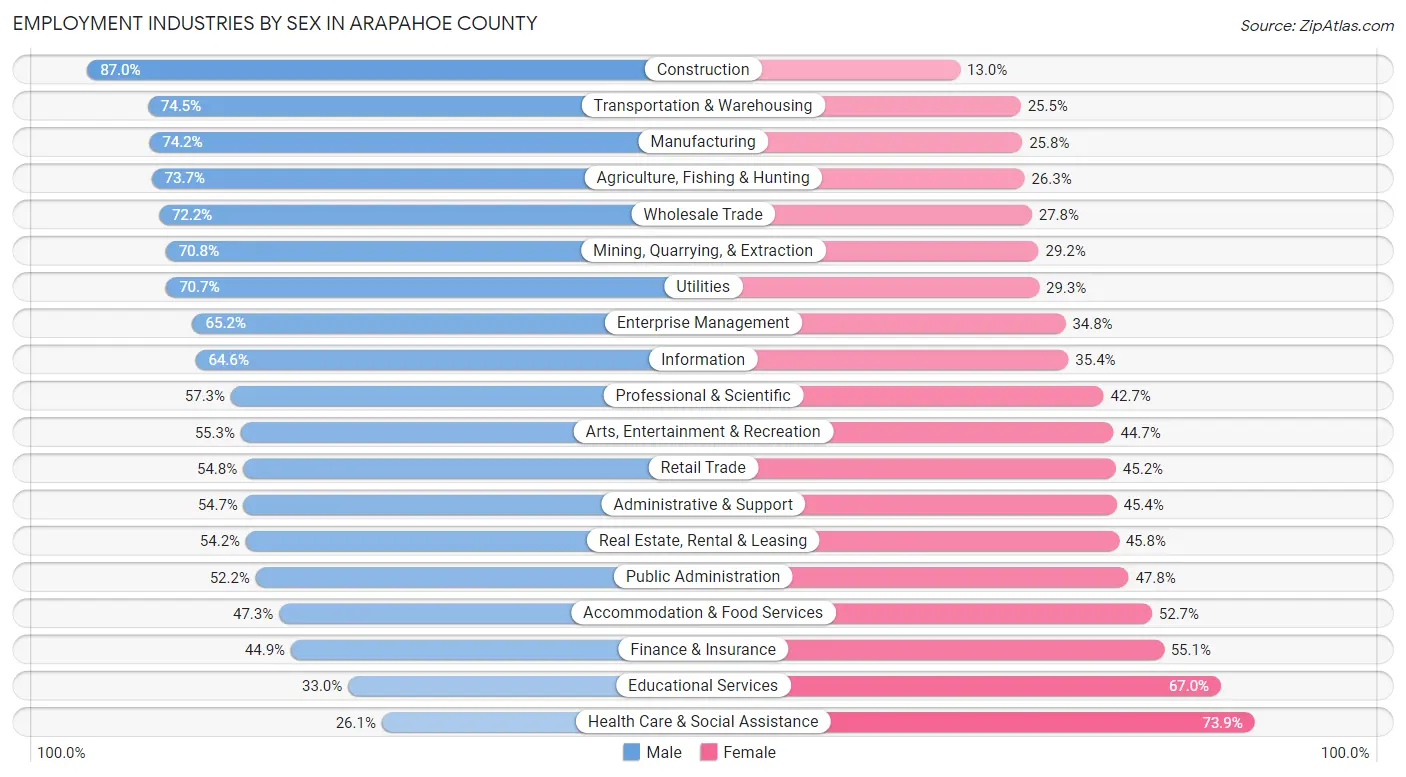
Employment Industries by Sex in Arapahoe County
The Arapahoe County industries that see more men than women are Construction (87.0%), Transportation & Warehousing (74.5%), and Manufacturing (74.2%), whereas the industries that tend to have a higher number of women are Health Care & Social Assistance (73.9%), Educational Services (67.0%), and Finance & Insurance (55.1%).
| Industry | Male | Female |
| Agriculture, Fishing & Hunting | 953 (73.7%) | 340 (26.3%) |
| Mining, Quarrying, & Extraction | 1,269 (70.8%) | 524 (29.2%) |
| Construction | 23,751 (87.0%) | 3,539 (13.0%) |
| Manufacturing | 15,621 (74.2%) | 5,439 (25.8%) |
| Wholesale Trade | 6,154 (72.2%) | 2,371 (27.8%) |
| Retail Trade | 19,439 (54.8%) | 16,044 (45.2%) |
| Transportation & Warehousing | 15,718 (74.5%) | 5,386 (25.5%) |
| Utilities | 1,326 (70.7%) | 550 (29.3%) |
| Information | 7,768 (64.6%) | 4,254 (35.4%) |
| Finance & Insurance | 10,883 (44.9%) | 13,368 (55.1%) |
| Real Estate, Rental & Leasing | 4,767 (54.2%) | 4,030 (45.8%) |
| Professional & Scientific | 20,819 (57.3%) | 15,505 (42.7%) |
| Enterprise Management | 512 (65.2%) | 273 (34.8%) |
| Administrative & Support | 8,932 (54.6%) | 7,412 (45.4%) |
| Educational Services | 9,438 (33.0%) | 19,125 (67.0%) |
| Health Care & Social Assistance | 12,313 (26.1%) | 34,907 (73.9%) |
| Arts, Entertainment & Recreation | 3,702 (55.3%) | 2,997 (44.7%) |
| Accommodation & Food Services | 11,812 (47.3%) | 13,146 (52.7%) |
| Public Administration | 7,496 (52.2%) | 6,872 (47.8%) |
| Total | 189,109 (53.4%) | 165,308 (46.6%) |
Education in Arapahoe County
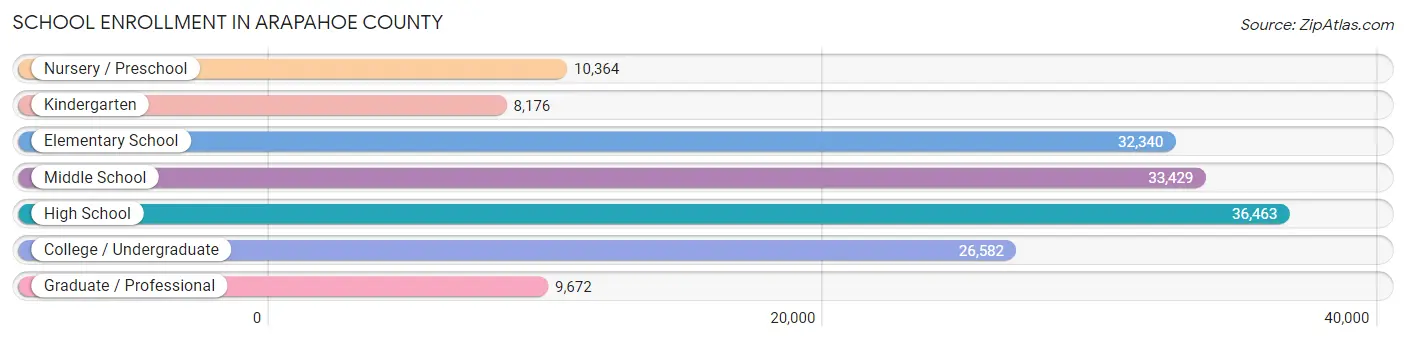
School Enrollment in Arapahoe County
The most common levels of schooling among the 157,026 students in Arapahoe County are high school (36,463 | 23.2%), middle school (33,429 | 21.3%), and elementary school (32,340 | 20.6%).
| School Level | # Students | % Students |
| Nursery / Preschool | 10,364 | 6.6% |
| Kindergarten | 8,176 | 5.2% |
| Elementary School | 32,340 | 20.6% |
| Middle School | 33,429 | 21.3% |
| High School | 36,463 | 23.2% |
| College / Undergraduate | 26,582 | 16.9% |
| Graduate / Professional | 9,672 | 6.2% |
| Total | 157,026 | 100.0% |
School Enrollment by Age by Funding Source in Arapahoe County
Out of a total of 157,026 students who are enrolled in schools in Arapahoe County, 23,554 (15.0%) attend a private institution, while the remaining 133,472 (85.0%) are enrolled in public schools. The age group of 3 to 4 year olds has the highest likelihood of being enrolled in private schools, with 3,274 (40.6% in the age bracket) enrolled. Conversely, the age group of 15 to 17 year olds has the lowest likelihood of being enrolled in a private school, with 23,389 (91.9% in the age bracket) attending a public institution.
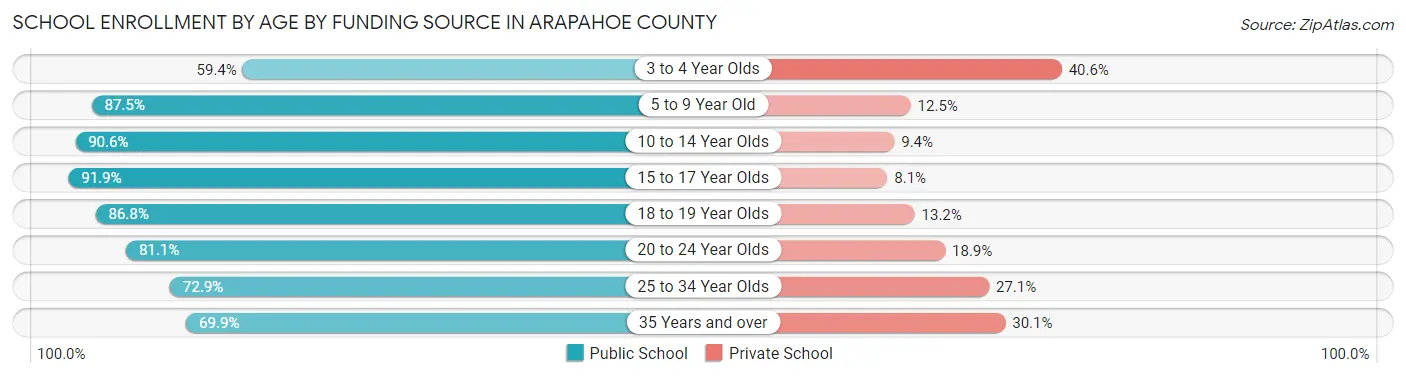
| Age Bracket | Public School | Private School |
| 3 to 4 Year Olds | 4,788 (59.4%) | 3,274 (40.6%) |
| 5 to 9 Year Old | 34,478 (87.5%) | 4,915 (12.5%) |
| 10 to 14 Year Olds | 38,119 (90.6%) | 3,968 (9.4%) |
| 15 to 17 Year Olds | 23,389 (91.9%) | 2,073 (8.1%) |
| 18 to 19 Year Olds | 8,558 (86.8%) | 1,303 (13.2%) |
| 20 to 24 Year Olds | 10,024 (81.1%) | 2,335 (18.9%) |
| 25 to 34 Year Olds | 7,857 (72.9%) | 2,916 (27.1%) |
| 35 Years and over | 6,311 (69.9%) | 2,718 (30.1%) |
| Total | 133,472 (85.0%) | 23,554 (15.0%) |
Educational Attainment by Field of Study in Arapahoe County
Business (46,930 | 21.3%), social sciences (19,465 | 8.8%), science & technology (19,000 | 8.6%), education (18,196 | 8.3%), and engineering (18,191 | 8.3%) are the most common fields of study among 220,548 individuals in Arapahoe County who have obtained a bachelor's degree or higher.
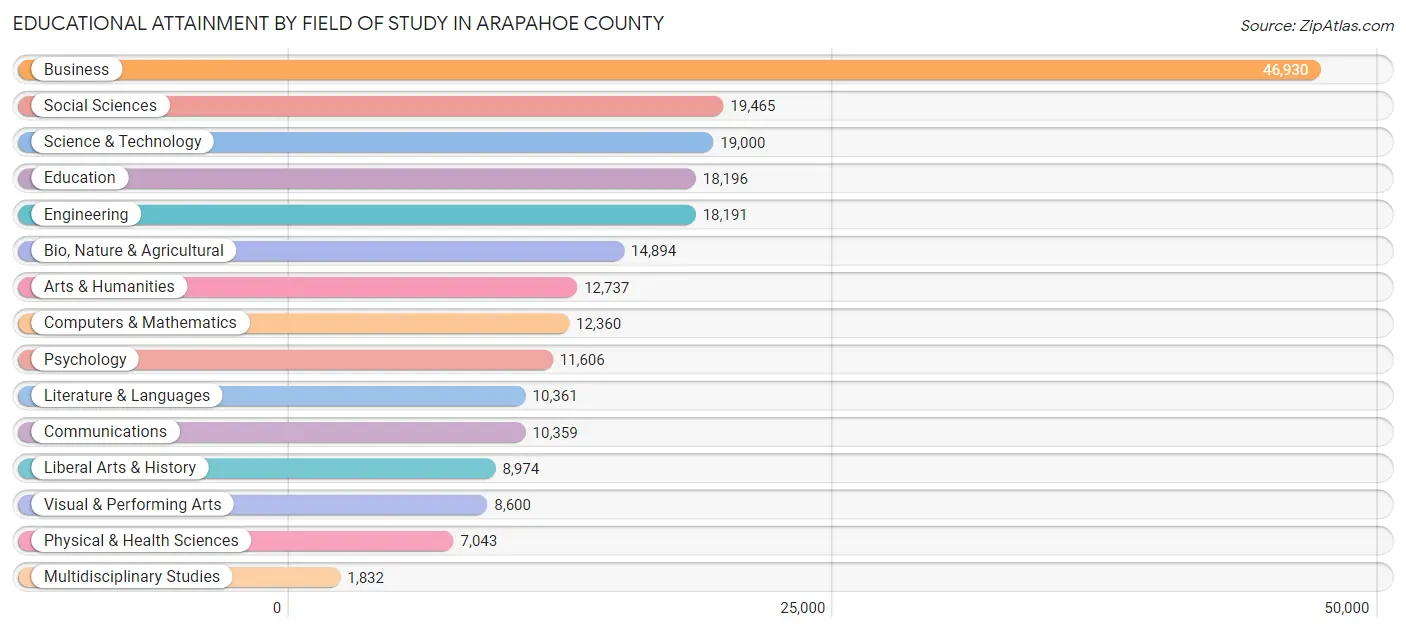
| Field of Study | # Graduates | % Graduates |
| Computers & Mathematics | 12,360 | 5.6% |
| Bio, Nature & Agricultural | 14,894 | 6.8% |
| Physical & Health Sciences | 7,043 | 3.2% |
| Psychology | 11,606 | 5.3% |
| Social Sciences | 19,465 | 8.8% |
| Engineering | 18,191 | 8.3% |
| Multidisciplinary Studies | 1,832 | 0.8% |
| Science & Technology | 19,000 | 8.6% |
| Business | 46,930 | 21.3% |
| Education | 18,196 | 8.3% |
| Literature & Languages | 10,361 | 4.7% |
| Liberal Arts & History | 8,974 | 4.1% |
| Visual & Performing Arts | 8,600 | 3.9% |
| Communications | 10,359 | 4.7% |
| Arts & Humanities | 12,737 | 5.8% |
| Total | 220,548 | 100.0% |
Transportation & Commute in Arapahoe County
Vehicle Availability by Sex in Arapahoe County
The most prevalent vehicle ownership categories in Arapahoe County are males with 2 vehicles (79,666, accounting for 42.6%) and females with 2 vehicles (67,486, making up 49.3%).
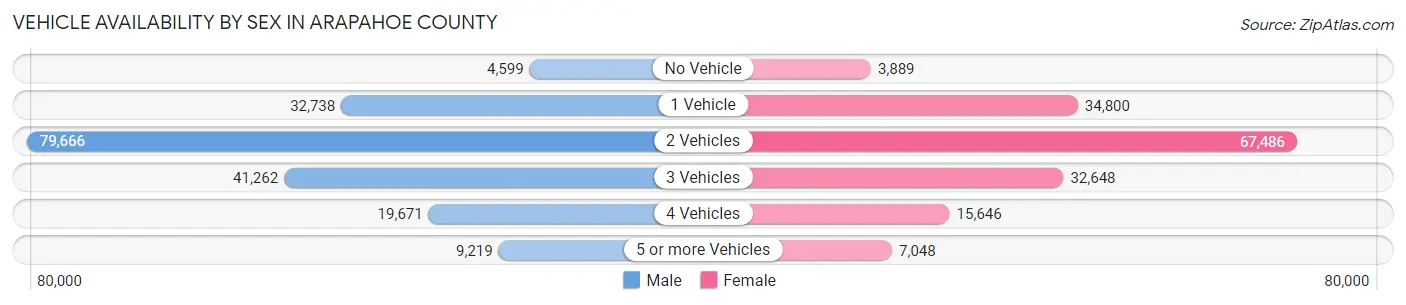
| Vehicles Available | Male | Female |
| No Vehicle | 4,599 (2.5%) | 3,889 (2.4%) |
| 1 Vehicle | 32,738 (17.5%) | 34,800 (21.5%) |
| 2 Vehicles | 79,666 (42.6%) | 67,486 (41.8%) |
| 3 Vehicles | 41,262 (22.1%) | 32,648 (20.2%) |
| 4 Vehicles | 19,671 (10.5%) | 15,646 (9.7%) |
| 5 or more Vehicles | 9,219 (4.9%) | 7,048 (4.4%) |
| Total | 187,155 (100.0%) | 161,517 (100.0%) |
Commute Time in Arapahoe County
The most frequently occuring commute durations in Arapahoe County are 30 to 34 minutes (52,215 commuters, 17.9%), 20 to 24 minutes (49,258 commuters, 16.9%), and 15 to 19 minutes (39,703 commuters, 13.6%).
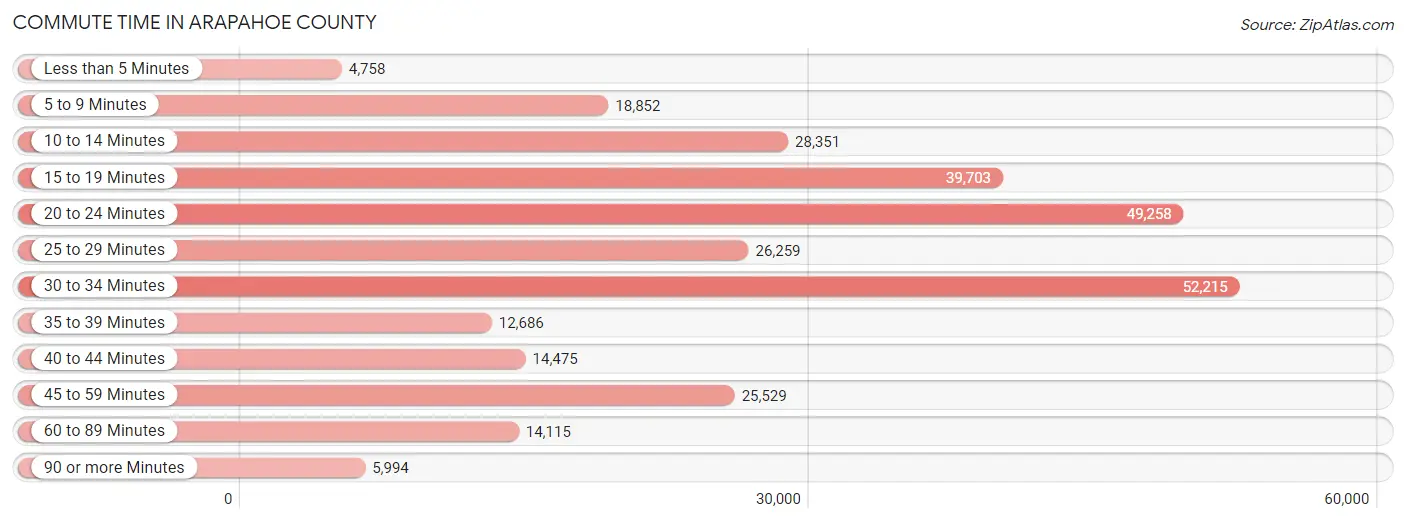
| Commute Time | # Commuters | % Commuters |
| Less than 5 Minutes | 4,758 | 1.6% |
| 5 to 9 Minutes | 18,852 | 6.5% |
| 10 to 14 Minutes | 28,351 | 9.7% |
| 15 to 19 Minutes | 39,703 | 13.6% |
| 20 to 24 Minutes | 49,258 | 16.9% |
| 25 to 29 Minutes | 26,259 | 9.0% |
| 30 to 34 Minutes | 52,215 | 17.9% |
| 35 to 39 Minutes | 12,686 | 4.3% |
| 40 to 44 Minutes | 14,475 | 5.0% |
| 45 to 59 Minutes | 25,529 | 8.7% |
| 60 to 89 Minutes | 14,115 | 4.8% |
| 90 or more Minutes | 5,994 | 2.1% |
Commute Time by Sex in Arapahoe County
The most common commute times in Arapahoe County are 30 to 34 minutes (28,826 commuters, 18.1%) for males and 30 to 34 minutes (23,389 commuters, 17.5%) for females.
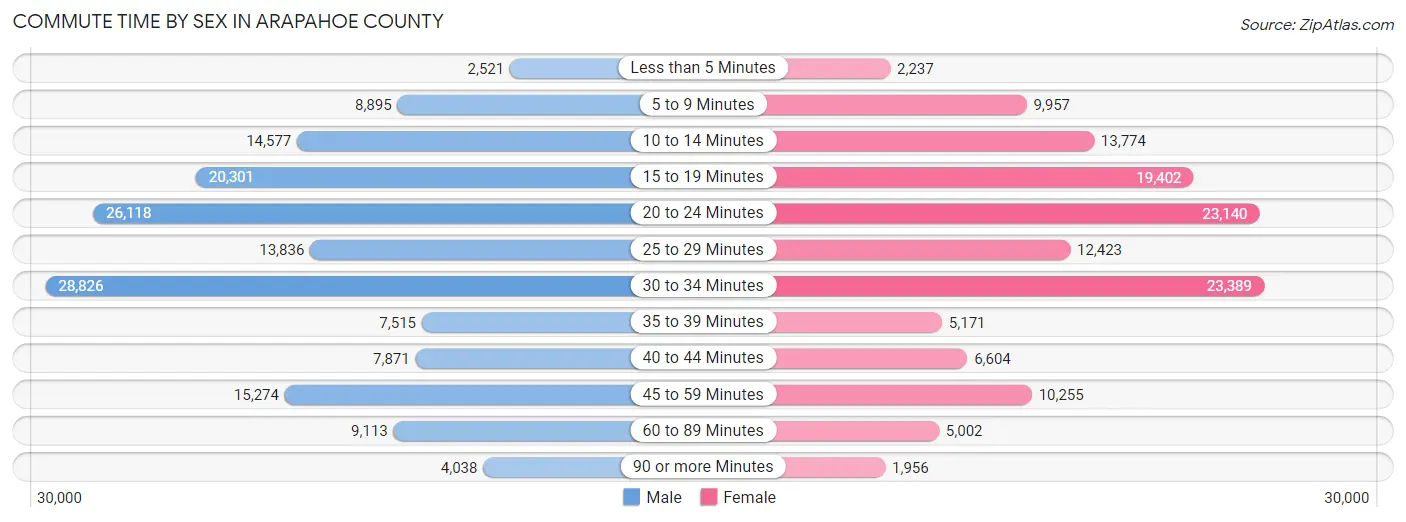
| Commute Time | Male | Female |
| Less than 5 Minutes | 2,521 (1.6%) | 2,237 (1.7%) |
| 5 to 9 Minutes | 8,895 (5.6%) | 9,957 (7.5%) |
| 10 to 14 Minutes | 14,577 (9.2%) | 13,774 (10.3%) |
| 15 to 19 Minutes | 20,301 (12.8%) | 19,402 (14.5%) |
| 20 to 24 Minutes | 26,118 (16.4%) | 23,140 (17.4%) |
| 25 to 29 Minutes | 13,836 (8.7%) | 12,423 (9.3%) |
| 30 to 34 Minutes | 28,826 (18.1%) | 23,389 (17.5%) |
| 35 to 39 Minutes | 7,515 (4.7%) | 5,171 (3.9%) |
| 40 to 44 Minutes | 7,871 (5.0%) | 6,604 (5.0%) |
| 45 to 59 Minutes | 15,274 (9.6%) | 10,255 (7.7%) |
| 60 to 89 Minutes | 9,113 (5.7%) | 5,002 (3.7%) |
| 90 or more Minutes | 4,038 (2.5%) | 1,956 (1.5%) |
Time of Departure to Work by Sex in Arapahoe County
The most frequent times of departure to work in Arapahoe County are 7:00 AM to 7:29 AM (21,025, 13.2%) for males and 7:00 AM to 7:29 AM (22,257, 16.7%) for females.
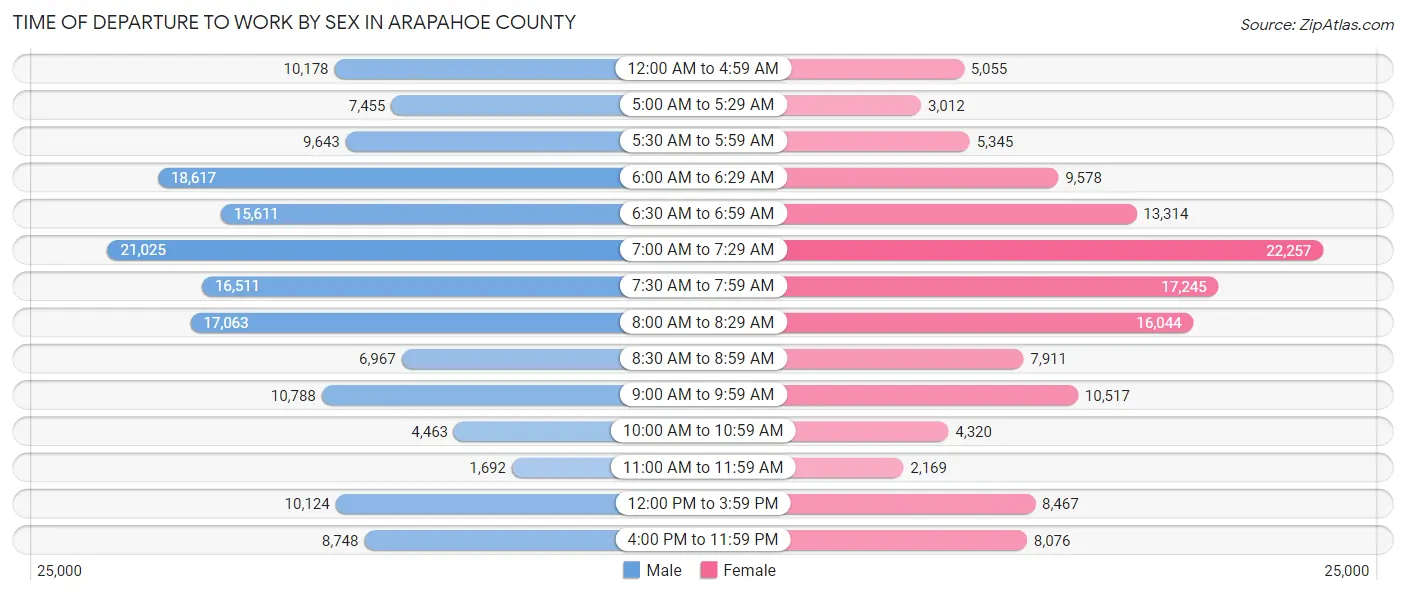
| Time of Departure | Male | Female |
| 12:00 AM to 4:59 AM | 10,178 (6.4%) | 5,055 (3.8%) |
| 5:00 AM to 5:29 AM | 7,455 (4.7%) | 3,012 (2.3%) |
| 5:30 AM to 5:59 AM | 9,643 (6.1%) | 5,345 (4.0%) |
| 6:00 AM to 6:29 AM | 18,617 (11.7%) | 9,578 (7.2%) |
| 6:30 AM to 6:59 AM | 15,611 (9.8%) | 13,314 (10.0%) |
| 7:00 AM to 7:29 AM | 21,025 (13.2%) | 22,257 (16.7%) |
| 7:30 AM to 7:59 AM | 16,511 (10.4%) | 17,245 (12.9%) |
| 8:00 AM to 8:29 AM | 17,063 (10.7%) | 16,044 (12.0%) |
| 8:30 AM to 8:59 AM | 6,967 (4.4%) | 7,911 (5.9%) |
| 9:00 AM to 9:59 AM | 10,788 (6.8%) | 10,517 (7.9%) |
| 10:00 AM to 10:59 AM | 4,463 (2.8%) | 4,320 (3.2%) |
| 11:00 AM to 11:59 AM | 1,692 (1.1%) | 2,169 (1.6%) |
| 12:00 PM to 3:59 PM | 10,124 (6.4%) | 8,467 (6.4%) |
| 4:00 PM to 11:59 PM | 8,748 (5.5%) | 8,076 (6.1%) |
| Total | 158,885 (100.0%) | 133,310 (100.0%) |
Housing Occupancy in Arapahoe County
Occupancy by Ownership in Arapahoe County
Of the total 250,751 dwellings in Arapahoe County, owner-occupied units account for 162,810 (64.9%), while renter-occupied units make up 87,941 (35.1%).
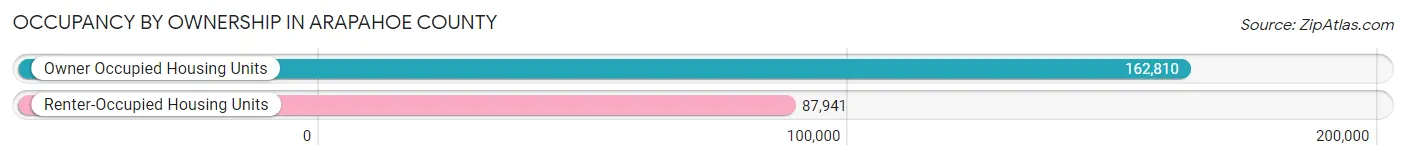
| Occupancy | # Housing Units | % Housing Units |
| Owner Occupied Housing Units | 162,810 | 64.9% |
| Renter-Occupied Housing Units | 87,941 | 35.1% |
| Total Occupied Housing Units | 250,751 | 100.0% |
Occupancy by Household Size in Arapahoe County
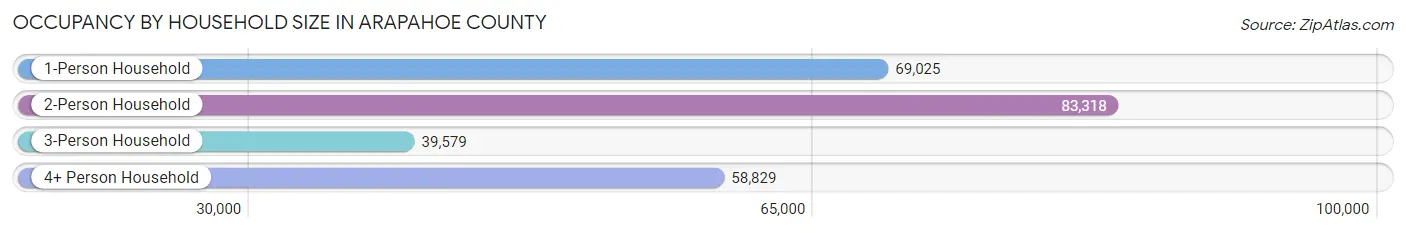
| Household Size | # Housing Units | % Housing Units |
| 1-Person Household | 69,025 | 27.5% |
| 2-Person Household | 83,318 | 33.2% |
| 3-Person Household | 39,579 | 15.8% |
| 4+ Person Household | 58,829 | 23.5% |
| Total Housing Units | 250,751 | 100.0% |
Occupancy by Ownership by Household Size in Arapahoe County
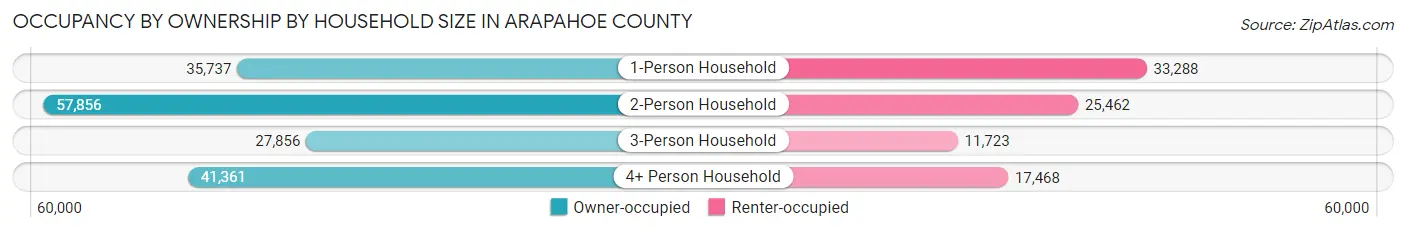
| Household Size | Owner-occupied | Renter-occupied |
| 1-Person Household | 35,737 (51.8%) | 33,288 (48.2%) |
| 2-Person Household | 57,856 (69.4%) | 25,462 (30.6%) |
| 3-Person Household | 27,856 (70.4%) | 11,723 (29.6%) |
| 4+ Person Household | 41,361 (70.3%) | 17,468 (29.7%) |
| Total Housing Units | 162,810 (64.9%) | 87,941 (35.1%) |
Occupancy by Educational Attainment in Arapahoe County
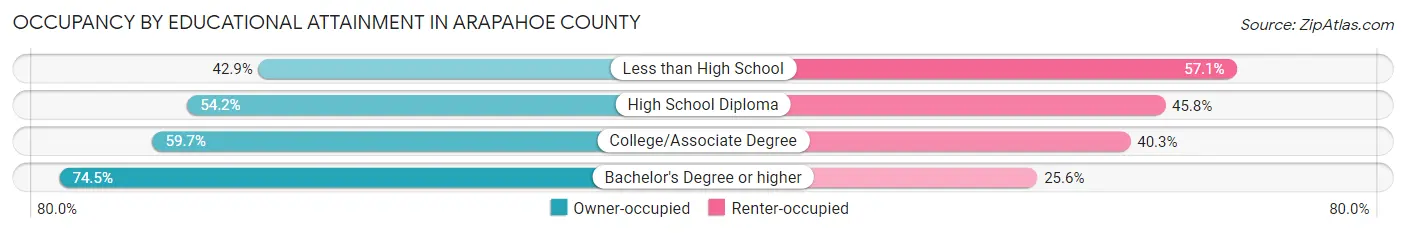
| Household Size | Owner-occupied | Renter-occupied |
| Less than High School | 6,623 (42.9%) | 8,818 (57.1%) |
| High School Diploma | 22,250 (54.2%) | 18,819 (45.8%) |
| College/Associate Degree | 43,170 (59.7%) | 29,153 (40.3%) |
| Bachelor's Degree or higher | 90,767 (74.5%) | 31,151 (25.6%) |
Occupancy by Age of Householder in Arapahoe County
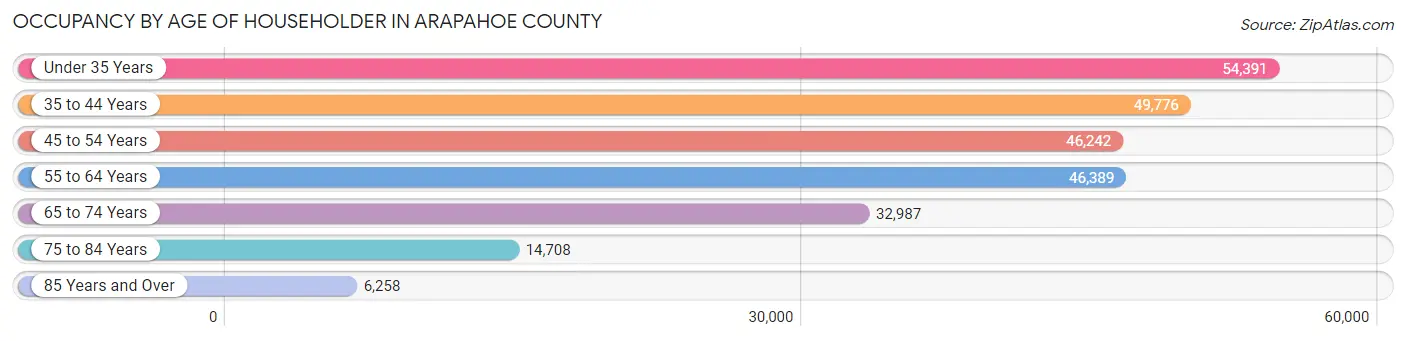
| Age Bracket | # Households | % Households |
| Under 35 Years | 54,391 | 21.7% |
| 35 to 44 Years | 49,776 | 19.9% |
| 45 to 54 Years | 46,242 | 18.4% |
| 55 to 64 Years | 46,389 | 18.5% |
| 65 to 74 Years | 32,987 | 13.2% |
| 75 to 84 Years | 14,708 | 5.9% |
| 85 Years and Over | 6,258 | 2.5% |
| Total | 250,751 | 100.0% |
Housing Finances in Arapahoe County
Median Income by Occupancy in Arapahoe County
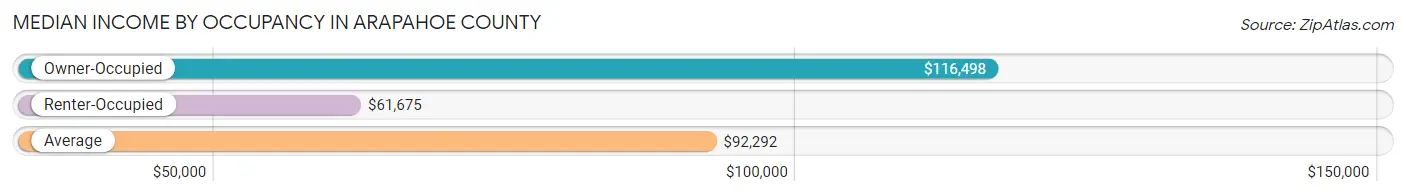
| Occupancy Type | # Households | Median Income |
| Owner-Occupied | 162,810 (64.9%) | $116,498 |
| Renter-Occupied | 87,941 (35.1%) | $61,675 |
| Average | 250,751 (100.0%) | $92,292 |
Occupancy by Householder Income Bracket in Arapahoe County
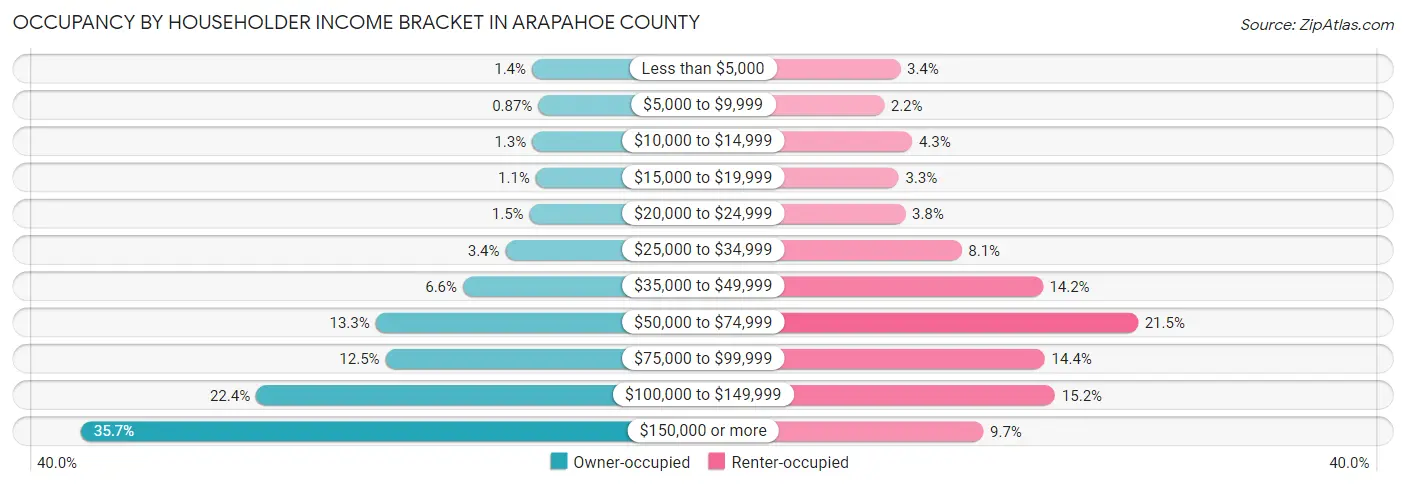
| Income Bracket | Owner-occupied | Renter-occupied |
| Less than $5,000 | 2,196 (1.3%) | 2,983 (3.4%) |
| $5,000 to $9,999 | 1,416 (0.9%) | 1,887 (2.1%) |
| $10,000 to $14,999 | 2,188 (1.3%) | 3,781 (4.3%) |
| $15,000 to $19,999 | 1,722 (1.1%) | 2,876 (3.3%) |
| $20,000 to $24,999 | 2,508 (1.5%) | 3,314 (3.8%) |
| $25,000 to $34,999 | 5,493 (3.4%) | 7,084 (8.1%) |
| $35,000 to $49,999 | 10,767 (6.6%) | 12,519 (14.2%) |
| $50,000 to $74,999 | 21,591 (13.3%) | 18,911 (21.5%) |
| $75,000 to $99,999 | 20,370 (12.5%) | 12,676 (14.4%) |
| $100,000 to $149,999 | 36,426 (22.4%) | 13,358 (15.2%) |
| $150,000 or more | 58,133 (35.7%) | 8,552 (9.7%) |
| Total | 162,810 (100.0%) | 87,941 (100.0%) |
Monthly Housing Cost Tiers in Arapahoe County
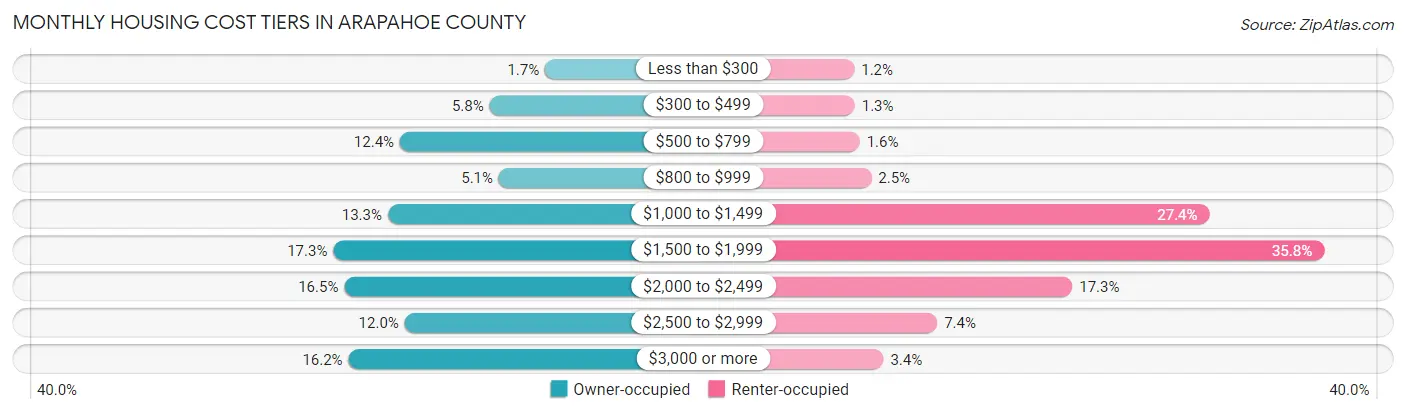
| Monthly Cost | Owner-occupied | Renter-occupied |
| Less than $300 | 2,711 (1.7%) | 1,092 (1.2%) |
| $300 to $499 | 9,385 (5.8%) | 1,124 (1.3%) |
| $500 to $799 | 20,128 (12.4%) | 1,445 (1.6%) |
| $800 to $999 | 8,251 (5.1%) | 2,195 (2.5%) |
| $1,000 to $1,499 | 21,575 (13.3%) | 24,085 (27.4%) |
| $1,500 to $1,999 | 28,113 (17.3%) | 31,505 (35.8%) |
| $2,000 to $2,499 | 26,797 (16.5%) | 15,214 (17.3%) |
| $2,500 to $2,999 | 19,557 (12.0%) | 6,463 (7.3%) |
| $3,000 or more | 26,293 (16.2%) | 2,982 (3.4%) |
| Total | 162,810 (100.0%) | 87,941 (100.0%) |
Physical Housing Characteristics in Arapahoe County
Housing Structures in Arapahoe County
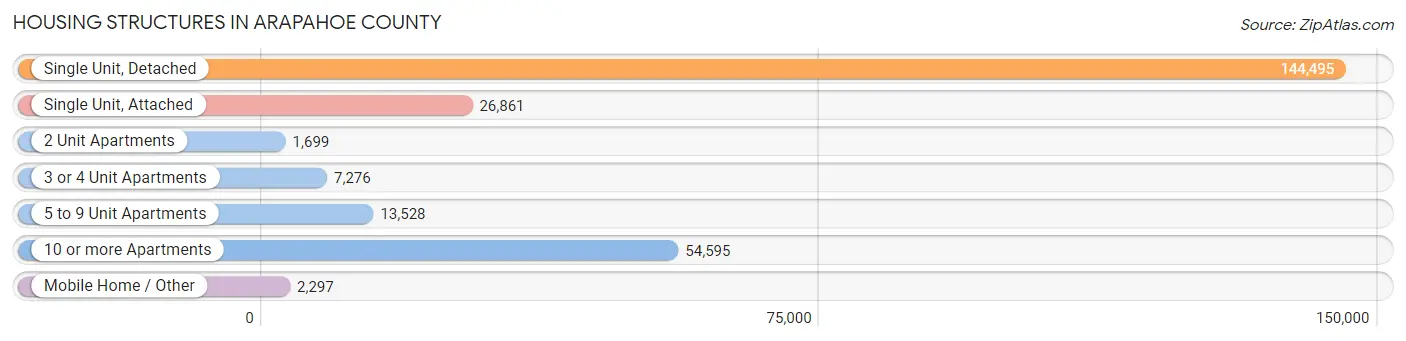
| Structure Type | # Housing Units | % Housing Units |
| Single Unit, Detached | 144,495 | 57.6% |
| Single Unit, Attached | 26,861 | 10.7% |
| 2 Unit Apartments | 1,699 | 0.7% |
| 3 or 4 Unit Apartments | 7,276 | 2.9% |
| 5 to 9 Unit Apartments | 13,528 | 5.4% |
| 10 or more Apartments | 54,595 | 21.8% |
| Mobile Home / Other | 2,297 | 0.9% |
| Total | 250,751 | 100.0% |
Housing Structures by Occupancy in Arapahoe County
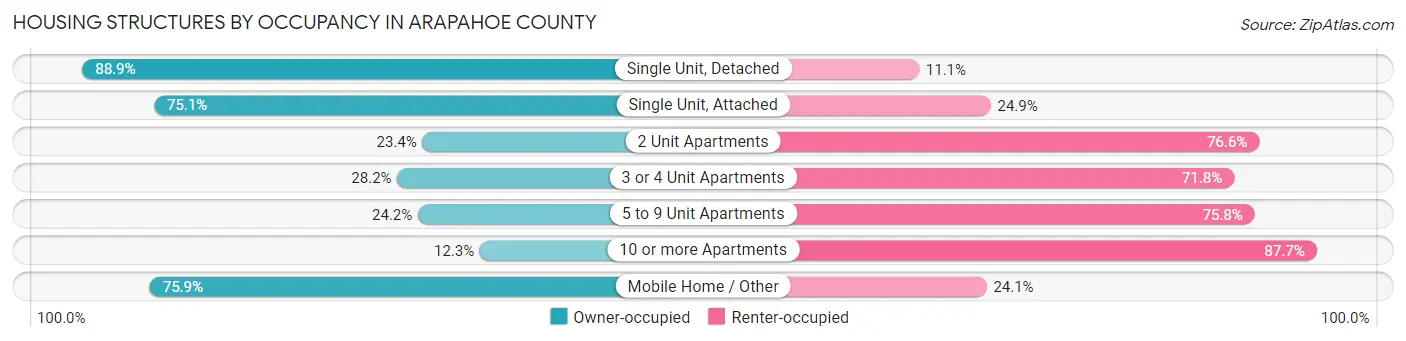
| Structure Type | Owner-occupied | Renter-occupied |
| Single Unit, Detached | 128,446 (88.9%) | 16,049 (11.1%) |
| Single Unit, Attached | 20,169 (75.1%) | 6,692 (24.9%) |
| 2 Unit Apartments | 397 (23.4%) | 1,302 (76.6%) |
| 3 or 4 Unit Apartments | 2,053 (28.2%) | 5,223 (71.8%) |
| 5 to 9 Unit Apartments | 3,279 (24.2%) | 10,249 (75.8%) |
| 10 or more Apartments | 6,723 (12.3%) | 47,872 (87.7%) |
| Mobile Home / Other | 1,743 (75.9%) | 554 (24.1%) |
| Total | 162,810 (64.9%) | 87,941 (35.1%) |
Housing Structures by Number of Rooms in Arapahoe County
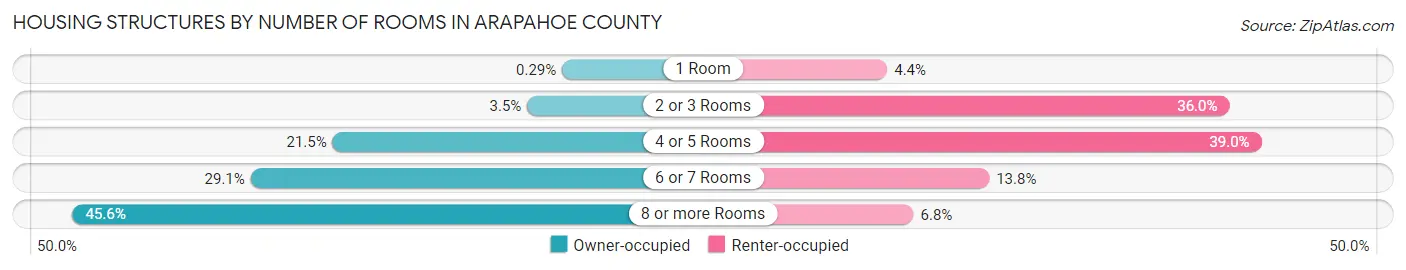
| Number of Rooms | Owner-occupied | Renter-occupied |
| 1 Room | 469 (0.3%) | 3,853 (4.4%) |
| 2 or 3 Rooms | 5,729 (3.5%) | 31,671 (36.0%) |
| 4 or 5 Rooms | 35,040 (21.5%) | 34,278 (39.0%) |
| 6 or 7 Rooms | 47,374 (29.1%) | 12,148 (13.8%) |
| 8 or more Rooms | 74,198 (45.6%) | 5,991 (6.8%) |
| Total | 162,810 (100.0%) | 87,941 (100.0%) |
Housing Structure by Heating Type in Arapahoe County
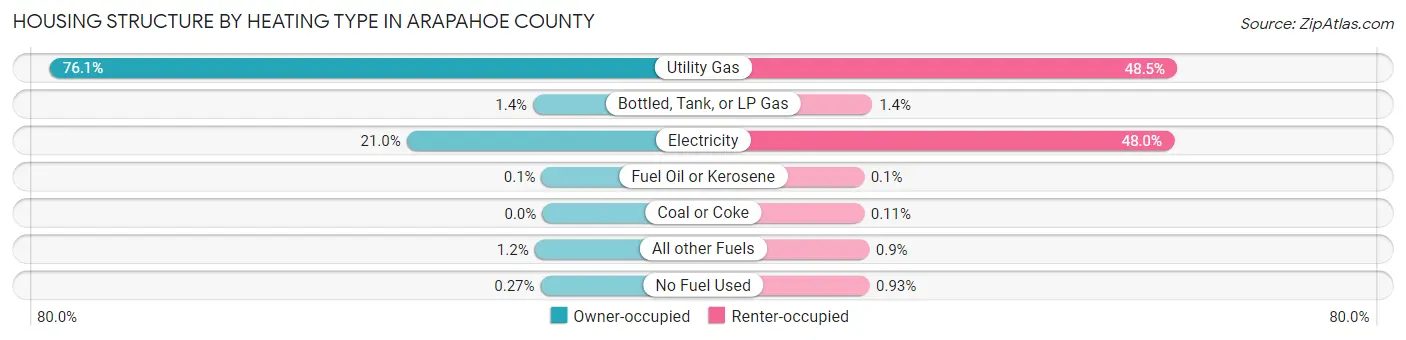
| Heating Type | Owner-occupied | Renter-occupied |
| Utility Gas | 123,880 (76.1%) | 42,658 (48.5%) |
| Bottled, Tank, or LP Gas | 2,305 (1.4%) | 1,250 (1.4%) |
| Electricity | 34,105 (20.9%) | 42,242 (48.0%) |
| Fuel Oil or Kerosene | 161 (0.1%) | 92 (0.1%) |
| Coal or Coke | 5 (0.0%) | 93 (0.1%) |
| All other Fuels | 1,918 (1.2%) | 789 (0.9%) |
| No Fuel Used | 436 (0.3%) | 817 (0.9%) |
| Total | 162,810 (100.0%) | 87,941 (100.0%) |
Household Vehicle Usage in Arapahoe County
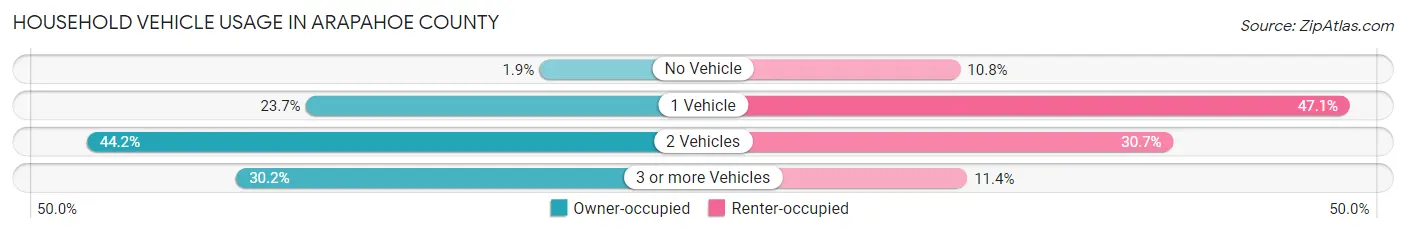
| Vehicles per Household | Owner-occupied | Renter-occupied |
| No Vehicle | 3,066 (1.9%) | 9,478 (10.8%) |
| 1 Vehicle | 38,569 (23.7%) | 41,452 (47.1%) |
| 2 Vehicles | 71,947 (44.2%) | 26,967 (30.7%) |
| 3 or more Vehicles | 49,228 (30.2%) | 10,044 (11.4%) |
| Total | 162,810 (100.0%) | 87,941 (100.0%) |
Real Estate & Mortgages in Arapahoe County
Real Estate and Mortgage Overview in Arapahoe County
| Characteristic | Without Mortgage | With Mortgage |
| Housing Units | 42,046 | 120,764 |
| Median Property Value | $475,700 | $482,100 |
| Median Household Income | $87,100 | $47,501 |
| Monthly Housing Costs | $648 | $25,861 |
| Real Estate Taxes | $2,607 | $2,772 |
Property Value by Mortgage Status in Arapahoe County
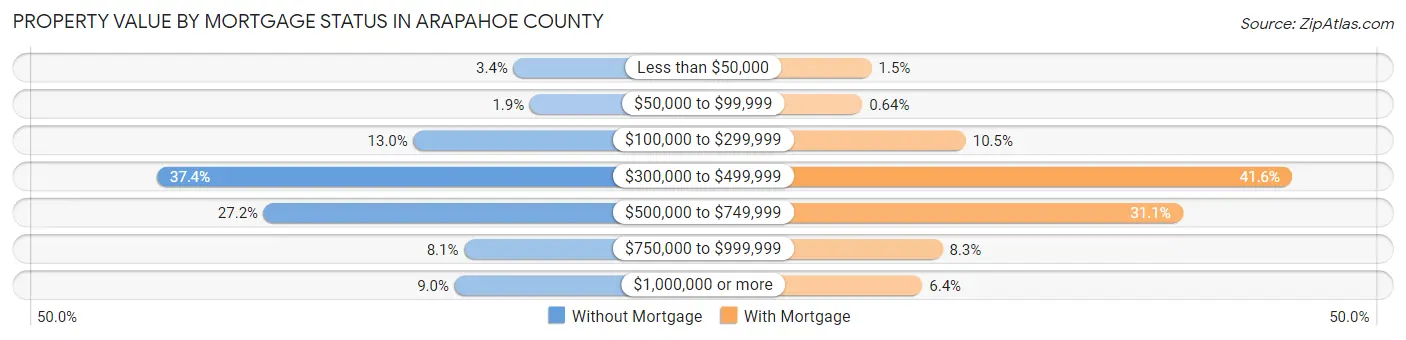
| Property Value | Without Mortgage | With Mortgage |
| Less than $50,000 | 1,440 (3.4%) | 1,852 (1.5%) |
| $50,000 to $99,999 | 783 (1.9%) | 776 (0.6%) |
| $100,000 to $299,999 | 5,445 (13.0%) | 12,679 (10.5%) |
| $300,000 to $499,999 | 15,725 (37.4%) | 50,173 (41.5%) |
| $500,000 to $749,999 | 11,442 (27.2%) | 37,605 (31.1%) |
| $750,000 to $999,999 | 3,414 (8.1%) | 9,998 (8.3%) |
| $1,000,000 or more | 3,797 (9.0%) | 7,681 (6.4%) |
| Total | 42,046 (100.0%) | 120,764 (100.0%) |
Household Income by Mortgage Status in Arapahoe County
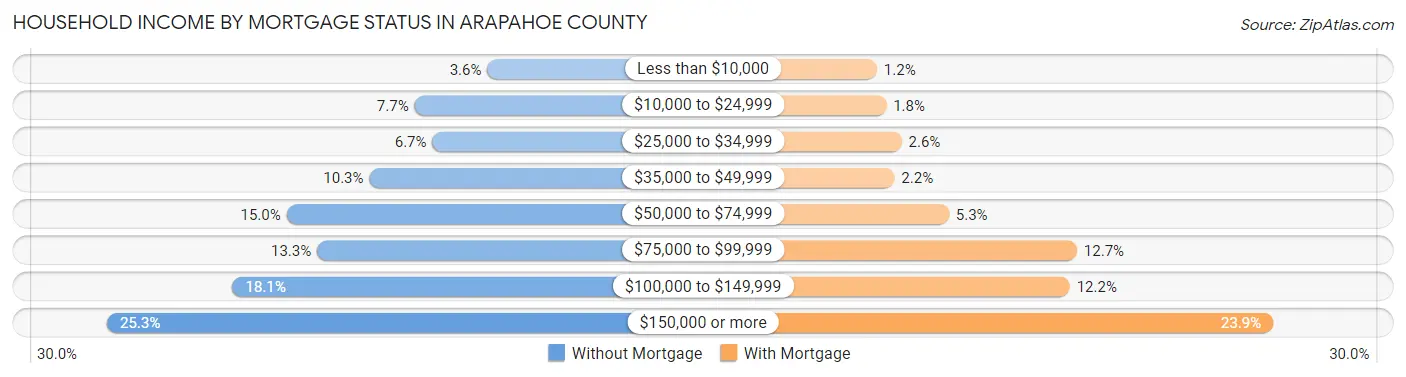
| Household Income | Without Mortgage | With Mortgage |
| Less than $10,000 | 1,496 (3.6%) | 1,471 (1.2%) |
| $10,000 to $24,999 | 3,244 (7.7%) | 2,116 (1.8%) |
| $25,000 to $34,999 | 2,817 (6.7%) | 3,174 (2.6%) |
| $35,000 to $49,999 | 4,332 (10.3%) | 2,676 (2.2%) |
| $50,000 to $74,999 | 6,320 (15.0%) | 6,435 (5.3%) |
| $75,000 to $99,999 | 5,588 (13.3%) | 15,271 (12.7%) |
| $100,000 to $149,999 | 7,617 (18.1%) | 14,782 (12.2%) |
| $150,000 or more | 10,632 (25.3%) | 28,809 (23.9%) |
| Total | 42,046 (100.0%) | 120,764 (100.0%) |
Property Value to Household Income Ratio in Arapahoe County
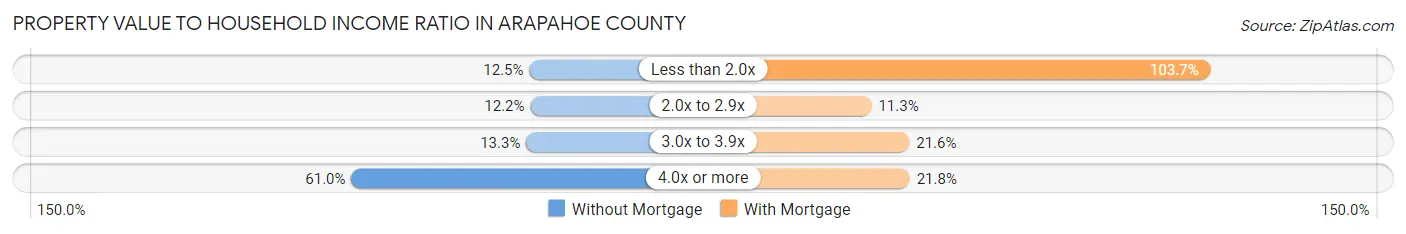
| Value-to-Income Ratio | Without Mortgage | With Mortgage |
| Less than 2.0x | 5,254 (12.5%) | 125,224 (103.7%) |
| 2.0x to 2.9x | 5,140 (12.2%) | 13,672 (11.3%) |
| 3.0x to 3.9x | 5,610 (13.3%) | 26,106 (21.6%) |
| 4.0x or more | 25,644 (61.0%) | 26,272 (21.7%) |
| Total | 42,046 (100.0%) | 120,764 (100.0%) |
Real Estate Taxes by Mortgage Status in Arapahoe County

| Property Taxes | Without Mortgage | With Mortgage |
| Less than $800 | 2,476 (5.9%) | 477 (0.4%) |
| $800 to $1,499 | 4,976 (11.8%) | 4,454 (3.7%) |
| $800 to $1,499 | 33,329 (79.3%) | 16,423 (13.6%) |
| Total | 42,046 (100.0%) | 120,764 (100.0%) |
Health & Disability in Arapahoe County
Health Insurance Coverage by Age in Arapahoe County
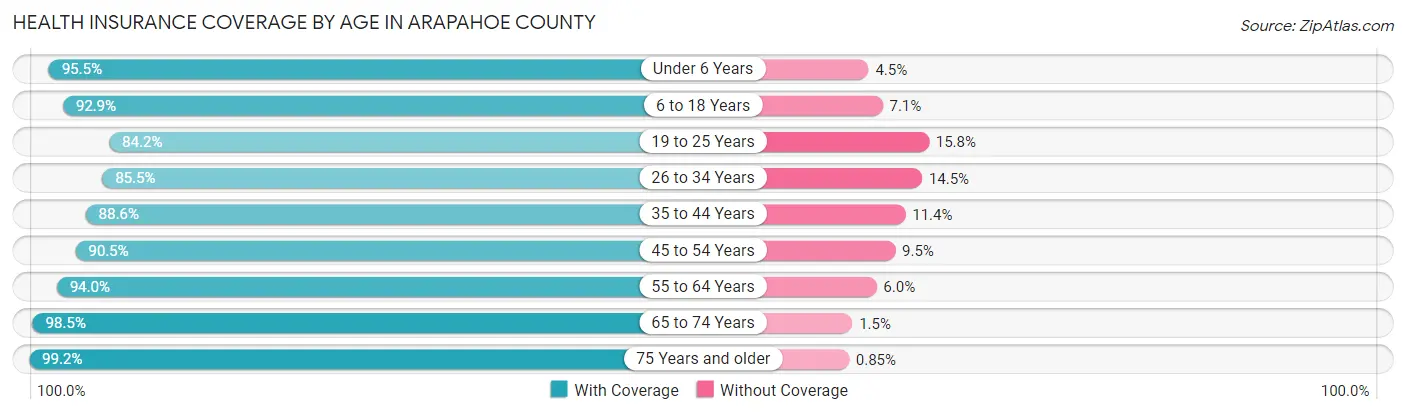
| Age Bracket | With Coverage | Without Coverage |
| Under 6 Years | 44,272 (95.5%) | 2,090 (4.5%) |
| 6 to 18 Years | 102,834 (92.9%) | 7,891 (7.1%) |
| 19 to 25 Years | 46,393 (84.2%) | 8,680 (15.8%) |
| 26 to 34 Years | 78,236 (85.5%) | 13,251 (14.5%) |
| 35 to 44 Years | 84,731 (88.6%) | 10,885 (11.4%) |
| 45 to 54 Years | 75,711 (90.5%) | 7,924 (9.5%) |
| 55 to 64 Years | 72,689 (94.0%) | 4,630 (6.0%) |
| 65 to 74 Years | 54,839 (98.5%) | 824 (1.5%) |
| 75 Years and older | 32,007 (99.2%) | 273 (0.9%) |
| Total | 591,712 (91.3%) | 56,448 (8.7%) |
Health Insurance Coverage by Citizenship Status in Arapahoe County
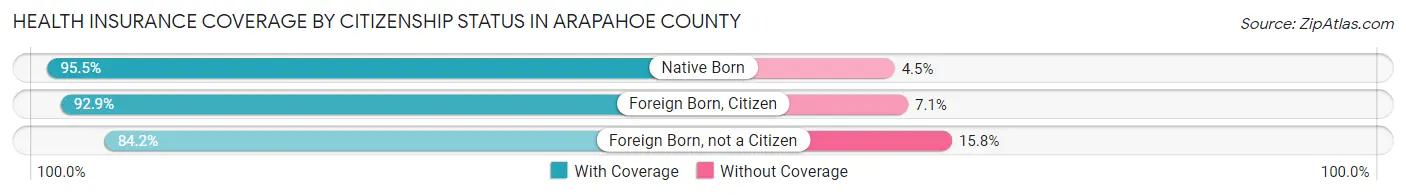
| Citizenship Status | With Coverage | Without Coverage |
| Native Born | 44,272 (95.5%) | 2,090 (4.5%) |
| Foreign Born, Citizen | 102,834 (92.9%) | 7,891 (7.1%) |
| Foreign Born, not a Citizen | 46,393 (84.2%) | 8,680 (15.8%) |
Health Insurance Coverage by Household Income in Arapahoe County
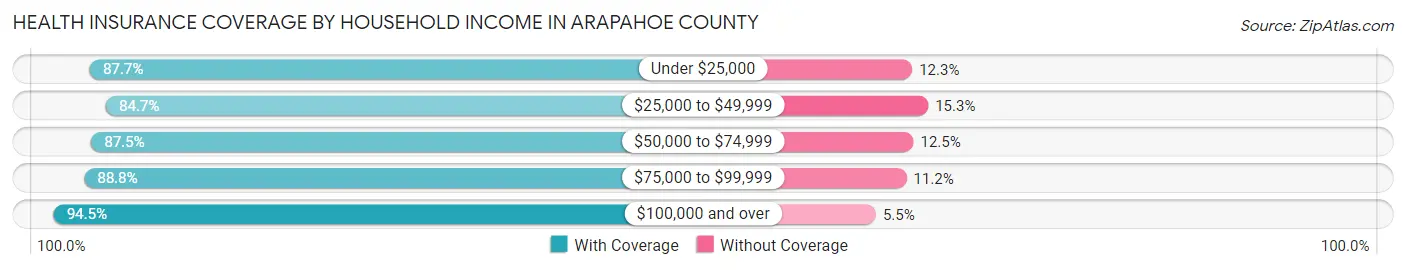
| Household Income | With Coverage | Without Coverage |
| Under $25,000 | 37,157 (87.7%) | 5,192 (12.3%) |
| $25,000 to $49,999 | 59,382 (84.7%) | 10,690 (15.3%) |
| $50,000 to $74,999 | 80,840 (87.5%) | 11,560 (12.5%) |
| $75,000 to $99,999 | 74,364 (88.8%) | 9,373 (11.2%) |
| $100,000 and over | 339,018 (94.5%) | 19,593 (5.5%) |
Public vs Private Health Insurance Coverage by Age in Arapahoe County
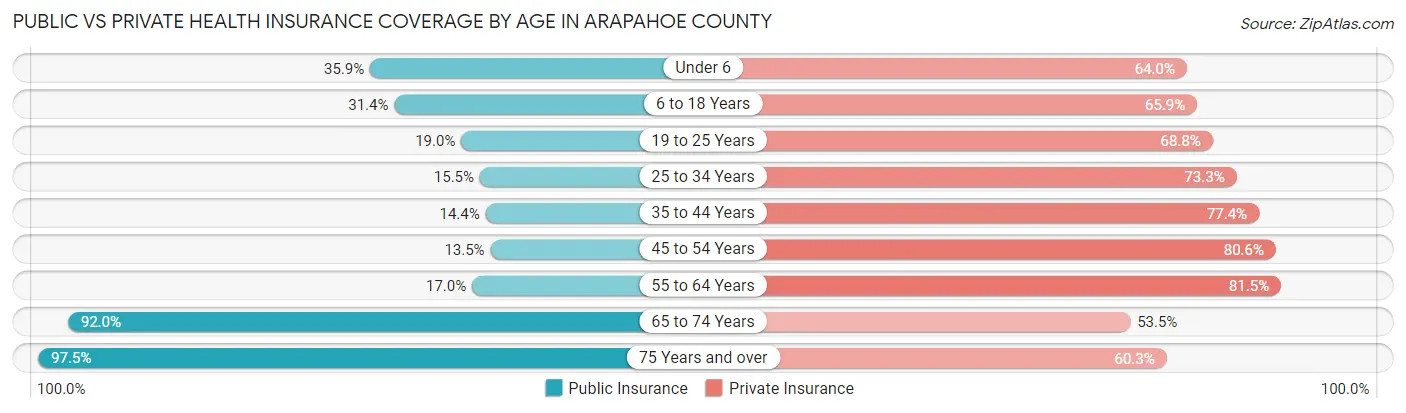
| Age Bracket | Public Insurance | Private Insurance |
| Under 6 | 16,632 (35.9%) | 29,685 (64.0%) |
| 6 to 18 Years | 34,748 (31.4%) | 73,017 (65.9%) |
| 19 to 25 Years | 10,434 (19.0%) | 37,906 (68.8%) |
| 25 to 34 Years | 14,181 (15.5%) | 67,018 (73.3%) |
| 35 to 44 Years | 13,806 (14.4%) | 74,028 (77.4%) |
| 45 to 54 Years | 11,315 (13.5%) | 67,371 (80.5%) |
| 55 to 64 Years | 13,105 (17.0%) | 63,035 (81.5%) |
| 65 to 74 Years | 51,193 (92.0%) | 29,798 (53.5%) |
| 75 Years and over | 31,469 (97.5%) | 19,456 (60.3%) |
| Total | 196,883 (30.4%) | 461,314 (71.2%) |
Disability Status by Sex by Age in Arapahoe County
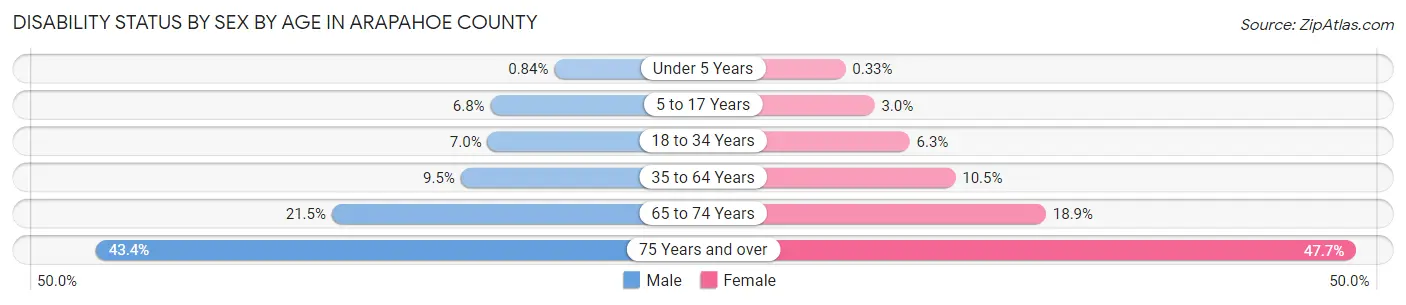
| Age Bracket | Male | Female |
| Under 5 Years | 163 (0.8%) | 61 (0.3%) |
| 5 to 17 Years | 3,848 (6.8%) | 1,643 (3.0%) |
| 18 to 34 Years | 5,553 (7.0%) | 4,736 (6.3%) |
| 35 to 64 Years | 12,257 (9.5%) | 13,475 (10.5%) |
| 65 to 74 Years | 5,598 (21.5%) | 5,609 (18.9%) |
| 75 Years and over | 5,696 (43.4%) | 9,139 (47.7%) |
Disability Class by Sex by Age in Arapahoe County
Disability Class: Hearing Difficulty

| Age Bracket | Male | Female |
| Under 5 Years | 26 (0.1%) | 61 (0.3%) |
| 5 to 17 Years | 305 (0.5%) | 361 (0.7%) |
| 18 to 34 Years | 797 (1.0%) | 738 (1.0%) |
| 35 to 64 Years | 3,942 (3.1%) | 2,077 (1.6%) |
| 65 to 74 Years | 2,825 (10.8%) | 1,463 (4.9%) |
| 75 Years and over | 3,334 (25.4%) | 3,573 (18.7%) |
Disability Class: Vision Difficulty
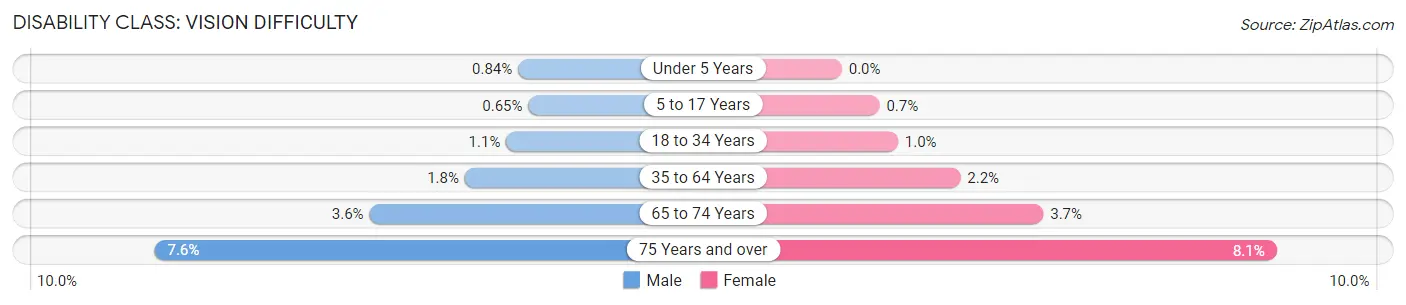
| Age Bracket | Male | Female |
| Under 5 Years | 163 (0.8%) | 0 (0.0%) |
| 5 to 17 Years | 368 (0.6%) | 381 (0.7%) |
| 18 to 34 Years | 839 (1.1%) | 783 (1.0%) |
| 35 to 64 Years | 2,359 (1.8%) | 2,817 (2.2%) |
| 65 to 74 Years | 937 (3.6%) | 1,109 (3.7%) |
| 75 Years and over | 996 (7.6%) | 1,546 (8.1%) |
Disability Class: Cognitive Difficulty
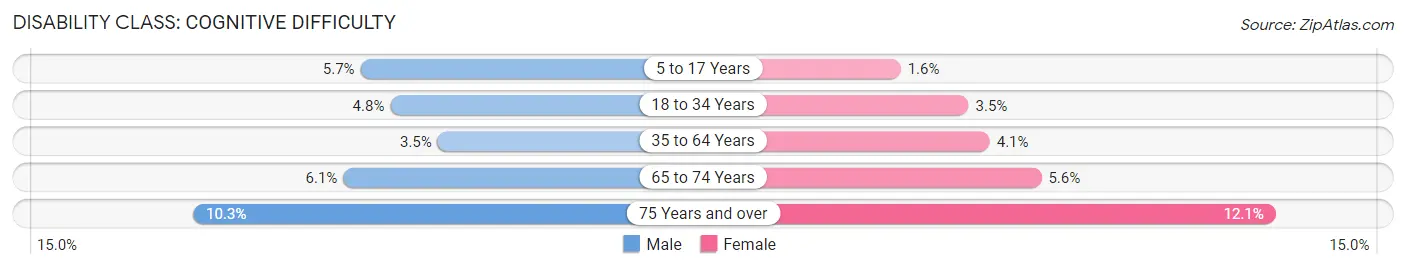
| Age Bracket | Male | Female |
| 5 to 17 Years | 3,212 (5.7%) | 891 (1.6%) |
| 18 to 34 Years | 3,806 (4.8%) | 2,658 (3.5%) |
| 35 to 64 Years | 4,502 (3.5%) | 5,274 (4.1%) |
| 65 to 74 Years | 1,597 (6.1%) | 1,646 (5.6%) |
| 75 Years and over | 1,354 (10.3%) | 2,314 (12.1%) |
Disability Class: Ambulatory Difficulty
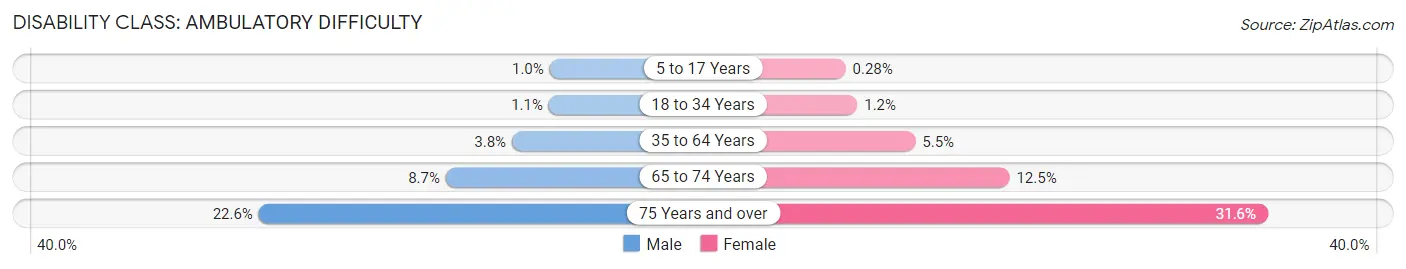
| Age Bracket | Male | Female |
| 5 to 17 Years | 579 (1.0%) | 152 (0.3%) |
| 18 to 34 Years | 854 (1.1%) | 870 (1.1%) |
| 35 to 64 Years | 4,916 (3.8%) | 6,988 (5.5%) |
| 65 to 74 Years | 2,273 (8.7%) | 3,687 (12.4%) |
| 75 Years and over | 2,970 (22.6%) | 6,057 (31.6%) |
Disability Class: Self-Care Difficulty
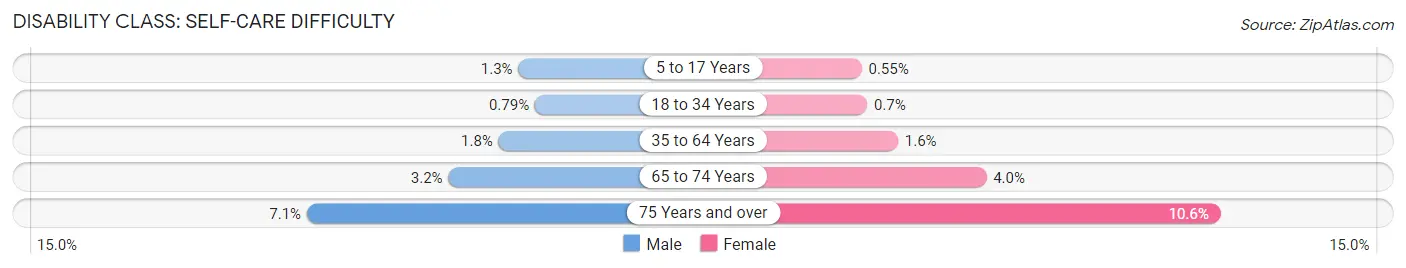
| Age Bracket | Male | Female |
| 5 to 17 Years | 713 (1.3%) | 300 (0.5%) |
| 18 to 34 Years | 622 (0.8%) | 529 (0.7%) |
| 35 to 64 Years | 2,318 (1.8%) | 1,999 (1.6%) |
| 65 to 74 Years | 834 (3.2%) | 1,191 (4.0%) |
| 75 Years and over | 937 (7.1%) | 2,020 (10.5%) |
Technology Access in Arapahoe County
Computing Device Access in Arapahoe County
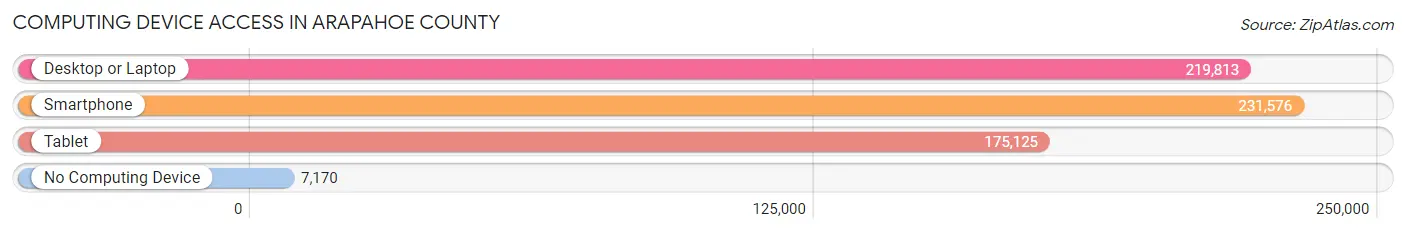
| Device Type | # Households | % Households |
| Desktop or Laptop | 219,813 | 87.7% |
| Smartphone | 231,576 | 92.3% |
| Tablet | 175,125 | 69.8% |
| No Computing Device | 7,170 | 2.9% |
| Total | 250,751 | 100.0% |
Internet Access in Arapahoe County
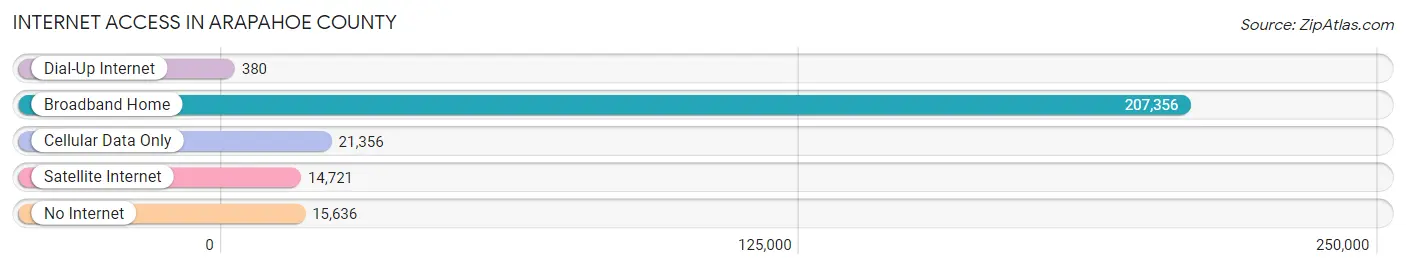
| Internet Type | # Households | % Households |
| Dial-Up Internet | 380 | 0.2% |
| Broadband Home | 207,356 | 82.7% |
| Cellular Data Only | 21,356 | 8.5% |
| Satellite Internet | 14,721 | 5.9% |
| No Internet | 15,636 | 6.2% |
| Total | 250,751 | 100.0% |
Arapahoe County Summary
Arapahoe County, Colorado is located in the south-central part of the state and is the third most populous county in the state. It is bordered by Adams County to the north, Douglas County to the south, Jefferson County to the west, and Elbert County to the east. The county seat is Littleton, and the largest city is Aurora. The county was named after the Arapaho Native American tribe who lived in the area.
Geography
Arapahoe County covers an area of 805 square miles and is located in the South Platte River Valley. The county is mostly flat with some rolling hills and is located at an elevation of 5,000 feet. The county is home to several reservoirs, including Aurora Reservoir, Cherry Creek Reservoir, and Chatfield Reservoir. The county is also home to several parks, including Cherry Creek State Park, South Platte Park, and Aurora Reservoir Park.
Climate
Arapahoe County has a semi-arid climate with hot summers and cold winters. The average temperature in the summer is around 80 degrees Fahrenheit and the average temperature in the winter is around 30 degrees Fahrenheit. The county receives an average of 15 inches of precipitation per year.
Demographics
As of the 2010 census, Arapahoe County had a population of 572,003. The population was 51.2% White, 20.3% Hispanic or Latino, 15.2% Black or African American, 8.2% Asian, and 5.1% other races. The median household income was $63,902 and the median family income was $76,945. The per capita income was $30,945.
Economy
Arapahoe County is home to several major employers, including the University of Colorado Anschutz Medical Campus, Lockheed Martin, and the Denver International Airport. The county is also home to several major shopping centers, including Park Meadows Mall and Southlands Mall. The county is also home to several major industries, including aerospace, technology, and healthcare.
History
Arapahoe County was established in 1861 and was named after the Arapaho Native American tribe who lived in the area. The county was originally part of Jefferson County and was later split off to form its own county. The county seat was originally located in Littleton, but was later moved to Denver in 1873. The county was home to several major events in the late 19th and early 20th centuries, including the Sand Creek Massacre in 1864 and the Denver and Rio Grande Railroad in 1870. The county was also home to several major industries, including mining, agriculture, and ranching. The county experienced rapid growth in the late 20th century, due to the growth of the Denver metropolitan area.
Common Questions
What is the Total Population of Arapahoe County?
Total Population of Arapahoe County is 654,453.
What is the Total Male Population of Arapahoe County?
Total Male Population of Arapahoe County is 327,156.
What is the Total Female Population of Arapahoe County?
Total Female Population of Arapahoe County is 327,297.
What is the Ratio of Males per 100 Females in Arapahoe County?
There are 99.96 Males per 100 Females in Arapahoe County.
What is the Ratio of Females per 100 Males in Arapahoe County?
There are 100.04 Females per 100 Males in Arapahoe County.
What is the Median Population Age in Arapahoe County?
Median Population Age in Arapahoe County is 37.1 Years.
What is the Average Family Size in Arapahoe County
Average Family Size in Arapahoe County is 3.2 People.
What is the Average Household Size in Arapahoe County
Average Household Size in Arapahoe County is 2.6 People.
What is Per Capita Income in Arapahoe County?
Per Capita income in Arapahoe County is $49,530.
What is the Median Family Income in Arapahoe County?
Median Family Income in Arapahoe County is $114,803.
What is the Median Household income in Arapahoe County?
Median Household Income in Arapahoe County is $92,292.
What is Income or Wage Gap in Arapahoe County?
Income or Wage Gap in Arapahoe County is 25.6%.
Women in Arapahoe County earn 74.4 cents for every dollar earned by a man.
What is Family Income Deficit in Arapahoe County?
Family Income Deficit in Arapahoe County is $12,012.
Families that are below poverty line in Arapahoe County earn $12,012 less on average than the poverty threshold level.
What is Inequality or Gini Index in Arapahoe County?
Inequality or Gini Index in Arapahoe County is 0.46.
How Large is the Labor Force in Arapahoe County?
There are 373,410 People in the Labor Forcein in Arapahoe County.
What is the Percentage of People in the Labor Force in Arapahoe County?
71.4% of People are in the Labor Force in Arapahoe County.
What is the Unemployment Rate in Arapahoe County?
Unemployment Rate in Arapahoe County is 4.6%.