Akron, CO
Akron Map
Akron Overview
1,675
TOTAL POPULATION
850
MALE POPULATION
825
FEMALE POPULATION
103.03
MALES / 100 FEMALES
97.06
FEMALES / 100 MALES
41.1
MEDIAN AGE
2.5
AVG FAMILY SIZE
1.9
AVG HOUSEHOLD SIZE
$34,359
PER CAPITA INCOME
$59,141
AVG FAMILY INCOME
$52,813
AVG HOUSEHOLD INCOME
30.4%
WAGE / INCOME GAP [ % ]
69.6¢/ $1
WAGE / INCOME GAP [ $ ]
$6,822
FAMILY INCOME DEFICIT
0.46
INEQUALITY / GINI INDEX
812
LABOR FORCE [ PEOPLE ]
56.4%
PERCENT IN LABOR FORCE
2.1%
UNEMPLOYMENT RATE
Akron Zip Codes
Akron Area Codes
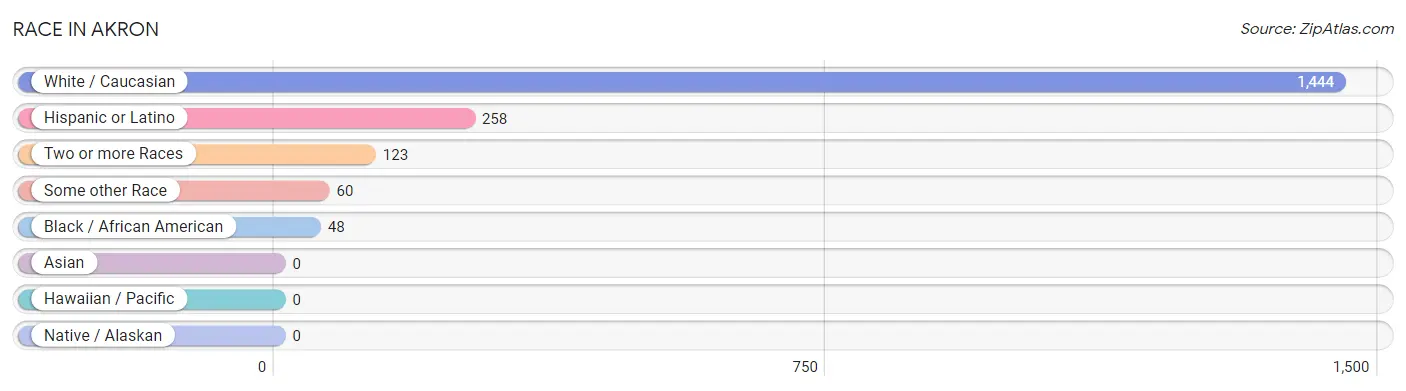
Race in Akron
The most populous races in Akron are White / Caucasian (1,444 | 86.2%), Hispanic or Latino (258 | 15.4%), and Two or more Races (123 | 7.3%).
| Race | # Population | % Population |
| Asian | 0 | 0.0% |
| Black / African American | 48 | 2.9% |
| Hawaiian / Pacific | 0 | 0.0% |
| Hispanic or Latino | 258 | 15.4% |
| Native / Alaskan | 0 | 0.0% |
| White / Caucasian | 1,444 | 86.2% |
| Two or more Races | 123 | 7.3% |
| Some other Race | 60 | 3.6% |
| Total | 1,675 | 100.0% |
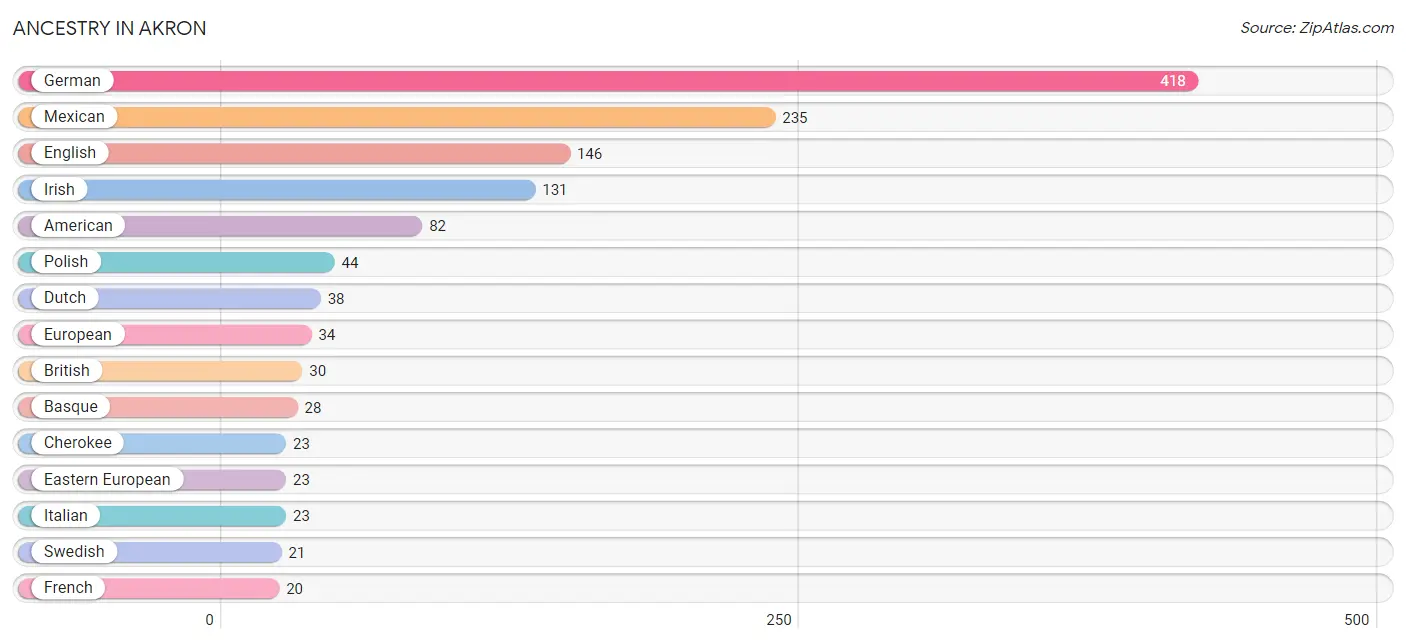
Ancestry in Akron
The most populous ancestries reported in Akron are German (418 | 25.0%), Mexican (235 | 14.0%), English (146 | 8.7%), Irish (131 | 7.8%), and American (82 | 4.9%), together accounting for 60.4% of all Akron residents.
| Ancestry | # Population | % Population |
| African | 8 | 0.5% |
| American | 82 | 4.9% |
| Arab | 4 | 0.2% |
| Basque | 28 | 1.7% |
| Belgian | 9 | 0.5% |
| Bhutanese | 8 | 0.5% |
| British | 30 | 1.8% |
| Burmese | 10 | 0.6% |
| Cherokee | 23 | 1.4% |
| Creek | 4 | 0.2% |
| Cuban | 6 | 0.4% |
| Czech | 2 | 0.1% |
| Danish | 16 | 1.0% |
| Dominican | 5 | 0.3% |
| Dutch | 38 | 2.3% |
| Eastern European | 23 | 1.4% |
| English | 146 | 8.7% |
| European | 34 | 2.0% |
| French | 20 | 1.2% |
| German | 418 | 25.0% |
| Hungarian | 5 | 0.3% |
| Irish | 131 | 7.8% |
| Italian | 23 | 1.4% |
| Mexican | 235 | 14.0% |
| Moroccan | 4 | 0.2% |
| Northern European | 8 | 0.5% |
| Norwegian | 15 | 0.9% |
| Polish | 44 | 2.6% |
| Portuguese | 6 | 0.4% |
| Russian | 18 | 1.1% |
| Scandinavian | 9 | 0.5% |
| Scotch-Irish | 18 | 1.1% |
| Scottish | 16 | 1.0% |
| Slovak | 4 | 0.2% |
| Spanish | 1 | 0.1% |
| Spanish American | 10 | 0.6% |
| Subsaharan African | 8 | 0.5% |
| Swedish | 21 | 1.3% |
| Welsh | 4 | 0.2% | View All 39 Rows |
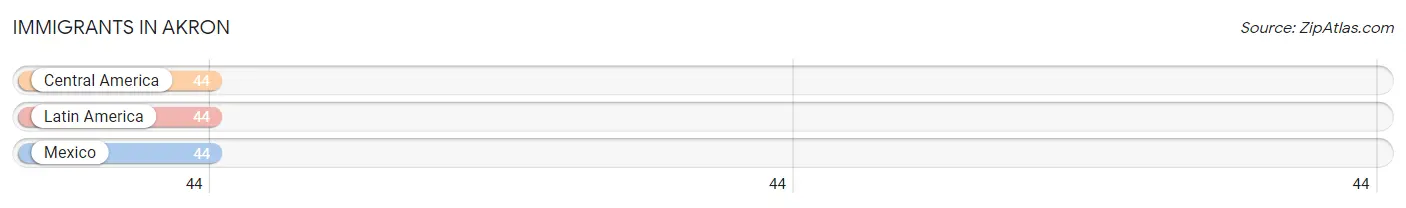
Immigrants in Akron
The most numerous immigrant groups reported in Akron came from Central America (44 | 2.6%), Latin America (44 | 2.6%), and Mexico (44 | 2.6%), together accounting for 7.9% of all Akron residents.
| Immigration Origin | # Population | % Population |
| Central America | 44 | 2.6% |
| Latin America | 44 | 2.6% |
| Mexico | 44 | 2.6% | View All 3 Rows |
Sex and Age in Akron
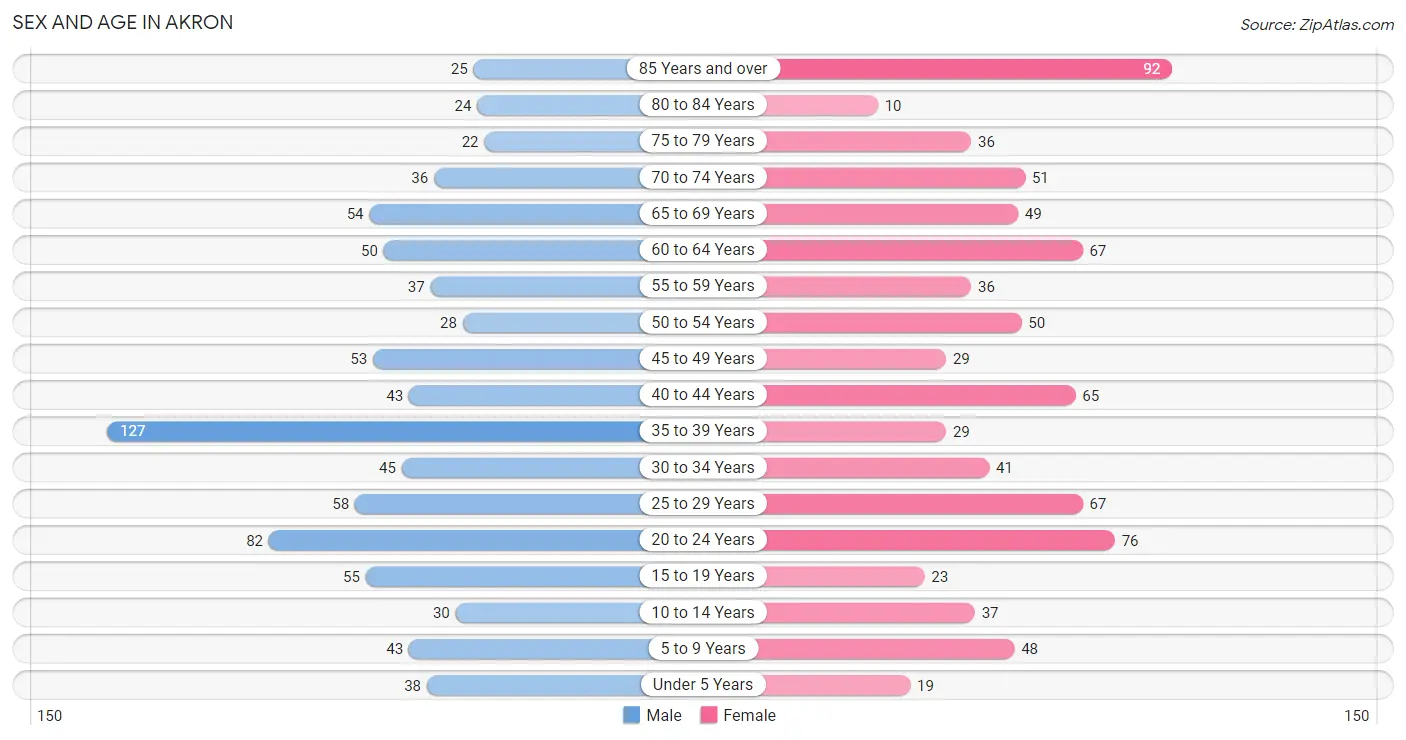
Sex and Age in Akron
The most populous age groups in Akron are 35 to 39 Years (127 | 14.9%) for men and 85 Years and over (92 | 11.2%) for women.
| Age Bracket | Male | Female |
| Under 5 Years | 38 (4.5%) | 19 (2.3%) |
| 5 to 9 Years | 43 (5.1%) | 48 (5.8%) |
| 10 to 14 Years | 30 (3.5%) | 37 (4.5%) |
| 15 to 19 Years | 55 (6.5%) | 23 (2.8%) |
| 20 to 24 Years | 82 (9.7%) | 76 (9.2%) |
| 25 to 29 Years | 58 (6.8%) | 67 (8.1%) |
| 30 to 34 Years | 45 (5.3%) | 41 (5.0%) |
| 35 to 39 Years | 127 (14.9%) | 29 (3.5%) |
| 40 to 44 Years | 43 (5.1%) | 65 (7.9%) |
| 45 to 49 Years | 53 (6.2%) | 29 (3.5%) |
| 50 to 54 Years | 28 (3.3%) | 50 (6.1%) |
| 55 to 59 Years | 37 (4.3%) | 36 (4.4%) |
| 60 to 64 Years | 50 (5.9%) | 67 (8.1%) |
| 65 to 69 Years | 54 (6.4%) | 49 (5.9%) |
| 70 to 74 Years | 36 (4.2%) | 51 (6.2%) |
| 75 to 79 Years | 22 (2.6%) | 36 (4.4%) |
| 80 to 84 Years | 24 (2.8%) | 10 (1.2%) |
| 85 Years and over | 25 (2.9%) | 92 (11.2%) |
| Total | 850 (100.0%) | 825 (100.0%) |
Families and Households in Akron
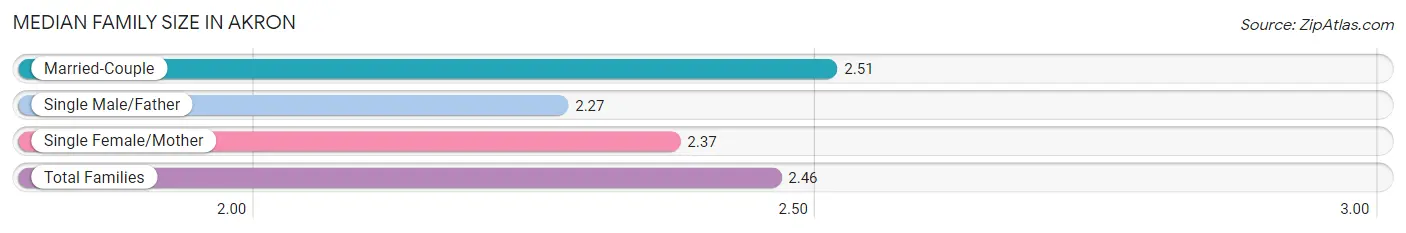
Median Family Size in Akron
The median family size in Akron is 2.46 persons per family, with married-couple families (340 | 75.4%) accounting for the largest median family size of 2.51 persons per family. On the other hand, single male/father families (41 | 9.1%) represent the smallest median family size with 2.27 persons per family.
| Family Type | # Families | Family Size |
| Married-Couple | 340 (75.4%) | 2.51 |
| Single Male/Father | 41 (9.1%) | 2.27 |
| Single Female/Mother | 70 (15.5%) | 2.37 |
| Total Families | 451 (100.0%) | 2.46 |
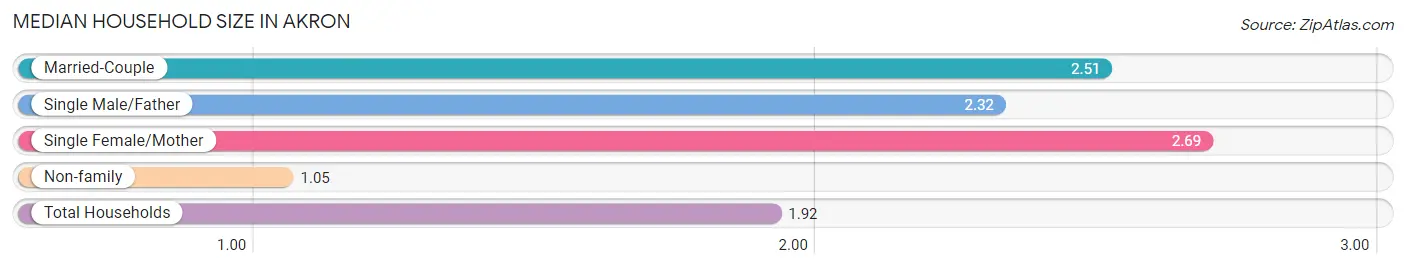
Median Household Size in Akron
The median household size in Akron is 1.92 persons per household, with single female/mother households (70 | 9.2%) accounting for the largest median household size of 2.69 persons per household. non-family households (311 | 40.8%) represent the smallest median household size with 1.05 persons per household.
| Household Type | # Households | Household Size |
| Married-Couple | 340 (44.6%) | 2.51 |
| Single Male/Father | 41 (5.4%) | 2.32 |
| Single Female/Mother | 70 (9.2%) | 2.69 |
| Non-family | 311 (40.8%) | 1.05 |
| Total Households | 762 (100.0%) | 1.92 |
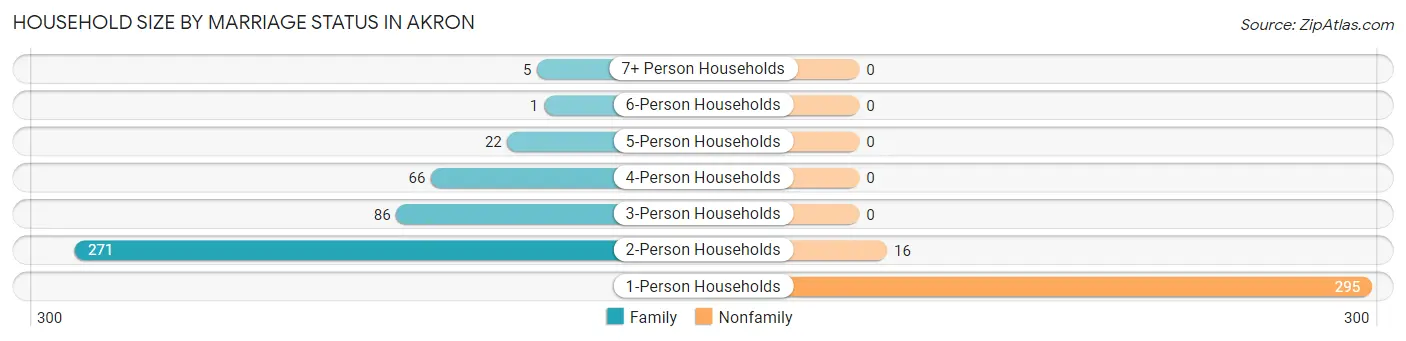
Household Size by Marriage Status in Akron
Out of a total of 762 households in Akron, 451 (59.2%) are family households, while 311 (40.8%) are nonfamily households. The most numerous type of family households are 2-person households, comprising 271, and the most common type of nonfamily households are 1-person households, comprising 295.
| Household Size | Family Households | Nonfamily Households |
| 1-Person Households | - | 295 (38.7%) |
| 2-Person Households | 271 (35.6%) | 16 (2.1%) |
| 3-Person Households | 86 (11.3%) | 0 (0.0%) |
| 4-Person Households | 66 (8.7%) | 0 (0.0%) |
| 5-Person Households | 22 (2.9%) | 0 (0.0%) |
| 6-Person Households | 1 (0.1%) | 0 (0.0%) |
| 7+ Person Households | 5 (0.7%) | 0 (0.0%) |
| Total | 451 (59.2%) | 311 (40.8%) |
Female Fertility in Akron
Fertility by Age in Akron
Average fertility rate in Akron is 79.0 births per 1,000 women. Women in the age bracket of 20 to 34 years have the highest fertility rate with 136.0 births per 1,000 women. Women in the age bracket of 20 to 34 years acount for 92.6% of all women with births.
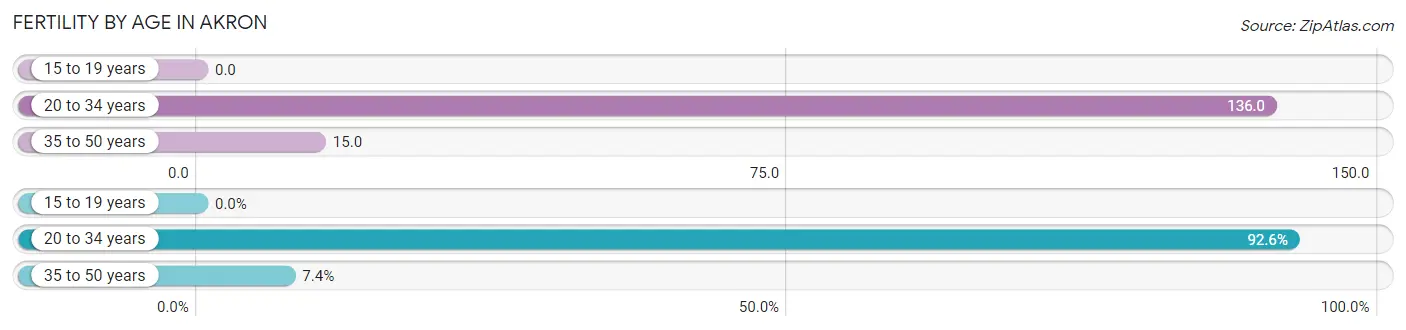
| Age Bracket | Women with Births | Births / 1,000 Women |
| 15 to 19 years | 0 (0.0%) | 0.0 |
| 20 to 34 years | 25 (92.6%) | 136.0 |
| 35 to 50 years | 2 (7.4%) | 15.0 |
| Total | 27 (100.0%) | 79.0 |
Fertility by Age by Marriage Status in Akron
66.7% of women with births (27) in Akron are married. The highest percentage of unmarried women with births falls into 20 to 34 years age bracket with 36.0% of them unmarried at the time of birth, while the lowest percentage of unmarried women with births belong to 35 to 50 years age bracket with 0.0% of them unmarried.
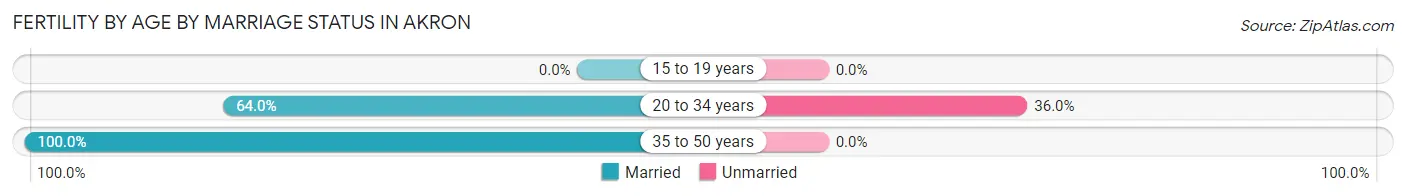
| Age Bracket | Married | Unmarried |
| 15 to 19 years | 0 (0.0%) | 0 (0.0%) |
| 20 to 34 years | 16 (64.0%) | 9 (36.0%) |
| 35 to 50 years | 2 (100.0%) | 0 (0.0%) |
| Total | 18 (66.7%) | 9 (33.3%) |
Fertility by Education in Akron
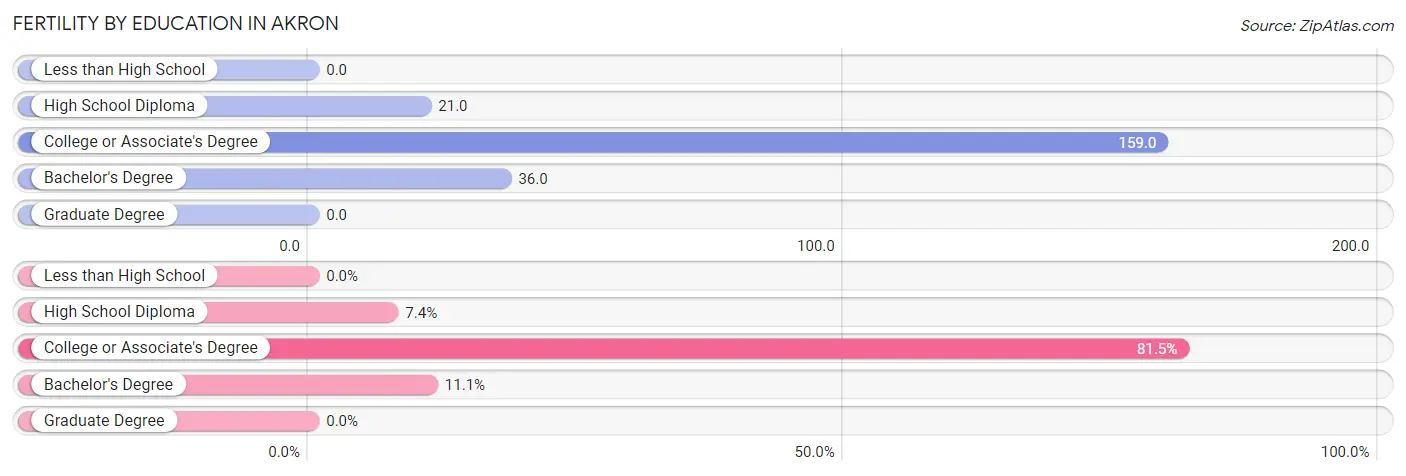
| Educational Attainment | Women with Births | Births / 1,000 Women |
| Less than High School | 0 (0.0%) | 0.0 |
| High School Diploma | 2 (7.4%) | 21.0 |
| College or Associate's Degree | 22 (81.5%) | 159.0 |
| Bachelor's Degree | 3 (11.1%) | 36.0 |
| Graduate Degree | 0 (0.0%) | 0.0 |
| Total | 27 (100.0%) | 79.0 |
Fertility by Education by Marriage Status in Akron
33.3% of women with births in Akron are unmarried. Women with the educational attainment of high school diploma are most likely to be married with 100.0% of them married at childbirth, while women with the educational attainment of college or associate's degree are least likely to be married with 40.9% of them unmarried at childbirth.
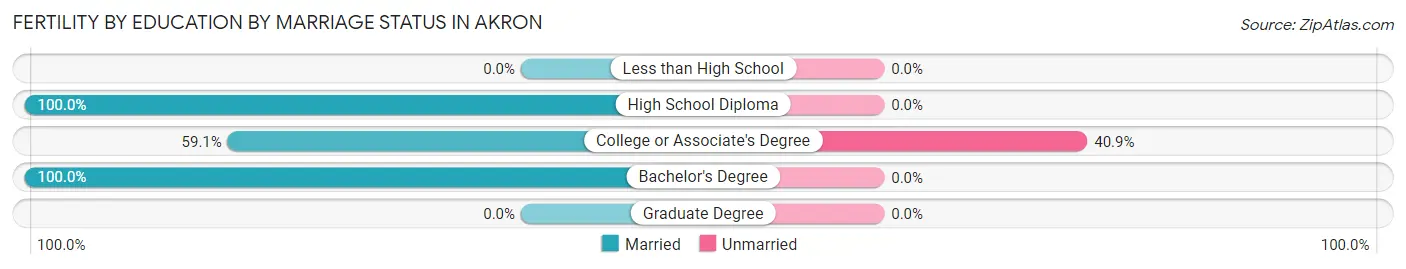
| Educational Attainment | Married | Unmarried |
| Less than High School | 0 (0.0%) | 0 (0.0%) |
| High School Diploma | 2 (100.0%) | 0 (0.0%) |
| College or Associate's Degree | 13 (59.1%) | 9 (40.9%) |
| Bachelor's Degree | 3 (100.0%) | 0 (0.0%) |
| Graduate Degree | 0 (0.0%) | 0 (0.0%) |
| Total | 18 (66.7%) | 9 (33.3%) |
Income in Akron
Income Overview in Akron
Per Capita Income in Akron is $34,359, while median incomes of families and households are $59,141 and $52,813 respectively.
| Characteristic | Number | Measure |
| Per Capita Income | 1,675 | $34,359 |
| Median Family Income | 451 | $59,141 |
| Mean Family Income | 451 | $86,004 |
| Median Household Income | 762 | $52,813 |
| Mean Household Income | 762 | $71,106 |
| Income Deficit | 451 | $6,822 |
| Wage / Income Gap (%) | 1,675 | 30.42% |
| Wage / Income Gap ($) | 1,675 | 69.58¢ per $1 |
| Gini / Inequality Index | 1,675 | 0.46 |
Earnings by Sex in Akron
Average Earnings in Akron are $35,000, $40,313 for men and $28,050 for women, a difference of 30.4%.
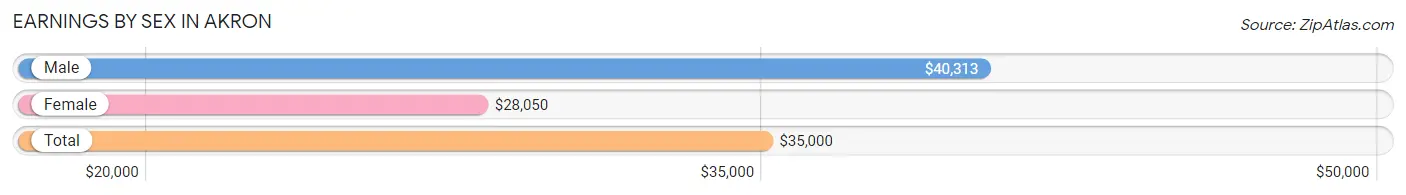
| Sex | Number | Average Earnings |
| Male | 487 (52.5%) | $40,313 |
| Female | 441 (47.5%) | $28,050 |
| Total | 928 (100.0%) | $35,000 |
Earnings by Sex by Income Bracket in Akron
The most common earnings brackets in Akron are $100,000+ for men (59 | 12.1%) and $15,000 to $17,499 for women (63 | 14.3%).
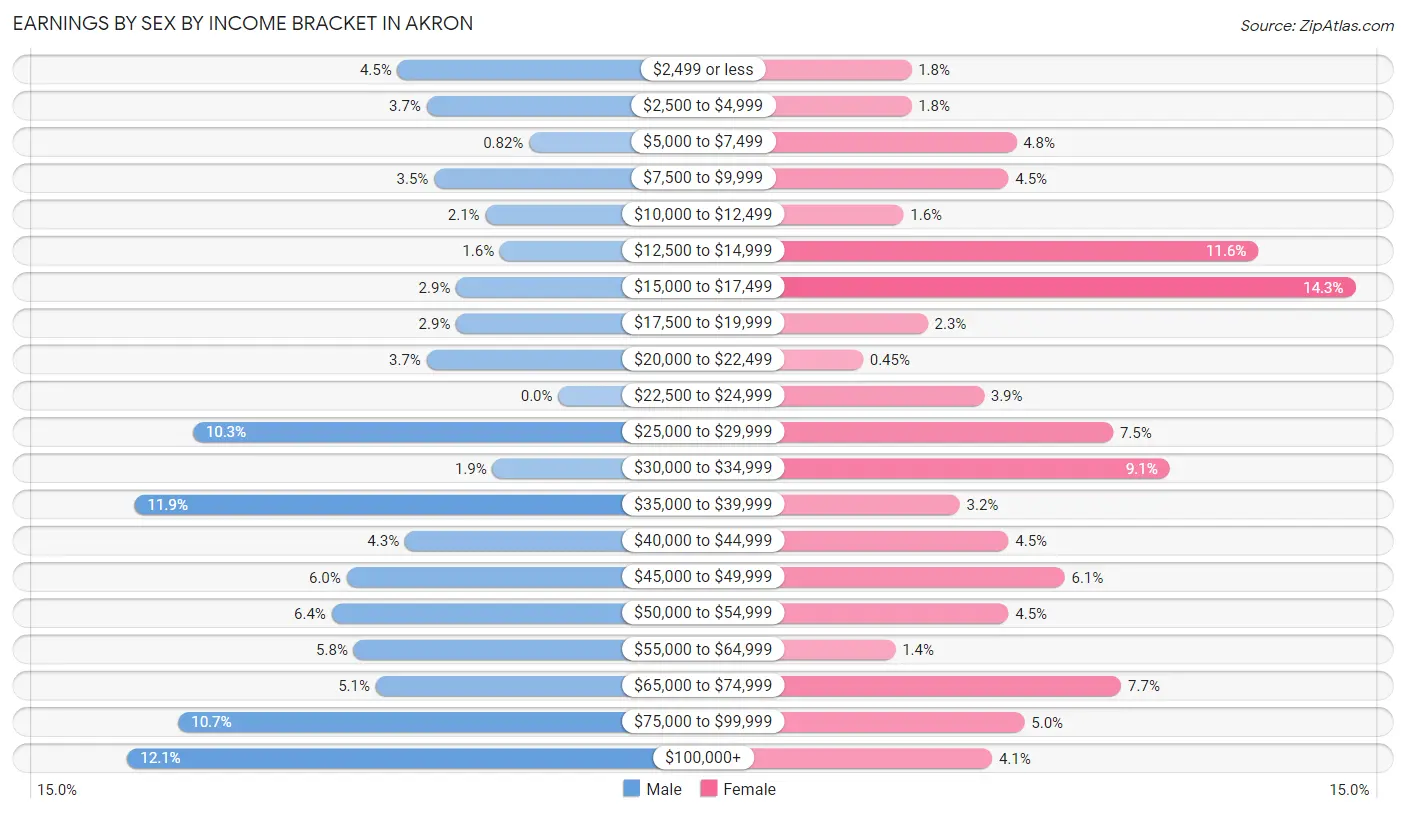
| Income | Male | Female |
| $2,499 or less | 22 (4.5%) | 8 (1.8%) |
| $2,500 to $4,999 | 18 (3.7%) | 8 (1.8%) |
| $5,000 to $7,499 | 4 (0.8%) | 21 (4.8%) |
| $7,500 to $9,999 | 17 (3.5%) | 20 (4.5%) |
| $10,000 to $12,499 | 10 (2.1%) | 7 (1.6%) |
| $12,500 to $14,999 | 8 (1.6%) | 51 (11.6%) |
| $15,000 to $17,499 | 14 (2.9%) | 63 (14.3%) |
| $17,500 to $19,999 | 14 (2.9%) | 10 (2.3%) |
| $20,000 to $22,499 | 18 (3.7%) | 2 (0.4%) |
| $22,500 to $24,999 | 0 (0.0%) | 17 (3.8%) |
| $25,000 to $29,999 | 50 (10.3%) | 33 (7.5%) |
| $30,000 to $34,999 | 9 (1.8%) | 40 (9.1%) |
| $35,000 to $39,999 | 58 (11.9%) | 14 (3.2%) |
| $40,000 to $44,999 | 21 (4.3%) | 20 (4.5%) |
| $45,000 to $49,999 | 29 (5.9%) | 27 (6.1%) |
| $50,000 to $54,999 | 31 (6.4%) | 20 (4.5%) |
| $55,000 to $64,999 | 28 (5.8%) | 6 (1.4%) |
| $65,000 to $74,999 | 25 (5.1%) | 34 (7.7%) |
| $75,000 to $99,999 | 52 (10.7%) | 22 (5.0%) |
| $100,000+ | 59 (12.1%) | 18 (4.1%) |
| Total | 487 (100.0%) | 441 (100.0%) |
Earnings by Sex by Educational Attainment in Akron
Average earnings in Akron are $47,500 for men and $31,875 for women, a difference of 32.9%. Men with an educational attainment of bachelor's degree enjoy the highest average annual earnings of $91,500, while those with less than high school education earn the least with $31,528. Women with an educational attainment of graduate degree earn the most with the average annual earnings of $48,750, while those with high school diploma education have the smallest earnings of $23,906.
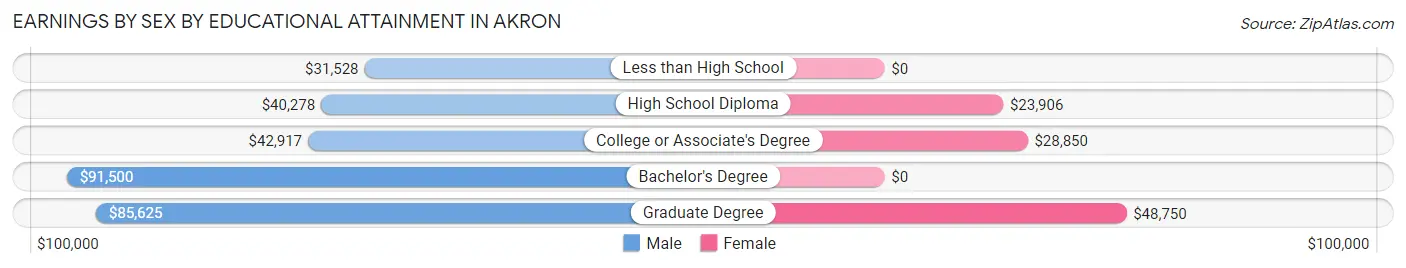
| Educational Attainment | Male Income | Female Income |
| Less than High School | $31,528 | $0 |
| High School Diploma | $40,278 | $23,906 |
| College or Associate's Degree | $42,917 | $28,850 |
| Bachelor's Degree | $91,500 | $0 |
| Graduate Degree | $85,625 | $48,750 |
| Total | $47,500 | $31,875 |
Family Income in Akron
Family Income Brackets in Akron
According to the Akron family income data, there are 120 families falling into the $50,000 to $74,999 income range, which is the most common income bracket and makes up 26.6% of all families. Conversely, the $10,000 to $14,999 income bracket is the least frequent group with only 3 families (0.7%) belonging to this category.
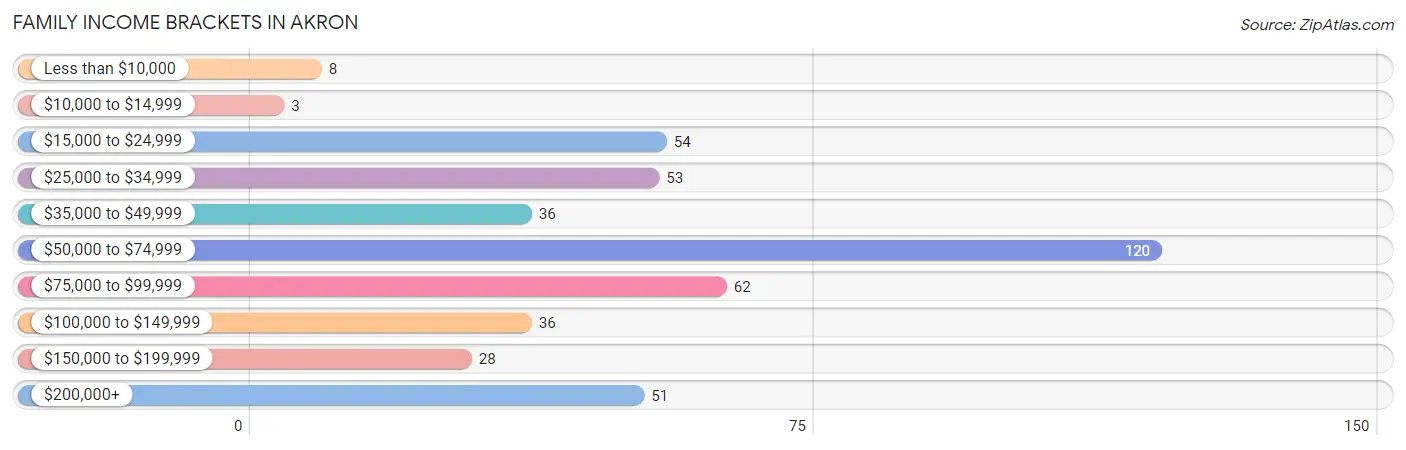
| Income Bracket | # Families | % Families |
| Less than $10,000 | 8 | 1.8% |
| $10,000 to $14,999 | 3 | 0.7% |
| $15,000 to $24,999 | 54 | 12.0% |
| $25,000 to $34,999 | 53 | 11.8% |
| $35,000 to $49,999 | 36 | 8.0% |
| $50,000 to $74,999 | 120 | 26.6% |
| $75,000 to $99,999 | 62 | 13.7% |
| $100,000 to $149,999 | 36 | 8.0% |
| $150,000 to $199,999 | 28 | 6.2% |
| $200,000+ | 51 | 11.3% |
Family Income by Famaliy Size in Akron
3-person families (58 | 12.9%) account for the highest median family income in Akron with $151,250 per family, while 3-person families (58 | 12.9%) have the highest median income of $50,417 per family member.
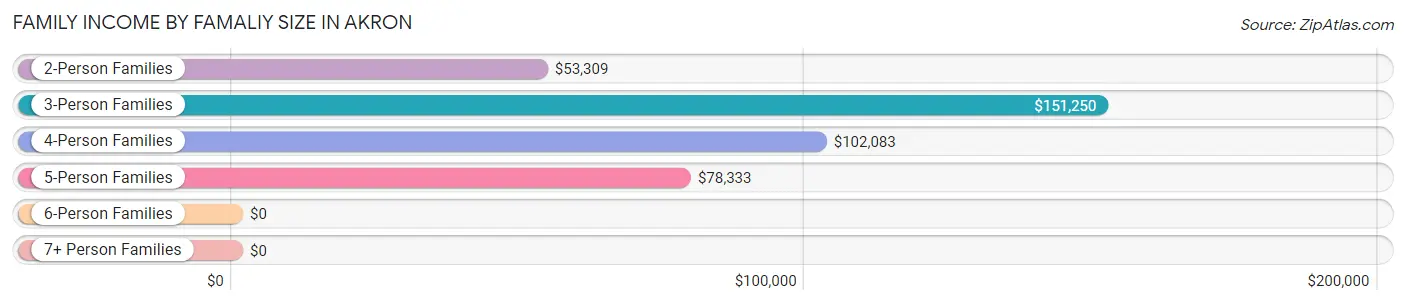
| Income Bracket | # Families | Median Income |
| 2-Person Families | 299 (66.3%) | $53,309 |
| 3-Person Families | 58 (12.9%) | $151,250 |
| 4-Person Families | 66 (14.6%) | $102,083 |
| 5-Person Families | 22 (4.9%) | $78,333 |
| 6-Person Families | 1 (0.2%) | $0 |
| 7+ Person Families | 5 (1.1%) | $0 |
| Total | 451 (100.0%) | $59,141 |
Family Income by Number of Earners in Akron
The median family income in Akron is $59,141, with families comprising 3+ earners (16) having the highest median family income of $250,001, while families with no earners (34) have the lowest median family income of $41,000, accounting for 3.5% and 7.5% of families, respectively.
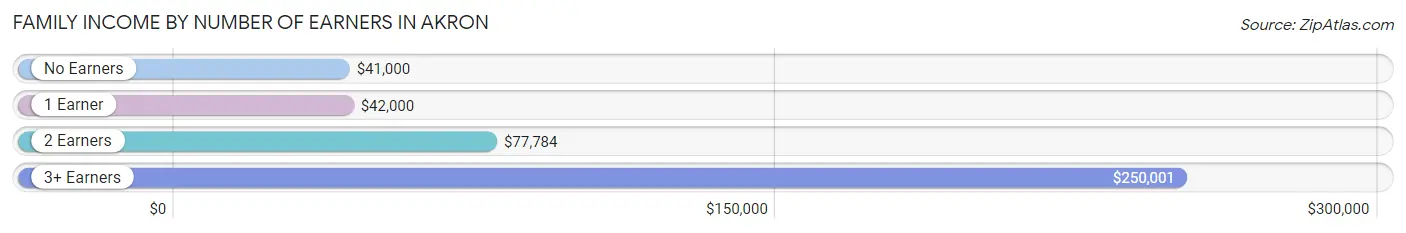
| Number of Earners | # Families | Median Income |
| No Earners | 34 (7.5%) | $41,000 |
| 1 Earner | 138 (30.6%) | $42,000 |
| 2 Earners | 263 (58.3%) | $77,784 |
| 3+ Earners | 16 (3.5%) | $250,001 |
| Total | 451 (100.0%) | $59,141 |
Household Income in Akron
Household Income Brackets in Akron
With 179 households falling in the category, the $50,000 to $74,999 income range is the most frequent in Akron, accounting for 23.5% of all households. In contrast, only 25 households (3.3%) fall into the $10,000 to $14,999 income bracket, making it the least populous group.
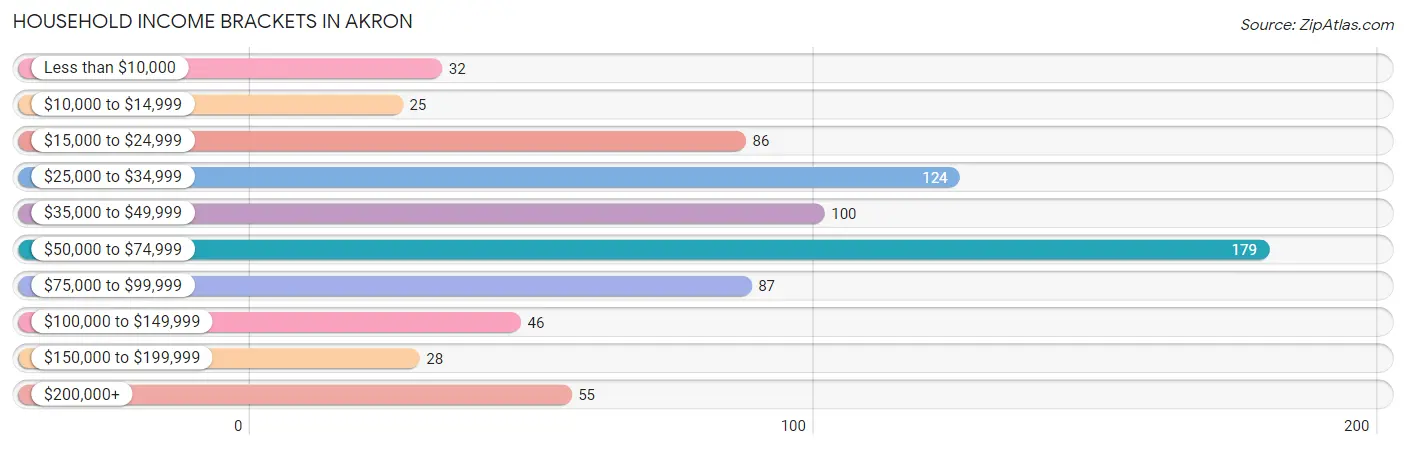
| Income Bracket | # Households | % Households |
| Less than $10,000 | 32 | 4.2% |
| $10,000 to $14,999 | 25 | 3.3% |
| $15,000 to $24,999 | 86 | 11.3% |
| $25,000 to $34,999 | 124 | 16.3% |
| $35,000 to $49,999 | 100 | 13.1% |
| $50,000 to $74,999 | 179 | 23.5% |
| $75,000 to $99,999 | 87 | 11.4% |
| $100,000 to $149,999 | 46 | 6.0% |
| $150,000 to $199,999 | 28 | 3.7% |
| $200,000+ | 55 | 7.2% |
Household Income by Householder Age in Akron
The median household income in Akron is $52,813, with the highest median household income of $79,167 found in the 25 to 44 years age bracket for the primary householder. A total of 168 households (22.1%) fall into this category. Meanwhile, the 15 to 24 years age bracket for the primary householder has the lowest median household income of $0, with 116 households (15.2%) in this group.
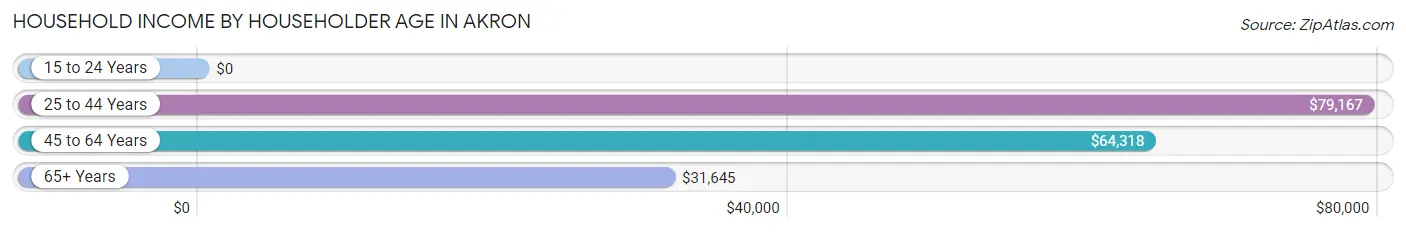
| Income Bracket | # Households | Median Income |
| 15 to 24 Years | 116 (15.2%) | $0 |
| 25 to 44 Years | 168 (22.1%) | $79,167 |
| 45 to 64 Years | 226 (29.7%) | $64,318 |
| 65+ Years | 252 (33.1%) | $31,645 |
| Total | 762 (100.0%) | $52,813 |
Poverty in Akron
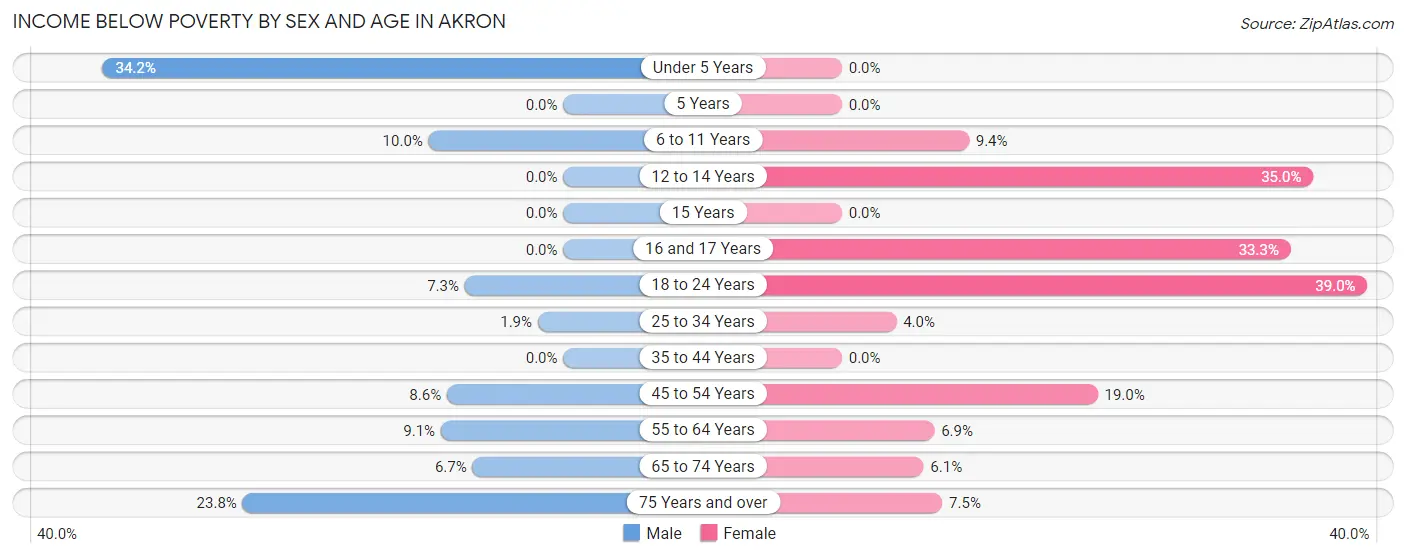
Income Below Poverty by Sex and Age in Akron
With 8.7% poverty level for males and 11.2% for females among the residents of Akron, under 5 year old males and 18 to 24 year old females are the most vulnerable to poverty, with 13 males (34.2%) and 32 females (39.0%) in their respective age groups living below the poverty level.
| Age Bracket | Male | Female |
| Under 5 Years | 13 (34.2%) | 0 (0.0%) |
| 5 Years | 0 (0.0%) | 0 (0.0%) |
| 6 to 11 Years | 6 (10.0%) | 5 (9.4%) |
| 12 to 14 Years | 0 (0.0%) | 7 (35.0%) |
| 15 Years | 0 (0.0%) | 0 (0.0%) |
| 16 and 17 Years | 0 (0.0%) | 2 (33.3%) |
| 18 to 24 Years | 6 (7.3%) | 32 (39.0%) |
| 25 to 34 Years | 1 (1.9%) | 4 (4.0%) |
| 35 to 44 Years | 0 (0.0%) | 0 (0.0%) |
| 45 to 54 Years | 7 (8.6%) | 15 (19.0%) |
| 55 to 64 Years | 7 (9.1%) | 7 (6.9%) |
| 65 to 74 Years | 6 (6.7%) | 6 (6.1%) |
| 75 Years and over | 15 (23.8%) | 7 (7.4%) |
| Total | 61 (8.7%) | 85 (11.2%) |
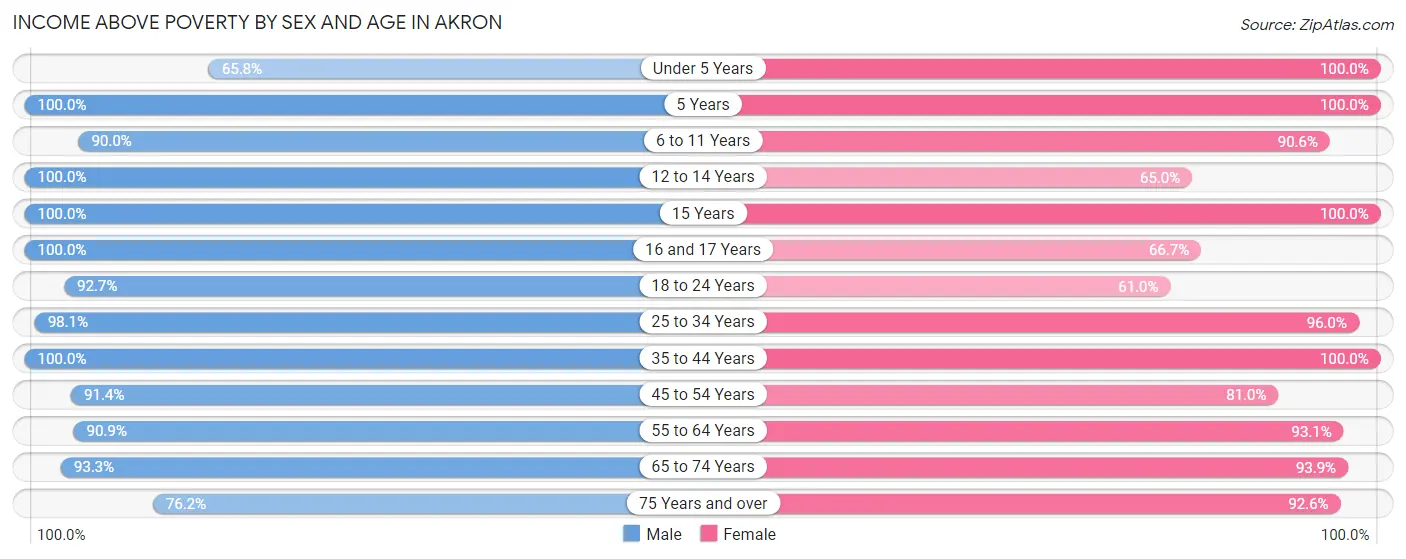
Income Above Poverty by Sex and Age in Akron
According to the poverty statistics in Akron, males aged 5 years and females aged under 5 years are the age groups that are most secure financially, with 100.0% of males and 100.0% of females in these age groups living above the poverty line.
| Age Bracket | Male | Female |
| Under 5 Years | 25 (65.8%) | 19 (100.0%) |
| 5 Years | 1 (100.0%) | 12 (100.0%) |
| 6 to 11 Years | 54 (90.0%) | 48 (90.6%) |
| 12 to 14 Years | 12 (100.0%) | 13 (65.0%) |
| 15 Years | 10 (100.0%) | 11 (100.0%) |
| 16 and 17 Years | 13 (100.0%) | 4 (66.7%) |
| 18 to 24 Years | 76 (92.7%) | 50 (61.0%) |
| 25 to 34 Years | 52 (98.1%) | 95 (96.0%) |
| 35 to 44 Years | 122 (100.0%) | 85 (100.0%) |
| 45 to 54 Years | 74 (91.4%) | 64 (81.0%) |
| 55 to 64 Years | 70 (90.9%) | 95 (93.1%) |
| 65 to 74 Years | 83 (93.3%) | 93 (93.9%) |
| 75 Years and over | 48 (76.2%) | 87 (92.5%) |
| Total | 640 (91.3%) | 676 (88.8%) |
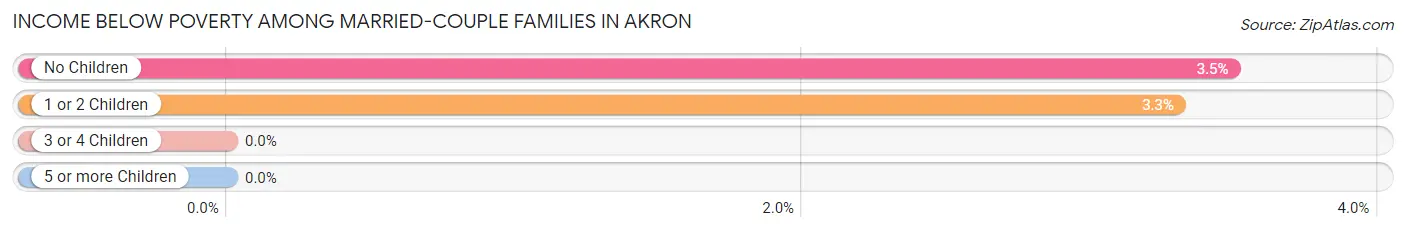
Income Below Poverty Among Married-Couple Families in Akron
The poverty statistics for married-couple families in Akron show that 3.2% or 11 of the total 340 families live below the poverty line. Families with no children have the highest poverty rate of 3.5%, comprising of 8 families. On the other hand, families with 3 or 4 children have the lowest poverty rate of 0.0%, which includes 0 families.
| Children | Above Poverty | Below Poverty |
| No Children | 221 (96.5%) | 8 (3.5%) |
| 1 or 2 Children | 88 (96.7%) | 3 (3.3%) |
| 3 or 4 Children | 15 (100.0%) | 0 (0.0%) |
| 5 or more Children | 5 (100.0%) | 0 (0.0%) |
| Total | 329 (96.8%) | 11 (3.2%) |
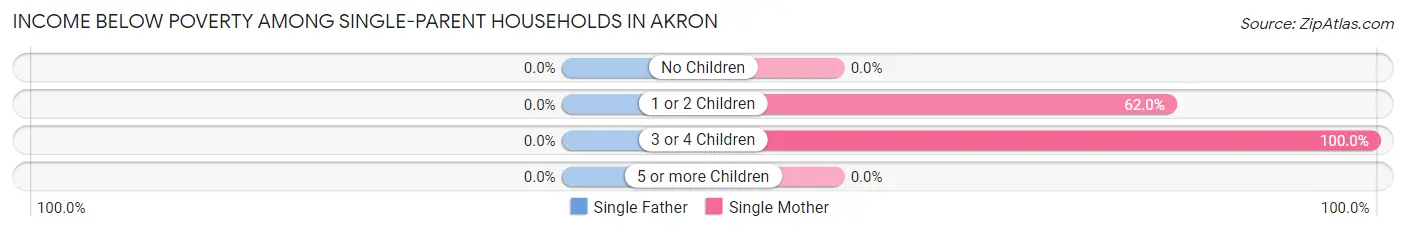
Income Below Poverty Among Single-Parent Households in Akron
| Children | Single Father | Single Mother |
| No Children | 0 (0.0%) | 0 (0.0%) |
| 1 or 2 Children | 0 (0.0%) | 31 (62.0%) |
| 3 or 4 Children | 0 (0.0%) | 3 (100.0%) |
| 5 or more Children | 0 (0.0%) | 0 (0.0%) |
| Total | 0 (0.0%) | 34 (48.6%) |
Income Below Poverty Among Married-Couple vs Single-Parent Households in Akron
The poverty data for Akron shows that 11 of the married-couple family households (3.2%) and 34 of the single-parent households (30.6%) are living below the poverty level. Within the married-couple family households, those with no children have the highest poverty rate, with 8 households (3.5%) falling below the poverty line. Among the single-parent households, those with 3 or 4 children have the highest poverty rate, with 3 household (100.0%) living below poverty.
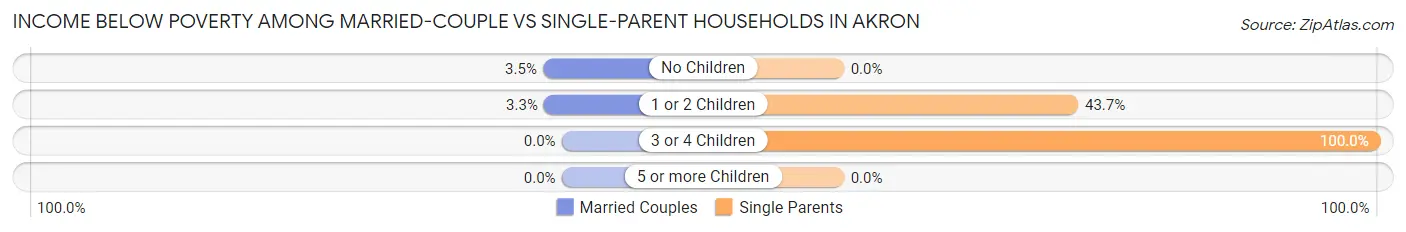
| Children | Married-Couple Families | Single-Parent Households |
| No Children | 8 (3.5%) | 0 (0.0%) |
| 1 or 2 Children | 3 (3.3%) | 31 (43.7%) |
| 3 or 4 Children | 0 (0.0%) | 3 (100.0%) |
| 5 or more Children | 0 (0.0%) | 0 (0.0%) |
| Total | 11 (3.2%) | 34 (30.6%) |
Employment Characteristics in Akron
Employment by Class of Employer in Akron
Among the 788 employed individuals in Akron, private company employees (353 | 44.8%), local government employees (208 | 26.4%), and state government employees (76 | 9.6%) make up the most common classes of employment.
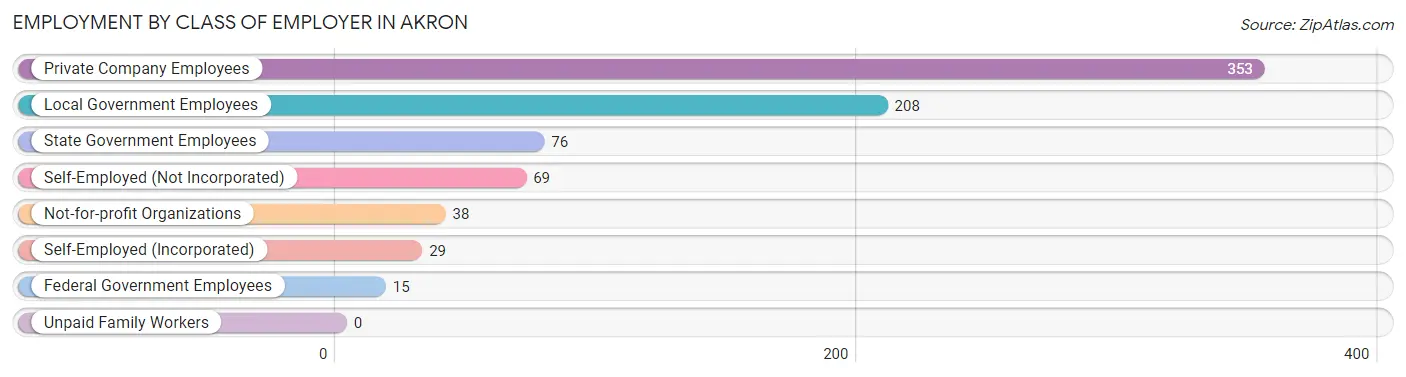
| Employer Class | # Employees | % Employees |
| Private Company Employees | 353 | 44.8% |
| Self-Employed (Incorporated) | 29 | 3.7% |
| Self-Employed (Not Incorporated) | 69 | 8.8% |
| Not-for-profit Organizations | 38 | 4.8% |
| Local Government Employees | 208 | 26.4% |
| State Government Employees | 76 | 9.6% |
| Federal Government Employees | 15 | 1.9% |
| Unpaid Family Workers | 0 | 0.0% |
| Total | 788 | 100.0% |
Employment Status by Age in Akron
According to the labor force statistics for Akron, out of the total population over 16 years of age (1,439), 56.4% or 812 individuals are in the labor force, with 2.1% or 17 of them unemployed. The age group with the highest labor force participation rate is 45 to 54 years, with 91.9% or 147 individuals in the labor force. Within the labor force, the 55 to 59 years age range has the highest percentage of unemployed individuals, with 7.5% or 4 of them being unemployed.
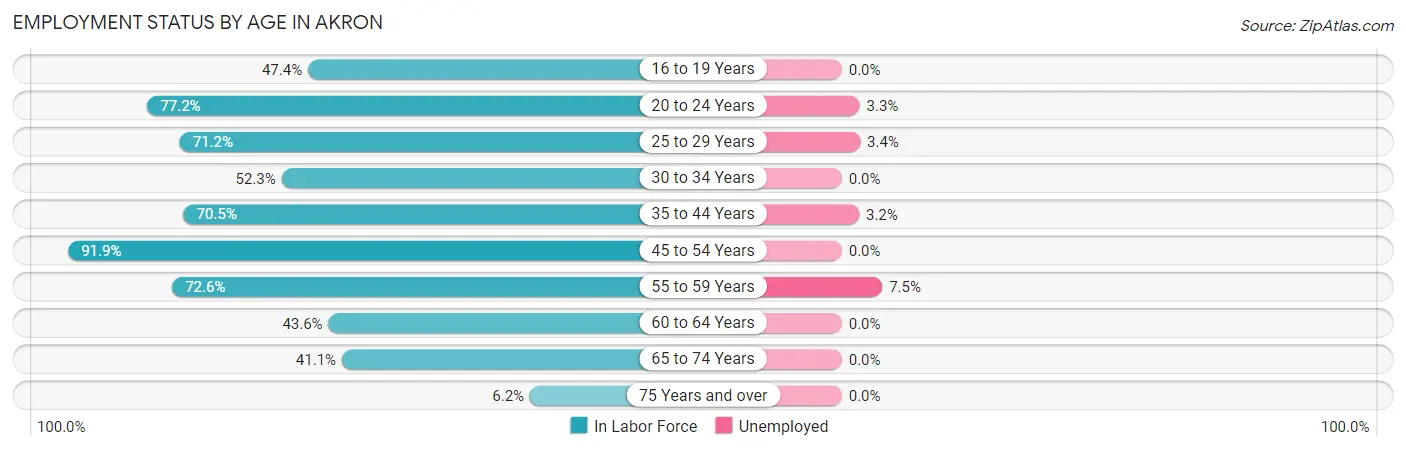
| Age Bracket | In Labor Force | Unemployed |
| 16 to 19 Years | 27 (47.4%) | 0 (0.0%) |
| 20 to 24 Years | 122 (77.2%) | 4 (3.3%) |
| 25 to 29 Years | 89 (71.2%) | 3 (3.4%) |
| 30 to 34 Years | 45 (52.3%) | 0 (0.0%) |
| 35 to 44 Years | 186 (70.5%) | 6 (3.2%) |
| 45 to 54 Years | 147 (91.9%) | 0 (0.0%) |
| 55 to 59 Years | 53 (72.6%) | 4 (7.5%) |
| 60 to 64 Years | 51 (43.6%) | 0 (0.0%) |
| 65 to 74 Years | 78 (41.1%) | 0 (0.0%) |
| 75 Years and over | 13 (6.2%) | 0 (0.0%) |
| Total | 812 (56.4%) | 17 (2.1%) |
Employment Status by Educational Attainment in Akron
According to labor force statistics for Akron, 69.2% of individuals (571) out of the total population between 25 and 64 years of age (825) are in the labor force, with 2.3% or 13 of them being unemployed. The group with the highest labor force participation rate are those with the educational attainment of bachelor's degree or higher, with 89.1% or 172 individuals in the labor force. Within the labor force, individuals with college / associate degree education have the highest percentage of unemployment, with 4.2% or 10 of them being unemployed.
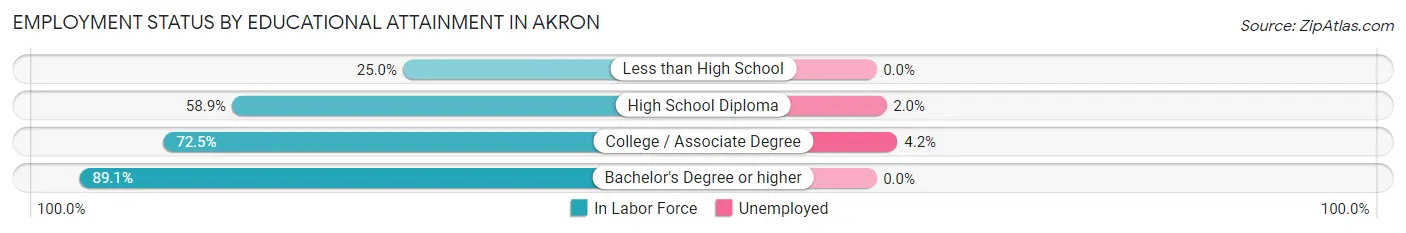
| Educational Attainment | In Labor Force | Unemployed |
| Less than High School | 13 (25.0%) | 0 (0.0%) |
| High School Diploma | 149 (58.9%) | 5 (2.0%) |
| College / Associate Degree | 237 (72.5%) | 14 (4.2%) |
| Bachelor's Degree or higher | 172 (89.1%) | 0 (0.0%) |
| Total | 571 (69.2%) | 19 (2.3%) |
Employment Occupations by Sex in Akron
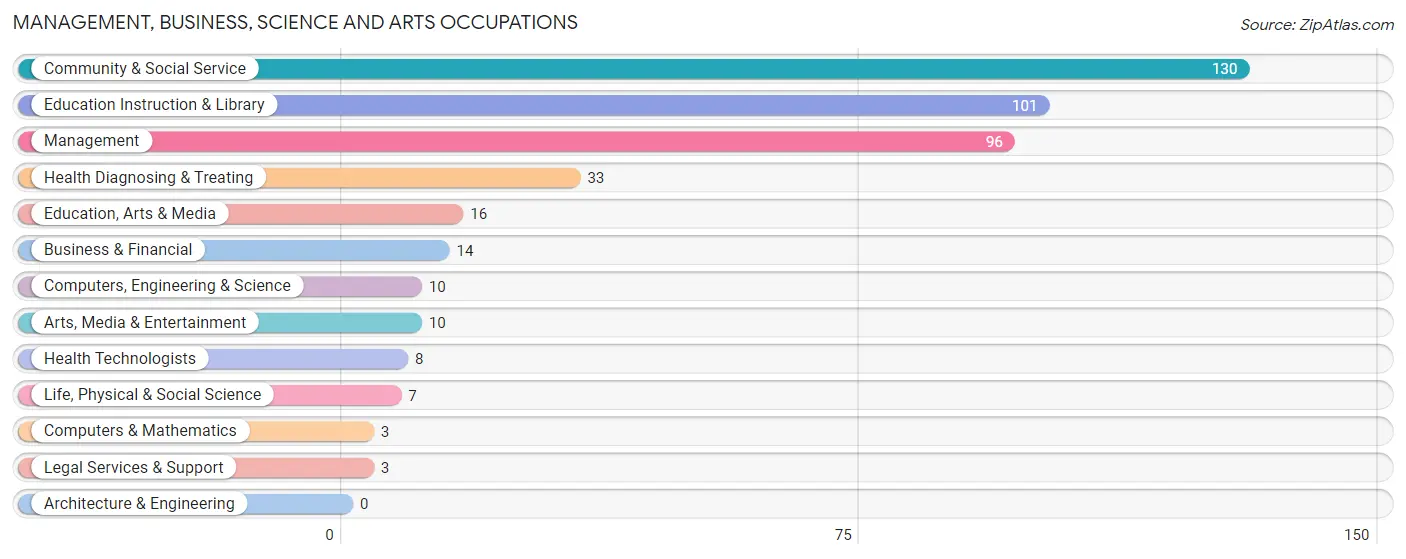
Management, Business, Science and Arts Occupations
The most common Management, Business, Science and Arts occupations in Akron are Community & Social Service (130 | 16.4%), Education Instruction & Library (101 | 12.7%), Management (96 | 12.1%), Health Diagnosing & Treating (33 | 4.2%), and Education, Arts & Media (16 | 2.0%).
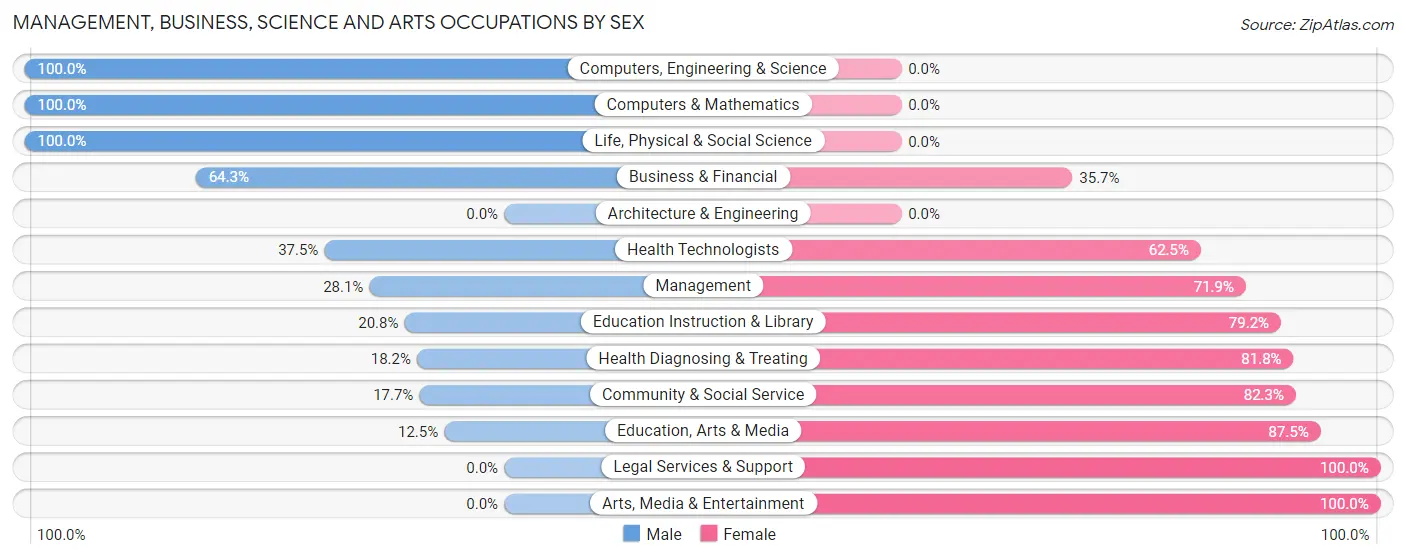
Management, Business, Science and Arts Occupations by Sex
Within the Management, Business, Science and Arts occupations in Akron, the most male-oriented occupations are Computers, Engineering & Science (100.0%), Computers & Mathematics (100.0%), and Life, Physical & Social Science (100.0%), while the most female-oriented occupations are Legal Services & Support (100.0%), Arts, Media & Entertainment (100.0%), and Education, Arts & Media (87.5%).
| Occupation | Male | Female |
| Management | 27 (28.1%) | 69 (71.9%) |
| Business & Financial | 9 (64.3%) | 5 (35.7%) |
| Computers, Engineering & Science | 10 (100.0%) | 0 (0.0%) |
| Computers & Mathematics | 3 (100.0%) | 0 (0.0%) |
| Architecture & Engineering | 0 (0.0%) | 0 (0.0%) |
| Life, Physical & Social Science | 7 (100.0%) | 0 (0.0%) |
| Community & Social Service | 23 (17.7%) | 107 (82.3%) |
| Education, Arts & Media | 2 (12.5%) | 14 (87.5%) |
| Legal Services & Support | 0 (0.0%) | 3 (100.0%) |
| Education Instruction & Library | 21 (20.8%) | 80 (79.2%) |
| Arts, Media & Entertainment | 0 (0.0%) | 10 (100.0%) |
| Health Diagnosing & Treating | 6 (18.2%) | 27 (81.8%) |
| Health Technologists | 3 (37.5%) | 5 (62.5%) |
| Total (Category) | 75 (26.5%) | 208 (73.5%) |
| Total (Overall) | 388 (48.9%) | 406 (51.1%) |
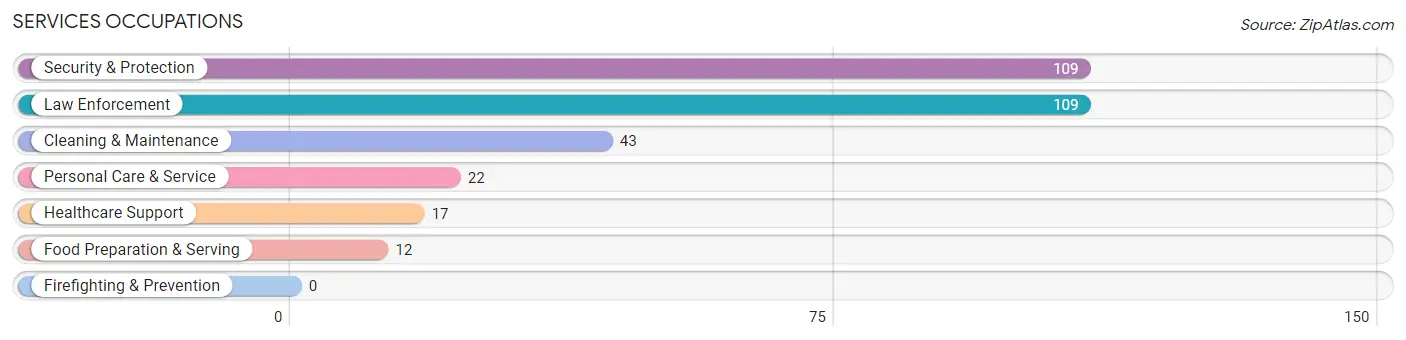
Services Occupations
The most common Services occupations in Akron are Security & Protection (109 | 13.7%), Law Enforcement (109 | 13.7%), Cleaning & Maintenance (43 | 5.4%), Personal Care & Service (22 | 2.8%), and Healthcare Support (17 | 2.1%).
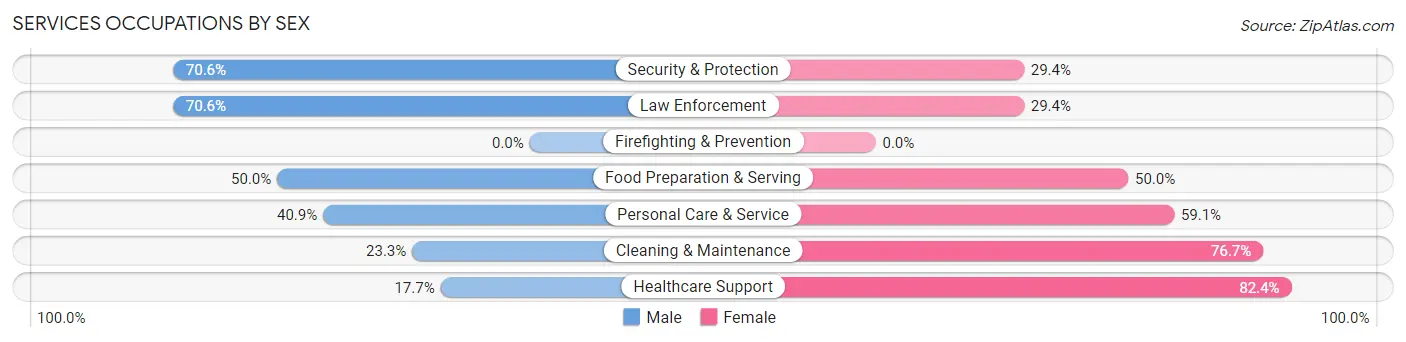
Services Occupations by Sex
Within the Services occupations in Akron, the most male-oriented occupations are Security & Protection (70.6%), Law Enforcement (70.6%), and Food Preparation & Serving (50.0%), while the most female-oriented occupations are Healthcare Support (82.4%), Cleaning & Maintenance (76.7%), and Personal Care & Service (59.1%).
| Occupation | Male | Female |
| Healthcare Support | 3 (17.6%) | 14 (82.4%) |
| Security & Protection | 77 (70.6%) | 32 (29.4%) |
| Firefighting & Prevention | 0 (0.0%) | 0 (0.0%) |
| Law Enforcement | 77 (70.6%) | 32 (29.4%) |
| Food Preparation & Serving | 6 (50.0%) | 6 (50.0%) |
| Cleaning & Maintenance | 10 (23.3%) | 33 (76.7%) |
| Personal Care & Service | 9 (40.9%) | 13 (59.1%) |
| Total (Category) | 105 (51.7%) | 98 (48.3%) |
| Total (Overall) | 388 (48.9%) | 406 (51.1%) |
Sales and Office Occupations
The most common Sales and Office occupations in Akron are Office & Administration (80 | 10.1%), and Sales & Related (58 | 7.3%).
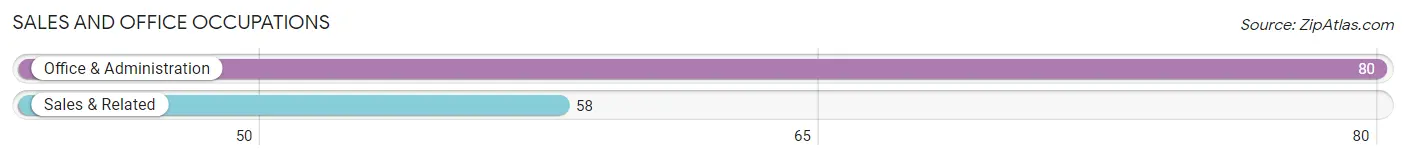
Sales and Office Occupations by Sex

| Occupation | Male | Female |
| Sales & Related | 52 (89.7%) | 6 (10.3%) |
| Office & Administration | 4 (5.0%) | 76 (95.0%) |
| Total (Category) | 56 (40.6%) | 82 (59.4%) |
| Total (Overall) | 388 (48.9%) | 406 (51.1%) |
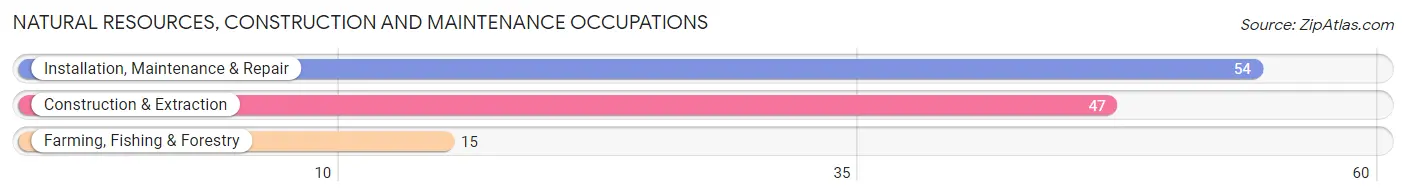
Natural Resources, Construction and Maintenance Occupations
The most common Natural Resources, Construction and Maintenance occupations in Akron are Installation, Maintenance & Repair (54 | 6.8%), Construction & Extraction (47 | 5.9%), and Farming, Fishing & Forestry (15 | 1.9%).
Natural Resources, Construction and Maintenance Occupations by Sex
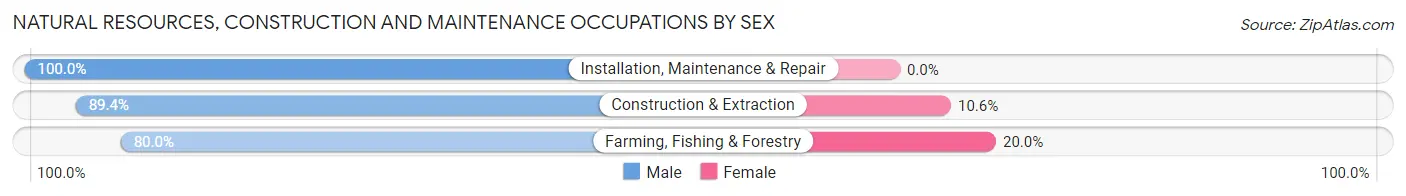
| Occupation | Male | Female |
| Farming, Fishing & Forestry | 12 (80.0%) | 3 (20.0%) |
| Construction & Extraction | 42 (89.4%) | 5 (10.6%) |
| Installation, Maintenance & Repair | 54 (100.0%) | 0 (0.0%) |
| Total (Category) | 108 (93.1%) | 8 (6.9%) |
| Total (Overall) | 388 (48.9%) | 406 (51.1%) |
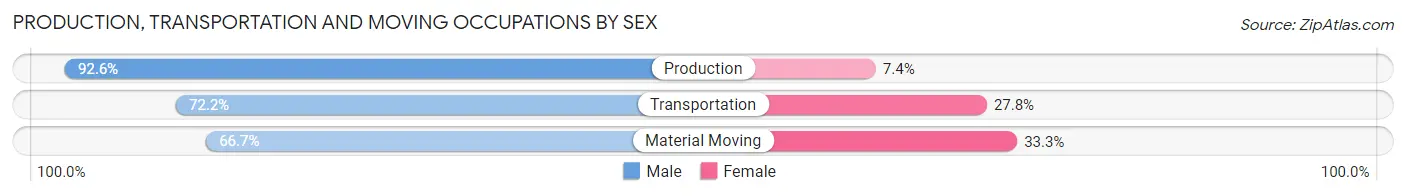
Production, Transportation and Moving Occupations
The most common Production, Transportation and Moving occupations in Akron are Production (27 | 3.4%), Transportation (18 | 2.3%), and Material Moving (9 | 1.1%).
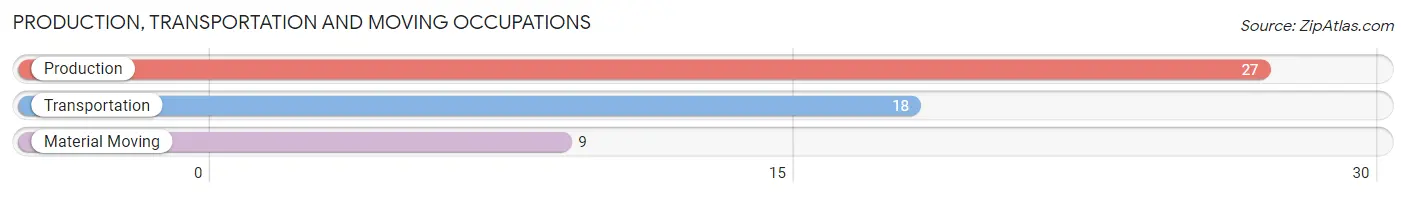
Production, Transportation and Moving Occupations by Sex
| Occupation | Male | Female |
| Production | 25 (92.6%) | 2 (7.4%) |
| Transportation | 13 (72.2%) | 5 (27.8%) |
| Material Moving | 6 (66.7%) | 3 (33.3%) |
| Total (Category) | 44 (81.5%) | 10 (18.5%) |
| Total (Overall) | 388 (48.9%) | 406 (51.1%) |
Employment Industries by Sex in Akron
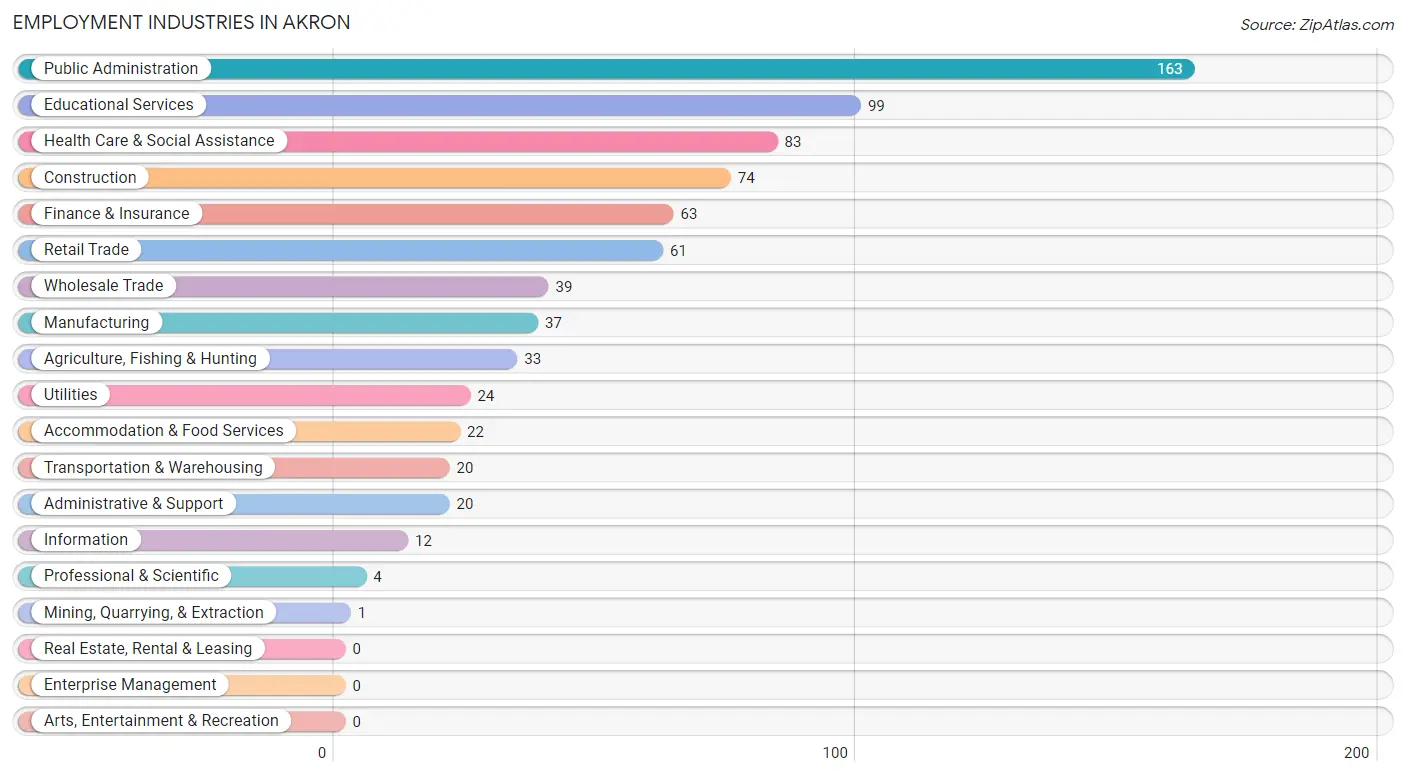
Employment Industries in Akron
The major employment industries in Akron include Public Administration (163 | 20.5%), Educational Services (99 | 12.5%), Health Care & Social Assistance (83 | 10.4%), Construction (74 | 9.3%), and Finance & Insurance (63 | 7.9%).
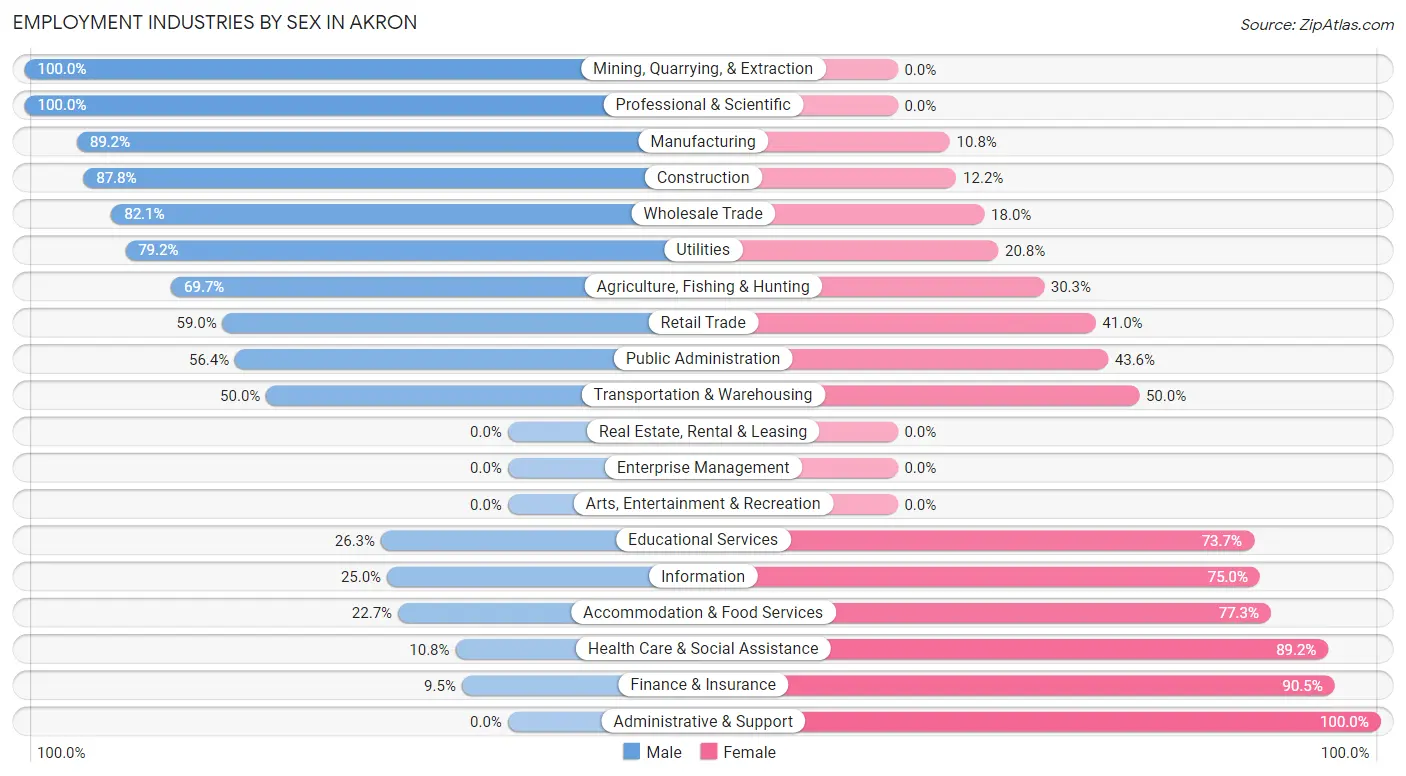
Employment Industries by Sex in Akron
The Akron industries that see more men than women are Mining, Quarrying, & Extraction (100.0%), Professional & Scientific (100.0%), and Manufacturing (89.2%), whereas the industries that tend to have a higher number of women are Administrative & Support (100.0%), Finance & Insurance (90.5%), and Health Care & Social Assistance (89.2%).
| Industry | Male | Female |
| Agriculture, Fishing & Hunting | 23 (69.7%) | 10 (30.3%) |
| Mining, Quarrying, & Extraction | 1 (100.0%) | 0 (0.0%) |
| Construction | 65 (87.8%) | 9 (12.2%) |
| Manufacturing | 33 (89.2%) | 4 (10.8%) |
| Wholesale Trade | 32 (82.1%) | 7 (17.9%) |
| Retail Trade | 36 (59.0%) | 25 (41.0%) |
| Transportation & Warehousing | 10 (50.0%) | 10 (50.0%) |
| Utilities | 19 (79.2%) | 5 (20.8%) |
| Information | 3 (25.0%) | 9 (75.0%) |
| Finance & Insurance | 6 (9.5%) | 57 (90.5%) |
| Real Estate, Rental & Leasing | 0 (0.0%) | 0 (0.0%) |
| Professional & Scientific | 4 (100.0%) | 0 (0.0%) |
| Enterprise Management | 0 (0.0%) | 0 (0.0%) |
| Administrative & Support | 0 (0.0%) | 20 (100.0%) |
| Educational Services | 26 (26.3%) | 73 (73.7%) |
| Health Care & Social Assistance | 9 (10.8%) | 74 (89.2%) |
| Arts, Entertainment & Recreation | 0 (0.0%) | 0 (0.0%) |
| Accommodation & Food Services | 5 (22.7%) | 17 (77.3%) |
| Public Administration | 92 (56.4%) | 71 (43.6%) |
| Total | 388 (48.9%) | 406 (51.1%) |
Education in Akron
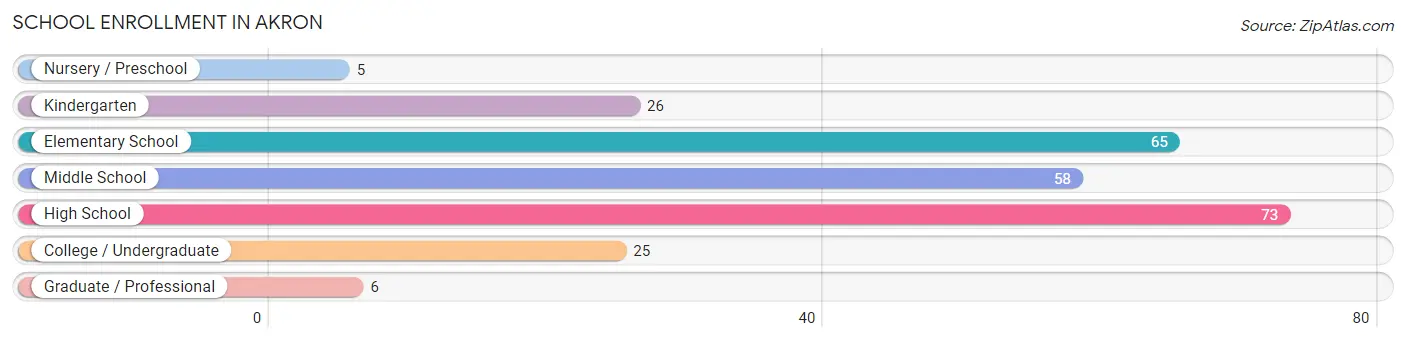
School Enrollment in Akron
The most common levels of schooling among the 258 students in Akron are high school (73 | 28.3%), elementary school (65 | 25.2%), and middle school (58 | 22.5%).
| School Level | # Students | % Students |
| Nursery / Preschool | 5 | 1.9% |
| Kindergarten | 26 | 10.1% |
| Elementary School | 65 | 25.2% |
| Middle School | 58 | 22.5% |
| High School | 73 | 28.3% |
| College / Undergraduate | 25 | 9.7% |
| Graduate / Professional | 6 | 2.3% |
| Total | 258 | 100.0% |
School Enrollment by Age by Funding Source in Akron
Out of a total of 258 students who are enrolled in schools in Akron, 12 (4.7%) attend a private institution, while the remaining 246 (95.3%) are enrolled in public schools. The age group of 35 years and over has the highest likelihood of being enrolled in private schools, with 8 (26.7% in the age bracket) enrolled. Conversely, the age group of 10 to 14 year olds has the lowest likelihood of being enrolled in a private school, with 67 (100.0% in the age bracket) attending a public institution.
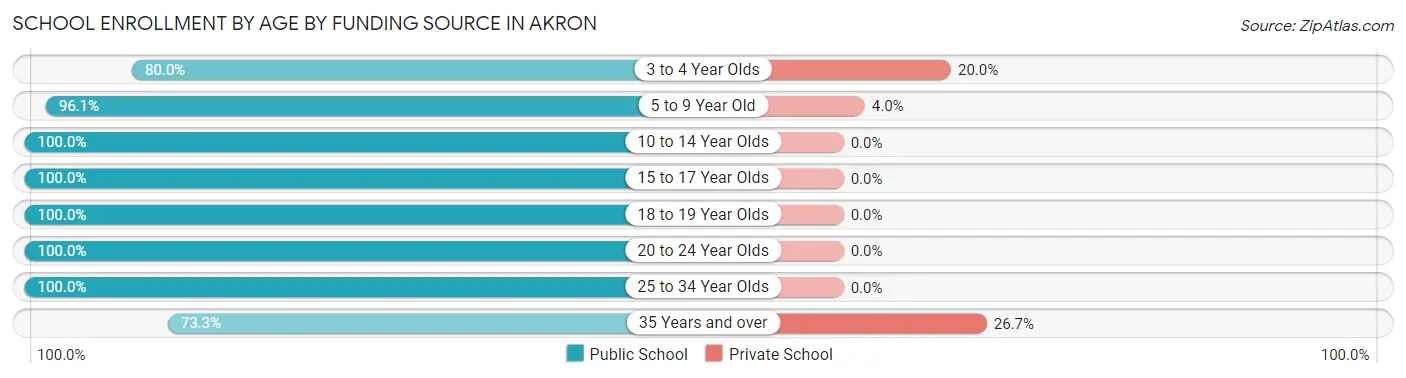
| Age Bracket | Public School | Private School |
| 3 to 4 Year Olds | 4 (80.0%) | 1 (20.0%) |
| 5 to 9 Year Old | 73 (96.1%) | 3 (4.0%) |
| 10 to 14 Year Olds | 67 (100.0%) | 0 (0.0%) |
| 15 to 17 Year Olds | 37 (100.0%) | 0 (0.0%) |
| 18 to 19 Year Olds | 25 (100.0%) | 0 (0.0%) |
| 20 to 24 Year Olds | 10 (100.0%) | 0 (0.0%) |
| 25 to 34 Year Olds | 8 (100.0%) | 0 (0.0%) |
| 35 Years and over | 22 (73.3%) | 8 (26.7%) |
| Total | 246 (95.3%) | 12 (4.7%) |
Educational Attainment by Field of Study in Akron
Education (89 | 27.8%), business (62 | 19.4%), social sciences (46 | 14.4%), bio, nature & agricultural (42 | 13.1%), and engineering (27 | 8.4%) are the most common fields of study among 320 individuals in Akron who have obtained a bachelor's degree or higher.
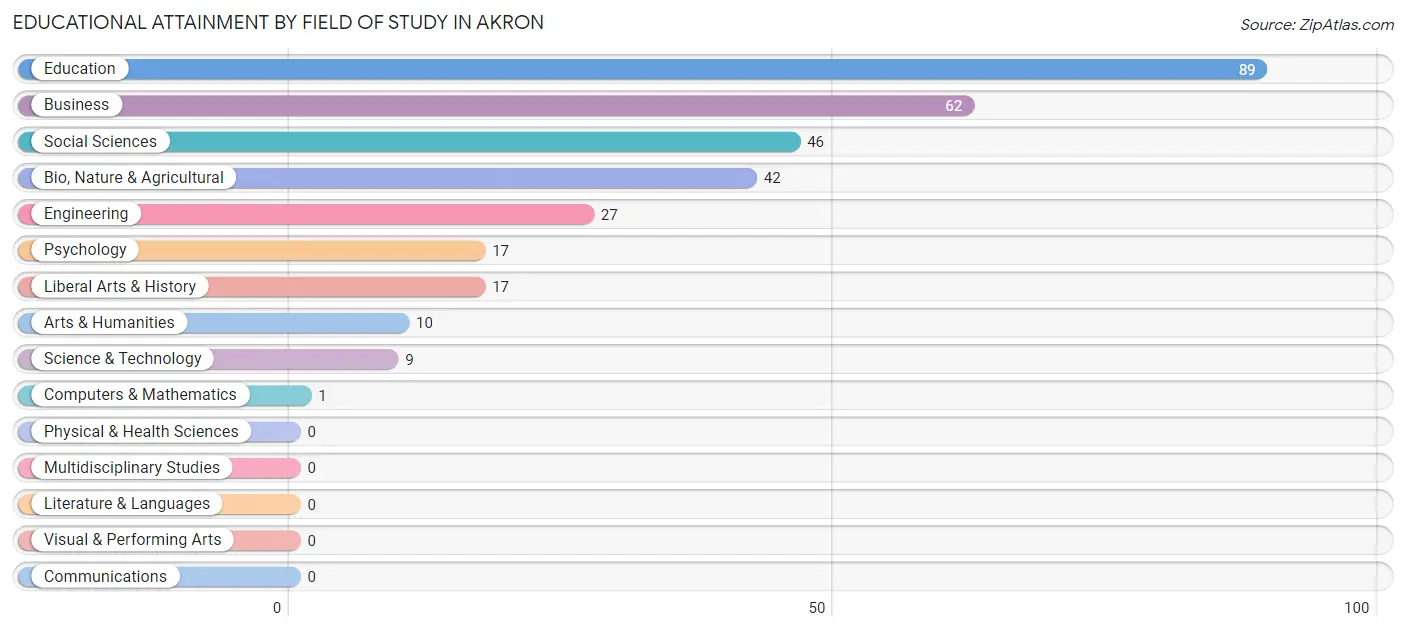
| Field of Study | # Graduates | % Graduates |
| Computers & Mathematics | 1 | 0.3% |
| Bio, Nature & Agricultural | 42 | 13.1% |
| Physical & Health Sciences | 0 | 0.0% |
| Psychology | 17 | 5.3% |
| Social Sciences | 46 | 14.4% |
| Engineering | 27 | 8.4% |
| Multidisciplinary Studies | 0 | 0.0% |
| Science & Technology | 9 | 2.8% |
| Business | 62 | 19.4% |
| Education | 89 | 27.8% |
| Literature & Languages | 0 | 0.0% |
| Liberal Arts & History | 17 | 5.3% |
| Visual & Performing Arts | 0 | 0.0% |
| Communications | 0 | 0.0% |
| Arts & Humanities | 10 | 3.1% |
| Total | 320 | 100.0% |
Transportation & Commute in Akron
Vehicle Availability by Sex in Akron
The most prevalent vehicle ownership categories in Akron are males with 2 vehicles (152, accounting for 39.2%) and females with 2 vehicles (148, making up 38.0%).
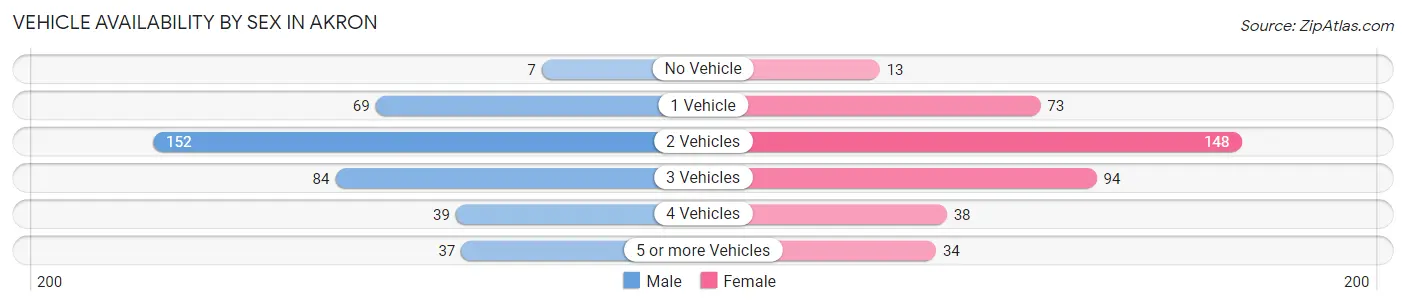
| Vehicles Available | Male | Female |
| No Vehicle | 7 (1.8%) | 13 (3.3%) |
| 1 Vehicle | 69 (17.8%) | 73 (18.2%) |
| 2 Vehicles | 152 (39.2%) | 148 (37.0%) |
| 3 Vehicles | 84 (21.6%) | 94 (23.5%) |
| 4 Vehicles | 39 (10.1%) | 38 (9.5%) |
| 5 or more Vehicles | 37 (9.5%) | 34 (8.5%) |
| Total | 388 (100.0%) | 400 (100.0%) |
Commute Time in Akron
The most frequently occuring commute durations in Akron are 5 to 9 minutes (292 commuters, 38.5%), less than 5 minutes (172 commuters, 22.7%), and 40 to 44 minutes (56 commuters, 7.4%).
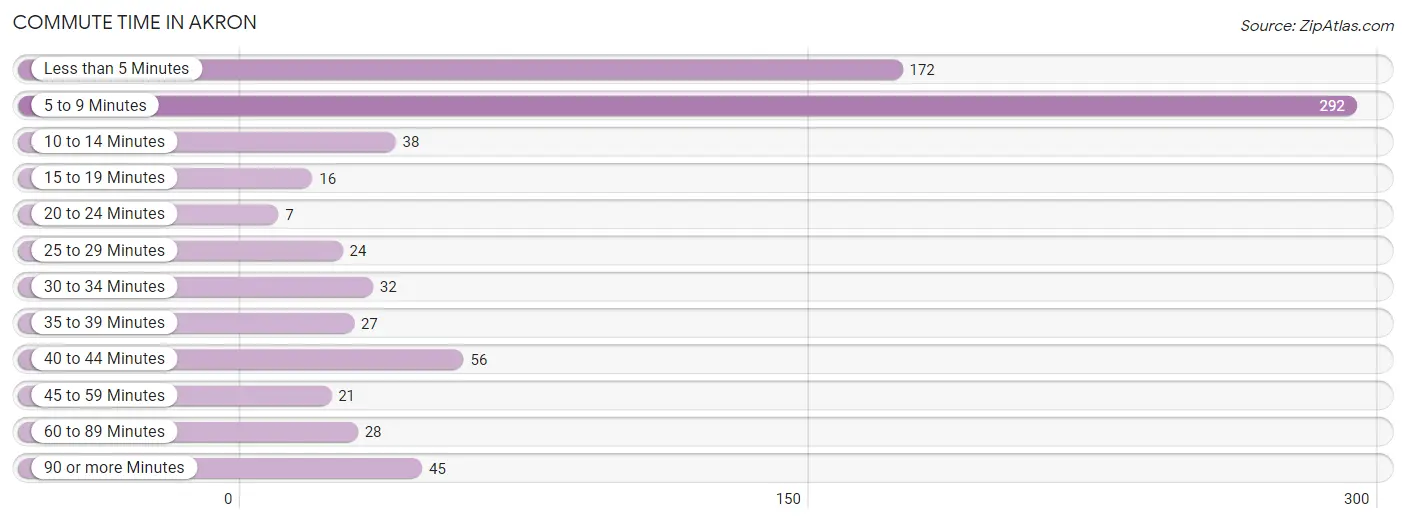
| Commute Time | # Commuters | % Commuters |
| Less than 5 Minutes | 172 | 22.7% |
| 5 to 9 Minutes | 292 | 38.5% |
| 10 to 14 Minutes | 38 | 5.0% |
| 15 to 19 Minutes | 16 | 2.1% |
| 20 to 24 Minutes | 7 | 0.9% |
| 25 to 29 Minutes | 24 | 3.2% |
| 30 to 34 Minutes | 32 | 4.2% |
| 35 to 39 Minutes | 27 | 3.6% |
| 40 to 44 Minutes | 56 | 7.4% |
| 45 to 59 Minutes | 21 | 2.8% |
| 60 to 89 Minutes | 28 | 3.7% |
| 90 or more Minutes | 45 | 5.9% |
Commute Time by Sex in Akron
The most common commute times in Akron are 5 to 9 minutes (122 commuters, 32.8%) for males and 5 to 9 minutes (170 commuters, 44.0%) for females.
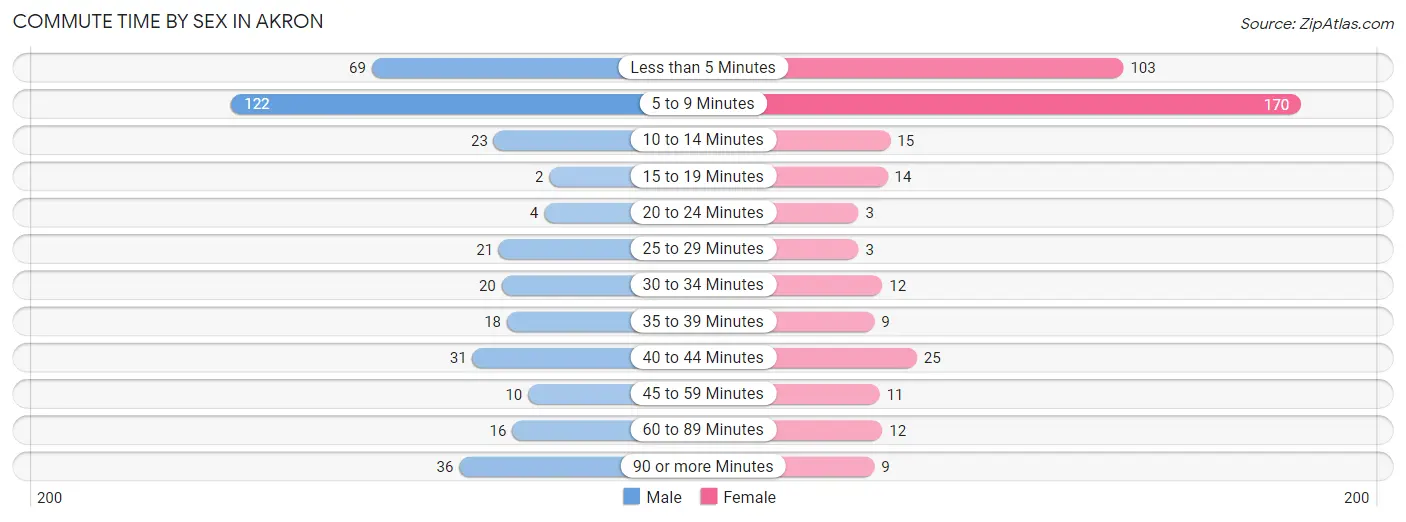
| Commute Time | Male | Female |
| Less than 5 Minutes | 69 (18.5%) | 103 (26.7%) |
| 5 to 9 Minutes | 122 (32.8%) | 170 (44.0%) |
| 10 to 14 Minutes | 23 (6.2%) | 15 (3.9%) |
| 15 to 19 Minutes | 2 (0.5%) | 14 (3.6%) |
| 20 to 24 Minutes | 4 (1.1%) | 3 (0.8%) |
| 25 to 29 Minutes | 21 (5.7%) | 3 (0.8%) |
| 30 to 34 Minutes | 20 (5.4%) | 12 (3.1%) |
| 35 to 39 Minutes | 18 (4.8%) | 9 (2.3%) |
| 40 to 44 Minutes | 31 (8.3%) | 25 (6.5%) |
| 45 to 59 Minutes | 10 (2.7%) | 11 (2.9%) |
| 60 to 89 Minutes | 16 (4.3%) | 12 (3.1%) |
| 90 or more Minutes | 36 (9.7%) | 9 (2.3%) |
Time of Departure to Work by Sex in Akron
The most frequent times of departure to work in Akron are 6:30 AM to 6:59 AM (61, 16.4%) for males and 7:30 AM to 7:59 AM (141, 36.5%) for females.
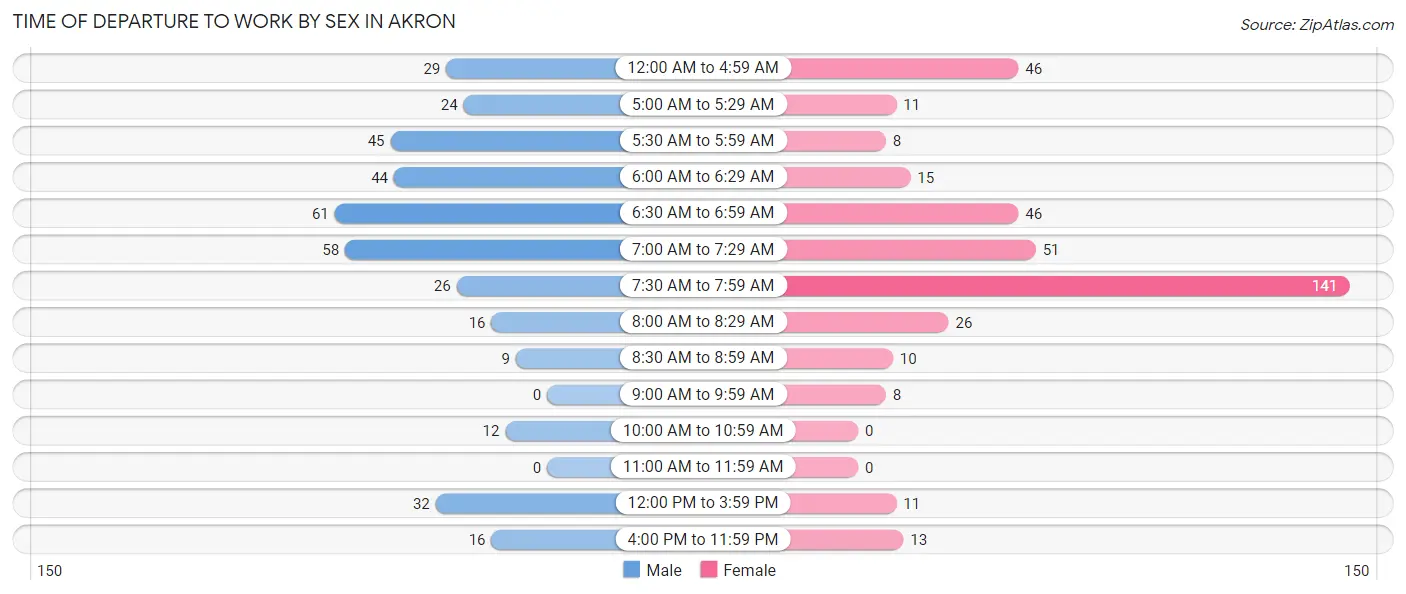
| Time of Departure | Male | Female |
| 12:00 AM to 4:59 AM | 29 (7.8%) | 46 (11.9%) |
| 5:00 AM to 5:29 AM | 24 (6.5%) | 11 (2.9%) |
| 5:30 AM to 5:59 AM | 45 (12.1%) | 8 (2.1%) |
| 6:00 AM to 6:29 AM | 44 (11.8%) | 15 (3.9%) |
| 6:30 AM to 6:59 AM | 61 (16.4%) | 46 (11.9%) |
| 7:00 AM to 7:29 AM | 58 (15.6%) | 51 (13.2%) |
| 7:30 AM to 7:59 AM | 26 (7.0%) | 141 (36.5%) |
| 8:00 AM to 8:29 AM | 16 (4.3%) | 26 (6.7%) |
| 8:30 AM to 8:59 AM | 9 (2.4%) | 10 (2.6%) |
| 9:00 AM to 9:59 AM | 0 (0.0%) | 8 (2.1%) |
| 10:00 AM to 10:59 AM | 12 (3.2%) | 0 (0.0%) |
| 11:00 AM to 11:59 AM | 0 (0.0%) | 0 (0.0%) |
| 12:00 PM to 3:59 PM | 32 (8.6%) | 11 (2.9%) |
| 4:00 PM to 11:59 PM | 16 (4.3%) | 13 (3.4%) |
| Total | 372 (100.0%) | 386 (100.0%) |
Housing Occupancy in Akron
Occupancy by Ownership in Akron
Of the total 762 dwellings in Akron, owner-occupied units account for 543 (71.3%), while renter-occupied units make up 219 (28.7%).
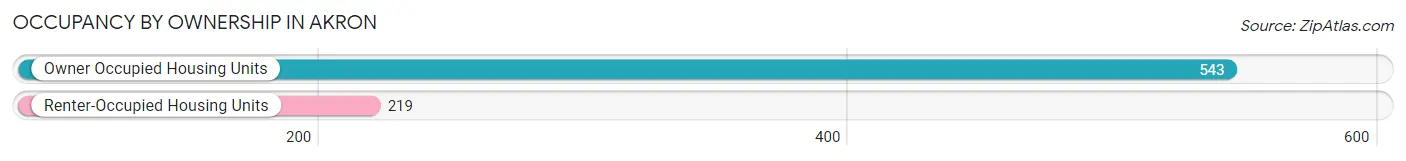
| Occupancy | # Housing Units | % Housing Units |
| Owner Occupied Housing Units | 543 | 71.3% |
| Renter-Occupied Housing Units | 219 | 28.7% |
| Total Occupied Housing Units | 762 | 100.0% |
Occupancy by Household Size in Akron
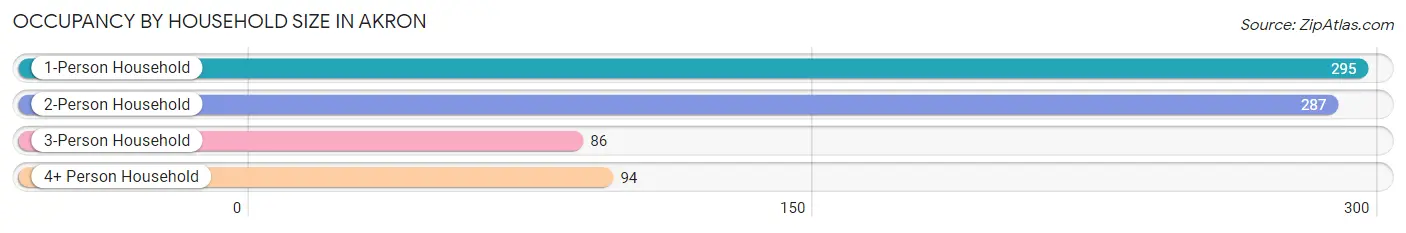
| Household Size | # Housing Units | % Housing Units |
| 1-Person Household | 295 | 38.7% |
| 2-Person Household | 287 | 37.7% |
| 3-Person Household | 86 | 11.3% |
| 4+ Person Household | 94 | 12.3% |
| Total Housing Units | 762 | 100.0% |
Occupancy by Ownership by Household Size in Akron
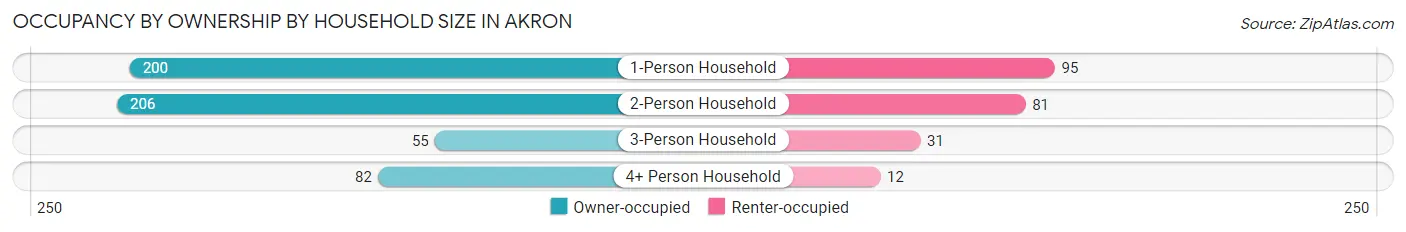
| Household Size | Owner-occupied | Renter-occupied |
| 1-Person Household | 200 (67.8%) | 95 (32.2%) |
| 2-Person Household | 206 (71.8%) | 81 (28.2%) |
| 3-Person Household | 55 (63.9%) | 31 (36.0%) |
| 4+ Person Household | 82 (87.2%) | 12 (12.8%) |
| Total Housing Units | 543 (71.3%) | 219 (28.7%) |
Occupancy by Educational Attainment in Akron
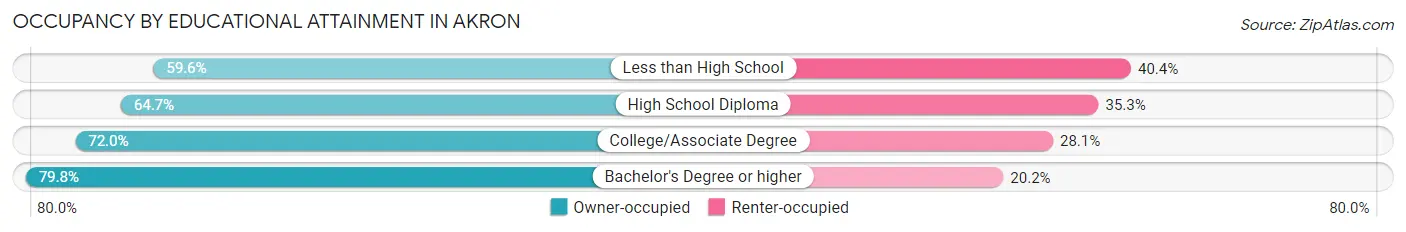
| Household Size | Owner-occupied | Renter-occupied |
| Less than High School | 28 (59.6%) | 19 (40.4%) |
| High School Diploma | 156 (64.7%) | 85 (35.3%) |
| College/Associate Degree | 177 (72.0%) | 69 (28.1%) |
| Bachelor's Degree or higher | 182 (79.8%) | 46 (20.2%) |
Occupancy by Age of Householder in Akron
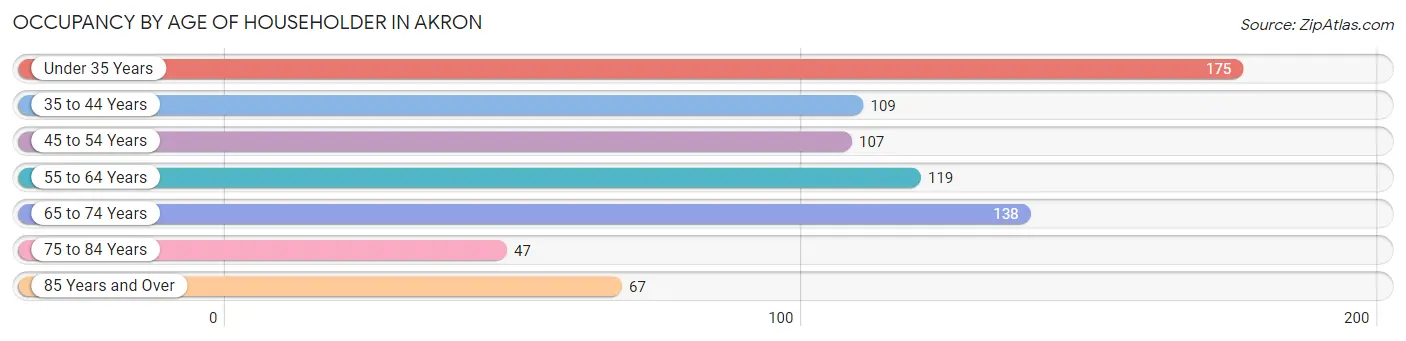
| Age Bracket | # Households | % Households |
| Under 35 Years | 175 | 23.0% |
| 35 to 44 Years | 109 | 14.3% |
| 45 to 54 Years | 107 | 14.0% |
| 55 to 64 Years | 119 | 15.6% |
| 65 to 74 Years | 138 | 18.1% |
| 75 to 84 Years | 47 | 6.2% |
| 85 Years and Over | 67 | 8.8% |
| Total | 762 | 100.0% |
Housing Finances in Akron
Median Income by Occupancy in Akron
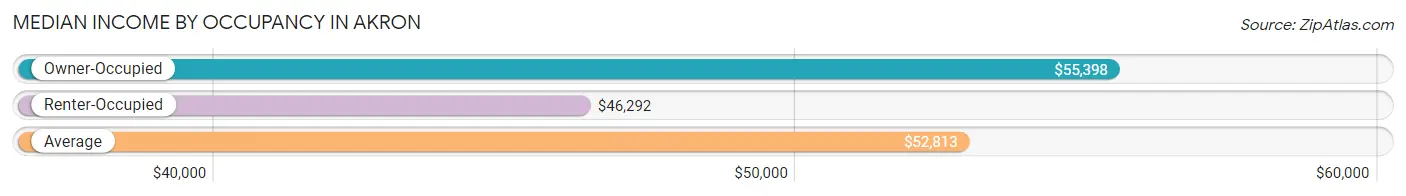
| Occupancy Type | # Households | Median Income |
| Owner-Occupied | 543 (71.3%) | $55,398 |
| Renter-Occupied | 219 (28.7%) | $46,292 |
| Average | 762 (100.0%) | $52,813 |
Occupancy by Householder Income Bracket in Akron
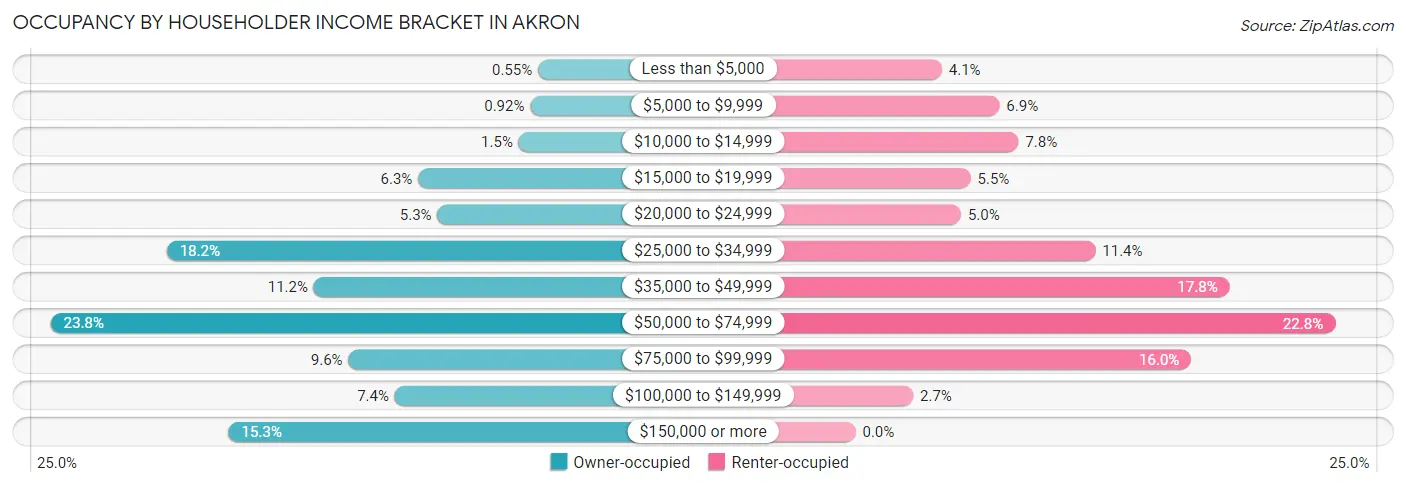
| Income Bracket | Owner-occupied | Renter-occupied |
| Less than $5,000 | 3 (0.5%) | 9 (4.1%) |
| $5,000 to $9,999 | 5 (0.9%) | 15 (6.9%) |
| $10,000 to $14,999 | 8 (1.5%) | 17 (7.8%) |
| $15,000 to $19,999 | 34 (6.3%) | 12 (5.5%) |
| $20,000 to $24,999 | 29 (5.3%) | 11 (5.0%) |
| $25,000 to $34,999 | 99 (18.2%) | 25 (11.4%) |
| $35,000 to $49,999 | 61 (11.2%) | 39 (17.8%) |
| $50,000 to $74,999 | 129 (23.8%) | 50 (22.8%) |
| $75,000 to $99,999 | 52 (9.6%) | 35 (16.0%) |
| $100,000 to $149,999 | 40 (7.4%) | 6 (2.7%) |
| $150,000 or more | 83 (15.3%) | 0 (0.0%) |
| Total | 543 (100.0%) | 219 (100.0%) |
Monthly Housing Cost Tiers in Akron
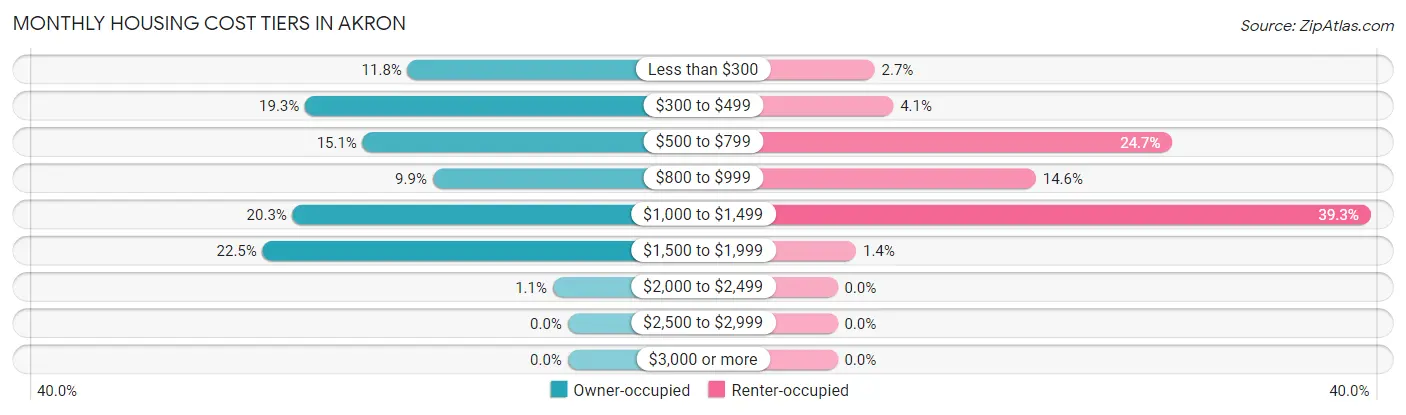
| Monthly Cost | Owner-occupied | Renter-occupied |
| Less than $300 | 64 (11.8%) | 6 (2.7%) |
| $300 to $499 | 105 (19.3%) | 9 (4.1%) |
| $500 to $799 | 82 (15.1%) | 54 (24.7%) |
| $800 to $999 | 54 (9.9%) | 32 (14.6%) |
| $1,000 to $1,499 | 110 (20.3%) | 86 (39.3%) |
| $1,500 to $1,999 | 122 (22.5%) | 3 (1.4%) |
| $2,000 to $2,499 | 6 (1.1%) | 0 (0.0%) |
| $2,500 to $2,999 | 0 (0.0%) | 0 (0.0%) |
| $3,000 or more | 0 (0.0%) | 0 (0.0%) |
| Total | 543 (100.0%) | 219 (100.0%) |
Physical Housing Characteristics in Akron
Housing Structures in Akron
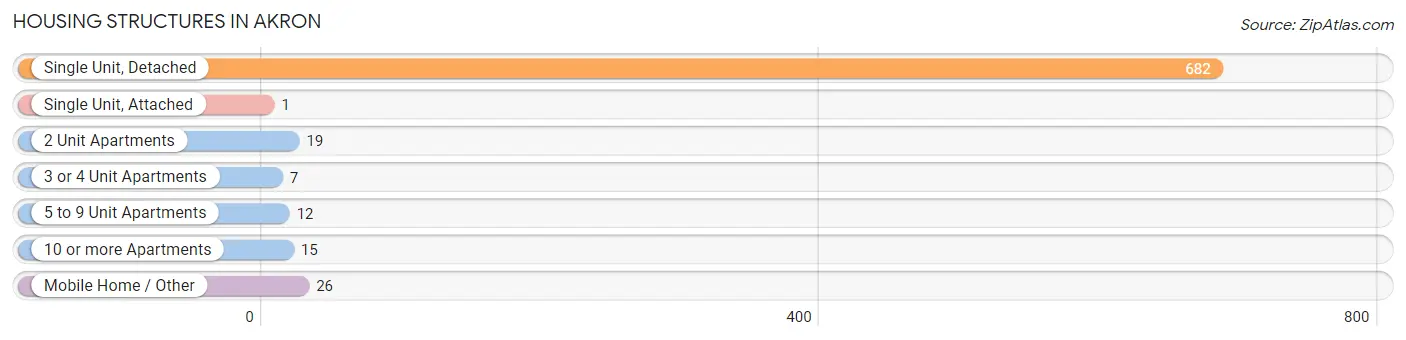
| Structure Type | # Housing Units | % Housing Units |
| Single Unit, Detached | 682 | 89.5% |
| Single Unit, Attached | 1 | 0.1% |
| 2 Unit Apartments | 19 | 2.5% |
| 3 or 4 Unit Apartments | 7 | 0.9% |
| 5 to 9 Unit Apartments | 12 | 1.6% |
| 10 or more Apartments | 15 | 2.0% |
| Mobile Home / Other | 26 | 3.4% |
| Total | 762 | 100.0% |
Housing Structures by Occupancy in Akron
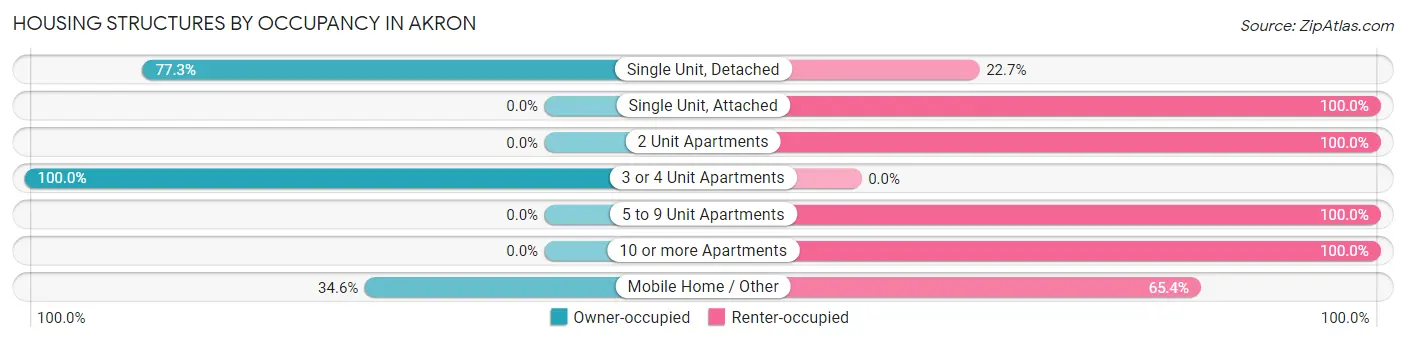
| Structure Type | Owner-occupied | Renter-occupied |
| Single Unit, Detached | 527 (77.3%) | 155 (22.7%) |
| Single Unit, Attached | 0 (0.0%) | 1 (100.0%) |
| 2 Unit Apartments | 0 (0.0%) | 19 (100.0%) |
| 3 or 4 Unit Apartments | 7 (100.0%) | 0 (0.0%) |
| 5 to 9 Unit Apartments | 0 (0.0%) | 12 (100.0%) |
| 10 or more Apartments | 0 (0.0%) | 15 (100.0%) |
| Mobile Home / Other | 9 (34.6%) | 17 (65.4%) |
| Total | 543 (71.3%) | 219 (28.7%) |
Housing Structures by Number of Rooms in Akron
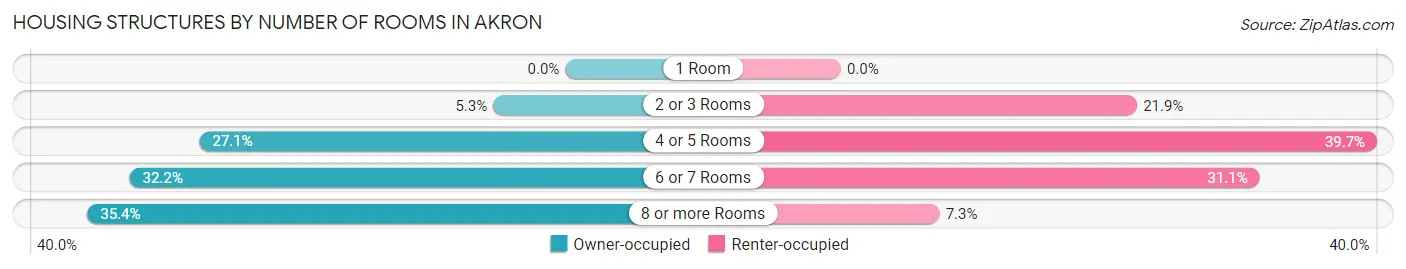
| Number of Rooms | Owner-occupied | Renter-occupied |
| 1 Room | 0 (0.0%) | 0 (0.0%) |
| 2 or 3 Rooms | 29 (5.3%) | 48 (21.9%) |
| 4 or 5 Rooms | 147 (27.1%) | 87 (39.7%) |
| 6 or 7 Rooms | 175 (32.2%) | 68 (31.0%) |
| 8 or more Rooms | 192 (35.4%) | 16 (7.3%) |
| Total | 543 (100.0%) | 219 (100.0%) |
Housing Structure by Heating Type in Akron
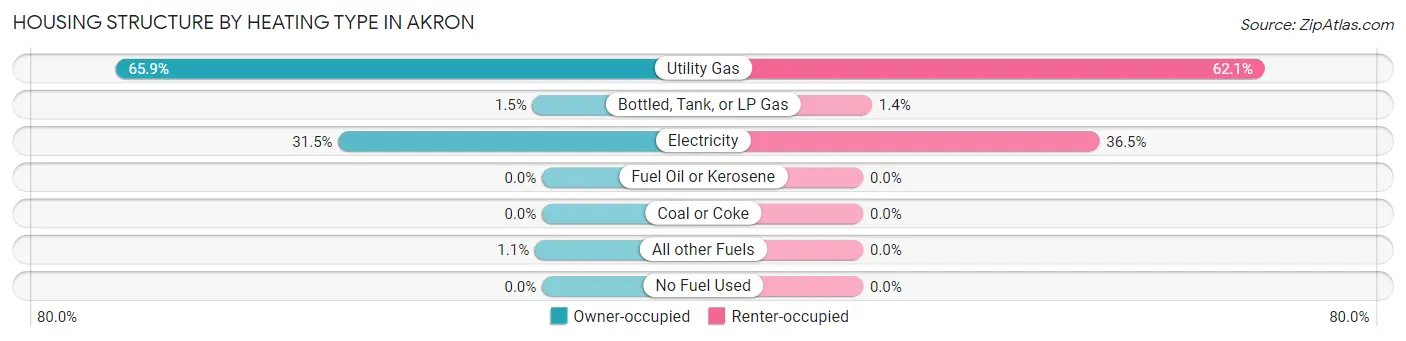
| Heating Type | Owner-occupied | Renter-occupied |
| Utility Gas | 358 (65.9%) | 136 (62.1%) |
| Bottled, Tank, or LP Gas | 8 (1.5%) | 3 (1.4%) |
| Electricity | 171 (31.5%) | 80 (36.5%) |
| Fuel Oil or Kerosene | 0 (0.0%) | 0 (0.0%) |
| Coal or Coke | 0 (0.0%) | 0 (0.0%) |
| All other Fuels | 6 (1.1%) | 0 (0.0%) |
| No Fuel Used | 0 (0.0%) | 0 (0.0%) |
| Total | 543 (100.0%) | 219 (100.0%) |
Household Vehicle Usage in Akron
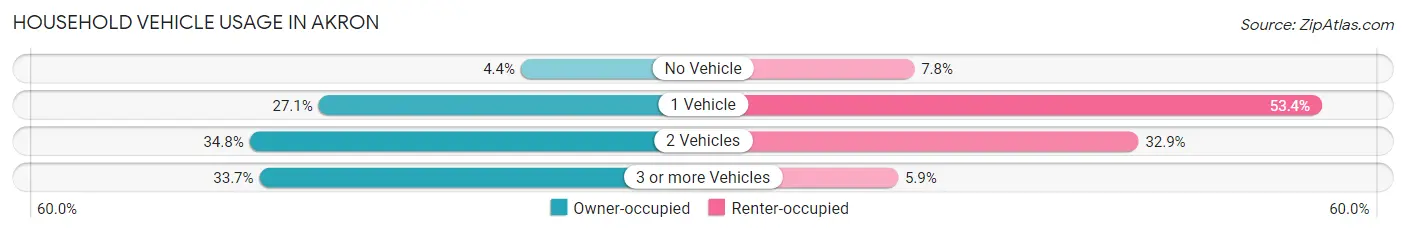
| Vehicles per Household | Owner-occupied | Renter-occupied |
| No Vehicle | 24 (4.4%) | 17 (7.8%) |
| 1 Vehicle | 147 (27.1%) | 117 (53.4%) |
| 2 Vehicles | 189 (34.8%) | 72 (32.9%) |
| 3 or more Vehicles | 183 (33.7%) | 13 (5.9%) |
| Total | 543 (100.0%) | 219 (100.0%) |
Real Estate & Mortgages in Akron
Real Estate and Mortgage Overview in Akron
| Characteristic | Without Mortgage | With Mortgage |
| Housing Units | 237 | 306 |
| Median Property Value | $112,500 | $214,500 |
| Median Household Income | $37,566 | $67 |
| Monthly Housing Costs | $433 | $0 |
| Real Estate Taxes | $759 | $6 |
Property Value by Mortgage Status in Akron
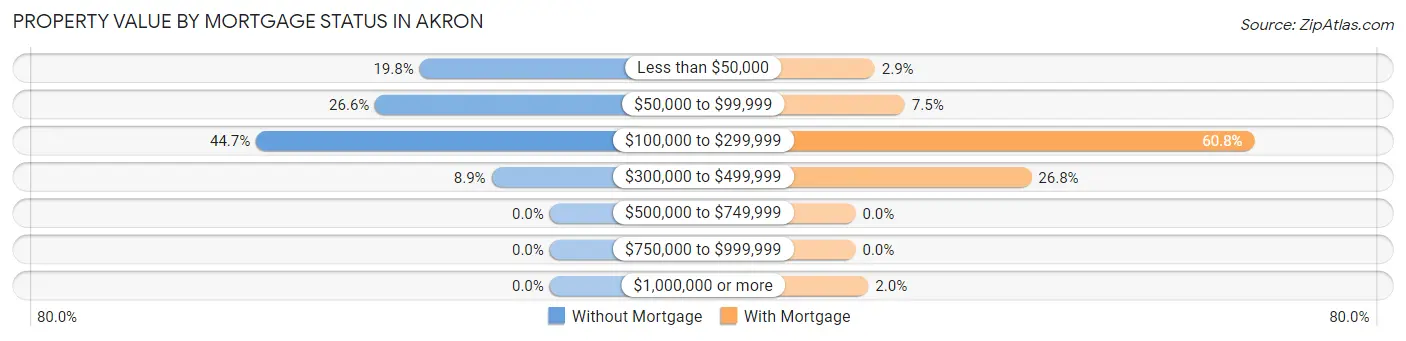
| Property Value | Without Mortgage | With Mortgage |
| Less than $50,000 | 47 (19.8%) | 9 (2.9%) |
| $50,000 to $99,999 | 63 (26.6%) | 23 (7.5%) |
| $100,000 to $299,999 | 106 (44.7%) | 186 (60.8%) |
| $300,000 to $499,999 | 21 (8.9%) | 82 (26.8%) |
| $500,000 to $749,999 | 0 (0.0%) | 0 (0.0%) |
| $750,000 to $999,999 | 0 (0.0%) | 0 (0.0%) |
| $1,000,000 or more | 0 (0.0%) | 6 (2.0%) |
| Total | 237 (100.0%) | 306 (100.0%) |
Household Income by Mortgage Status in Akron
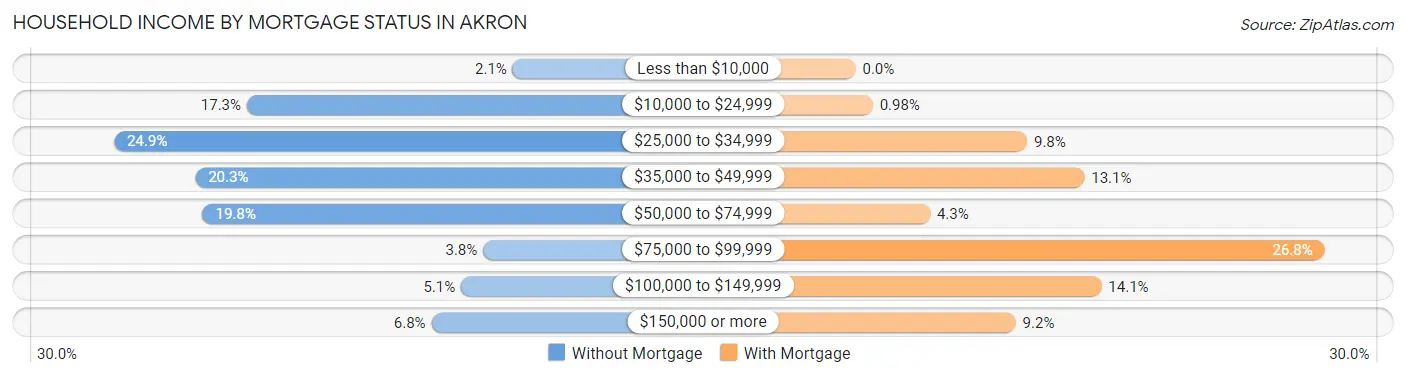
| Household Income | Without Mortgage | With Mortgage |
| Less than $10,000 | 5 (2.1%) | 0 (0.0%) |
| $10,000 to $24,999 | 41 (17.3%) | 3 (1.0%) |
| $25,000 to $34,999 | 59 (24.9%) | 30 (9.8%) |
| $35,000 to $49,999 | 48 (20.3%) | 40 (13.1%) |
| $50,000 to $74,999 | 47 (19.8%) | 13 (4.3%) |
| $75,000 to $99,999 | 9 (3.8%) | 82 (26.8%) |
| $100,000 to $149,999 | 12 (5.1%) | 43 (14.1%) |
| $150,000 or more | 16 (6.8%) | 28 (9.1%) |
| Total | 237 (100.0%) | 306 (100.0%) |
Property Value to Household Income Ratio in Akron
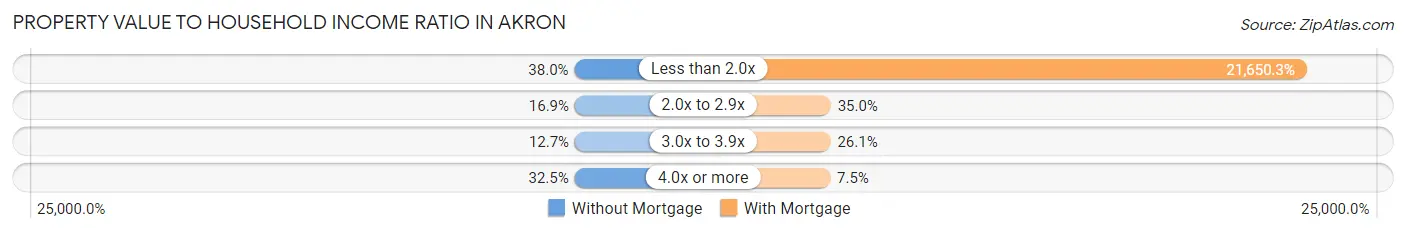
| Value-to-Income Ratio | Without Mortgage | With Mortgage |
| Less than 2.0x | 90 (38.0%) | 66,250 (21,650.3%) |
| 2.0x to 2.9x | 40 (16.9%) | 107 (35.0%) |
| 3.0x to 3.9x | 30 (12.7%) | 80 (26.1%) |
| 4.0x or more | 77 (32.5%) | 23 (7.5%) |
| Total | 237 (100.0%) | 306 (100.0%) |
Real Estate Taxes by Mortgage Status in Akron
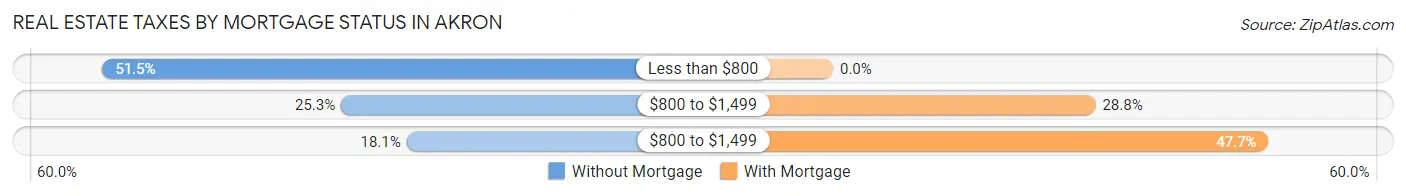
| Property Taxes | Without Mortgage | With Mortgage |
| Less than $800 | 122 (51.5%) | 0 (0.0%) |
| $800 to $1,499 | 60 (25.3%) | 88 (28.8%) |
| $800 to $1,499 | 43 (18.1%) | 146 (47.7%) |
| Total | 237 (100.0%) | 306 (100.0%) |
Health & Disability in Akron
Health Insurance Coverage by Age in Akron
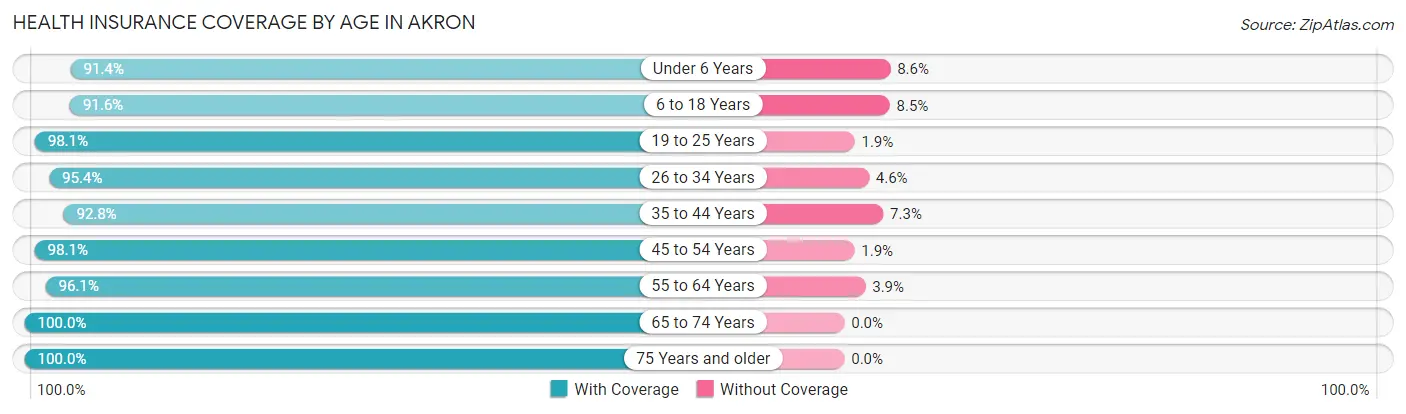
| Age Bracket | With Coverage | Without Coverage |
| Under 6 Years | 64 (91.4%) | 6 (8.6%) |
| 6 to 18 Years | 195 (91.5%) | 18 (8.5%) |
| 19 to 25 Years | 154 (98.1%) | 3 (1.9%) |
| 26 to 34 Years | 125 (95.4%) | 6 (4.6%) |
| 35 to 44 Years | 192 (92.7%) | 15 (7.2%) |
| 45 to 54 Years | 157 (98.1%) | 3 (1.9%) |
| 55 to 64 Years | 172 (96.1%) | 7 (3.9%) |
| 65 to 74 Years | 188 (100.0%) | 0 (0.0%) |
| 75 Years and older | 157 (100.0%) | 0 (0.0%) |
| Total | 1,404 (96.0%) | 58 (4.0%) |
Health Insurance Coverage by Citizenship Status in Akron
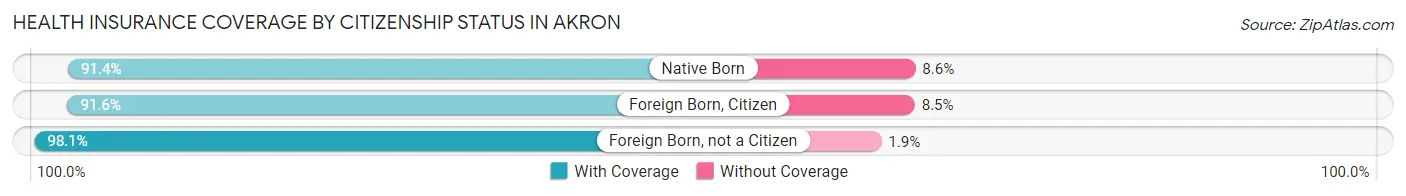
| Citizenship Status | With Coverage | Without Coverage |
| Native Born | 64 (91.4%) | 6 (8.6%) |
| Foreign Born, Citizen | 195 (91.5%) | 18 (8.5%) |
| Foreign Born, not a Citizen | 154 (98.1%) | 3 (1.9%) |
Health Insurance Coverage by Household Income in Akron
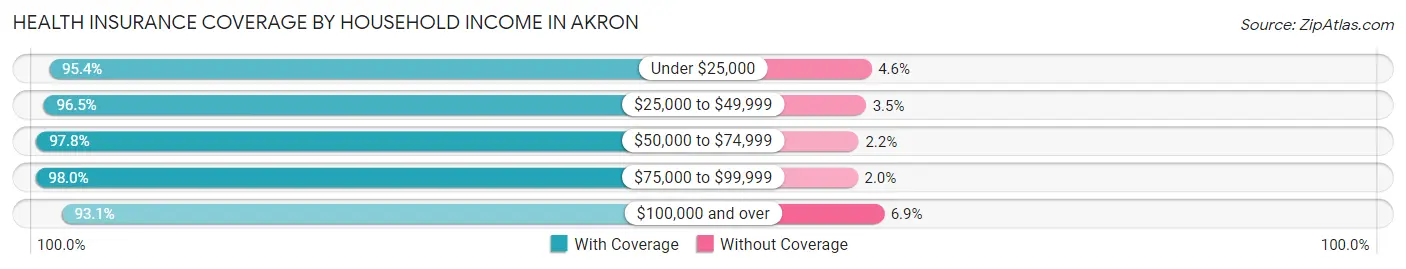
| Household Income | With Coverage | Without Coverage |
| Under $25,000 | 188 (95.4%) | 9 (4.6%) |
| $25,000 to $49,999 | 327 (96.5%) | 12 (3.5%) |
| $50,000 to $74,999 | 357 (97.8%) | 8 (2.2%) |
| $75,000 to $99,999 | 195 (98.0%) | 4 (2.0%) |
| $100,000 and over | 337 (93.1%) | 25 (6.9%) |
Public vs Private Health Insurance Coverage by Age in Akron
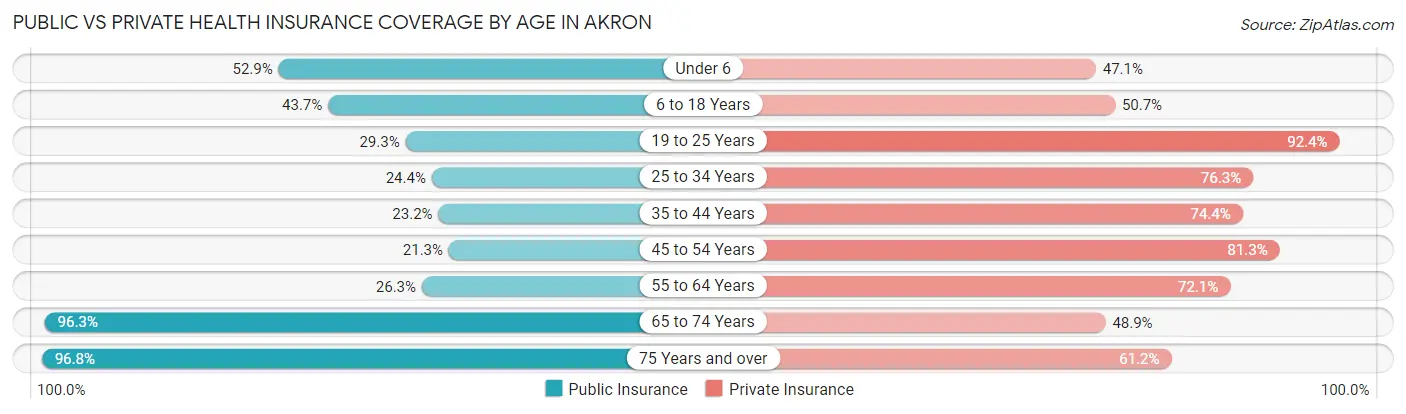
| Age Bracket | Public Insurance | Private Insurance |
| Under 6 | 37 (52.9%) | 33 (47.1%) |
| 6 to 18 Years | 93 (43.7%) | 108 (50.7%) |
| 19 to 25 Years | 46 (29.3%) | 145 (92.4%) |
| 25 to 34 Years | 32 (24.4%) | 100 (76.3%) |
| 35 to 44 Years | 48 (23.2%) | 154 (74.4%) |
| 45 to 54 Years | 34 (21.2%) | 130 (81.2%) |
| 55 to 64 Years | 47 (26.3%) | 129 (72.1%) |
| 65 to 74 Years | 181 (96.3%) | 92 (48.9%) |
| 75 Years and over | 152 (96.8%) | 96 (61.2%) |
| Total | 670 (45.8%) | 987 (67.5%) |
Disability Status by Sex by Age in Akron
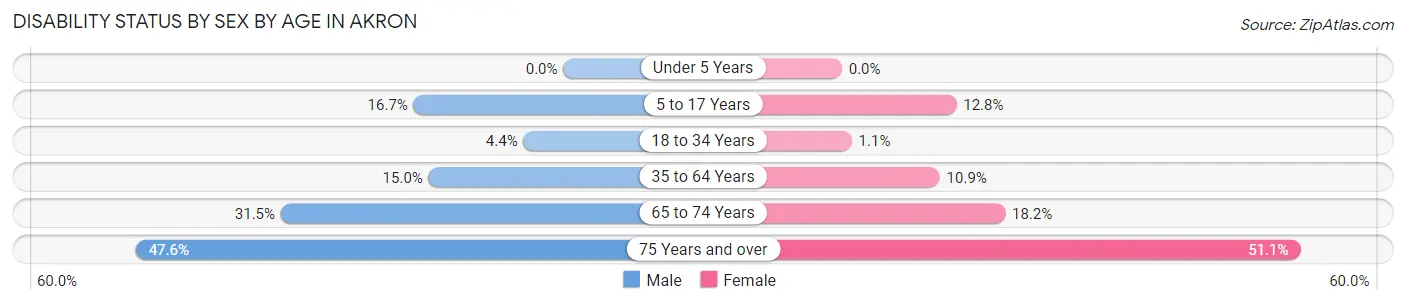
| Age Bracket | Male | Female |
| Under 5 Years | 0 (0.0%) | 0 (0.0%) |
| 5 to 17 Years | 16 (16.7%) | 13 (12.8%) |
| 18 to 34 Years | 6 (4.4%) | 2 (1.1%) |
| 35 to 64 Years | 42 (15.0%) | 29 (10.9%) |
| 65 to 74 Years | 28 (31.5%) | 18 (18.2%) |
| 75 Years and over | 30 (47.6%) | 48 (51.1%) |
Disability Class by Sex by Age in Akron
Disability Class: Hearing Difficulty
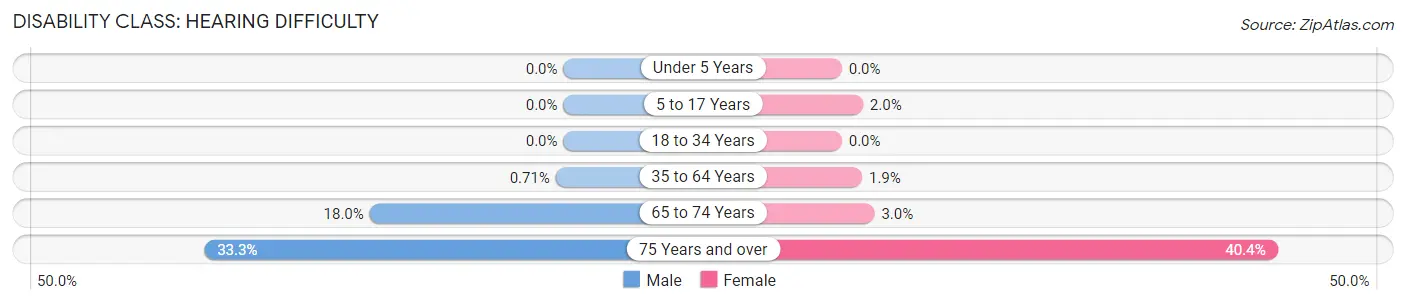
| Age Bracket | Male | Female |
| Under 5 Years | 0 (0.0%) | 0 (0.0%) |
| 5 to 17 Years | 0 (0.0%) | 2 (2.0%) |
| 18 to 34 Years | 0 (0.0%) | 0 (0.0%) |
| 35 to 64 Years | 2 (0.7%) | 5 (1.9%) |
| 65 to 74 Years | 16 (18.0%) | 3 (3.0%) |
| 75 Years and over | 21 (33.3%) | 38 (40.4%) |
Disability Class: Vision Difficulty
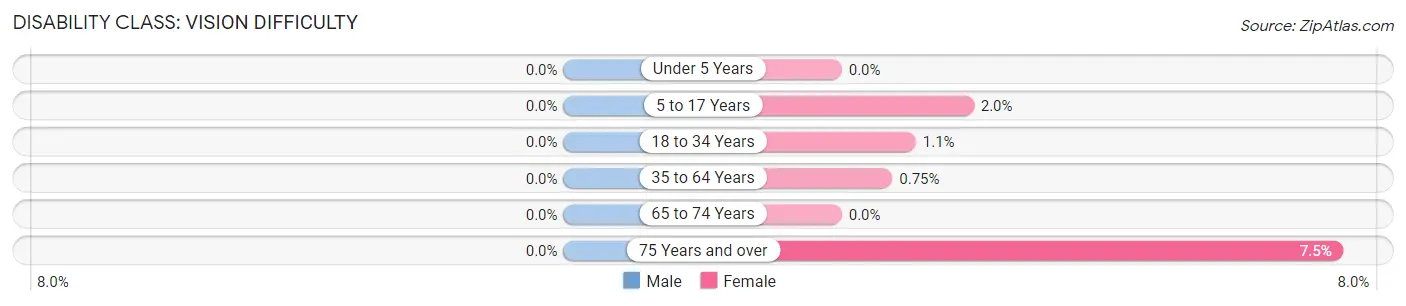
| Age Bracket | Male | Female |
| Under 5 Years | 0 (0.0%) | 0 (0.0%) |
| 5 to 17 Years | 0 (0.0%) | 2 (2.0%) |
| 18 to 34 Years | 0 (0.0%) | 2 (1.1%) |
| 35 to 64 Years | 0 (0.0%) | 2 (0.7%) |
| 65 to 74 Years | 0 (0.0%) | 0 (0.0%) |
| 75 Years and over | 0 (0.0%) | 7 (7.4%) |
Disability Class: Cognitive Difficulty
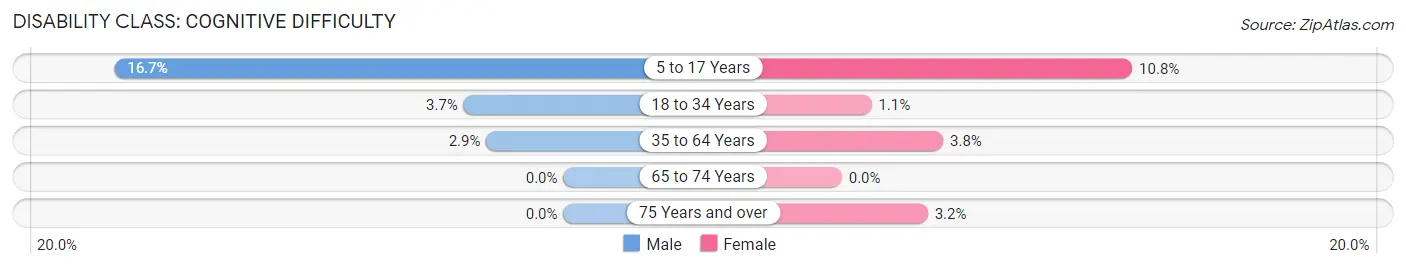
| Age Bracket | Male | Female |
| 5 to 17 Years | 16 (16.7%) | 11 (10.8%) |
| 18 to 34 Years | 5 (3.7%) | 2 (1.1%) |
| 35 to 64 Years | 8 (2.9%) | 10 (3.8%) |
| 65 to 74 Years | 0 (0.0%) | 0 (0.0%) |
| 75 Years and over | 0 (0.0%) | 3 (3.2%) |
Disability Class: Ambulatory Difficulty
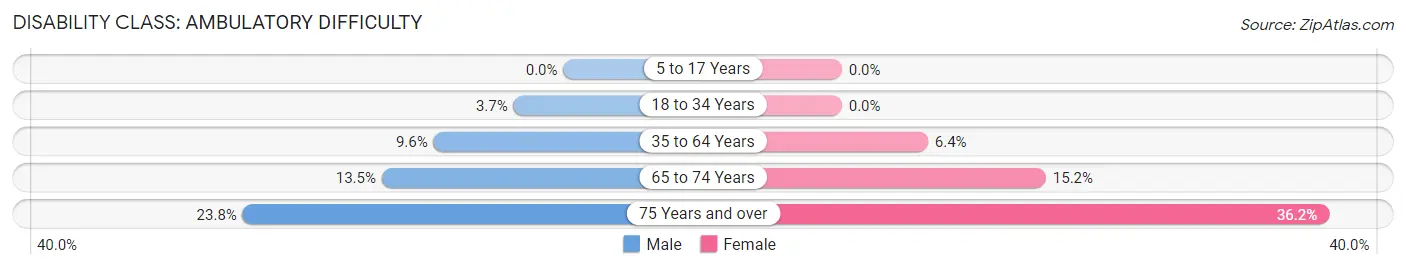
| Age Bracket | Male | Female |
| 5 to 17 Years | 0 (0.0%) | 0 (0.0%) |
| 18 to 34 Years | 5 (3.7%) | 0 (0.0%) |
| 35 to 64 Years | 27 (9.6%) | 17 (6.4%) |
| 65 to 74 Years | 12 (13.5%) | 15 (15.1%) |
| 75 Years and over | 15 (23.8%) | 34 (36.2%) |
Disability Class: Self-Care Difficulty
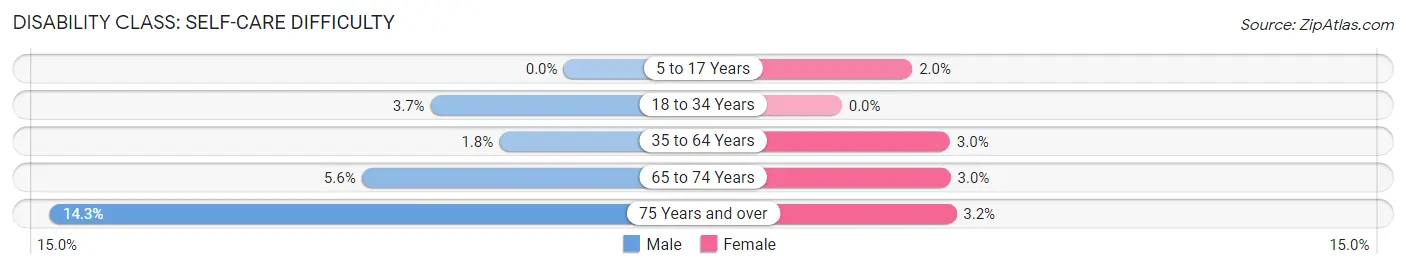
| Age Bracket | Male | Female |
| 5 to 17 Years | 0 (0.0%) | 2 (2.0%) |
| 18 to 34 Years | 5 (3.7%) | 0 (0.0%) |
| 35 to 64 Years | 5 (1.8%) | 8 (3.0%) |
| 65 to 74 Years | 5 (5.6%) | 3 (3.0%) |
| 75 Years and over | 9 (14.3%) | 3 (3.2%) |
Technology Access in Akron
Computing Device Access in Akron
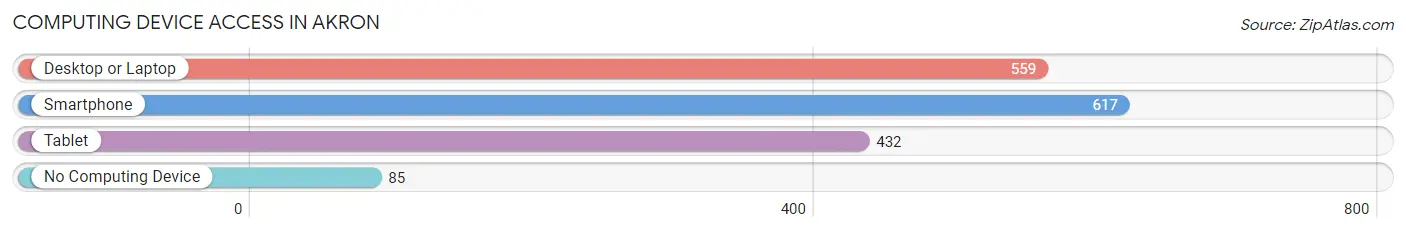
| Device Type | # Households | % Households |
| Desktop or Laptop | 559 | 73.4% |
| Smartphone | 617 | 81.0% |
| Tablet | 432 | 56.7% |
| No Computing Device | 85 | 11.2% |
| Total | 762 | 100.0% |
Internet Access in Akron
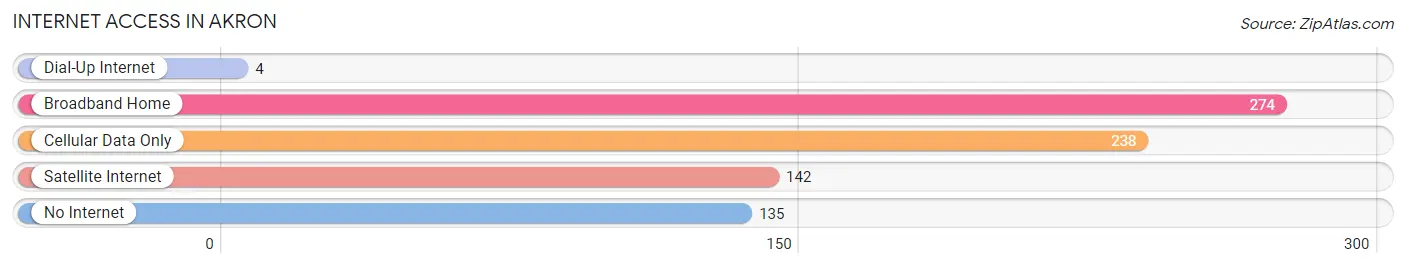
| Internet Type | # Households | % Households |
| Dial-Up Internet | 4 | 0.5% |
| Broadband Home | 274 | 36.0% |
| Cellular Data Only | 238 | 31.2% |
| Satellite Internet | 142 | 18.6% |
| No Internet | 135 | 17.7% |
| Total | 762 | 100.0% |
Akron Summary
Akron is a small town located in Washington County, Colorado, United States. It is situated in the northeast corner of the state, approximately 25 miles east of Denver. The town was founded in 1887 and incorporated in 1904. As of the 2010 census, the population of Akron was 1,890.
History
The town of Akron was founded in 1887 by a group of settlers from Akron, Ohio. The settlers were attracted to the area by the abundance of water and the fertile soil. The town was named after the Ohio city, and the first post office was established in 1888.
In the early years, the town was primarily an agricultural community, with the main crops being wheat, corn, and hay. The town also had a number of businesses, including a hotel, a bank, a newspaper, and a general store.
In the early 1900s, the town began to grow and prosper. The railroad arrived in 1906, and the town was incorporated in 1904. The town continued to grow and by the 1920s, it had a population of over 1,000.
Geography
Akron is located in the northeast corner of Colorado, approximately 25 miles east of Denver. The town is situated in the High Plains region of the state, at an elevation of 4,719 feet. The town is located in Washington County, and is bordered by the towns of Otis, Yuma, and Wray.
The town is located in a semi-arid climate, with hot summers and cold winters. The average annual precipitation is approximately 16 inches, with most of the precipitation occurring in the spring and summer months.
Economy
The economy of Akron is primarily based on agriculture and tourism. The town is home to a number of farms, which produce wheat, corn, hay, and other crops. The town also has a number of businesses, including a hotel, a bank, a newspaper, and a general store.
Tourism is also an important part of the economy. The town is home to a number of attractions, including the Akron Historical Museum, the Akron Art Gallery, and the Akron Zoo. The town also hosts a number of festivals and events throughout the year, including the Akron Days Festival and the Akron County Fair.
Demographics
As of the 2010 census, the population of Akron was 1,890. The racial makeup of the town was 95.3% White, 0.3% African American, 0.7% Native American, 0.2% Asian, 0.1% Pacific Islander, 1.2% from other races, and 2.3% from two or more races. Hispanic or Latino of any race were 4.2% of the population.
The median income for a household in the town was $37,500, and the median income for a family was $45,000. The per capita income for the town was $18,845. About 11.2% of families and 14.2% of the population were below the poverty line, including 18.2% of those under age 18 and 8.3% of those age 65 or over.
Common Questions
What is the Total Population of Akron?
Total Population of Akron is 1,675.
What is the Total Male Population of Akron?
Total Male Population of Akron is 850.
What is the Total Female Population of Akron?
Total Female Population of Akron is 825.
What is the Ratio of Males per 100 Females in Akron?
There are 103.03 Males per 100 Females in Akron.
What is the Ratio of Females per 100 Males in Akron?
There are 97.06 Females per 100 Males in Akron.
What is the Median Population Age in Akron?
Median Population Age in Akron is 41.1 Years.
What is the Average Family Size in Akron
Average Family Size in Akron is 2.5 People.
What is the Average Household Size in Akron
Average Household Size in Akron is 1.9 People.
What is Per Capita Income in Akron?
Per Capita income in Akron is $34,359.
What is the Median Family Income in Akron?
Median Family Income in Akron is $59,141.
What is the Median Household income in Akron?
Median Household Income in Akron is $52,813.
What is Income or Wage Gap in Akron?
Income or Wage Gap in Akron is 30.4%.
Women in Akron earn 69.6 cents for every dollar earned by a man.
What is Family Income Deficit in Akron?
Family Income Deficit in Akron is $6,822.
Families that are below poverty line in Akron earn $6,822 less on average than the poverty threshold level.
What is Inequality or Gini Index in Akron?
Inequality or Gini Index in Akron is 0.46.
How Large is the Labor Force in Akron?
There are 812 People in the Labor Forcein in Akron.
What is the Percentage of People in the Labor Force in Akron?
56.4% of People are in the Labor Force in Akron.
What is the Unemployment Rate in Akron?
Unemployment Rate in Akron is 2.1%.