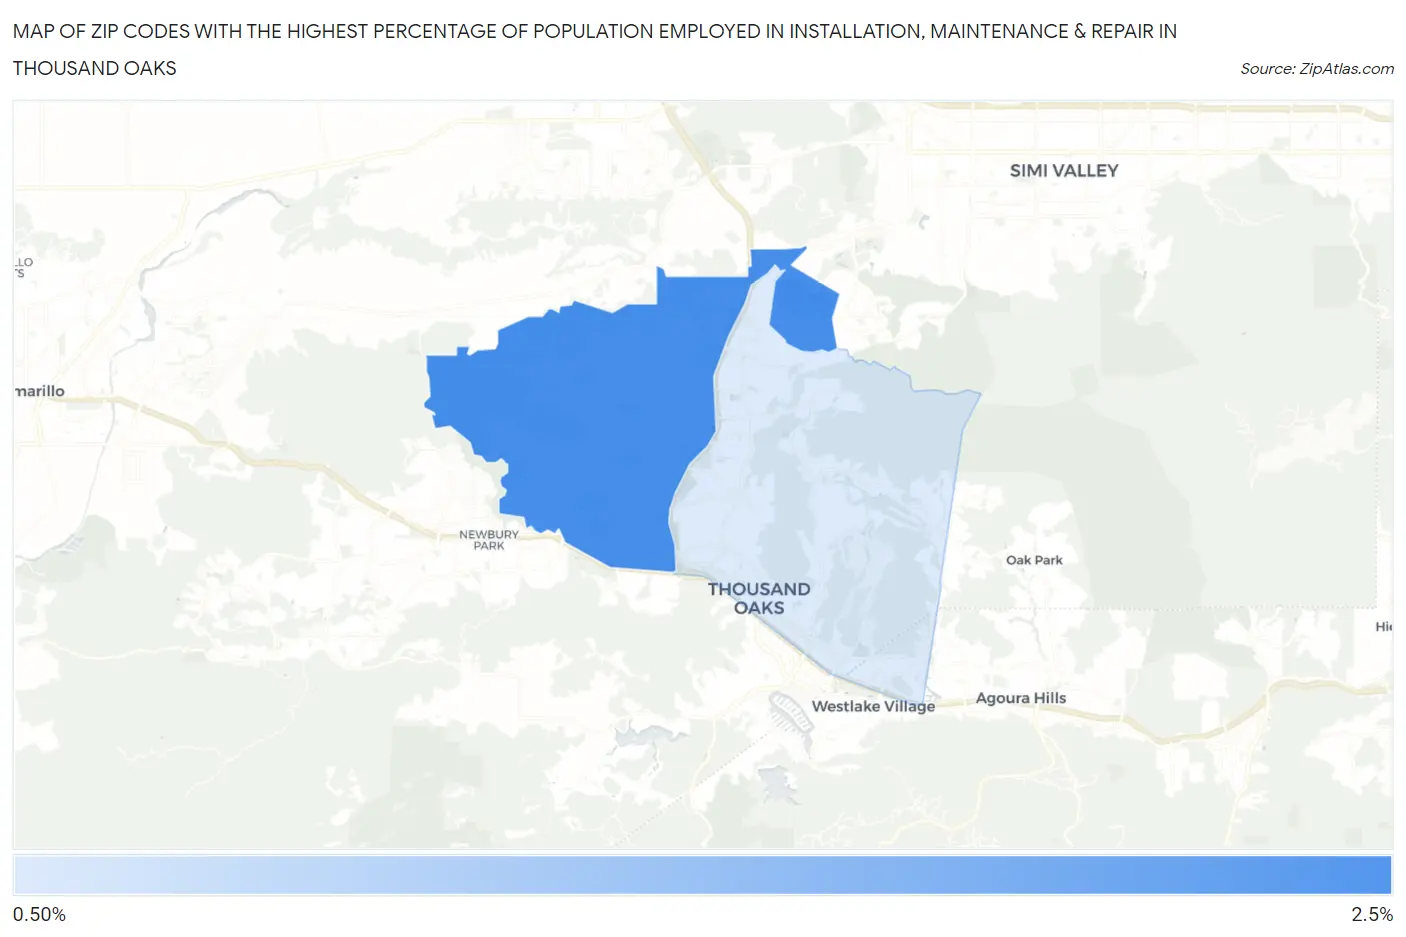
Zip Codes with the Highest Percentage of Population Employed in Installation, Maintenance & Repair in Thousand Oaks, CA
RELATED REPORTS & OPTIONS
Installation, Maintenance & Repair
Thousand Oaks
Compare Zip Codes
Map of Zip Codes with the Highest Percentage of Population Employed in Installation, Maintenance & Repair in Thousand Oaks
0.0%
2.5%
Zip Codes with the Highest Percentage of Population Employed in Installation, Maintenance & Repair in Thousand Oaks, CA
| Zip Code | % Employed | vs State | vs National | |
| 1. | 91360 | 2.2% | 2.6%(-0.391)#922 | 3.1%(-0.902)#21,243 |
| 2. | 91362 | 1.2% | 2.6%(-1.36)#1,200 | 3.1%(-1.87)#25,276 |
1
Common Questions
What are the Top Zip Codes with the Highest Percentage of Population Employed in Installation, Maintenance & Repair in Thousand Oaks, CA?
Top Zip Codes with the Highest Percentage of Population Employed in Installation, Maintenance & Repair in Thousand Oaks, CA are:
What zip code has the Highest Percentage of Population Employed in Installation, Maintenance & Repair in Thousand Oaks, CA?
91360 has the Highest Percentage of Population Employed in Installation, Maintenance & Repair in Thousand Oaks, CA with 2.2%.
What is the Percentage of Population Employed in Installation, Maintenance & Repair in Thousand Oaks, CA?
Percentage of Population Employed in Installation, Maintenance & Repair in Thousand Oaks is 1.8%.
What is the Percentage of Population Employed in Installation, Maintenance & Repair in California?
Percentage of Population Employed in Installation, Maintenance & Repair in California is 2.6%.
What is the Percentage of Population Employed in Installation, Maintenance & Repair in the United States?
Percentage of Population Employed in Installation, Maintenance & Repair in the United States is 3.1%.