Zip Codes with the Highest Percentage of Population Employed in Installation, Maintenance & Repair in Redlands, CA
RELATED REPORTS & OPTIONS
Installation, Maintenance & Repair
Redlands
Compare Zip Codes
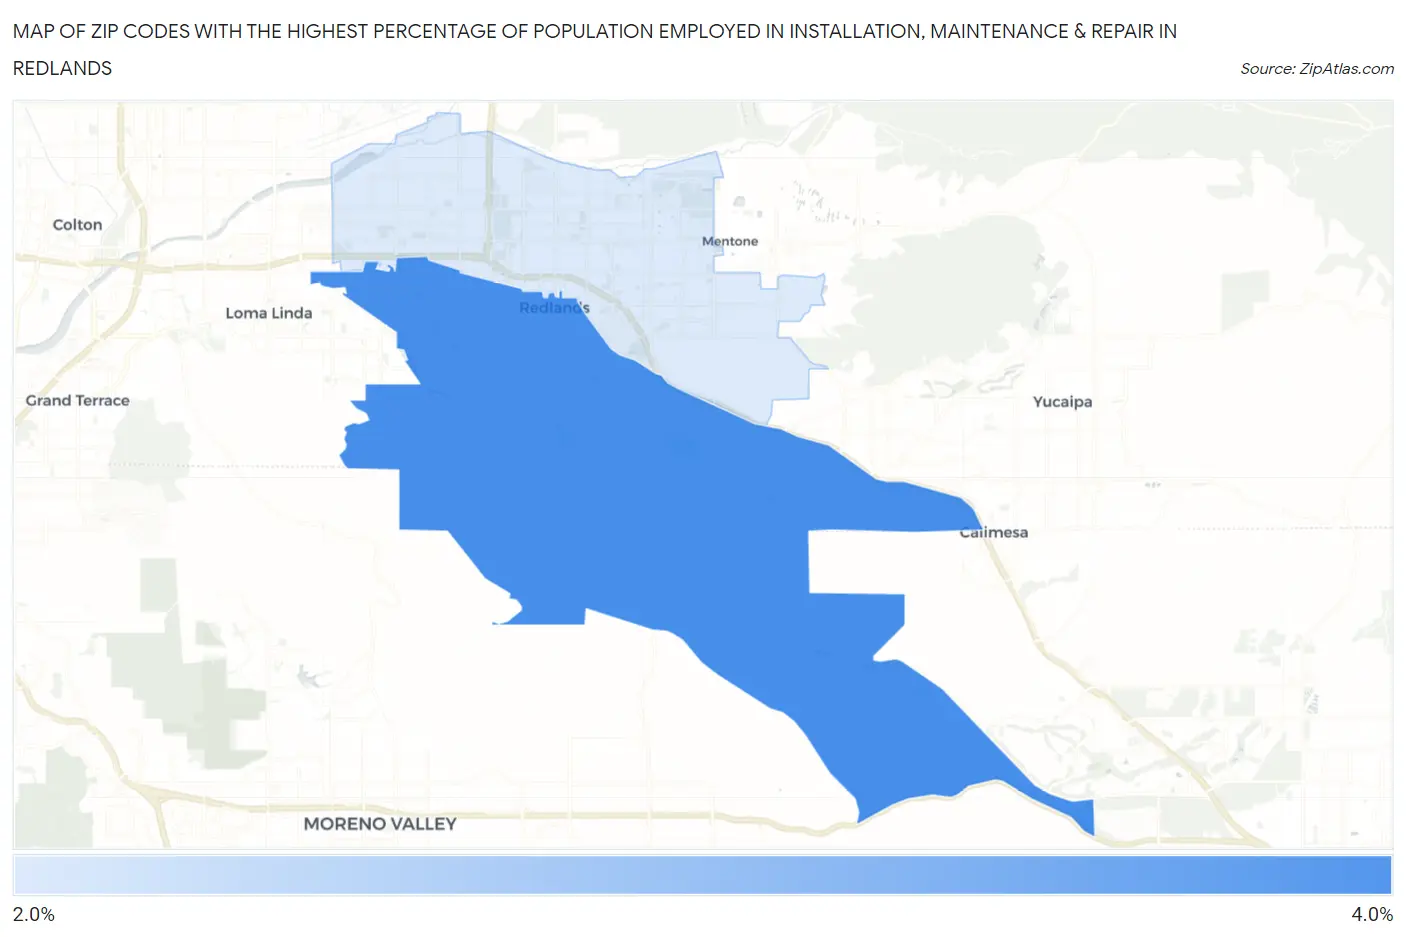
Map of Zip Codes with the Highest Percentage of Population Employed in Installation, Maintenance & Repair in Redlands
0.0%
4.0%
Zip Codes with the Highest Percentage of Population Employed in Installation, Maintenance & Repair in Redlands, CA
| Zip Code | % Employed | vs State | vs National | |
| 1. | 92373 | 3.2% | 2.6%(+0.617)#537 | 3.1%(+0.106)#16,163 |
| 2. | 92374 | 2.7% | 2.6%(+0.108)#723 | 3.1%(-0.404)#18,752 |
1
Common Questions
What are the Top Zip Codes with the Highest Percentage of Population Employed in Installation, Maintenance & Repair in Redlands, CA?
Top Zip Codes with the Highest Percentage of Population Employed in Installation, Maintenance & Repair in Redlands, CA are:
What zip code has the Highest Percentage of Population Employed in Installation, Maintenance & Repair in Redlands, CA?
92373 has the Highest Percentage of Population Employed in Installation, Maintenance & Repair in Redlands, CA with 3.2%.
What is the Percentage of Population Employed in Installation, Maintenance & Repair in Redlands, CA?
Percentage of Population Employed in Installation, Maintenance & Repair in Redlands is 3.1%.
What is the Percentage of Population Employed in Installation, Maintenance & Repair in California?
Percentage of Population Employed in Installation, Maintenance & Repair in California is 2.6%.
What is the Percentage of Population Employed in Installation, Maintenance & Repair in the United States?
Percentage of Population Employed in Installation, Maintenance & Repair in the United States is 3.1%.