Zip Codes with the Highest Percentage of Population Employed in Installation, Maintenance & Repair in Richmond, CA
RELATED REPORTS & OPTIONS
Installation, Maintenance & Repair
Richmond
Compare Zip Codes
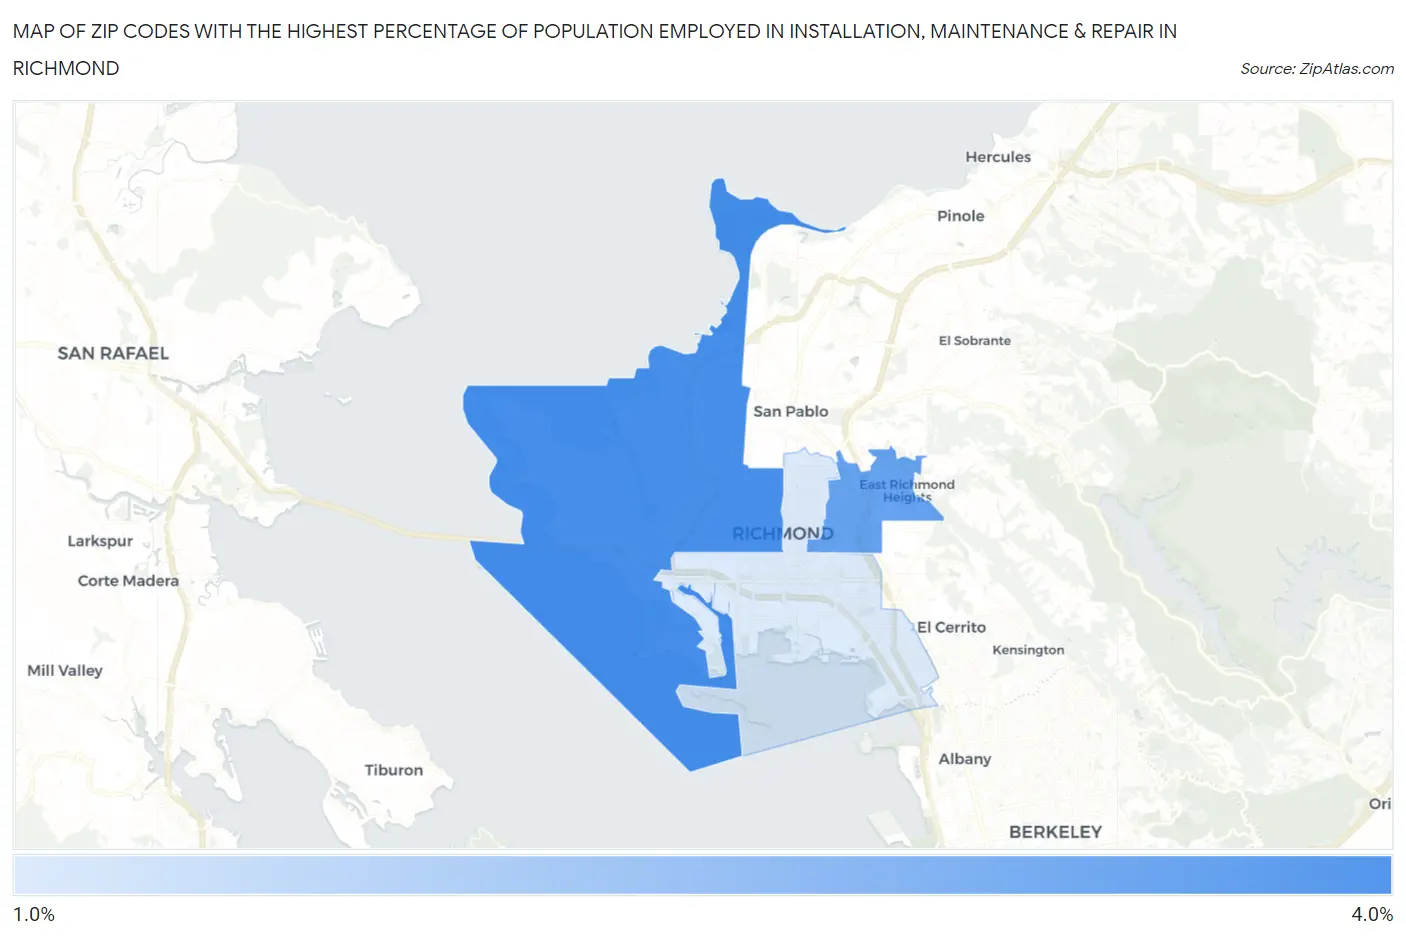
Map of Zip Codes with the Highest Percentage of Population Employed in Installation, Maintenance & Repair in Richmond
0.0%
4.0%
Zip Codes with the Highest Percentage of Population Employed in Installation, Maintenance & Repair in Richmond, CA
| Zip Code | % Employed | vs State | vs National | |
| 1. | 94801 | 3.3% | 2.6%(+0.728)#503 | 3.1%(+0.217)#15,629 |
| 2. | 94805 | 2.9% | 2.6%(+0.370)#622 | 3.1%(-0.142)#17,368 |
| 3. | 94804 | 1.5% | 2.6%(-1.01)#1,106 | 3.1%(-1.52)#23,982 |
1
Common Questions
What are the Top Zip Codes with the Highest Percentage of Population Employed in Installation, Maintenance & Repair in Richmond, CA?
Top Zip Codes with the Highest Percentage of Population Employed in Installation, Maintenance & Repair in Richmond, CA are:
What zip code has the Highest Percentage of Population Employed in Installation, Maintenance & Repair in Richmond, CA?
94801 has the Highest Percentage of Population Employed in Installation, Maintenance & Repair in Richmond, CA with 3.3%.
What is the Percentage of Population Employed in Installation, Maintenance & Repair in Richmond, CA?
Percentage of Population Employed in Installation, Maintenance & Repair in Richmond is 2.1%.
What is the Percentage of Population Employed in Installation, Maintenance & Repair in California?
Percentage of Population Employed in Installation, Maintenance & Repair in California is 2.6%.
What is the Percentage of Population Employed in Installation, Maintenance & Repair in the United States?
Percentage of Population Employed in Installation, Maintenance & Repair in the United States is 3.1%.