Zip Codes with the Highest Percentage of Population Employed in Installation, Maintenance & Repair in San Ramon, CA
RELATED REPORTS & OPTIONS
Installation, Maintenance & Repair
San Ramon
Compare Zip Codes
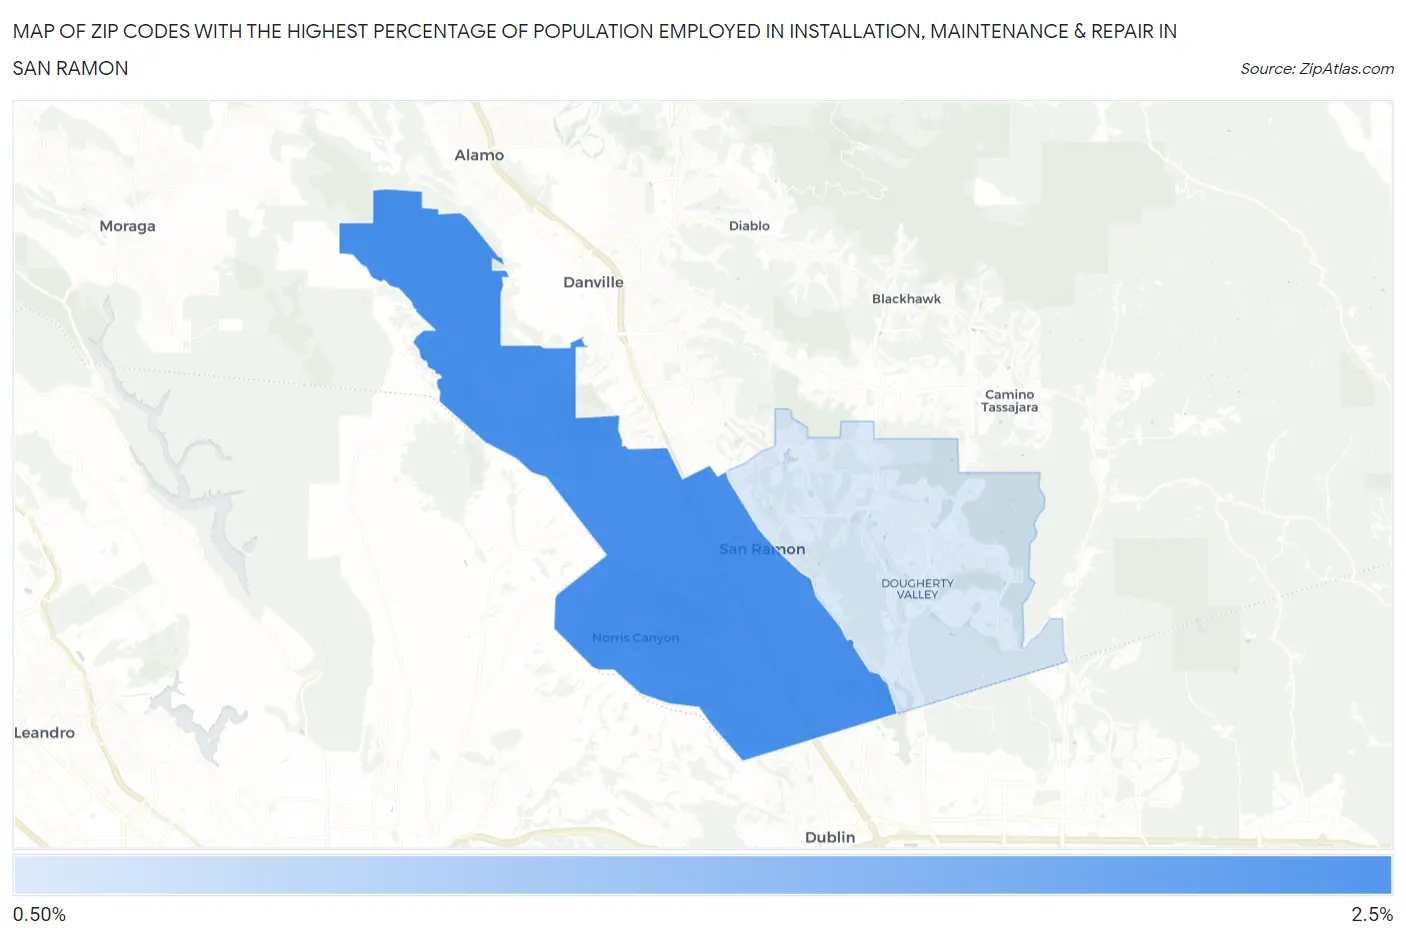
Map of Zip Codes with the Highest Percentage of Population Employed in Installation, Maintenance & Repair in San Ramon
0.0%
2.5%
Zip Codes with the Highest Percentage of Population Employed in Installation, Maintenance & Repair in San Ramon, CA
| Zip Code | % Employed | vs State | vs National | |
| 1. | 94583 | 2.1% | 2.6%(-0.452)#936 | 3.1%(-0.964)#21,517 |
| 2. | 94582 | 0.88% | 2.6%(-1.68)#1,283 | 3.1%(-2.19)#26,267 |
1
Common Questions
What are the Top Zip Codes with the Highest Percentage of Population Employed in Installation, Maintenance & Repair in San Ramon, CA?
Top Zip Codes with the Highest Percentage of Population Employed in Installation, Maintenance & Repair in San Ramon, CA are:
What zip code has the Highest Percentage of Population Employed in Installation, Maintenance & Repair in San Ramon, CA?
94583 has the Highest Percentage of Population Employed in Installation, Maintenance & Repair in San Ramon, CA with 2.1%.
What is the Percentage of Population Employed in Installation, Maintenance & Repair in San Ramon, CA?
Percentage of Population Employed in Installation, Maintenance & Repair in San Ramon is 1.4%.
What is the Percentage of Population Employed in Installation, Maintenance & Repair in California?
Percentage of Population Employed in Installation, Maintenance & Repair in California is 2.6%.
What is the Percentage of Population Employed in Installation, Maintenance & Repair in the United States?
Percentage of Population Employed in Installation, Maintenance & Repair in the United States is 3.1%.