Zip Codes with the Highest Percentage of Population Employed in Installation, Maintenance & Repair in Arcadia, CA
RELATED REPORTS & OPTIONS
Installation, Maintenance & Repair
Arcadia
Compare Zip Codes
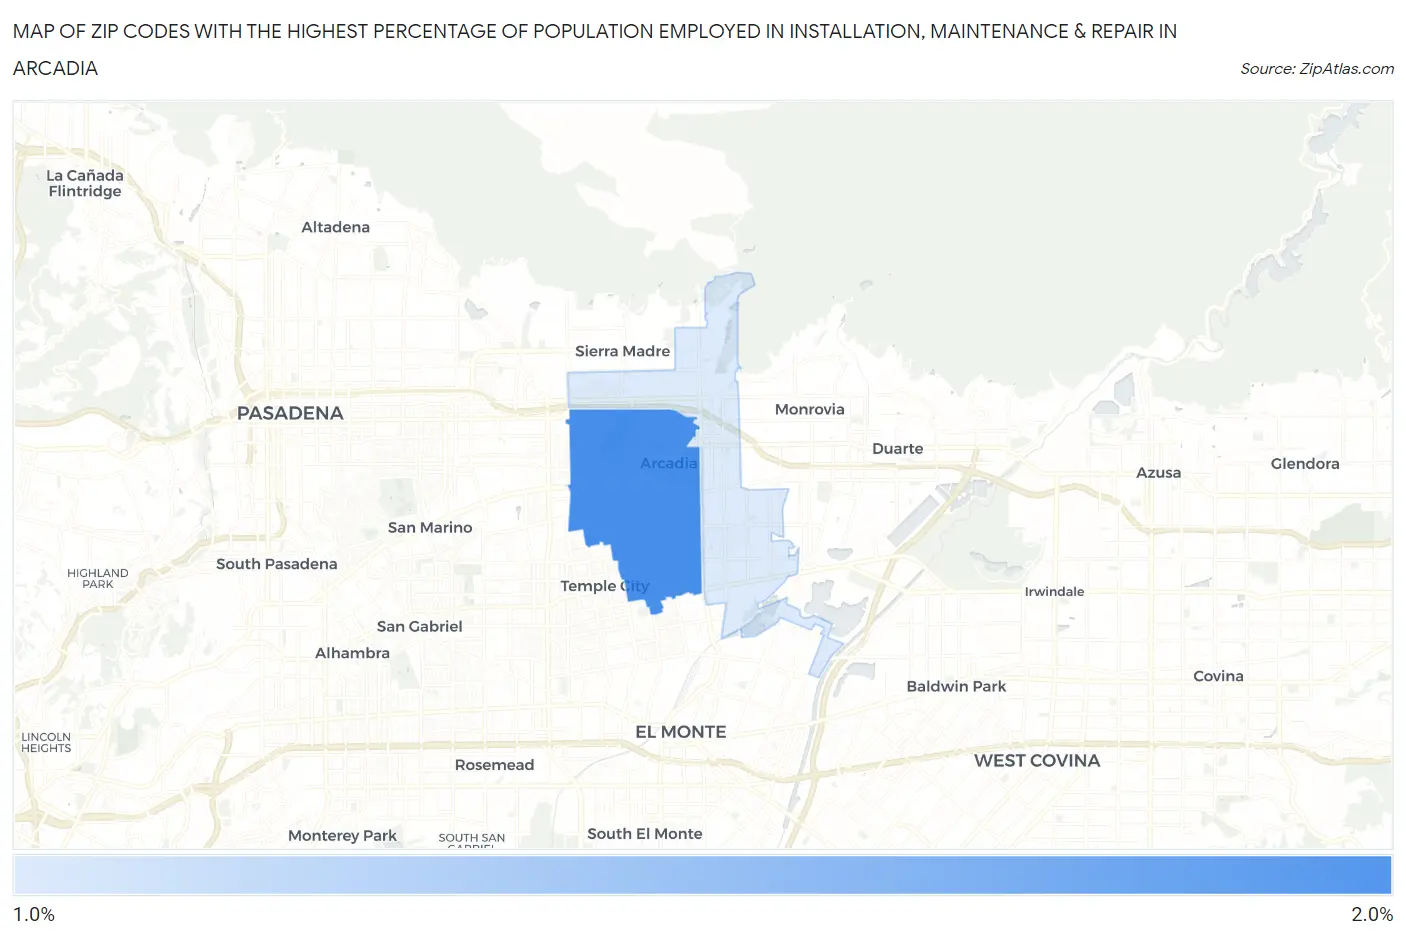
Map of Zip Codes with the Highest Percentage of Population Employed in Installation, Maintenance & Repair in Arcadia
0.0%
2.0%
Zip Codes with the Highest Percentage of Population Employed in Installation, Maintenance & Repair in Arcadia, CA
| Zip Code | % Employed | vs State | vs National | |
| 1. | 91007 | 1.5% | 2.6%(-1.01)#1,108 | 3.1%(-1.52)#23,985 |
| 2. | 91006 | 1.5% | 2.6%(-1.09)#1,125 | 3.1%(-1.60)#24,302 |
1
Common Questions
What are the Top Zip Codes with the Highest Percentage of Population Employed in Installation, Maintenance & Repair in Arcadia, CA?
Top Zip Codes with the Highest Percentage of Population Employed in Installation, Maintenance & Repair in Arcadia, CA are:
What zip code has the Highest Percentage of Population Employed in Installation, Maintenance & Repair in Arcadia, CA?
91007 has the Highest Percentage of Population Employed in Installation, Maintenance & Repair in Arcadia, CA with 1.5%.
What is the Percentage of Population Employed in Installation, Maintenance & Repair in Arcadia, CA?
Percentage of Population Employed in Installation, Maintenance & Repair in Arcadia is 1.2%.
What is the Percentage of Population Employed in Installation, Maintenance & Repair in California?
Percentage of Population Employed in Installation, Maintenance & Repair in California is 2.6%.
What is the Percentage of Population Employed in Installation, Maintenance & Repair in the United States?
Percentage of Population Employed in Installation, Maintenance & Repair in the United States is 3.1%.