Zip Codes with the Highest Percentage of Population Employed in Security & Protection in North Little Rock, AR
RELATED REPORTS & OPTIONS
Security & Protection
North Little Rock
Compare Zip Codes
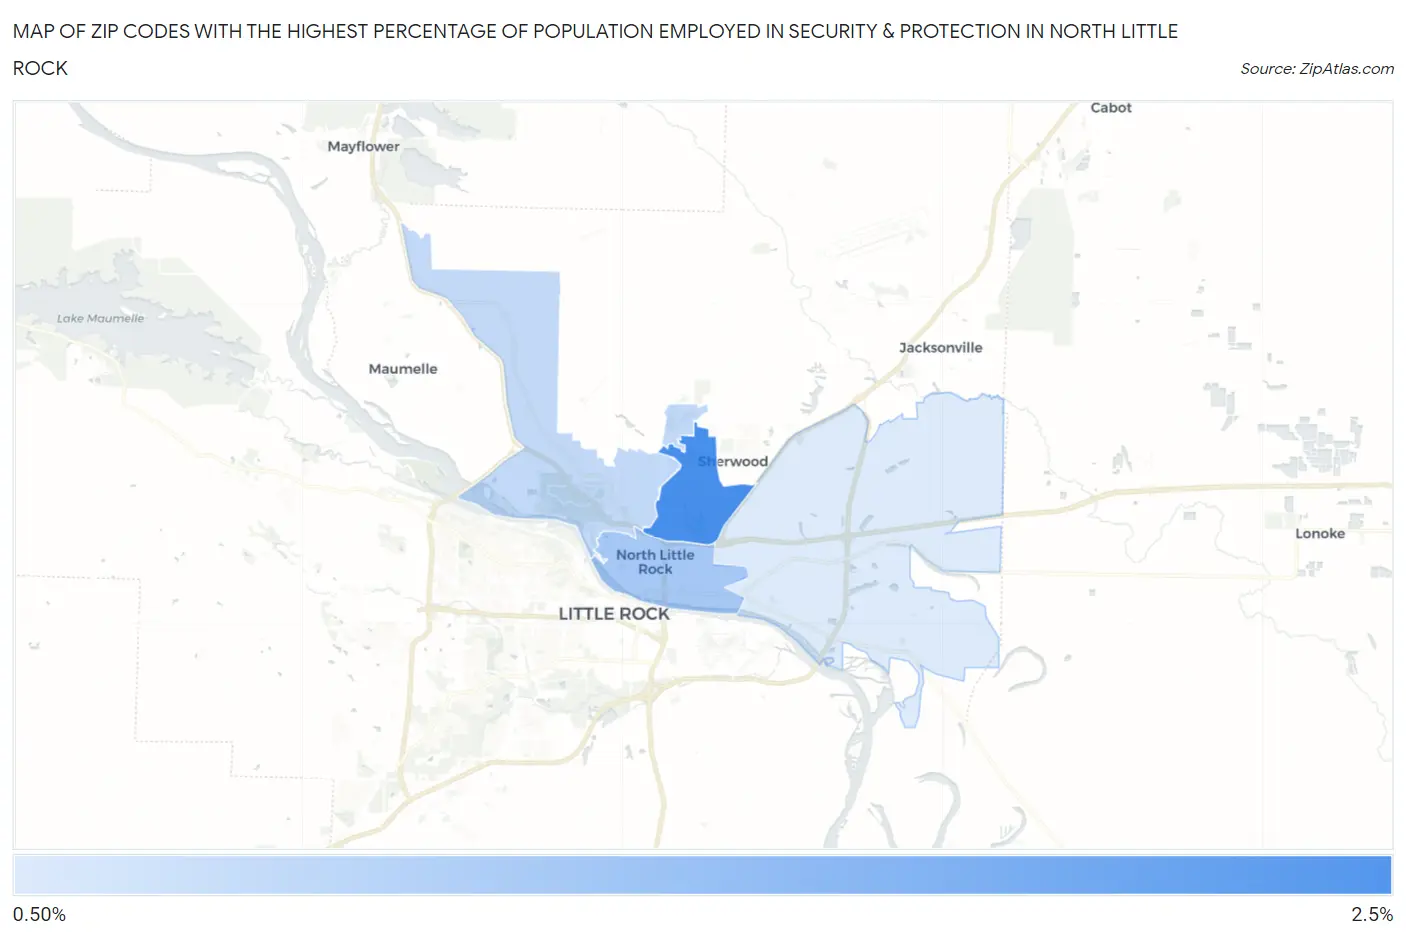
Map of Zip Codes with the Highest Percentage of Population Employed in Security & Protection in North Little Rock
0.0%
2.5%
Zip Codes with the Highest Percentage of Population Employed in Security & Protection in North Little Rock, AR
| Zip Code | % Employed | vs State | vs National | |
| 1. | 72116 | 2.1% | 2.0%(+0.109)#193 | 2.1%(-0.036)#11,822 |
| 2. | 72114 | 1.5% | 2.0%(-0.498)#246 | 2.1%(-0.642)#16,143 |
| 3. | 72118 | 1.3% | 2.0%(-0.687)#267 | 2.1%(-0.832)#17,607 |
| 4. | 72117 | 1.1% | 2.0%(-0.860)#284 | 2.1%(-1.00)#18,952 |
1
Common Questions
What are the Top 3 Zip Codes with the Highest Percentage of Population Employed in Security & Protection in North Little Rock, AR?
Top 3 Zip Codes with the Highest Percentage of Population Employed in Security & Protection in North Little Rock, AR are:
What zip code has the Highest Percentage of Population Employed in Security & Protection in North Little Rock, AR?
72116 has the Highest Percentage of Population Employed in Security & Protection in North Little Rock, AR with 2.1%.
What is the Percentage of Population Employed in Security & Protection in North Little Rock, AR?
Percentage of Population Employed in Security & Protection in North Little Rock is 1.4%.
What is the Percentage of Population Employed in Security & Protection in Arkansas?
Percentage of Population Employed in Security & Protection in Arkansas is 2.0%.
What is the Percentage of Population Employed in Security & Protection in the United States?
Percentage of Population Employed in Security & Protection in the United States is 2.1%.