Zip Codes with the Highest Percentage of French Population in North Little Rock, AR
RELATED REPORTS & OPTIONS
French
North Little Rock
Compare Zip Codes
Map of Zip Codes with the Highest Percentage of French Population in North Little Rock
0.00%
2.50%
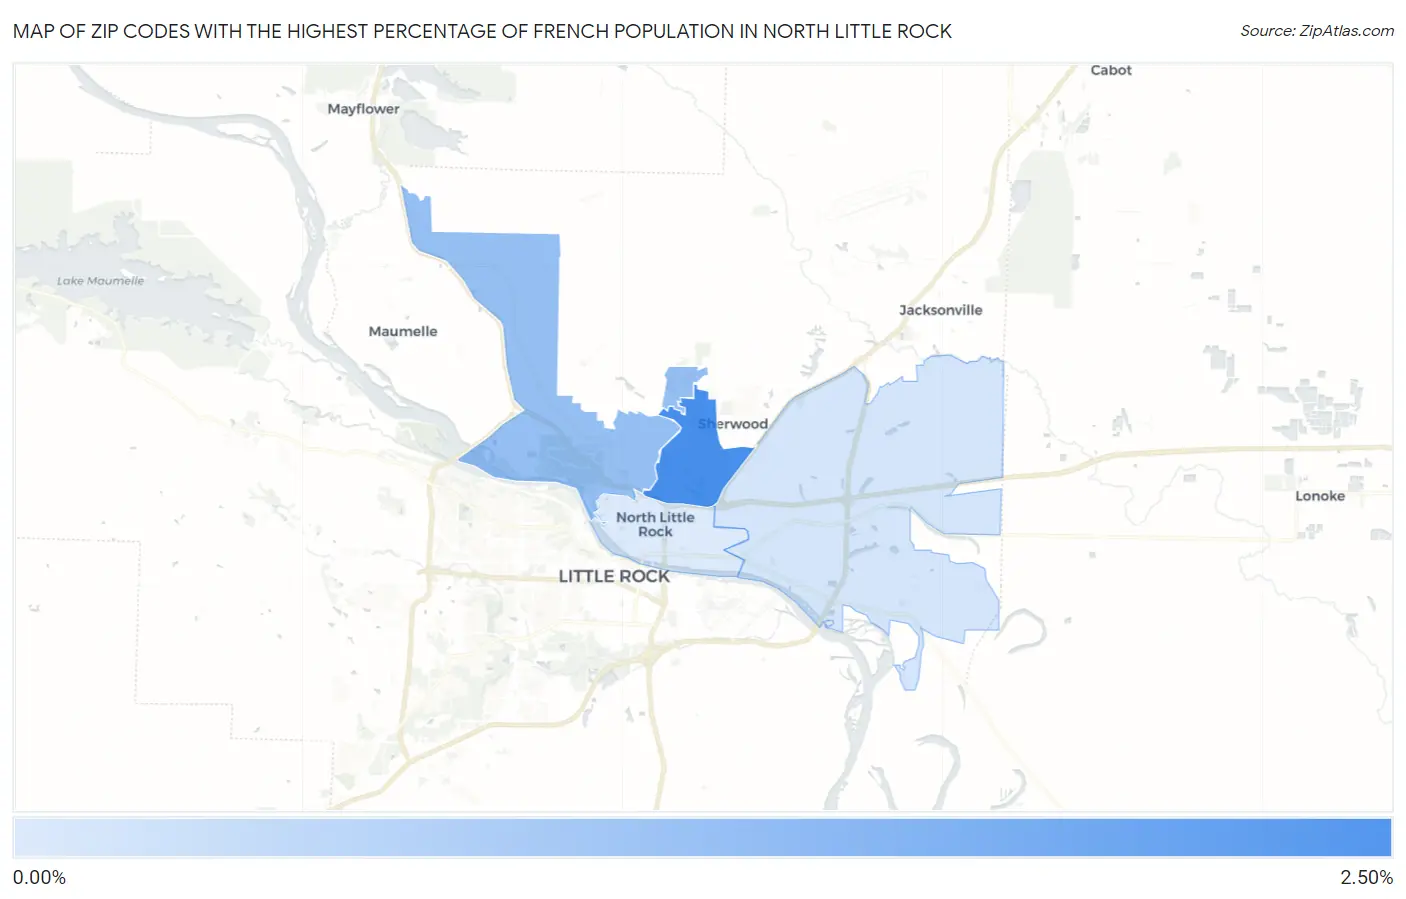
Zip Codes with the Highest Percentage of French Population in North Little Rock, AR
| Zip Code | French | vs State | vs National | |
| 1. | 72116 | 2.40% | 1.44%(+0.961)#110 | 2.07%(+0.338)#9,861 |
| 2. | 72118 | 1.37% | 1.44%(-0.068)#197 | 2.07%(-0.692)#16,753 |
| 3. | 72117 | 0.57% | 1.44%(-0.876)#306 | 2.07%(-1.50)#23,278 |
| 4. | 72114 | 0.44% | 1.44%(-1.00)#328 | 2.07%(-1.63)#24,293 |
1
Common Questions
What are the Top 3 Zip Codes with the Highest Percentage of French Population in North Little Rock, AR?
Top 3 Zip Codes with the Highest Percentage of French Population in North Little Rock, AR are:
What zip code has the Highest Percentage of French Population in North Little Rock, AR?
72116 has the Highest Percentage of French Population in North Little Rock, AR with 2.40%.
What is the Percentage of French Population in North Little Rock, AR?
Percentage of French Population in North Little Rock is 1.60%.
What is the Percentage of French Population in Arkansas?
Percentage of French Population in Arkansas is 1.44%.
What is the Percentage of French Population in the United States?
Percentage of French Population in the United States is 2.07%.