Zip Codes with the Highest Percentage of Peruvian Population in North Little Rock, AR
RELATED REPORTS & OPTIONS
Peruvian
North Little Rock
Compare Zip Codes
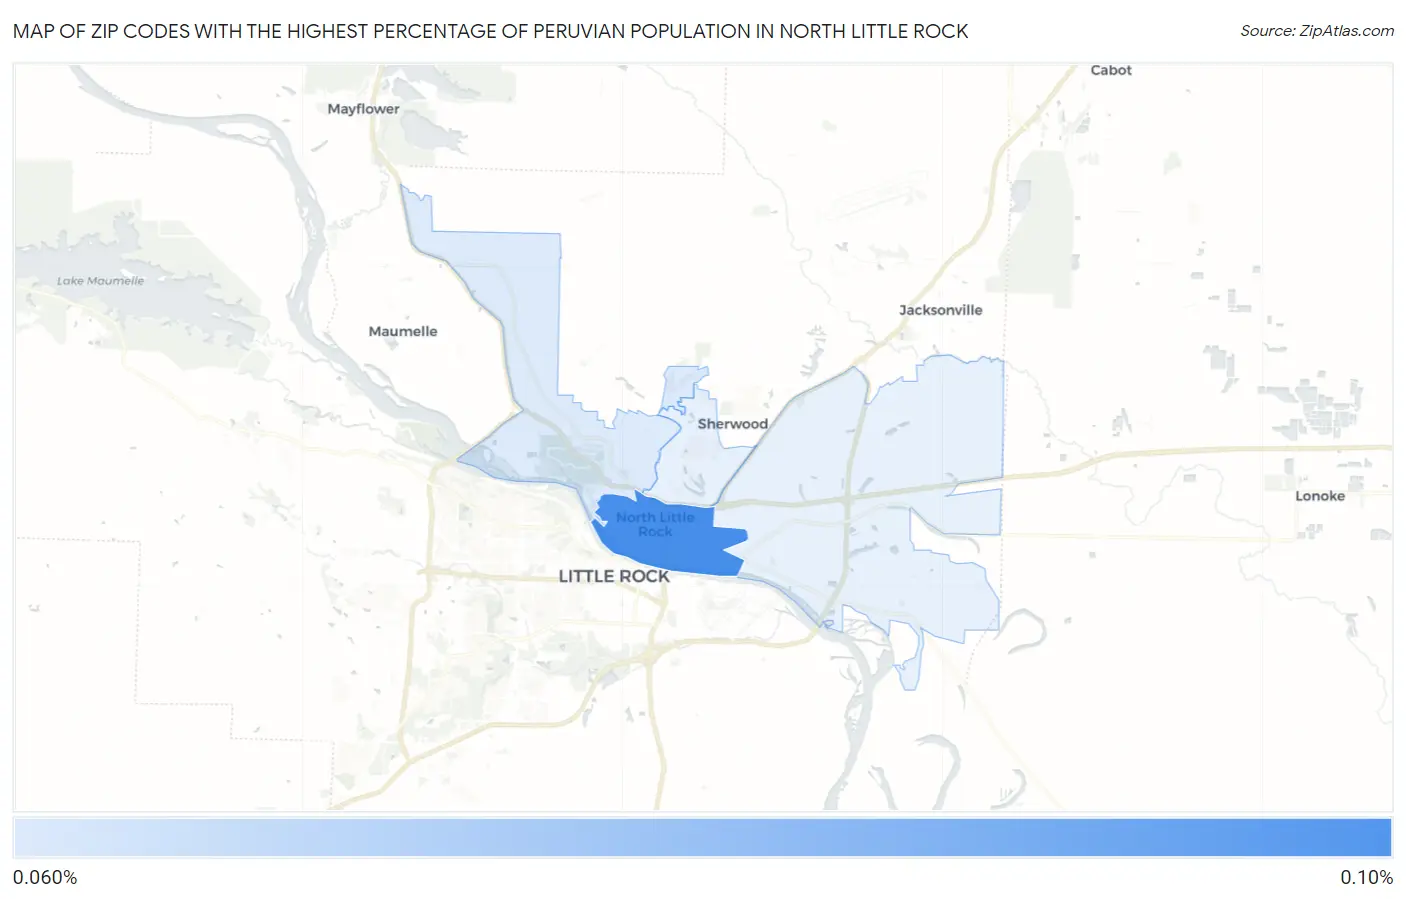
Map of Zip Codes with the Highest Percentage of Peruvian Population in North Little Rock
0.00%
0.10%
Zip Codes with the Highest Percentage of Peruvian Population in North Little Rock, AR
| Zip Code | Peruvian | vs State | vs National | |
| 1. | 72114 | 0.098% | 0.031%(+0.067)#19 | 0.22%(-0.117)#4,617 |
| 2. | 72118 | 0.069% | 0.031%(+0.039)#21 | 0.22%(-0.146)#5,135 |
1
Common Questions
What are the Top 3 Zip Codes with the Highest Percentage of Peruvian Population in North Little Rock, AR?
Top 3 Zip Codes with the Highest Percentage of Peruvian Population in North Little Rock, AR are:
What zip code has the Highest Percentage of Peruvian Population in North Little Rock, AR?
72114 has the Highest Percentage of Peruvian Population in North Little Rock, AR with 0.098%.
What is the Percentage of Peruvian Population in North Little Rock, AR?
Percentage of Peruvian Population in North Little Rock is 0.040%.
What is the Percentage of Peruvian Population in Arkansas?
Percentage of Peruvian Population in Arkansas is 0.031%.
What is the Percentage of Peruvian Population in the United States?
Percentage of Peruvian Population in the United States is 0.22%.