Zip Codes with the Highest Percentage of Population Employed in Security & Protection in Fort Smith, AR
RELATED REPORTS & OPTIONS
Security & Protection
Fort Smith
Compare Zip Codes
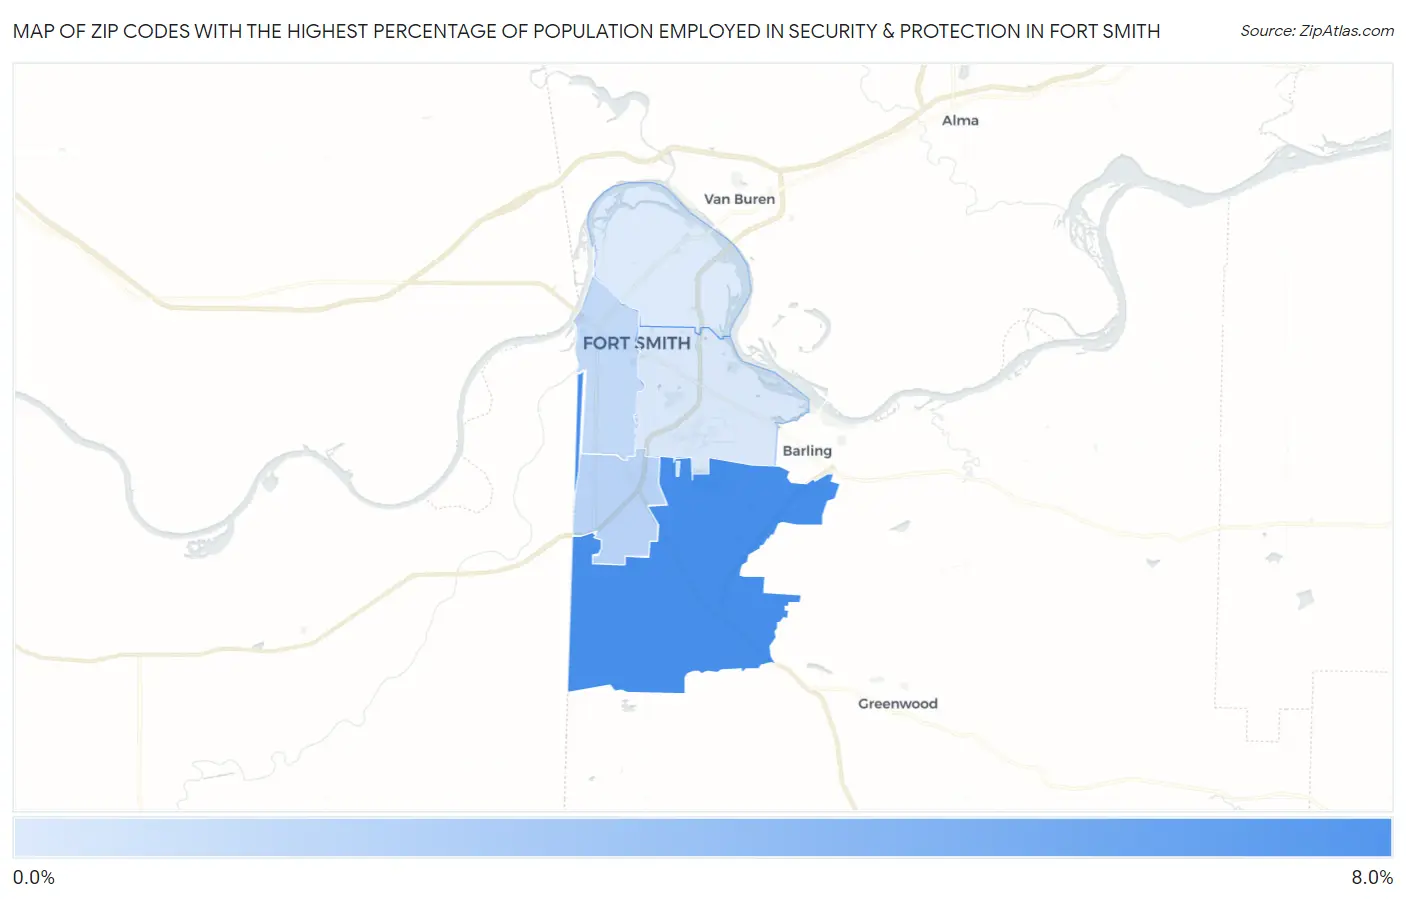
Map of Zip Codes with the Highest Percentage of Population Employed in Security & Protection in Fort Smith
0.0%
8.0%
Zip Codes with the Highest Percentage of Population Employed in Security & Protection in Fort Smith, AR
| Zip Code | % Employed | vs State | vs National | |
| 1. | 72916 | 6.4% | 2.0%(+4.35)#40 | 2.1%(+4.21)#1,857 |
| 2. | 72908 | 2.0% | 2.0%(+0.005)#203 | 2.1%(-0.140)#12,501 |
| 3. | 72901 | 1.7% | 2.0%(-0.296)#226 | 2.1%(-0.441)#14,617 |
| 4. | 72903 | 0.89% | 2.0%(-1.12)#311 | 2.1%(-1.26)#20,870 |
| 5. | 72904 | 0.67% | 2.0%(-1.33)#327 | 2.1%(-1.47)#22,244 |
1
Common Questions
What are the Top 3 Zip Codes with the Highest Percentage of Population Employed in Security & Protection in Fort Smith, AR?
Top 3 Zip Codes with the Highest Percentage of Population Employed in Security & Protection in Fort Smith, AR are:
What zip code has the Highest Percentage of Population Employed in Security & Protection in Fort Smith, AR?
72916 has the Highest Percentage of Population Employed in Security & Protection in Fort Smith, AR with 6.4%.
What is the Percentage of Population Employed in Security & Protection in Fort Smith, AR?
Percentage of Population Employed in Security & Protection in Fort Smith is 1.9%.
What is the Percentage of Population Employed in Security & Protection in Arkansas?
Percentage of Population Employed in Security & Protection in Arkansas is 2.0%.
What is the Percentage of Population Employed in Security & Protection in the United States?
Percentage of Population Employed in Security & Protection in the United States is 2.1%.