Zip Codes with the Highest Percentage of Population with a Degree in Liberal Arts and History in Fort Smith, AR
RELATED REPORTS & OPTIONS
Liberal Arts and History
Fort Smith
Compare Zip Codes
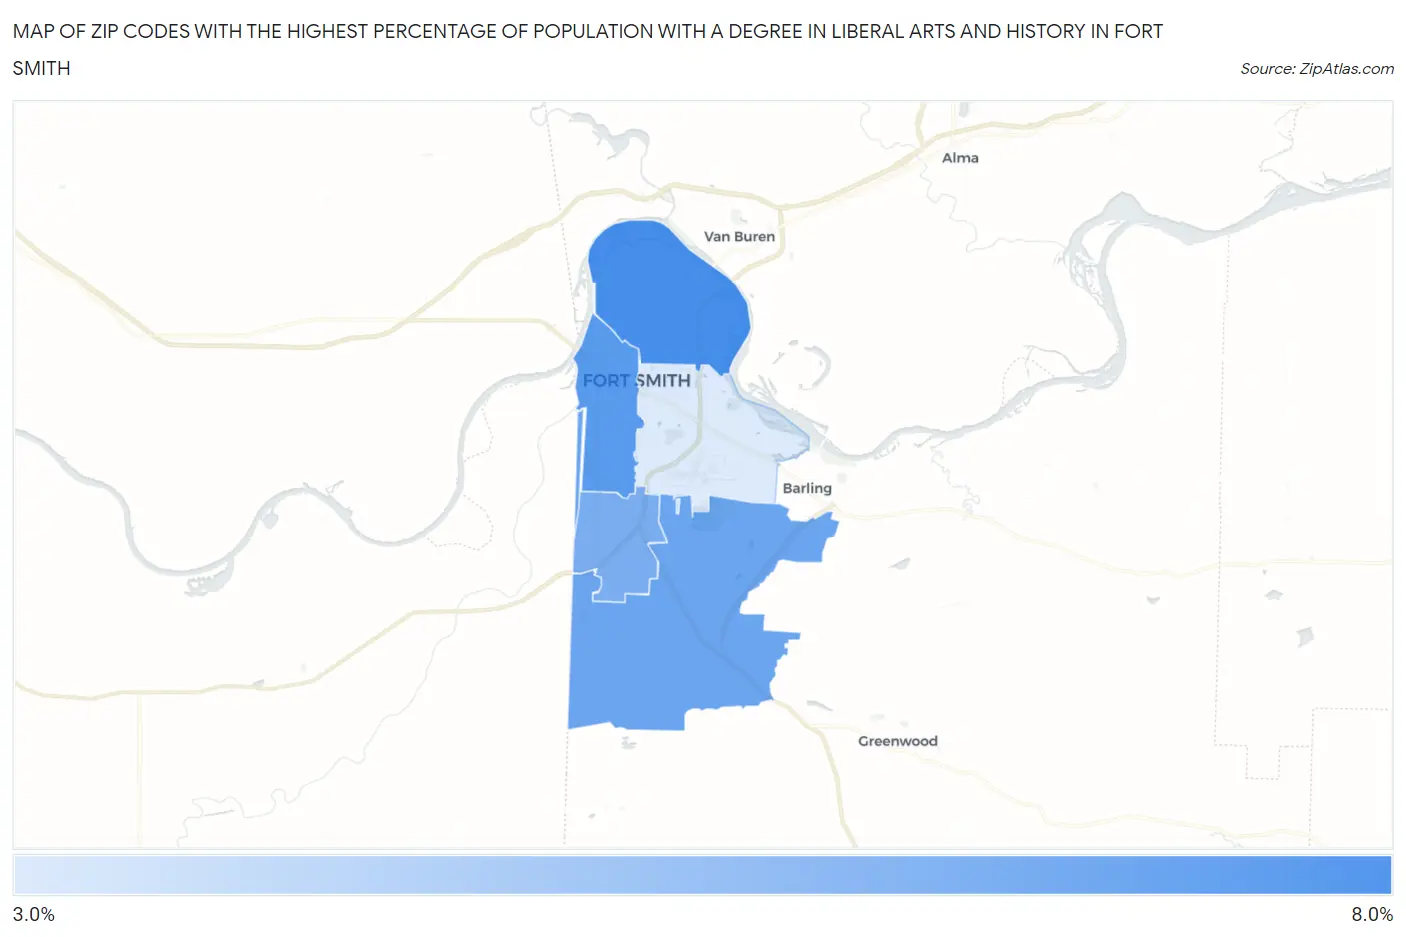
Map of Zip Codes with the Highest Percentage of Population with a Degree in Liberal Arts and History in Fort Smith
0.0%
8.0%
Zip Codes with the Highest Percentage of Population with a Degree in Liberal Arts and History in Fort Smith, AR
| Zip Code | % Graduates | vs State | vs National | |
| 1. | 72904 | 7.8% | 4.9%(+2.93)#92 | 4.9%(+2.96)#5,124 |
| 2. | 72901 | 7.3% | 4.9%(+2.44)#101 | 4.9%(+2.47)#5,807 |
| 3. | 72916 | 6.7% | 4.9%(+1.80)#123 | 4.9%(+1.83)#6,945 |
| 4. | 72908 | 6.3% | 4.9%(+1.41)#129 | 4.9%(+1.44)#7,764 |
| 5. | 72903 | 3.4% | 4.9%(-1.48)#232 | 4.9%(-1.46)#16,916 |
1
Common Questions
What are the Top 3 Zip Codes with the Highest Percentage of Population with a Degree in Liberal Arts and History in Fort Smith, AR?
Top 3 Zip Codes with the Highest Percentage of Population with a Degree in Liberal Arts and History in Fort Smith, AR are:
What zip code has the Highest Percentage of Population with a Degree in Liberal Arts and History in Fort Smith, AR?
72904 has the Highest Percentage of Population with a Degree in Liberal Arts and History in Fort Smith, AR with 7.8%.
What is the Percentage of Population with a Degree in Liberal Arts and History in Fort Smith, AR?
Percentage of Population with a Degree in Liberal Arts and History in Fort Smith is 5.8%.
What is the Percentage of Population with a Degree in Liberal Arts and History in Arkansas?
Percentage of Population with a Degree in Liberal Arts and History in Arkansas is 4.9%.
What is the Percentage of Population with a Degree in Liberal Arts and History in the United States?
Percentage of Population with a Degree in Liberal Arts and History in the United States is 4.9%.