Zip Codes with the Highest Percentage of Population Employed in Accommodation & Food Services in Fort Smith, AR
RELATED REPORTS & OPTIONS
Accommodation & Food Services
Fort Smith
Compare Zip Codes
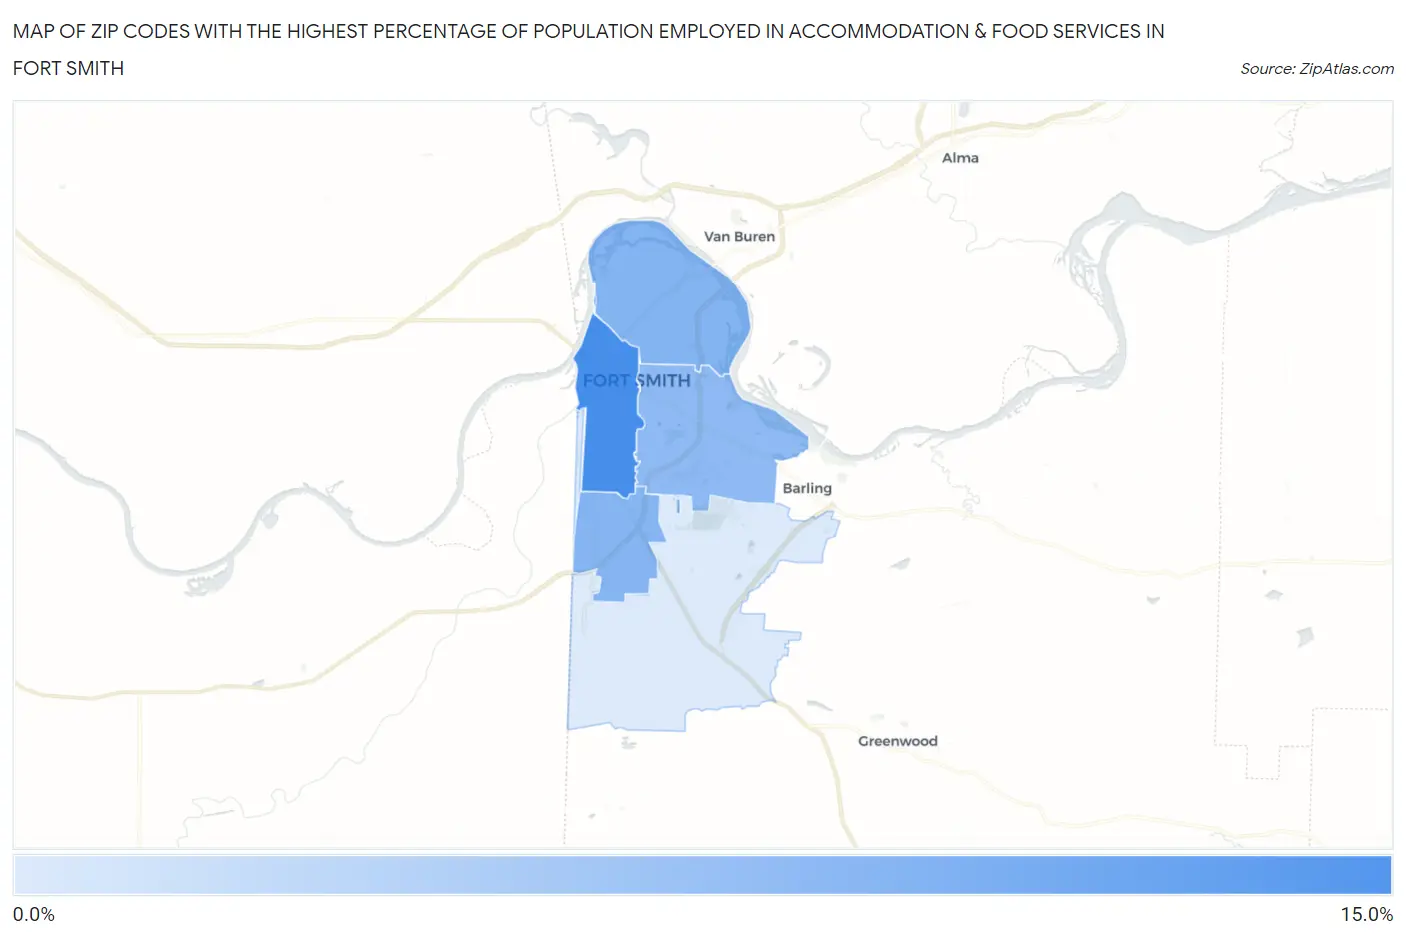
Map of Zip Codes with the Highest Percentage of Population Employed in Accommodation & Food Services in Fort Smith
0.0%
15.0%
Zip Codes with the Highest Percentage of Population Employed in Accommodation & Food Services in Fort Smith, AR
| Zip Code | % Employed | vs State | vs National | |
| 1. | 72901 | 11.1% | 6.6%(+4.41)#56 | 6.9%(+4.17)#3,510 |
| 2. | 72904 | 8.1% | 6.6%(+1.47)#110 | 6.9%(+1.23)#7,608 |
| 3. | 72908 | 8.1% | 6.6%(+1.43)#112 | 6.9%(+1.18)#7,697 |
| 4. | 72903 | 7.5% | 6.6%(+0.891)#126 | 6.9%(+0.649)#8,921 |
| 5. | 72916 | 3.9% | 6.6%(-2.75)#289 | 6.9%(-3.00)#20,525 |
1
Common Questions
What are the Top 3 Zip Codes with the Highest Percentage of Population Employed in Accommodation & Food Services in Fort Smith, AR?
Top 3 Zip Codes with the Highest Percentage of Population Employed in Accommodation & Food Services in Fort Smith, AR are:
What zip code has the Highest Percentage of Population Employed in Accommodation & Food Services in Fort Smith, AR?
72901 has the Highest Percentage of Population Employed in Accommodation & Food Services in Fort Smith, AR with 11.1%.
What is the Percentage of Population Employed in Accommodation & Food Services in Fort Smith, AR?
Percentage of Population Employed in Accommodation & Food Services in Fort Smith is 8.2%.
What is the Percentage of Population Employed in Accommodation & Food Services in Arkansas?
Percentage of Population Employed in Accommodation & Food Services in Arkansas is 6.6%.
What is the Percentage of Population Employed in Accommodation & Food Services in the United States?
Percentage of Population Employed in Accommodation & Food Services in the United States is 6.9%.