Zip Codes with the Highest Percentage of Population Employed in Architecture & Engineering in Bella Vista, AR
RELATED REPORTS & OPTIONS
Architecture & Engineering
Bella Vista
Compare Zip Codes
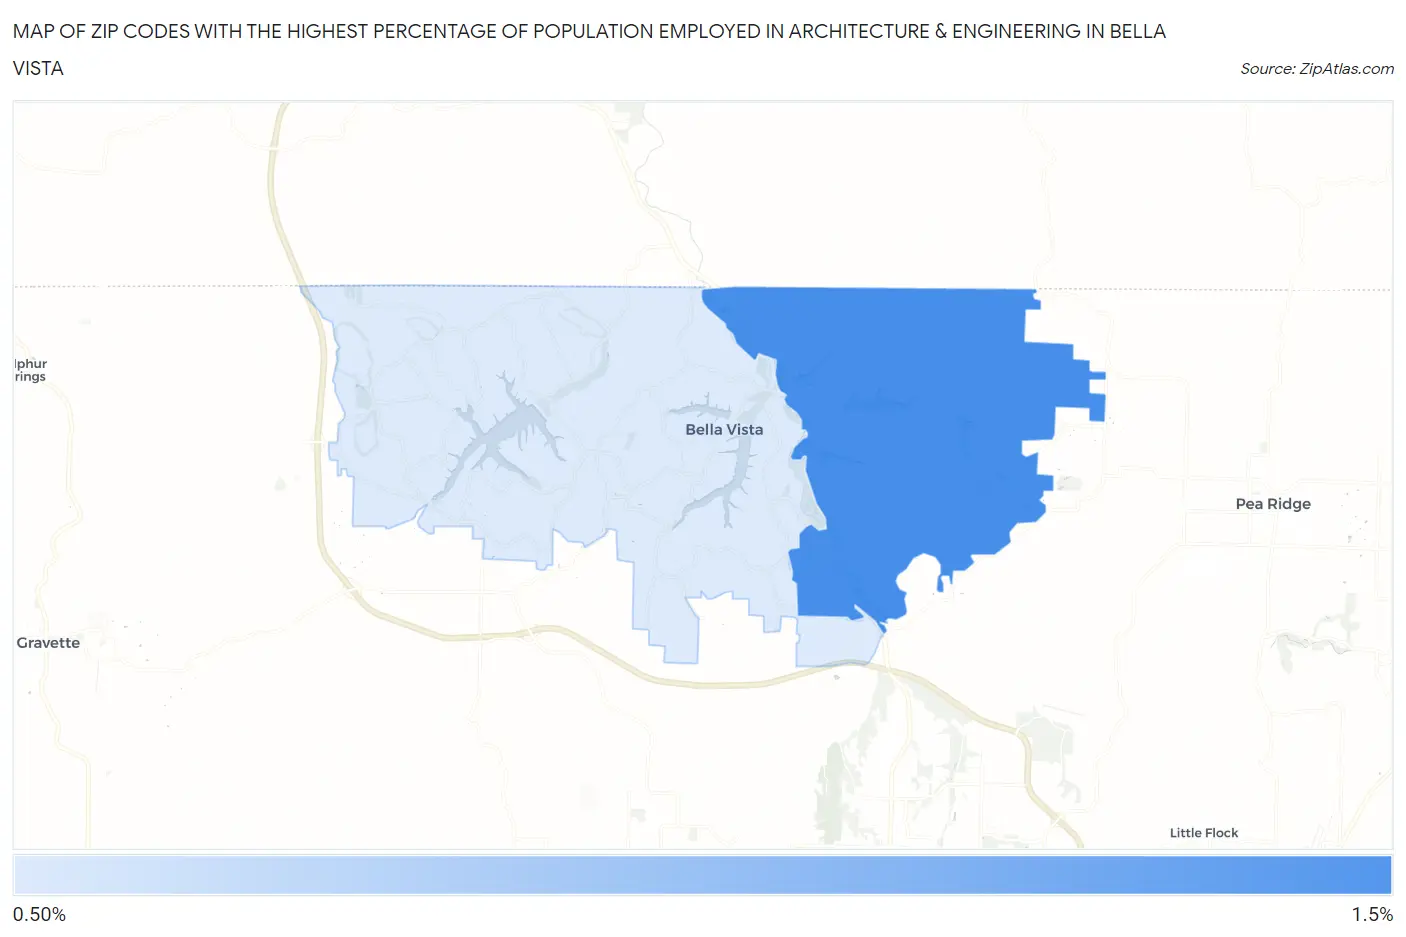
Map of Zip Codes with the Highest Percentage of Population Employed in Architecture & Engineering in Bella Vista
0.0%
1.5%
Zip Codes with the Highest Percentage of Population Employed in Architecture & Engineering in Bella Vista, AR
| Zip Code | % Employed | vs State | vs National | |
| 1. | 72714 | 1.3% | 1.3%(+0.029)#120 | 2.1%(-0.850)#14,308 |
| 2. | 72715 | 0.88% | 1.3%(-0.393)#173 | 2.1%(-1.27)#17,548 |
1
Common Questions
What are the Top Zip Codes with the Highest Percentage of Population Employed in Architecture & Engineering in Bella Vista, AR?
Top Zip Codes with the Highest Percentage of Population Employed in Architecture & Engineering in Bella Vista, AR are:
What zip code has the Highest Percentage of Population Employed in Architecture & Engineering in Bella Vista, AR?
72714 has the Highest Percentage of Population Employed in Architecture & Engineering in Bella Vista, AR with 1.3%.
What is the Percentage of Population Employed in Architecture & Engineering in Bella Vista, AR?
Percentage of Population Employed in Architecture & Engineering in Bella Vista is 1.1%.
What is the Percentage of Population Employed in Architecture & Engineering in Arkansas?
Percentage of Population Employed in Architecture & Engineering in Arkansas is 1.3%.
What is the Percentage of Population Employed in Architecture & Engineering in the United States?
Percentage of Population Employed in Architecture & Engineering in the United States is 2.1%.