Zip Codes with the Highest Percentage of Population Employed in Accommodation & Food Services in Bella Vista, AR
RELATED REPORTS & OPTIONS
Accommodation & Food Services
Bella Vista
Compare Zip Codes
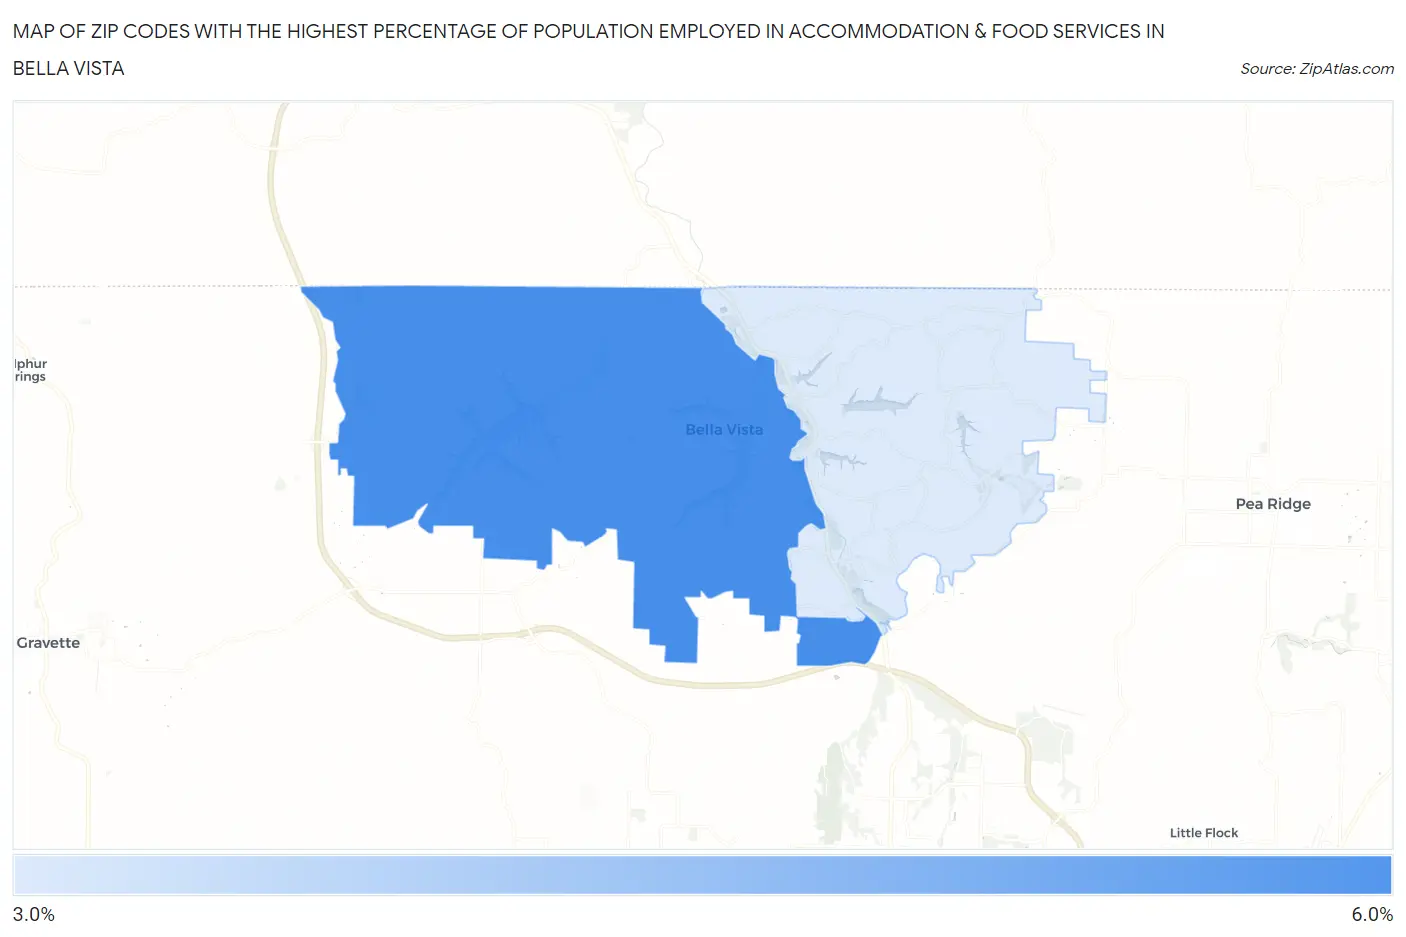
Map of Zip Codes with the Highest Percentage of Population Employed in Accommodation & Food Services in Bella Vista
0.0%
6.0%
Zip Codes with the Highest Percentage of Population Employed in Accommodation & Food Services in Bella Vista, AR
| Zip Code | % Employed | vs State | vs National | |
| 1. | 72715 | 5.1% | 6.6%(-1.49)#223 | 6.9%(-1.73)#16,283 |
| 2. | 72714 | 3.7% | 6.6%(-2.96)#298 | 6.9%(-3.20)#21,194 |
1
Common Questions
What are the Top Zip Codes with the Highest Percentage of Population Employed in Accommodation & Food Services in Bella Vista, AR?
Top Zip Codes with the Highest Percentage of Population Employed in Accommodation & Food Services in Bella Vista, AR are:
What zip code has the Highest Percentage of Population Employed in Accommodation & Food Services in Bella Vista, AR?
72715 has the Highest Percentage of Population Employed in Accommodation & Food Services in Bella Vista, AR with 5.1%.
What is the Percentage of Population Employed in Accommodation & Food Services in Bella Vista, AR?
Percentage of Population Employed in Accommodation & Food Services in Bella Vista is 4.5%.
What is the Percentage of Population Employed in Accommodation & Food Services in Arkansas?
Percentage of Population Employed in Accommodation & Food Services in Arkansas is 6.6%.
What is the Percentage of Population Employed in Accommodation & Food Services in the United States?
Percentage of Population Employed in Accommodation & Food Services in the United States is 6.9%.