Zip Codes with the Highest Percentage of Population Employed in Arts, Entertainment & Recreation in Bella Vista, AR
RELATED REPORTS & OPTIONS
Arts, Entertainment & Recreation
Bella Vista
Compare Zip Codes
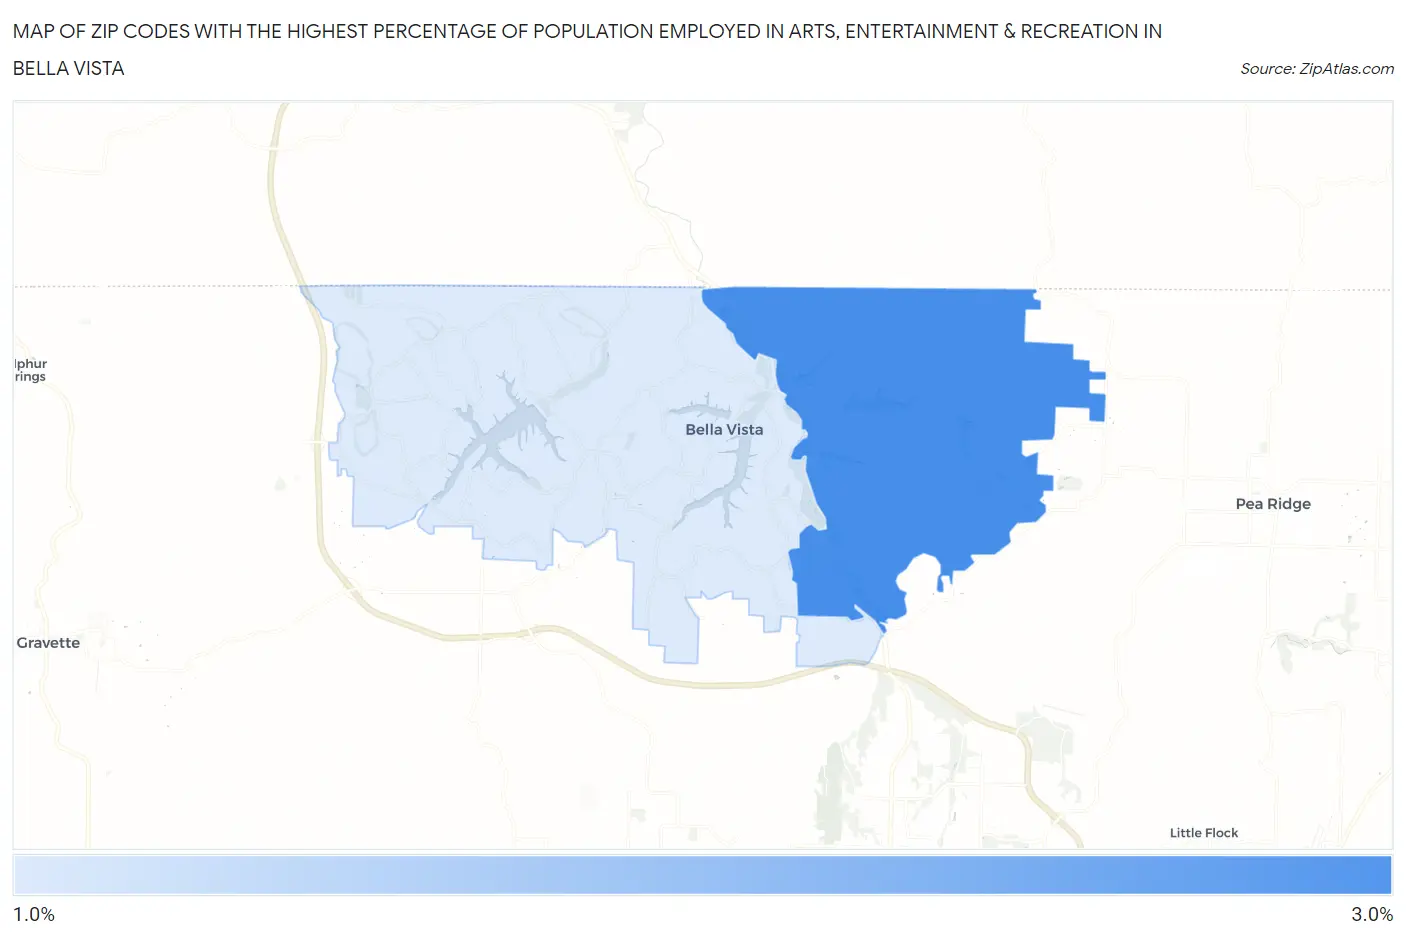
Map of Zip Codes with the Highest Percentage of Population Employed in Arts, Entertainment & Recreation in Bella Vista
0.0%
3.0%
Zip Codes with the Highest Percentage of Population Employed in Arts, Entertainment & Recreation in Bella Vista, AR
| Zip Code | % Employed | vs State | vs National | |
| 1. | 72714 | 2.6% | 1.3%(+1.35)#71 | 2.1%(+0.563)#6,575 |
| 2. | 72715 | 1.2% | 1.3%(-0.146)#161 | 2.1%(-0.932)#15,863 |
1
Common Questions
What are the Top Zip Codes with the Highest Percentage of Population Employed in Arts, Entertainment & Recreation in Bella Vista, AR?
Top Zip Codes with the Highest Percentage of Population Employed in Arts, Entertainment & Recreation in Bella Vista, AR are:
What zip code has the Highest Percentage of Population Employed in Arts, Entertainment & Recreation in Bella Vista, AR?
72714 has the Highest Percentage of Population Employed in Arts, Entertainment & Recreation in Bella Vista, AR with 2.6%.
What is the Percentage of Population Employed in Arts, Entertainment & Recreation in Bella Vista, AR?
Percentage of Population Employed in Arts, Entertainment & Recreation in Bella Vista is 1.9%.
What is the Percentage of Population Employed in Arts, Entertainment & Recreation in Arkansas?
Percentage of Population Employed in Arts, Entertainment & Recreation in Arkansas is 1.3%.
What is the Percentage of Population Employed in Arts, Entertainment & Recreation in the United States?
Percentage of Population Employed in Arts, Entertainment & Recreation in the United States is 2.1%.