Zip Codes with the Highest Percentage of Population with a Degree in Arts and Humanities in Mobile, AL
RELATED REPORTS & OPTIONS
Arts and Humanities
Mobile
Compare Zip Codes
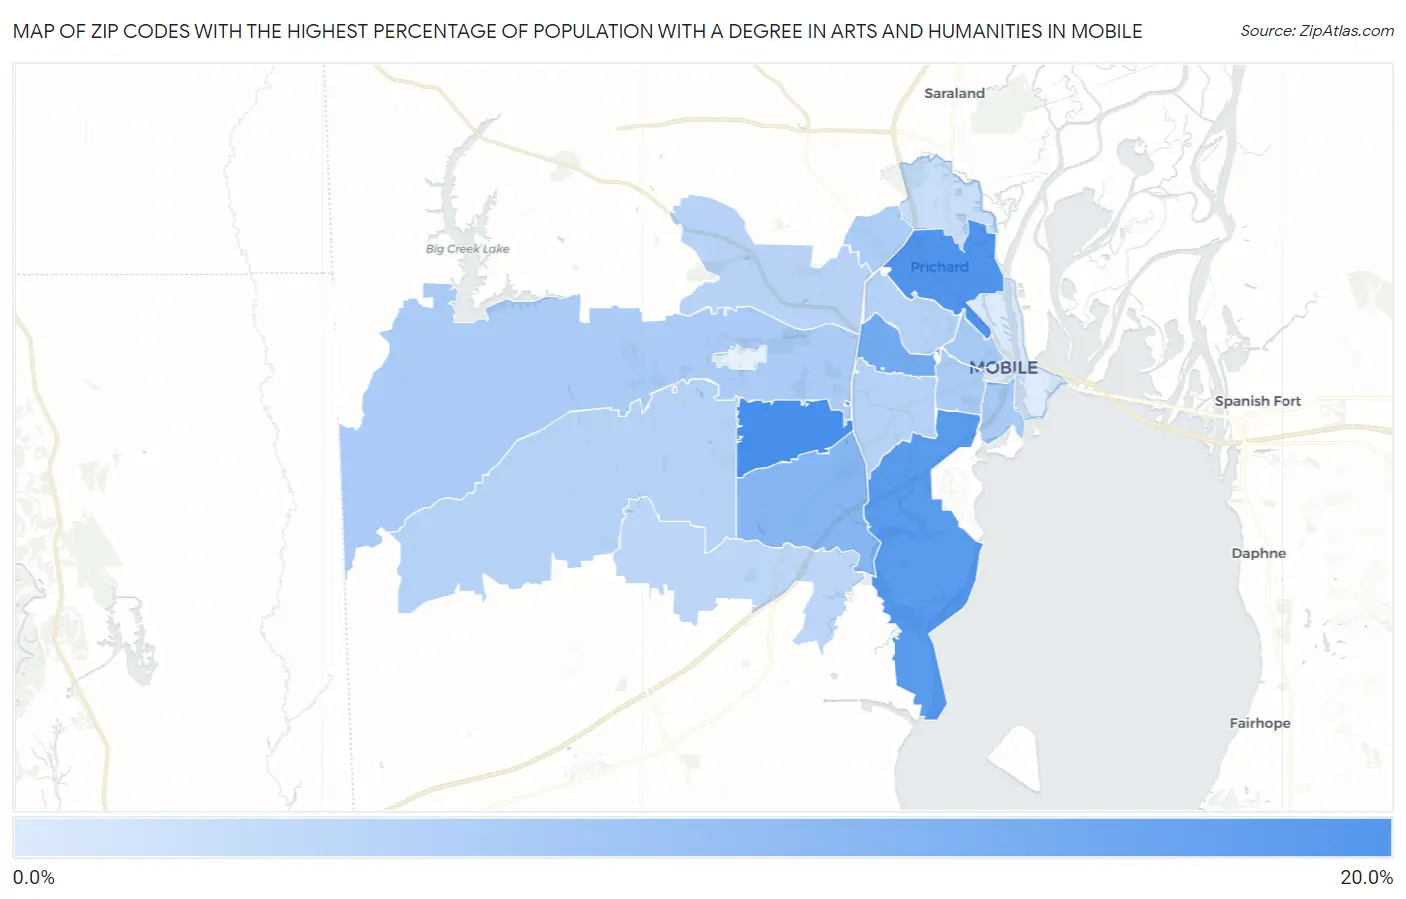
Map of Zip Codes with the Highest Percentage of Population with a Degree in Arts and Humanities in Mobile
0.0%
20.0%
Zip Codes with the Highest Percentage of Population with a Degree in Arts and Humanities in Mobile, AL
| Zip Code | % Graduates | vs State | vs National | |
| 1. | 36609 | 15.2% | 7.2%(+7.97)#57 | 6.0%(+9.18)#2,608 |
| 2. | 36610 | 14.5% | 7.2%(+7.30)#71 | 6.0%(+8.51)#2,878 |
| 3. | 36605 | 13.6% | 7.2%(+6.44)#82 | 6.0%(+7.65)#3,287 |
| 4. | 36607 | 11.0% | 7.2%(+3.79)#128 | 6.0%(+5.00)#5,145 |
| 5. | 36693 | 9.3% | 7.2%(+2.13)#168 | 6.0%(+3.34)#7,198 |
| 6. | 36603 | 6.1% | 7.2%(-1.06)#289 | 6.0%(+0.150)#14,254 |
| 7. | 36608 | 5.9% | 7.2%(-1.31)#307 | 6.0%(-0.097)#14,963 |
| 8. | 36604 | 5.8% | 7.2%(-1.41)#314 | 6.0%(-0.205)#15,267 |
| 9. | 36612 | 5.8% | 7.2%(-1.43)#315 | 6.0%(-0.219)#15,301 |
| 10. | 36606 | 4.9% | 7.2%(-2.28)#357 | 6.0%(-1.07)#17,835 |
| 11. | 36617 | 4.9% | 7.2%(-2.34)#365 | 6.0%(-1.13)#17,993 |
| 12. | 36695 | 4.8% | 7.2%(-2.44)#368 | 6.0%(-1.23)#18,260 |
| 13. | 36618 | 4.7% | 7.2%(-2.53)#373 | 6.0%(-1.32)#18,514 |
| 14. | 36619 | 4.2% | 7.2%(-2.97)#393 | 6.0%(-1.76)#19,712 |
| 15. | 36611 | 3.2% | 7.2%(-4.05)#435 | 6.0%(-2.84)#22,351 |
| 16. | 36602 | 1.4% | 7.2%(-5.77)#471 | 6.0%(-4.56)#25,017 |
1
Common Questions
What are the Top 10 Zip Codes with the Highest Percentage of Population with a Degree in Arts and Humanities in Mobile, AL?
Top 10 Zip Codes with the Highest Percentage of Population with a Degree in Arts and Humanities in Mobile, AL are:
What zip code has the Highest Percentage of Population with a Degree in Arts and Humanities in Mobile, AL?
36609 has the Highest Percentage of Population with a Degree in Arts and Humanities in Mobile, AL with 15.2%.
What is the Percentage of Population with a Degree in Arts and Humanities in Mobile, AL?
Percentage of Population with a Degree in Arts and Humanities in Mobile is 7.7%.
What is the Percentage of Population with a Degree in Arts and Humanities in Alabama?
Percentage of Population with a Degree in Arts and Humanities in Alabama is 7.2%.
What is the Percentage of Population with a Degree in Arts and Humanities in the United States?
Percentage of Population with a Degree in Arts and Humanities in the United States is 6.0%.