Zip Codes with the Highest Percentage of Population Employed in Life, Physical & Social Science in Mobile, AL
RELATED REPORTS & OPTIONS
Life, Physical & Social Science
Mobile
Compare Zip Codes
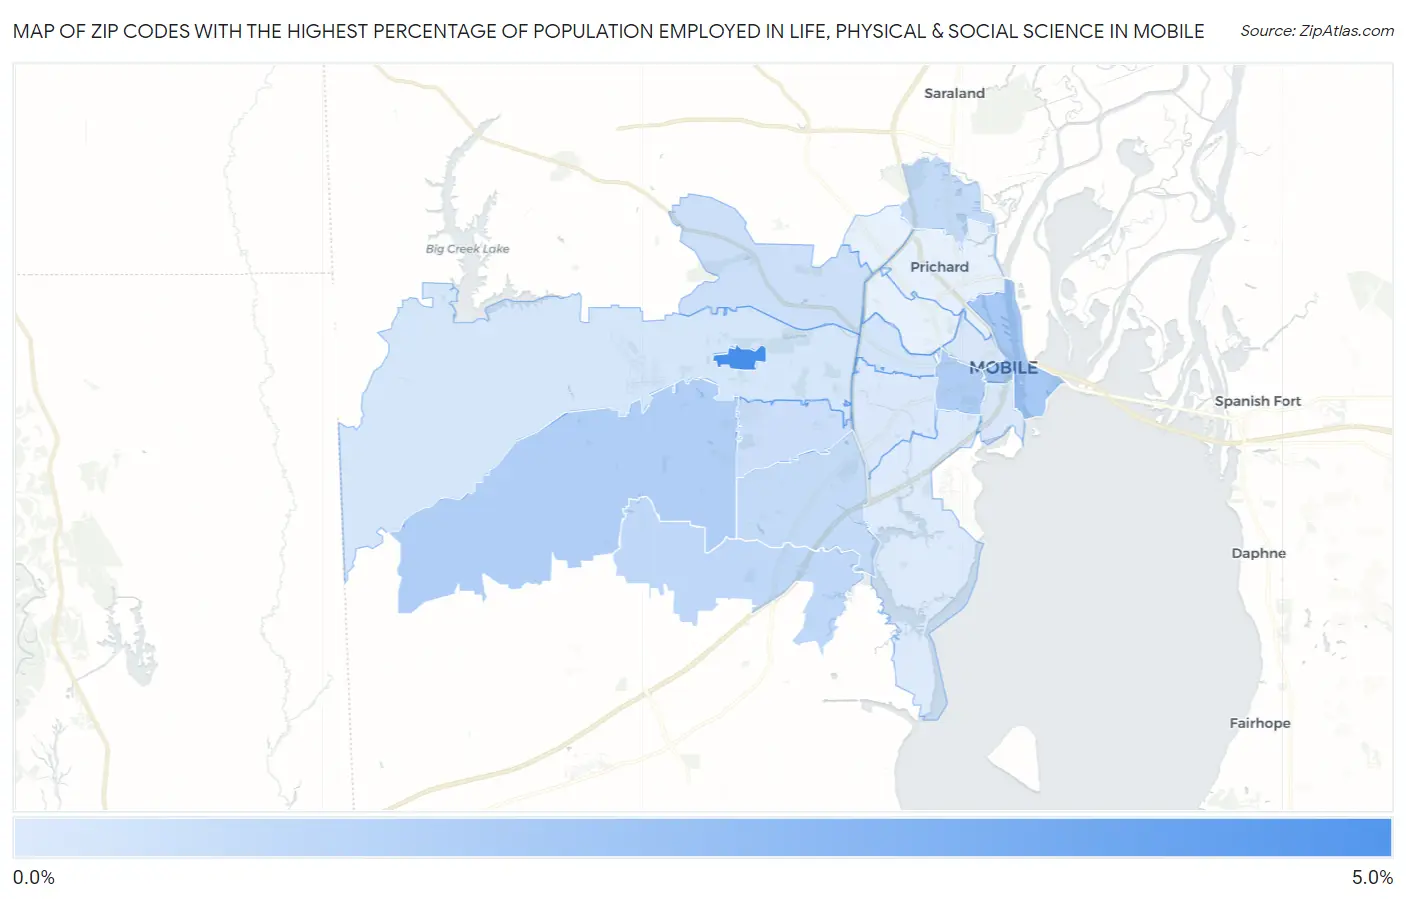
Map of Zip Codes with the Highest Percentage of Population Employed in Life, Physical & Social Science in Mobile
0.0%
5.0%
Zip Codes with the Highest Percentage of Population Employed in Life, Physical & Social Science in Mobile, AL
| Zip Code | % Employed | vs State | vs National | |
| 1. | 36688 | 4.7% | 0.74%(+3.91)#13 | 1.1%(+3.56)#865 |
| 2. | 36602 | 1.8% | 0.74%(+1.03)#48 | 1.1%(+0.677)#4,452 |
| 3. | 36604 | 1.5% | 0.74%(+0.790)#62 | 1.1%(+0.441)#5,484 |
| 4. | 36695 | 1.4% | 0.74%(+0.692)#67 | 1.1%(+0.343)#6,002 |
| 5. | 36619 | 1.0% | 0.74%(+0.270)#113 | 1.1%(-0.079)#8,956 |
| 6. | 36693 | 0.88% | 0.74%(+0.141)#131 | 1.1%(-0.208)#10,117 |
| 7. | 36611 | 0.88% | 0.74%(+0.138)#132 | 1.1%(-0.211)#10,141 |
| 8. | 36609 | 0.72% | 0.74%(-0.021)#167 | 1.1%(-0.370)#11,802 |
| 9. | 36618 | 0.66% | 0.74%(-0.084)#179 | 1.1%(-0.433)#12,558 |
| 10. | 36607 | 0.45% | 0.74%(-0.293)#231 | 1.1%(-0.642)#15,149 |
| 11. | 36608 | 0.34% | 0.74%(-0.399)#253 | 1.1%(-0.747)#16,488 |
| 12. | 36603 | 0.30% | 0.74%(-0.438)#262 | 1.1%(-0.786)#17,013 |
| 13. | 36606 | 0.21% | 0.74%(-0.531)#284 | 1.1%(-0.880)#18,066 |
| 14. | 36605 | 0.15% | 0.74%(-0.588)#299 | 1.1%(-0.937)#18,649 |
1
Common Questions
What are the Top 10 Zip Codes with the Highest Percentage of Population Employed in Life, Physical & Social Science in Mobile, AL?
Top 10 Zip Codes with the Highest Percentage of Population Employed in Life, Physical & Social Science in Mobile, AL are:
What zip code has the Highest Percentage of Population Employed in Life, Physical & Social Science in Mobile, AL?
36688 has the Highest Percentage of Population Employed in Life, Physical & Social Science in Mobile, AL with 4.7%.
What is the Percentage of Population Employed in Life, Physical & Social Science in Mobile, AL?
Percentage of Population Employed in Life, Physical & Social Science in Mobile is 0.61%.
What is the Percentage of Population Employed in Life, Physical & Social Science in Alabama?
Percentage of Population Employed in Life, Physical & Social Science in Alabama is 0.74%.
What is the Percentage of Population Employed in Life, Physical & Social Science in the United States?
Percentage of Population Employed in Life, Physical & Social Science in the United States is 1.1%.