Zip Codes with the Highest Percentage of Population with a Degree in Visual and Performing Arts in Cullman, AL
RELATED REPORTS & OPTIONS
Visual and Performing Arts
Cullman
Compare Zip Codes
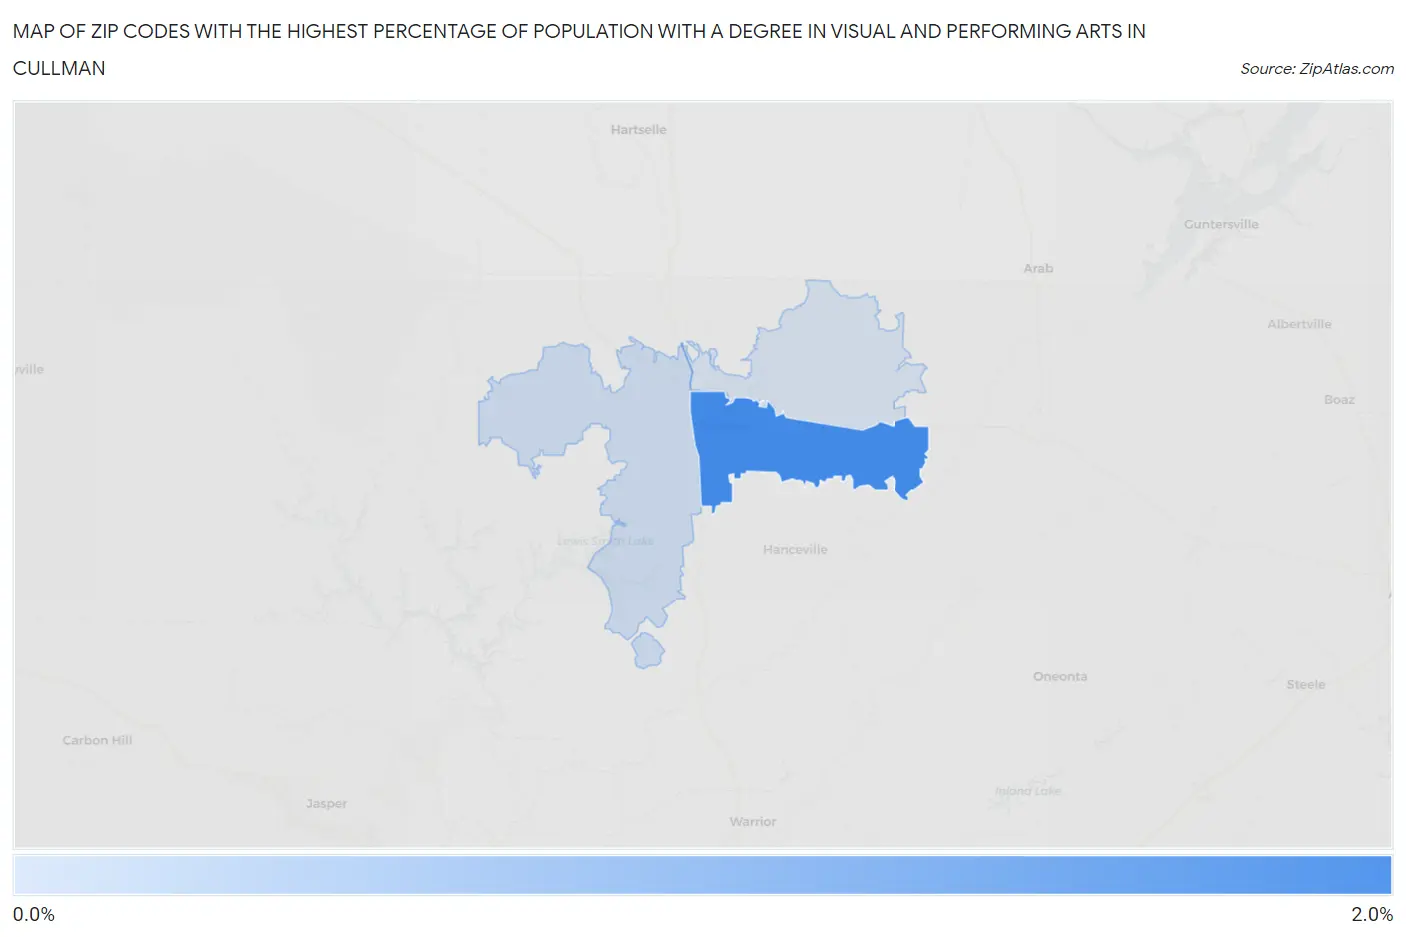
Map of Zip Codes with the Highest Percentage of Population with a Degree in Visual and Performing Arts in Cullman
0.0%
2.0%
Zip Codes with the Highest Percentage of Population with a Degree in Visual and Performing Arts in Cullman, AL
| Zip Code | % Graduates | vs State | vs National | |
| 1. | 35055 | 1.8% | 2.9%(-1.06)#247 | 4.3%(-2.41)#16,997 |
| 2. | 35057 | 0.11% | 2.9%(-2.79)#349 | 4.3%(-4.14)#21,234 |
1
Common Questions
What are the Top Zip Codes with the Highest Percentage of Population with a Degree in Visual and Performing Arts in Cullman, AL?
Top Zip Codes with the Highest Percentage of Population with a Degree in Visual and Performing Arts in Cullman, AL are:
What zip code has the Highest Percentage of Population with a Degree in Visual and Performing Arts in Cullman, AL?
35055 has the Highest Percentage of Population with a Degree in Visual and Performing Arts in Cullman, AL with 1.8%.
What is the Percentage of Population with a Degree in Visual and Performing Arts in Cullman, AL?
Percentage of Population with a Degree in Visual and Performing Arts in Cullman is 1.9%.
What is the Percentage of Population with a Degree in Visual and Performing Arts in Alabama?
Percentage of Population with a Degree in Visual and Performing Arts in Alabama is 2.9%.
What is the Percentage of Population with a Degree in Visual and Performing Arts in the United States?
Percentage of Population with a Degree in Visual and Performing Arts in the United States is 4.3%.