Zip Codes with the Highest Percentage of Population Employed in Health Diagnosing & Treating in Cullman, AL
RELATED REPORTS & OPTIONS
Health Diagnosing & Treating
Cullman
Compare Zip Codes
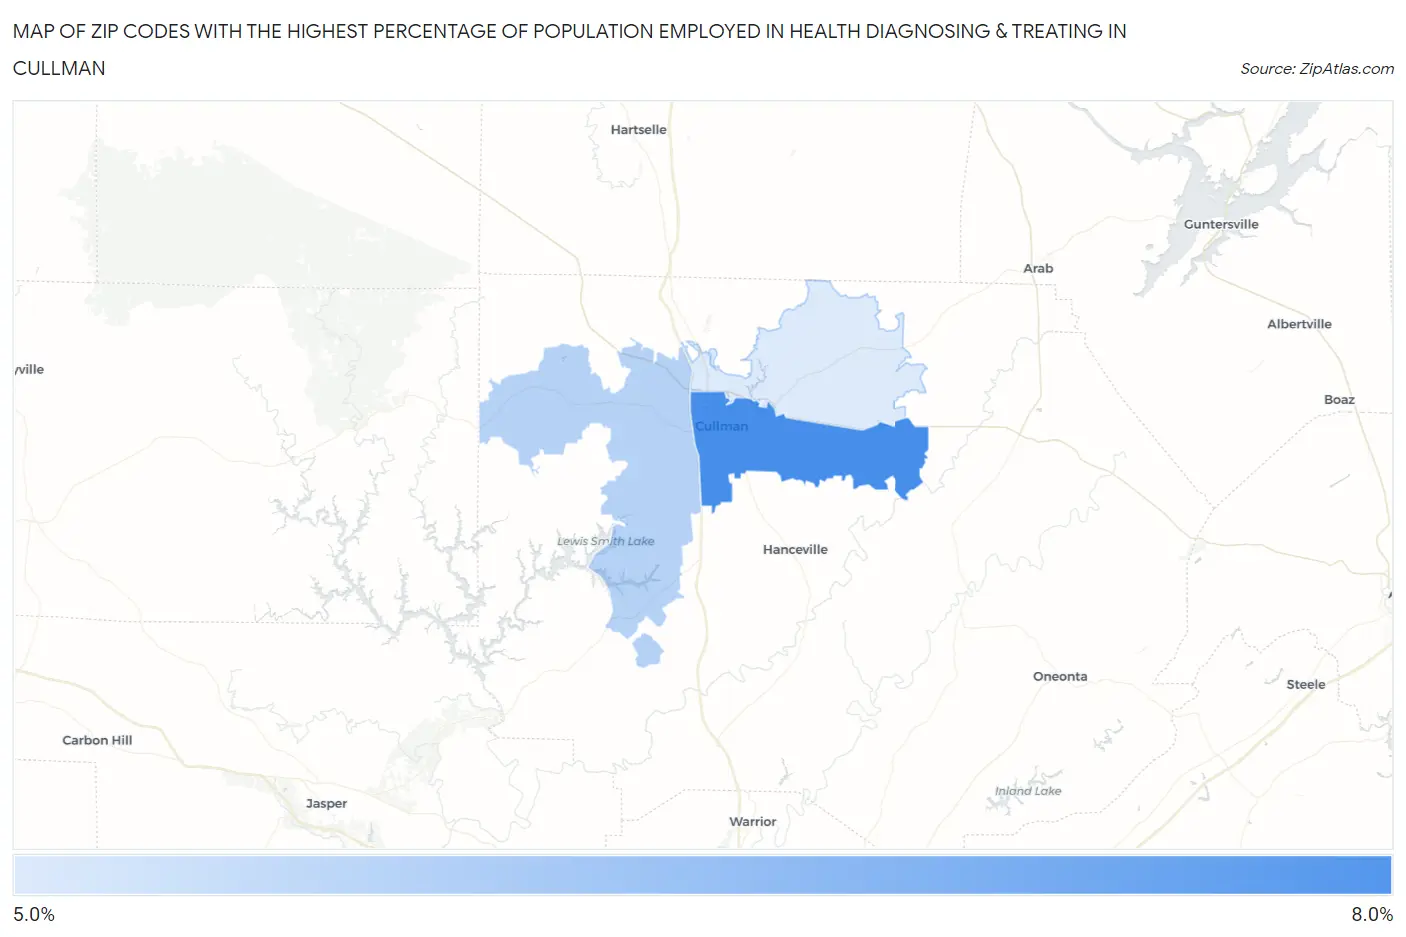
Map of Zip Codes with the Highest Percentage of Population Employed in Health Diagnosing & Treating in Cullman
0.0%
8.0%
Zip Codes with the Highest Percentage of Population Employed in Health Diagnosing & Treating in Cullman, AL
| Zip Code | % Employed | vs State | vs National | |
| 1. | 35055 | 7.5% | 7.0%(+0.449)#209 | 6.2%(+1.23)#8,902 |
| 2. | 35057 | 5.7% | 7.0%(-1.31)#319 | 6.2%(-0.534)#14,958 |
| 3. | 35058 | 5.1% | 7.0%(-1.92)#357 | 6.2%(-1.14)#17,308 |
1
Common Questions
What are the Top Zip Codes with the Highest Percentage of Population Employed in Health Diagnosing & Treating in Cullman, AL?
Top Zip Codes with the Highest Percentage of Population Employed in Health Diagnosing & Treating in Cullman, AL are:
What zip code has the Highest Percentage of Population Employed in Health Diagnosing & Treating in Cullman, AL?
35055 has the Highest Percentage of Population Employed in Health Diagnosing & Treating in Cullman, AL with 7.5%.
What is the Percentage of Population Employed in Health Diagnosing & Treating in Cullman, AL?
Percentage of Population Employed in Health Diagnosing & Treating in Cullman is 7.4%.
What is the Percentage of Population Employed in Health Diagnosing & Treating in Alabama?
Percentage of Population Employed in Health Diagnosing & Treating in Alabama is 7.0%.
What is the Percentage of Population Employed in Health Diagnosing & Treating in the United States?
Percentage of Population Employed in Health Diagnosing & Treating in the United States is 6.2%.