Cities with the Highest Percentage of Births to Unmarried Women over the Age of 35 in Alabama
RELATED REPORTS & OPTIONS
Highest Illegitimacy | Women 35+
Alabama
Compare Cities
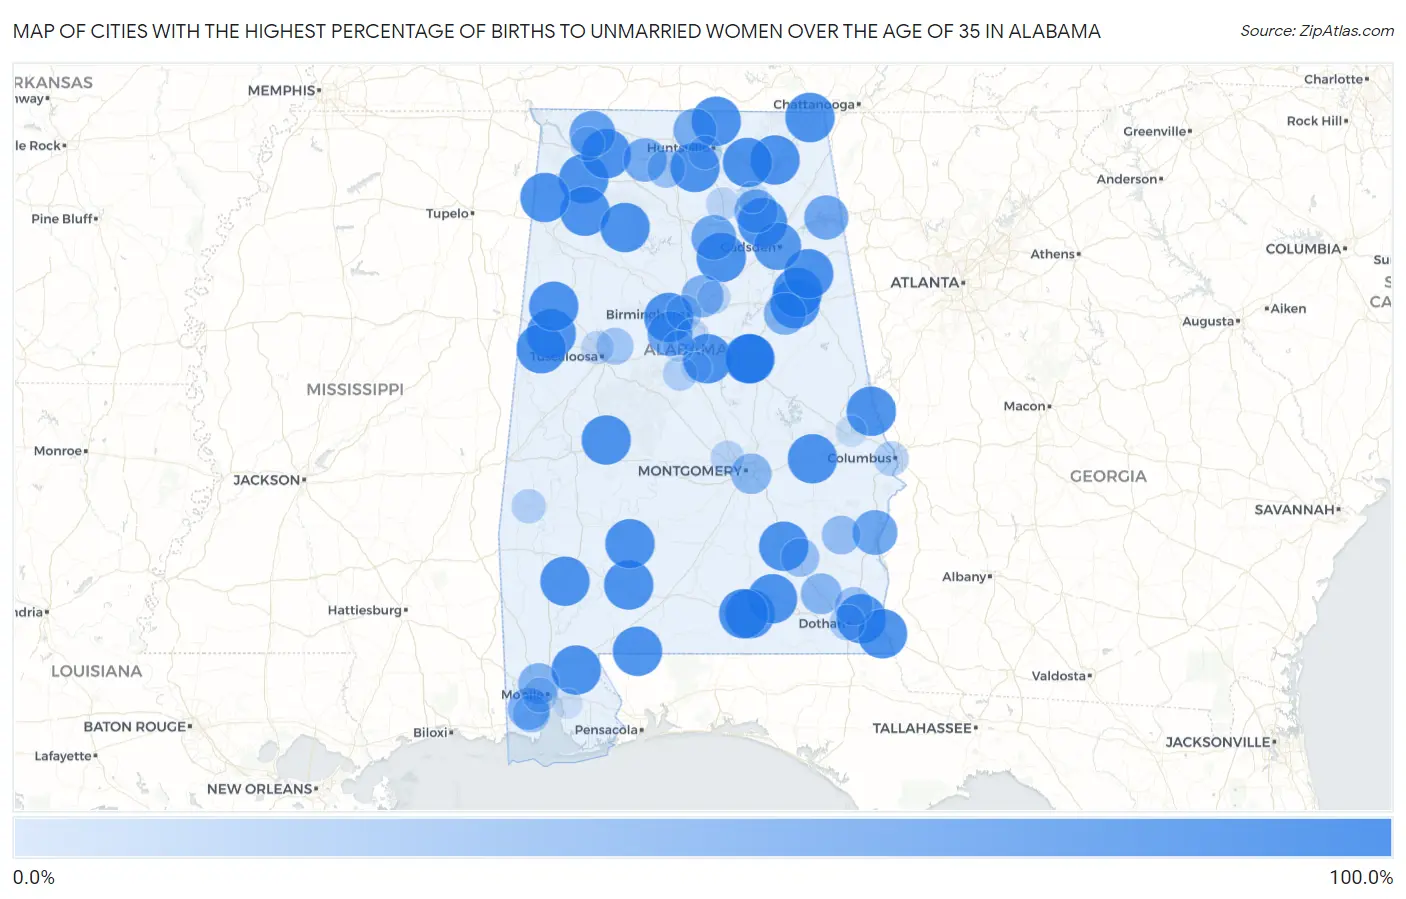
Map of Cities with the Highest Percentage of Births to Unmarried Women over the Age of 35 in Alabama
0.0%
100.0%
Cities with the Highest Percentage of Births to Unmarried Women over the Age of 35 in Alabama
| City | % Unmarried | vs State | vs National | |
| 1. | Oxford | 100.0% | 22.4%(+77.6)#1 | 20.1%(+79.9)#37 |
| 2. | Anniston | 100.0% | 22.4%(+77.6)#2 | 20.1%(+79.9)#40 |
| 3. | Troy | 100.0% | 22.4%(+77.6)#3 | 20.1%(+79.9)#54 |
| 4. | Scottsboro | 100.0% | 22.4%(+77.6)#4 | 20.1%(+79.9)#80 |
| 5. | Mccalla | 100.0% | 22.4%(+77.6)#5 | 20.1%(+79.9)#87 |
| 6. | Jacksonville | 100.0% | 22.4%(+77.6)#6 | 20.1%(+79.9)#92 |
| 7. | Sylacauga | 100.0% | 22.4%(+77.6)#7 | 20.1%(+79.9)#121 |
| 8. | Russellville | 100.0% | 22.4%(+77.6)#8 | 20.1%(+79.9)#157 |
| 9. | Valley | 100.0% | 22.4%(+77.6)#9 | 20.1%(+79.9)#171 |
| 10. | Boaz | 100.0% | 22.4%(+77.6)#10 | 20.1%(+79.9)#179 |
| 11. | Pleasant Grove | 100.0% | 22.4%(+77.6)#11 | 20.1%(+79.9)#201 |
| 12. | Tuskegee | 100.0% | 22.4%(+77.6)#12 | 20.1%(+79.9)#210 |
| 13. | Bay Minette | 100.0% | 22.4%(+77.6)#13 | 20.1%(+79.9)#240 |
| 14. | Oneonta | 100.0% | 22.4%(+77.6)#14 | 20.1%(+79.9)#278 |
| 15. | Opp | 100.0% | 22.4%(+77.6)#15 | 20.1%(+79.9)#288 |
| 16. | Monroeville | 100.0% | 22.4%(+77.6)#16 | 20.1%(+79.9)#325 |
| 17. | Jackson | 100.0% | 22.4%(+77.6)#17 | 20.1%(+79.9)#401 |
| 18. | Columbiana | 100.0% | 22.4%(+77.6)#18 | 20.1%(+79.9)#413 |
| 19. | Hazel Green | 100.0% | 22.4%(+77.6)#19 | 20.1%(+79.9)#459 |
| 20. | Elba | 100.0% | 22.4%(+77.6)#20 | 20.1%(+79.9)#497 |
| 21. | Triana | 100.0% | 22.4%(+77.6)#21 | 20.1%(+79.9)#534 |
| 22. | Bridgeport | 100.0% | 22.4%(+77.6)#22 | 20.1%(+79.9)#651 |
| 23. | Reform | 100.0% | 22.4%(+77.6)#23 | 20.1%(+79.9)#728 |
| 24. | Flomaton | 100.0% | 22.4%(+77.6)#24 | 20.1%(+79.9)#806 |
| 25. | Bear Creek | 100.0% | 22.4%(+77.6)#25 | 20.1%(+79.9)#818 |
| 26. | Webb | 100.0% | 22.4%(+77.6)#26 | 20.1%(+79.9)#852 |
| 27. | Double Springs | 100.0% | 22.4%(+77.6)#27 | 20.1%(+79.9)#865 |
| 28. | Woodville | 100.0% | 22.4%(+77.6)#28 | 20.1%(+79.9)#960 |
| 29. | Carrollton | 100.0% | 22.4%(+77.6)#29 | 20.1%(+79.9)#963 |
| 30. | Leighton | 100.0% | 22.4%(+77.6)#30 | 20.1%(+79.9)#1,092 |
| 31. | Mignon | 100.0% | 22.4%(+77.6)#31 | 20.1%(+79.9)#1,115 |
| 32. | Babbie | 100.0% | 22.4%(+77.6)#32 | 20.1%(+79.9)#1,161 |
| 33. | Kennedy | 100.0% | 22.4%(+77.6)#33 | 20.1%(+79.9)#1,252 |
| 34. | Vina | 100.0% | 22.4%(+77.6)#34 | 20.1%(+79.9)#1,273 |
| 35. | Gordon | 100.0% | 22.4%(+77.6)#35 | 20.1%(+79.9)#1,285 |
| 36. | Newbern | 100.0% | 22.4%(+77.6)#36 | 20.1%(+79.9)#1,307 |
| 37. | Vredenburgh | 100.0% | 22.4%(+77.6)#37 | 20.1%(+79.9)#1,414 |
| 38. | Gadsden | 89.6% | 22.4%(+67.2)#38 | 20.1%(+69.5)#1,482 |
| 39. | Florence | 81.5% | 22.4%(+59.1)#39 | 20.1%(+61.4)#1,545 |
| 40. | Bessemer | 76.2% | 22.4%(+53.8)#40 | 20.1%(+56.1)#1,601 |
| 41. | Eufaula | 75.9% | 22.4%(+53.5)#41 | 20.1%(+55.8)#1,604 |
| 42. | Blountsville | 75.0% | 22.4%(+52.6)#42 | 20.1%(+54.9)#1,620 |
| 43. | Cedar Bluff | 72.2% | 22.4%(+49.8)#43 | 20.1%(+52.1)#1,651 |
| 44. | Hillsboro | 69.2% | 22.4%(+46.8)#44 | 20.1%(+49.1)#1,690 |
| 45. | Albertville | 68.6% | 22.4%(+46.2)#45 | 20.1%(+48.5)#1,701 |
| 46. | Harvest | 66.7% | 22.4%(+44.3)#46 | 20.1%(+46.6)#1,727 |
| 47. | Munford | 62.5% | 22.4%(+40.1)#47 | 20.1%(+42.4)#1,828 |
| 48. | Center Point | 61.4% | 22.4%(+39.0)#48 | 20.1%(+41.3)#1,862 |
| 49. | Tillmans Corner | 60.7% | 22.4%(+38.3)#49 | 20.1%(+40.6)#1,871 |
| 50. | Prichard | 57.1% | 22.4%(+34.7)#50 | 20.1%(+37.0)#1,947 |
| 51. | Ozark | 54.5% | 22.4%(+32.1)#51 | 20.1%(+34.4)#2,005 |
| 52. | Montgomery | 53.0% | 22.4%(+30.6)#52 | 20.1%(+32.9)#2,038 |
| 53. | Clayton | 44.4% | 22.4%(+22.0)#53 | 20.1%(+24.3)#2,301 |
| 54. | Brundidge | 42.9% | 22.4%(+20.5)#54 | 20.1%(+22.8)#2,354 |
| 55. | Headland | 41.7% | 22.4%(+19.3)#55 | 20.1%(+21.6)#2,384 |
| 56. | Decatur | 40.0% | 22.4%(+17.6)#56 | 20.1%(+19.9)#2,424 |
| 57. | Theodore | 37.3% | 22.4%(+14.9)#57 | 20.1%(+17.2)#2,543 |
| 58. | Tuscaloosa | 35.0% | 22.4%(+12.6)#58 | 20.1%(+14.9)#2,621 |
| 59. | Dothan | 28.2% | 22.4%(+5.80)#59 | 20.1%(+8.10)#2,927 |
| 60. | Birmingham | 26.8% | 22.4%(+4.40)#60 | 20.1%(+6.70)#2,994 |
| 61. | Mobile | 24.7% | 22.4%(+2.30)#61 | 20.1%(+4.60)#3,090 |
| 62. | Phenix City | 24.1% | 22.4%(+1.70)#62 | 20.1%(+4.00)#3,118 |
| 63. | Butler | 21.6% | 22.4%(-0.800)#63 | 20.1%(+1.50)#3,227 |
| 64. | Wilton | 21.4% | 22.4%(-1.000)#64 | 20.1%(+1.30)#3,240 |
| 65. | Sheffield | 20.0% | 22.4%(-2.40)#65 | 20.1%(-0.100)#3,307 |
| 66. | Huntsville | 18.8% | 22.4%(-3.60)#66 | 20.1%(-1.30)#3,359 |
| 67. | Prattville | 18.6% | 22.4%(-3.80)#67 | 20.1%(-1.50)#3,371 |
| 68. | Trussville | 15.7% | 22.4%(-6.70)#68 | 20.1%(-4.40)#3,531 |
| 69. | Northport | 15.6% | 22.4%(-6.80)#69 | 20.1%(-4.50)#3,535 |
| 70. | Arab | 14.3% | 22.4%(-8.10)#70 | 20.1%(-5.80)#3,618 |
| 71. | Hoover | 13.5% | 22.4%(-8.90)#71 | 20.1%(-6.60)#3,665 |
| 72. | Helena | 8.0% | 22.4%(-14.4)#72 | 20.1%(-12.1)#3,927 |
| 73. | Opelika | 7.1% | 22.4%(-15.3)#73 | 20.1%(-13.0)#3,974 |
| 74. | Calera | 6.7% | 22.4%(-15.7)#74 | 20.1%(-13.4)#3,994 |
| 75. | Guntersville | 6.7% | 22.4%(-15.7)#75 | 20.1%(-13.4)#3,995 |
| 76. | Daphne | 1.9% | 22.4%(-20.5)#76 | 20.1%(-18.2)#4,166 |
Common Questions
What are the Top 10 Cities with the Highest Percentage of Births to Unmarried Women over the Age of 35 in Alabama?
Top 10 Cities with the Highest Percentage of Births to Unmarried Women over the Age of 35 in Alabama are:
#1
100.0%
#2
100.0%
#3
100.0%
#4
100.0%
#5
100.0%
#6
100.0%
#7
100.0%
#8
100.0%
#9
100.0%
#10
100.0%
What city has the Highest Percentage of Births to Unmarried Women over the Age of 35 in Alabama?
Oxford has the Highest Percentage of Births to Unmarried Women over the Age of 35 in Alabama with 100.0%.
What is the Percentage of Births to Unmarried Women over the Age of 35 in the State of Alabama?
Percentage of Births to Unmarried Women over the Age of 35 in Alabama is 22.4%.
What is the Percentage of Births to Unmarried Women over the Age of 35 in the United States?
Percentage of Births to Unmarried Women over the Age of 35 in the United States is 20.1%.