Lanett, AL
Lanett Map
Lanett Overview
6,880
TOTAL POPULATION
2,832
MALE POPULATION
4,048
FEMALE POPULATION
69.96
MALES / 100 FEMALES
142.94
FEMALES / 100 MALES
39.9
MEDIAN AGE
3.6
AVG FAMILY SIZE
2.8
AVG HOUSEHOLD SIZE
$22,691
PER CAPITA INCOME
$64,138
AVG FAMILY INCOME
$48,125
AVG HOUSEHOLD INCOME
22.0%
WAGE / INCOME GAP [ % ]
78.0¢/ $1
WAGE / INCOME GAP [ $ ]
$13,285
FAMILY INCOME DEFICIT
0.40
INEQUALITY / GINI INDEX
3,052
LABOR FORCE [ PEOPLE ]
57.0%
PERCENT IN LABOR FORCE
5.6%
UNEMPLOYMENT RATE
Lanett Zip Codes
Lanett Area Codes
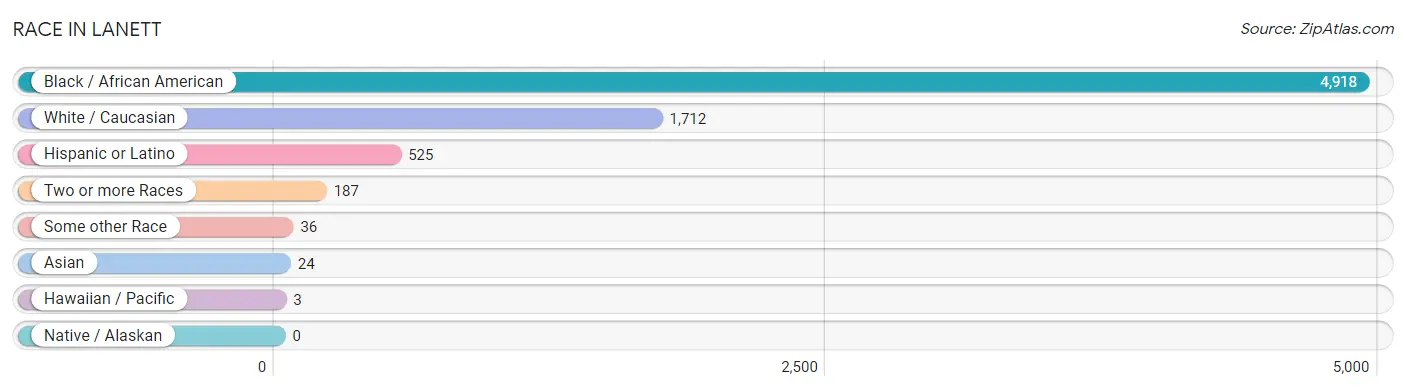
Race in Lanett
The most populous races in Lanett are Black / African American (4,918 | 71.5%), White / Caucasian (1,712 | 24.9%), and Hispanic or Latino (525 | 7.6%).
| Race | # Population | % Population |
| Asian | 24 | 0.4% |
| Black / African American | 4,918 | 71.5% |
| Hawaiian / Pacific | 3 | 0.0% |
| Hispanic or Latino | 525 | 7.6% |
| Native / Alaskan | 0 | 0.0% |
| White / Caucasian | 1,712 | 24.9% |
| Two or more Races | 187 | 2.7% |
| Some other Race | 36 | 0.5% |
| Total | 6,880 | 100.0% |
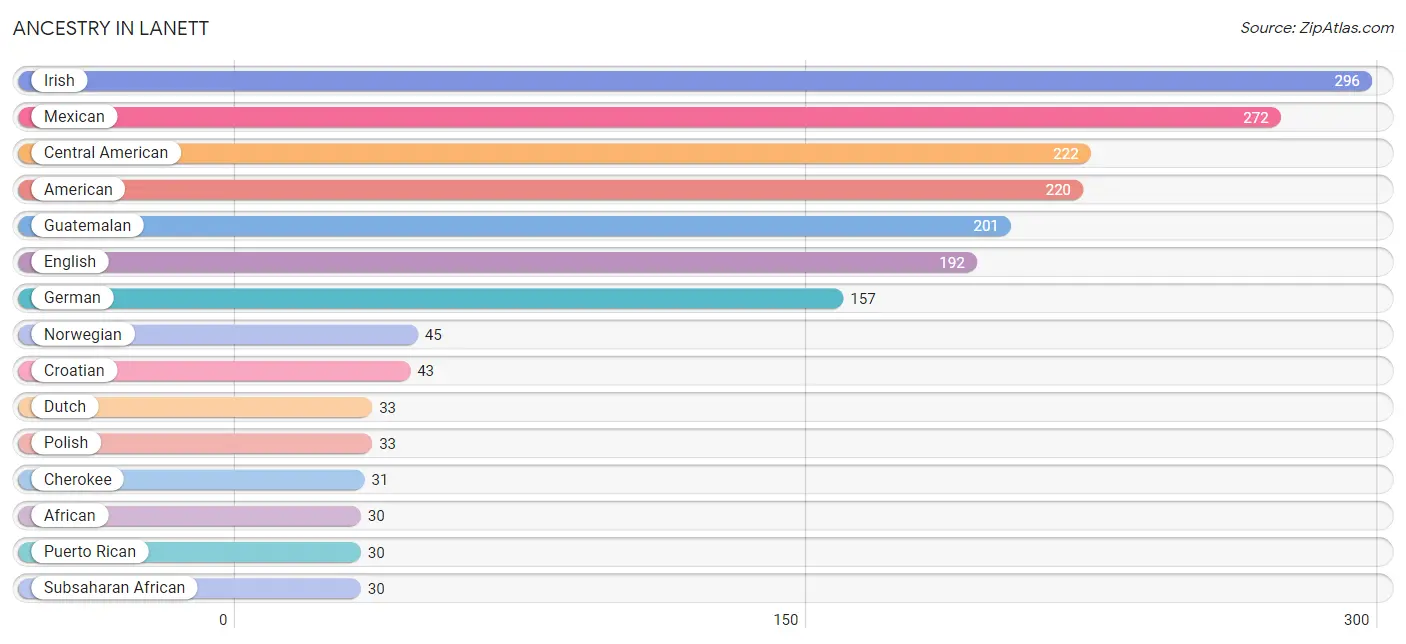
Ancestry in Lanett
The most populous ancestries reported in Lanett are Irish (296 | 4.3%), Mexican (272 | 4.0%), Central American (222 | 3.2%), American (220 | 3.2%), and Guatemalan (201 | 2.9%), together accounting for 17.6% of all Lanett residents.
| Ancestry | # Population | % Population |
| African | 30 | 0.4% |
| American | 220 | 3.2% |
| Burmese | 24 | 0.4% |
| Central American | 222 | 3.2% |
| Cherokee | 31 | 0.4% |
| Croatian | 43 | 0.6% |
| Czech | 19 | 0.3% |
| Dutch | 33 | 0.5% |
| English | 192 | 2.8% |
| Fijian | 3 | 0.0% |
| French | 10 | 0.2% |
| French Canadian | 7 | 0.1% |
| German | 157 | 2.3% |
| Guatemalan | 201 | 2.9% |
| Honduran | 21 | 0.3% |
| Hungarian | 8 | 0.1% |
| Irish | 296 | 4.3% |
| Mexican | 272 | 4.0% |
| Norwegian | 45 | 0.6% |
| Polish | 33 | 0.5% |
| Puerto Rican | 30 | 0.4% |
| Romanian | 7 | 0.1% |
| Scotch-Irish | 27 | 0.4% |
| Scottish | 25 | 0.4% |
| Subsaharan African | 30 | 0.4% |
| Swedish | 20 | 0.3% | View All 26 Rows |
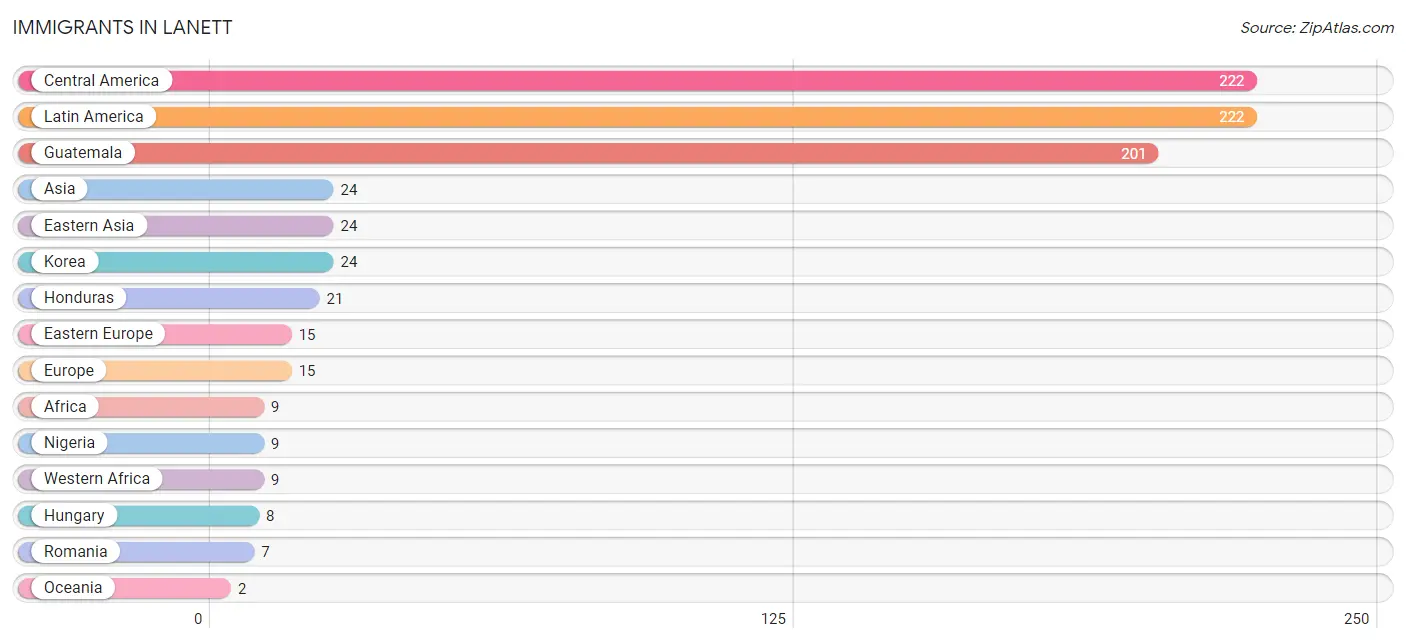
Immigrants in Lanett
The most numerous immigrant groups reported in Lanett came from Central America (222 | 3.2%), Latin America (222 | 3.2%), Guatemala (201 | 2.9%), Asia (24 | 0.4%), and Eastern Asia (24 | 0.4%), together accounting for 10.1% of all Lanett residents.
| Immigration Origin | # Population | % Population |
| Africa | 9 | 0.1% |
| Asia | 24 | 0.4% |
| Central America | 222 | 3.2% |
| Eastern Asia | 24 | 0.4% |
| Eastern Europe | 15 | 0.2% |
| Europe | 15 | 0.2% |
| Guatemala | 201 | 2.9% |
| Honduras | 21 | 0.3% |
| Hungary | 8 | 0.1% |
| Korea | 24 | 0.4% |
| Latin America | 222 | 3.2% |
| Nigeria | 9 | 0.1% |
| Oceania | 2 | 0.0% |
| Romania | 7 | 0.1% |
| Western Africa | 9 | 0.1% | View All 15 Rows |
Sex and Age in Lanett
Sex and Age in Lanett
The most populous age groups in Lanett are 35 to 39 Years (301 | 10.6%) for men and 10 to 14 Years (404 | 10.0%) for women.
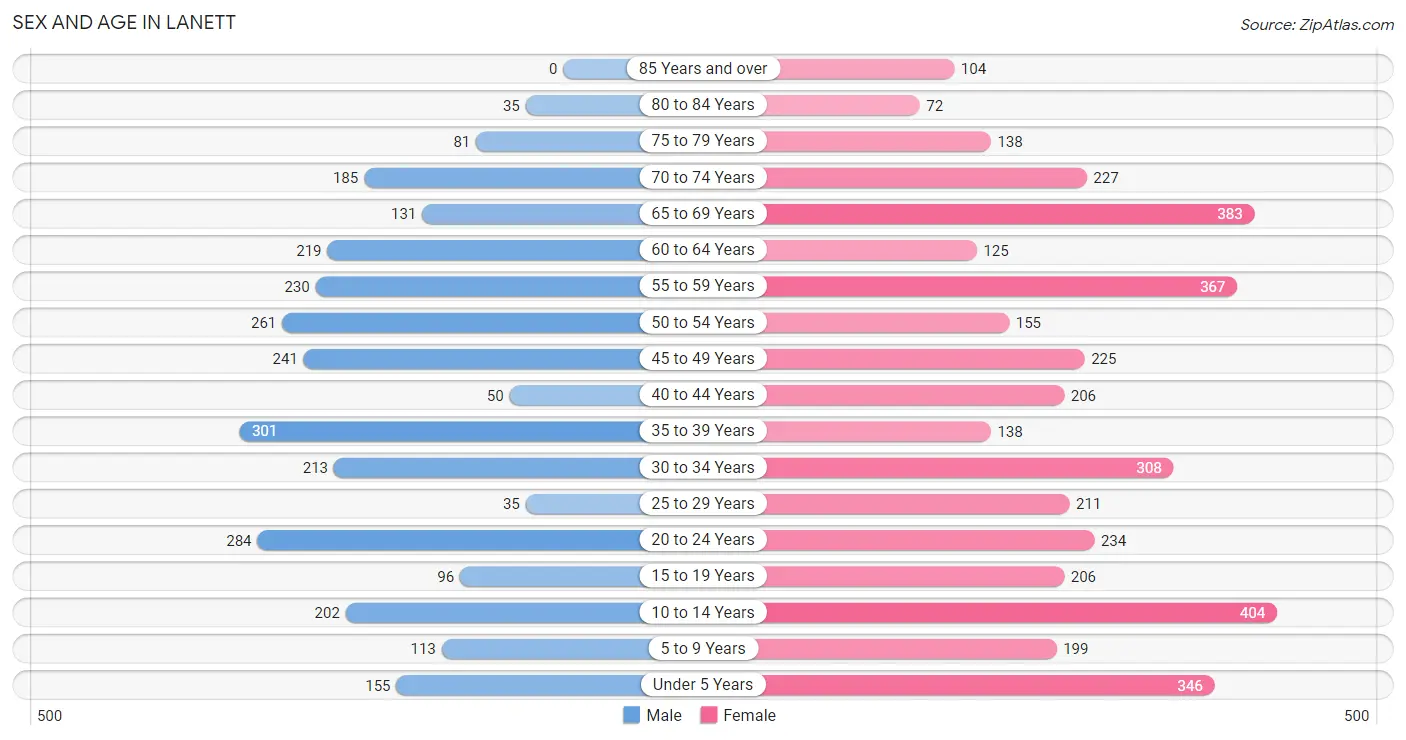
| Age Bracket | Male | Female |
| Under 5 Years | 155 (5.5%) | 346 (8.6%) |
| 5 to 9 Years | 113 (4.0%) | 199 (4.9%) |
| 10 to 14 Years | 202 (7.1%) | 404 (10.0%) |
| 15 to 19 Years | 96 (3.4%) | 206 (5.1%) |
| 20 to 24 Years | 284 (10.0%) | 234 (5.8%) |
| 25 to 29 Years | 35 (1.2%) | 211 (5.2%) |
| 30 to 34 Years | 213 (7.5%) | 308 (7.6%) |
| 35 to 39 Years | 301 (10.6%) | 138 (3.4%) |
| 40 to 44 Years | 50 (1.8%) | 206 (5.1%) |
| 45 to 49 Years | 241 (8.5%) | 225 (5.6%) |
| 50 to 54 Years | 261 (9.2%) | 155 (3.8%) |
| 55 to 59 Years | 230 (8.1%) | 367 (9.1%) |
| 60 to 64 Years | 219 (7.7%) | 125 (3.1%) |
| 65 to 69 Years | 131 (4.6%) | 383 (9.5%) |
| 70 to 74 Years | 185 (6.5%) | 227 (5.6%) |
| 75 to 79 Years | 81 (2.9%) | 138 (3.4%) |
| 80 to 84 Years | 35 (1.2%) | 72 (1.8%) |
| 85 Years and over | 0 (0.0%) | 104 (2.6%) |
| Total | 2,832 (100.0%) | 4,048 (100.0%) |
Families and Households in Lanett
Median Family Size in Lanett
The median family size in Lanett is 3.64 persons per family, with single female/mother families (501 | 32.9%) accounting for the largest median family size of 4.51 persons per family. On the other hand, single male/father families (274 | 18.0%) represent the smallest median family size with 2.85 persons per family.
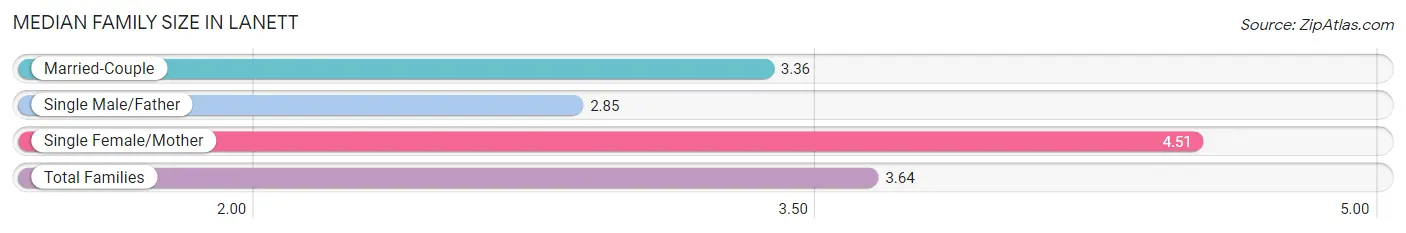
| Family Type | # Families | Family Size |
| Married-Couple | 749 (49.1%) | 3.36 |
| Single Male/Father | 274 (18.0%) | 2.85 |
| Single Female/Mother | 501 (32.9%) | 4.51 |
| Total Families | 1,524 (100.0%) | 3.64 |
Median Household Size in Lanett
The median household size in Lanett is 2.75 persons per household, with single female/mother households (501 | 20.6%) accounting for the largest median household size of 4.77 persons per household. non-family households (906 | 37.3%) represent the smallest median household size with 1.06 persons per household.
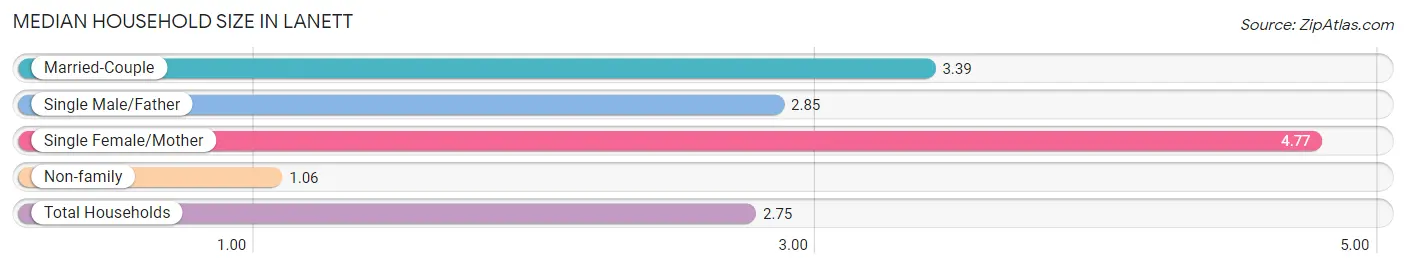
| Household Type | # Households | Household Size |
| Married-Couple | 749 (30.8%) | 3.39 |
| Single Male/Father | 274 (11.3%) | 2.85 |
| Single Female/Mother | 501 (20.6%) | 4.77 |
| Non-family | 906 (37.3%) | 1.06 |
| Total Households | 2,430 (100.0%) | 2.75 |
Household Size by Marriage Status in Lanett
Out of a total of 2,430 households in Lanett, 1,524 (62.7%) are family households, while 906 (37.3%) are nonfamily households. The most numerous type of family households are 2-person households, comprising 750, and the most common type of nonfamily households are 1-person households, comprising 869.
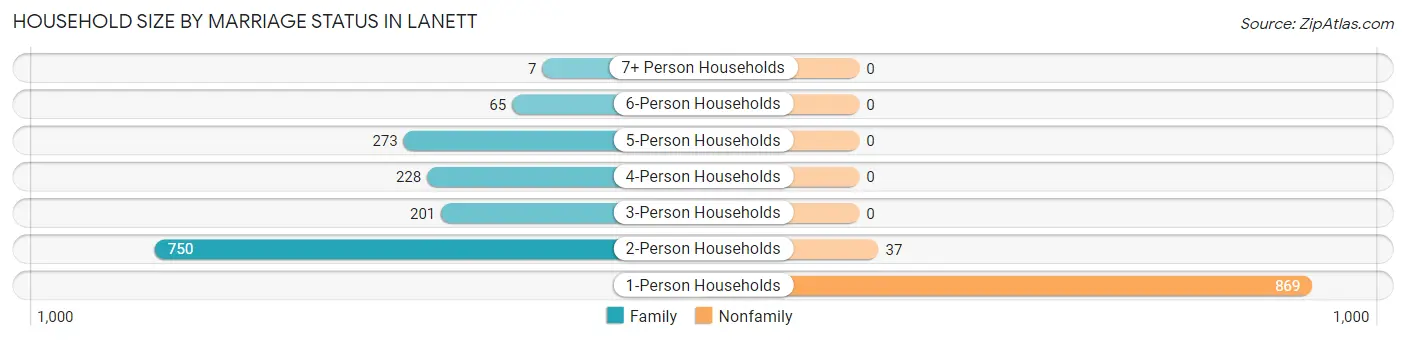
| Household Size | Family Households | Nonfamily Households |
| 1-Person Households | - | 869 (35.8%) |
| 2-Person Households | 750 (30.9%) | 37 (1.5%) |
| 3-Person Households | 201 (8.3%) | 0 (0.0%) |
| 4-Person Households | 228 (9.4%) | 0 (0.0%) |
| 5-Person Households | 273 (11.2%) | 0 (0.0%) |
| 6-Person Households | 65 (2.7%) | 0 (0.0%) |
| 7+ Person Households | 7 (0.3%) | 0 (0.0%) |
| Total | 1,524 (62.7%) | 906 (37.3%) |
Female Fertility in Lanett
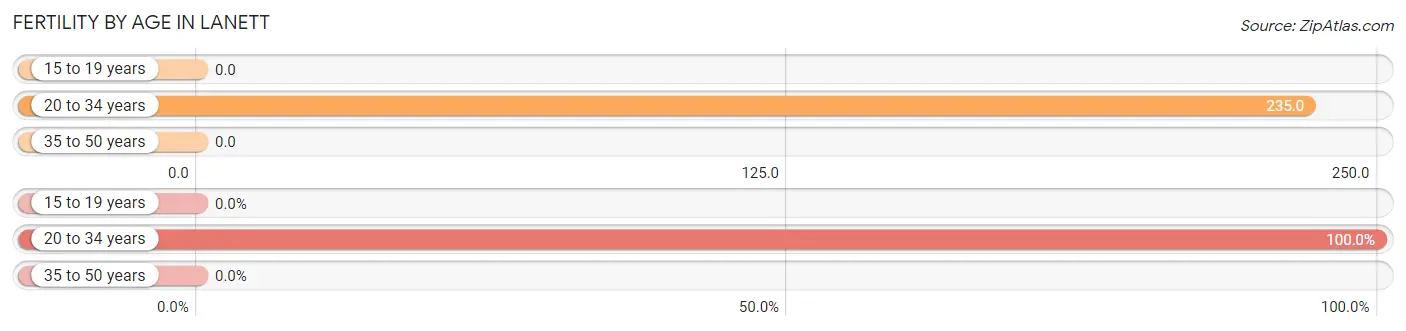
Fertility by Age in Lanett
Average fertility rate in Lanett is 115.0 births per 1,000 women. Women in the age bracket of 20 to 34 years have the highest fertility rate with 235.0 births per 1,000 women. Women in the age bracket of 20 to 34 years acount for 100.0% of all women with births.
| Age Bracket | Women with Births | Births / 1,000 Women |
| 15 to 19 years | 0 (0.0%) | 0.0 |
| 20 to 34 years | 177 (100.0%) | 235.0 |
| 35 to 50 years | 0 (0.0%) | 0.0 |
| Total | 177 (100.0%) | 115.0 |
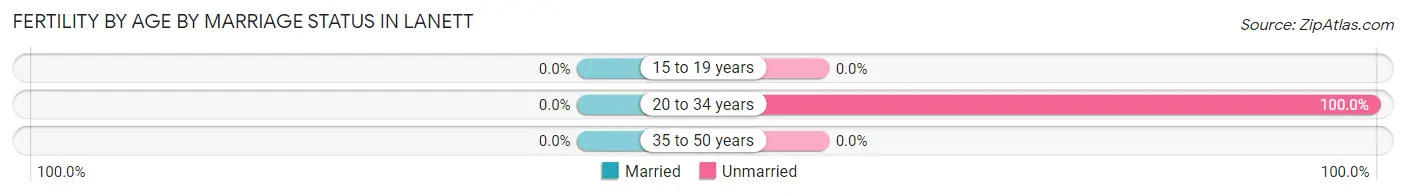
Fertility by Age by Marriage Status in Lanett
| Age Bracket | Married | Unmarried |
| 15 to 19 years | 0 (0.0%) | 0 (0.0%) |
| 20 to 34 years | 0 (0.0%) | 177 (100.0%) |
| 35 to 50 years | 0 (0.0%) | 0 (0.0%) |
| Total | 0 (0.0%) | 177 (100.0%) |
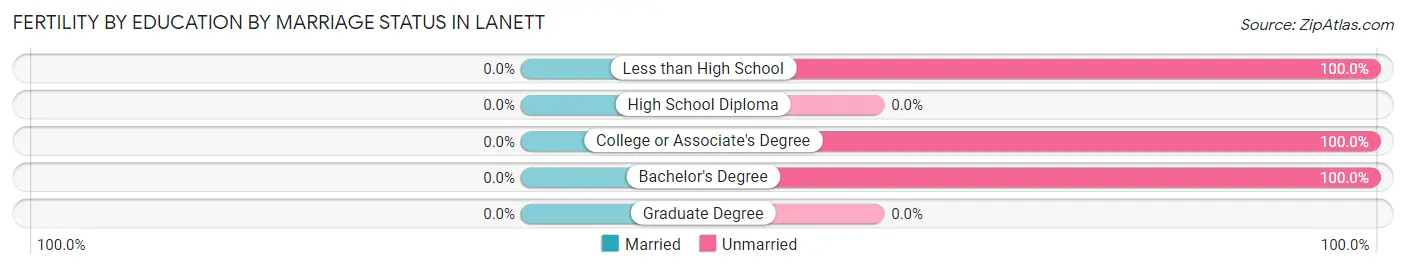
Fertility by Education in Lanett

| Educational Attainment | Women with Births | Births / 1,000 Women |
| Less than High School | 29 (16.4%) | 87.0 |
| High School Diploma | 0 (0.0%) | 0.0 |
| College or Associate's Degree | 128 (72.3%) | 157.0 |
| Bachelor's Degree | 20 (11.3%) | 111.0 |
| Graduate Degree | 0 (0.0%) | 0.0 |
| Total | 177 (100.0%) | 115.0 |
Fertility by Education by Marriage Status in Lanett
| Educational Attainment | Married | Unmarried |
| Less than High School | 0 (0.0%) | 29 (100.0%) |
| High School Diploma | 0 (0.0%) | 0 (0.0%) |
| College or Associate's Degree | 0 (0.0%) | 128 (100.0%) |
| Bachelor's Degree | 0 (0.0%) | 20 (100.0%) |
| Graduate Degree | 0 (0.0%) | 0 (0.0%) |
| Total | 0 (0.0%) | 177 (100.0%) |
Income in Lanett
Income Overview in Lanett
Per Capita Income in Lanett is $22,691, while median incomes of families and households are $64,138 and $48,125 respectively.
| Characteristic | Number | Measure |
| Per Capita Income | 6,880 | $22,691 |
| Median Family Income | 1,524 | $64,138 |
| Mean Family Income | 1,524 | $66,798 |
| Median Household Income | 2,430 | $48,125 |
| Mean Household Income | 2,430 | $57,490 |
| Income Deficit | 1,524 | $13,285 |
| Wage / Income Gap (%) | 6,880 | 22.01% |
| Wage / Income Gap ($) | 6,880 | 77.99¢ per $1 |
| Gini / Inequality Index | 6,880 | 0.40 |
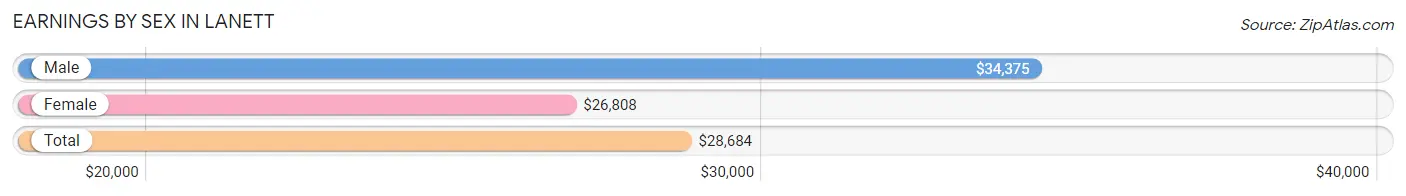
Earnings by Sex in Lanett
Average Earnings in Lanett are $28,684, $34,375 for men and $26,808 for women, a difference of 22.0%.
| Sex | Number | Average Earnings |
| Male | 1,579 (50.6%) | $34,375 |
| Female | 1,539 (49.4%) | $26,808 |
| Total | 3,118 (100.0%) | $28,684 |
Earnings by Sex by Income Bracket in Lanett
The most common earnings brackets in Lanett are $75,000 to $99,999 for men (265 | 16.8%) and $30,000 to $34,999 for women (197 | 12.8%).
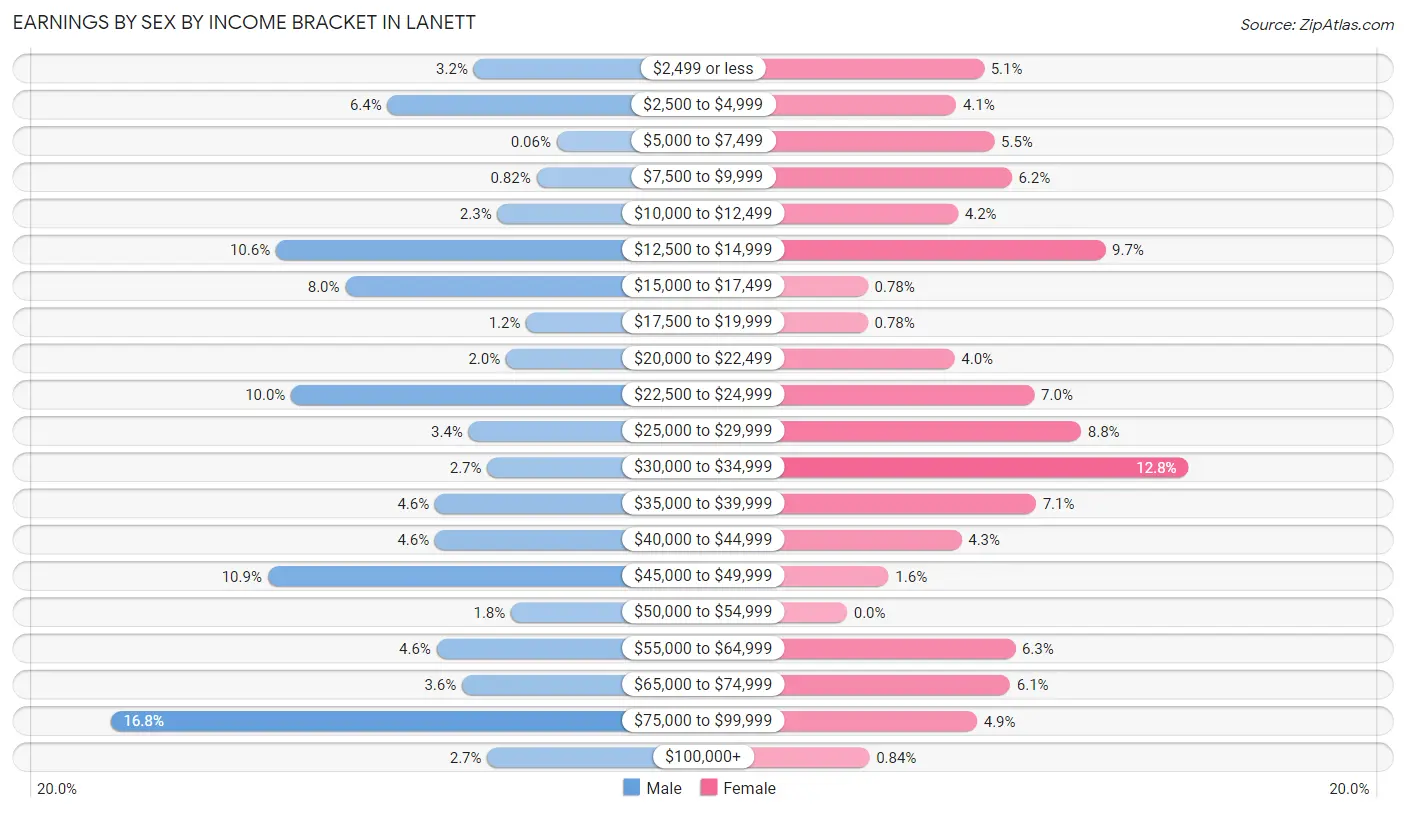
| Income | Male | Female |
| $2,499 or less | 50 (3.2%) | 79 (5.1%) |
| $2,500 to $4,999 | 101 (6.4%) | 63 (4.1%) |
| $5,000 to $7,499 | 1 (0.1%) | 85 (5.5%) |
| $7,500 to $9,999 | 13 (0.8%) | 95 (6.2%) |
| $10,000 to $12,499 | 36 (2.3%) | 64 (4.2%) |
| $12,500 to $14,999 | 167 (10.6%) | 149 (9.7%) |
| $15,000 to $17,499 | 126 (8.0%) | 12 (0.8%) |
| $17,500 to $19,999 | 19 (1.2%) | 12 (0.8%) |
| $20,000 to $22,499 | 31 (2.0%) | 62 (4.0%) |
| $22,500 to $24,999 | 158 (10.0%) | 108 (7.0%) |
| $25,000 to $29,999 | 53 (3.4%) | 135 (8.8%) |
| $30,000 to $34,999 | 42 (2.7%) | 197 (12.8%) |
| $35,000 to $39,999 | 73 (4.6%) | 109 (7.1%) |
| $40,000 to $44,999 | 73 (4.6%) | 66 (4.3%) |
| $45,000 to $49,999 | 172 (10.9%) | 24 (1.6%) |
| $50,000 to $54,999 | 28 (1.8%) | 0 (0.0%) |
| $55,000 to $64,999 | 72 (4.6%) | 97 (6.3%) |
| $65,000 to $74,999 | 57 (3.6%) | 94 (6.1%) |
| $75,000 to $99,999 | 265 (16.8%) | 75 (4.9%) |
| $100,000+ | 42 (2.7%) | 13 (0.8%) |
| Total | 1,579 (100.0%) | 1,539 (100.0%) |
Earnings by Sex by Educational Attainment in Lanett
Average earnings in Lanett are $45,063 for men and $31,071 for women, a difference of 31.0%. Men with an educational attainment of college or associate's degree enjoy the highest average annual earnings of $46,703, while those with high school diploma education earn the least with $45,316. Women with an educational attainment of bachelor's degree earn the most with the average annual earnings of $40,500, while those with less than high school education have the smallest earnings of $22,295.
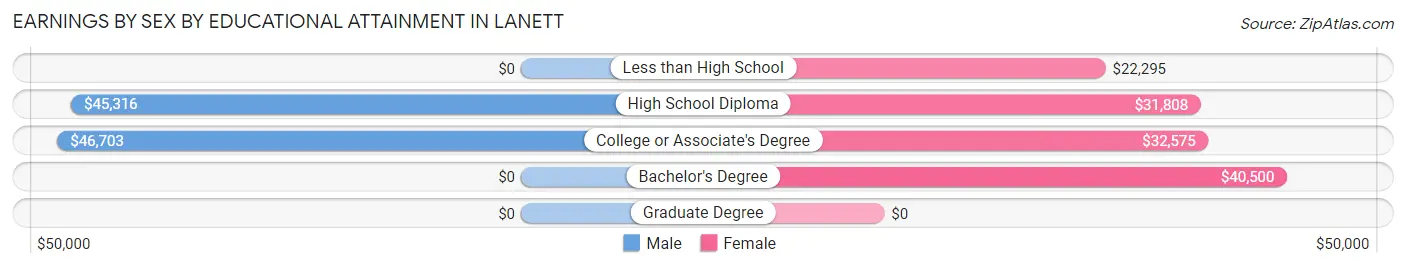
| Educational Attainment | Male Income | Female Income |
| Less than High School | - | - |
| High School Diploma | $45,316 | $31,808 |
| College or Associate's Degree | $46,703 | $32,575 |
| Bachelor's Degree | - | - |
| Graduate Degree | - | - |
| Total | $45,063 | $31,071 |
Family Income in Lanett
Family Income Brackets in Lanett
According to the Lanett family income data, there are 322 families falling into the $75,000 to $99,999 income range, which is the most common income bracket and makes up 21.1% of all families. Conversely, the $200,000+ income bracket is the least frequent group with only 24 families (1.6%) belonging to this category.
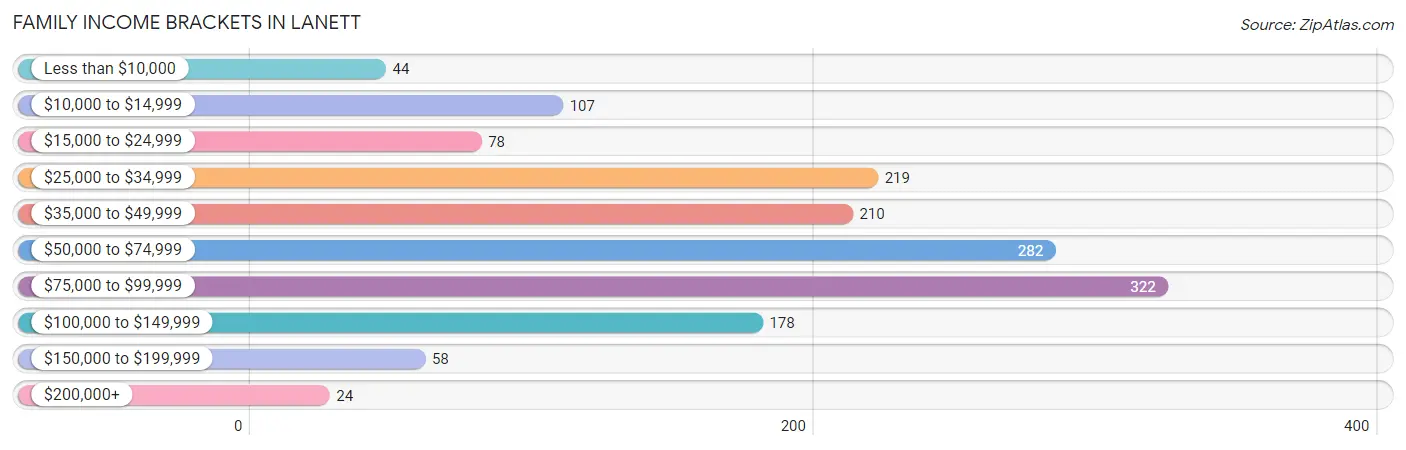
| Income Bracket | # Families | % Families |
| Less than $10,000 | 44 | 2.9% |
| $10,000 to $14,999 | 107 | 7.0% |
| $15,000 to $24,999 | 78 | 5.1% |
| $25,000 to $34,999 | 219 | 14.4% |
| $35,000 to $49,999 | 210 | 13.8% |
| $50,000 to $74,999 | 282 | 18.5% |
| $75,000 to $99,999 | 322 | 21.1% |
| $100,000 to $149,999 | 178 | 11.7% |
| $150,000 to $199,999 | 58 | 3.8% |
| $200,000+ | 24 | 1.6% |
Family Income by Famaliy Size in Lanett
4-person families (241 | 15.8%) account for the highest median family income in Lanett with $95,174 per family, while 2-person families (773 | 50.7%) have the highest median income of $24,662 per family member.
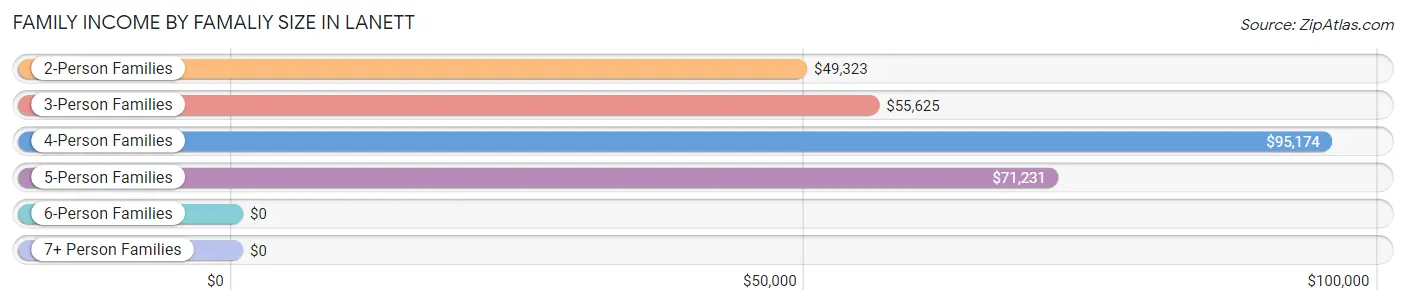
| Income Bracket | # Families | Median Income |
| 2-Person Families | 773 (50.7%) | $49,323 |
| 3-Person Families | 215 (14.1%) | $55,625 |
| 4-Person Families | 241 (15.8%) | $95,174 |
| 5-Person Families | 288 (18.9%) | $71,231 |
| 6-Person Families | 0 (0.0%) | $0 |
| 7+ Person Families | 7 (0.5%) | $0 |
| Total | 1,524 (100.0%) | $64,138 |
Family Income by Number of Earners in Lanett
The median family income in Lanett is $64,138, with families comprising 3+ earners (130) having the highest median family income of $134,602, while families with no earners (263) have the lowest median family income of $26,771, accounting for 8.5% and 17.3% of families, respectively.
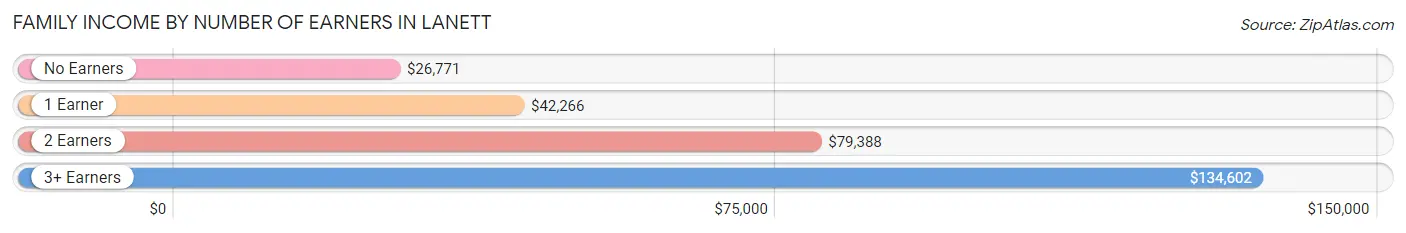
| Number of Earners | # Families | Median Income |
| No Earners | 263 (17.3%) | $26,771 |
| 1 Earner | 773 (50.7%) | $42,266 |
| 2 Earners | 358 (23.5%) | $79,388 |
| 3+ Earners | 130 (8.5%) | $134,602 |
| Total | 1,524 (100.0%) | $64,138 |
Household Income in Lanett
Household Income Brackets in Lanett
With 484 households falling in the category, the $75,000 to $99,999 income range is the most frequent in Lanett, accounting for 19.9% of all households. In contrast, only 32 households (1.3%) fall into the $200,000+ income bracket, making it the least populous group.
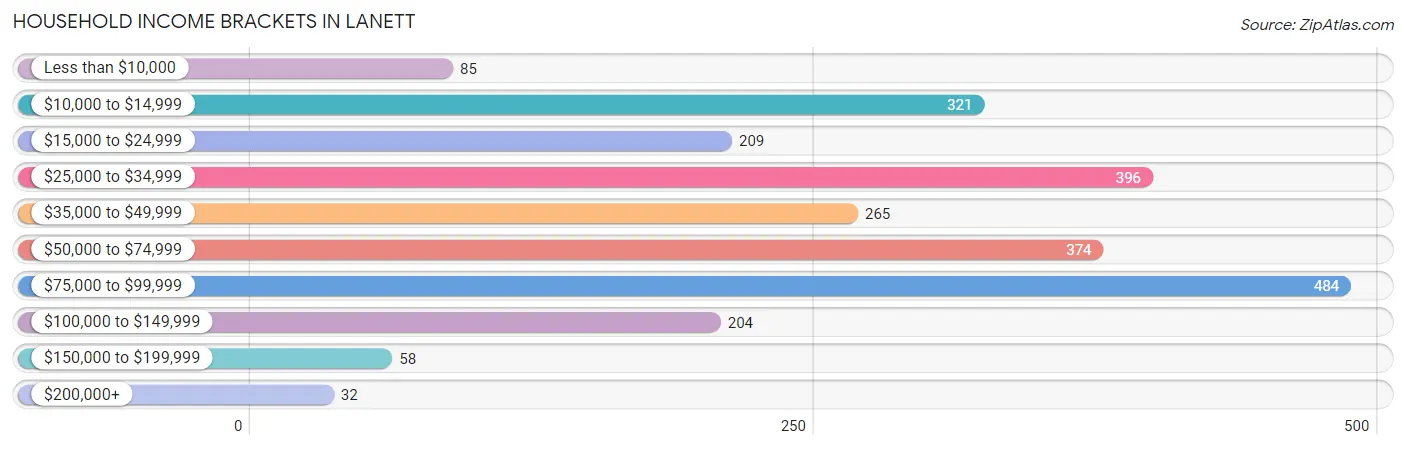
| Income Bracket | # Households | % Households |
| Less than $10,000 | 85 | 3.5% |
| $10,000 to $14,999 | 321 | 13.2% |
| $15,000 to $24,999 | 209 | 8.6% |
| $25,000 to $34,999 | 396 | 16.3% |
| $35,000 to $49,999 | 265 | 10.9% |
| $50,000 to $74,999 | 374 | 15.4% |
| $75,000 to $99,999 | 484 | 19.9% |
| $100,000 to $149,999 | 204 | 8.4% |
| $150,000 to $199,999 | 58 | 2.4% |
| $200,000+ | 32 | 1.3% |
Household Income by Householder Age in Lanett
The median household income in Lanett is $48,125, with the highest median household income of $62,917 found in the 45 to 64 years age bracket for the primary householder. A total of 930 households (38.3%) fall into this category. Meanwhile, the 15 to 24 years age bracket for the primary householder has the lowest median household income of $26,375, with 57 households (2.4%) in this group.
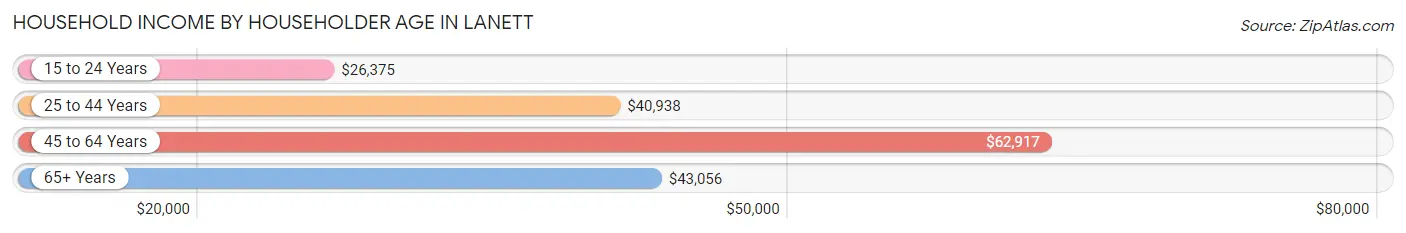
| Income Bracket | # Households | Median Income |
| 15 to 24 Years | 57 (2.4%) | $26,375 |
| 25 to 44 Years | 631 (26.0%) | $40,938 |
| 45 to 64 Years | 930 (38.3%) | $62,917 |
| 65+ Years | 812 (33.4%) | $43,056 |
| Total | 2,430 (100.0%) | $48,125 |
Poverty in Lanett
Income Below Poverty by Sex and Age in Lanett
With 12.2% poverty level for males and 29.3% for females among the residents of Lanett, under 5 year old males and 12 to 14 year old females are the most vulnerable to poverty, with 102 males (65.8%) and 229 females (100.0%) in their respective age groups living below the poverty level.
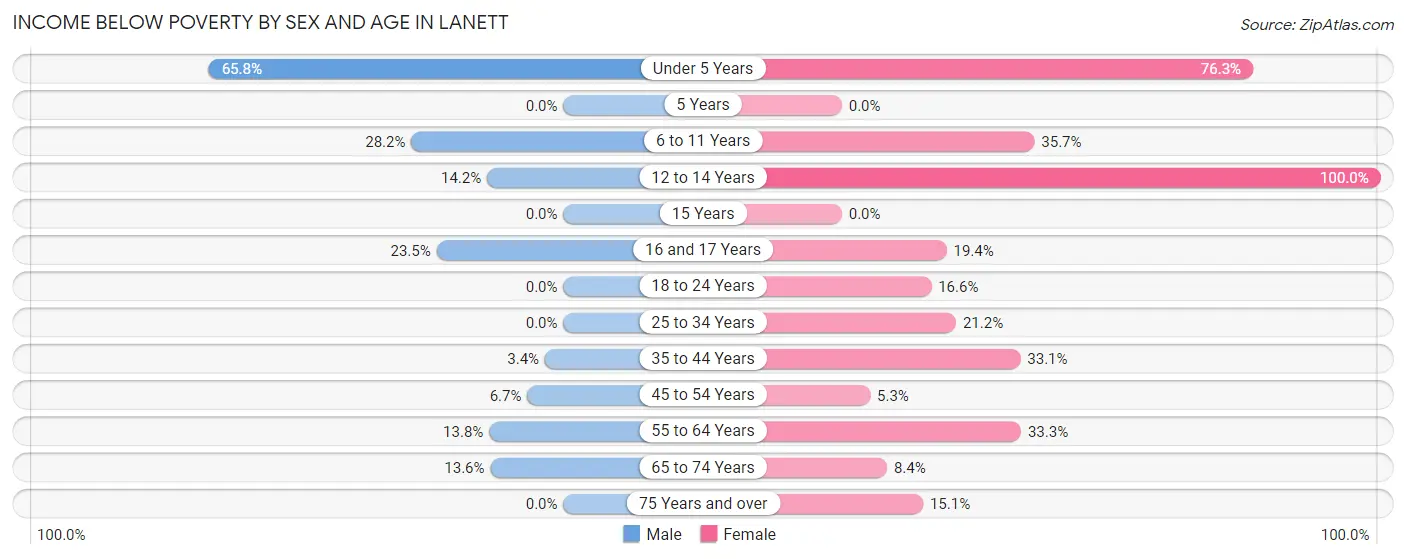
| Age Bracket | Male | Female |
| Under 5 Years | 102 (65.8%) | 264 (76.3%) |
| 5 Years | 0 (0.0%) | 0 (0.0%) |
| 6 to 11 Years | 57 (28.2%) | 114 (35.7%) |
| 12 to 14 Years | 16 (14.2%) | 229 (100.0%) |
| 15 Years | 0 (0.0%) | 0 (0.0%) |
| 16 and 17 Years | 8 (23.5%) | 14 (19.4%) |
| 18 to 24 Years | 0 (0.0%) | 42 (16.6%) |
| 25 to 34 Years | 0 (0.0%) | 110 (21.2%) |
| 35 to 44 Years | 12 (3.4%) | 114 (33.1%) |
| 45 to 54 Years | 33 (6.7%) | 20 (5.3%) |
| 55 to 64 Years | 61 (13.8%) | 160 (33.3%) |
| 65 to 74 Years | 42 (13.6%) | 49 (8.4%) |
| 75 Years and over | 0 (0.0%) | 44 (15.1%) |
| Total | 331 (12.2%) | 1,160 (29.3%) |
Income Above Poverty by Sex and Age in Lanett
According to the poverty statistics in Lanett, males aged 15 years and females aged 5 years are the age groups that are most secure financially, with 100.0% of males and 100.0% of females in these age groups living above the poverty line.
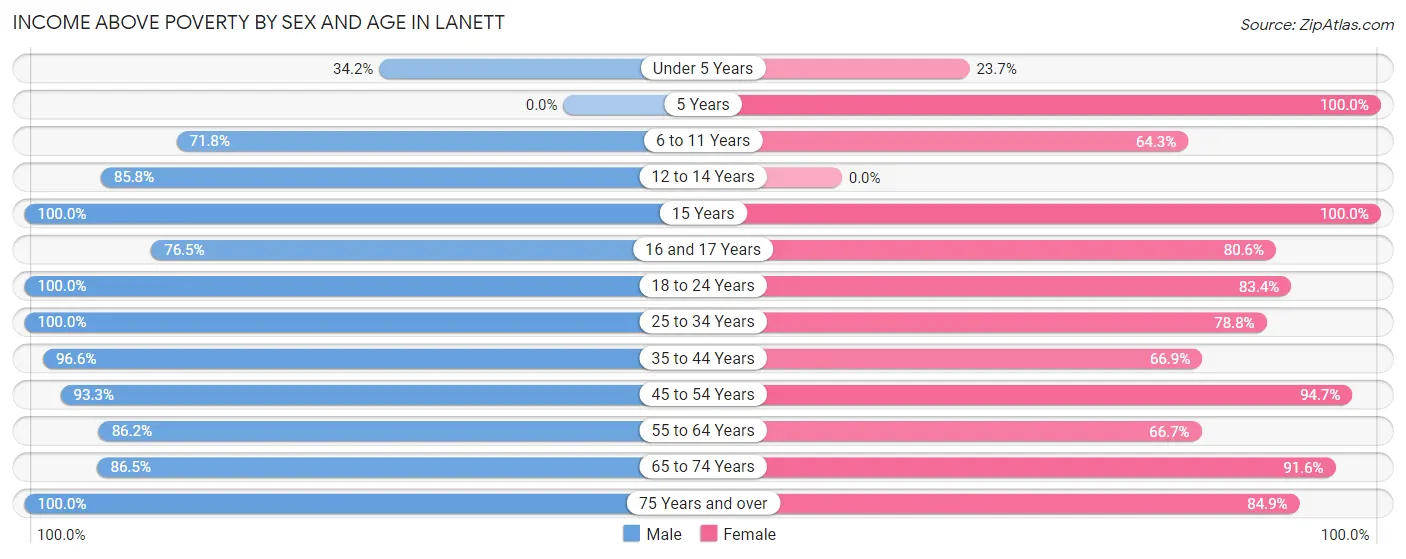
| Age Bracket | Male | Female |
| Under 5 Years | 53 (34.2%) | 82 (23.7%) |
| 5 Years | 0 (0.0%) | 55 (100.0%) |
| 6 to 11 Years | 145 (71.8%) | 205 (64.3%) |
| 12 to 14 Years | 97 (85.8%) | 0 (0.0%) |
| 15 Years | 23 (100.0%) | 83 (100.0%) |
| 16 and 17 Years | 26 (76.5%) | 58 (80.6%) |
| 18 to 24 Years | 241 (100.0%) | 211 (83.4%) |
| 25 to 34 Years | 248 (100.0%) | 409 (78.8%) |
| 35 to 44 Years | 339 (96.6%) | 230 (66.9%) |
| 45 to 54 Years | 460 (93.3%) | 360 (94.7%) |
| 55 to 64 Years | 382 (86.2%) | 321 (66.7%) |
| 65 to 74 Years | 268 (86.5%) | 536 (91.6%) |
| 75 Years and over | 100 (100.0%) | 248 (84.9%) |
| Total | 2,382 (87.8%) | 2,798 (70.7%) |
Income Below Poverty Among Married-Couple Families in Lanett
The poverty statistics for married-couple families in Lanett show that 5.9% or 44 of the total 749 families live below the poverty line. Families with 5 or more children have the highest poverty rate of 100.0%, comprising of 7 families. On the other hand, families with 1 or 2 children have the lowest poverty rate of 0.0%, which includes 0 families.
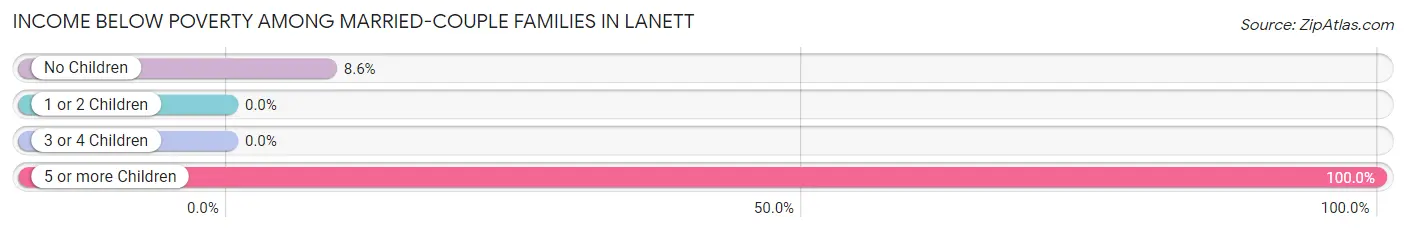
| Children | Above Poverty | Below Poverty |
| No Children | 393 (91.4%) | 37 (8.6%) |
| 1 or 2 Children | 312 (100.0%) | 0 (0.0%) |
| 3 or 4 Children | 0 (0.0%) | 0 (0.0%) |
| 5 or more Children | 0 (0.0%) | 7 (100.0%) |
| Total | 705 (94.1%) | 44 (5.9%) |
Income Below Poverty Among Single-Parent Households in Lanett
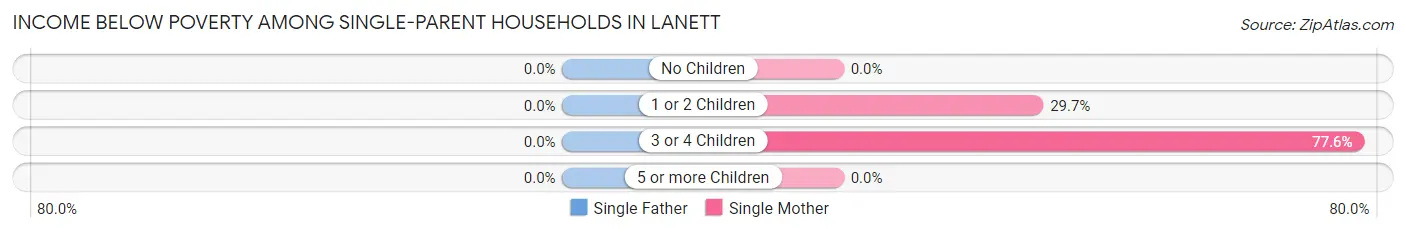
| Children | Single Father | Single Mother |
| No Children | 0 (0.0%) | 0 (0.0%) |
| 1 or 2 Children | 0 (0.0%) | 44 (29.7%) |
| 3 or 4 Children | 0 (0.0%) | 128 (77.6%) |
| 5 or more Children | 0 (0.0%) | 0 (0.0%) |
| Total | 0 (0.0%) | 172 (34.3%) |
Income Below Poverty Among Married-Couple vs Single-Parent Households in Lanett
The poverty data for Lanett shows that 44 of the married-couple family households (5.9%) and 172 of the single-parent households (22.2%) are living below the poverty level. Within the married-couple family households, those with 5 or more children have the highest poverty rate, with 7 households (100.0%) falling below the poverty line. Among the single-parent households, those with 3 or 4 children have the highest poverty rate, with 128 household (77.6%) living below poverty.
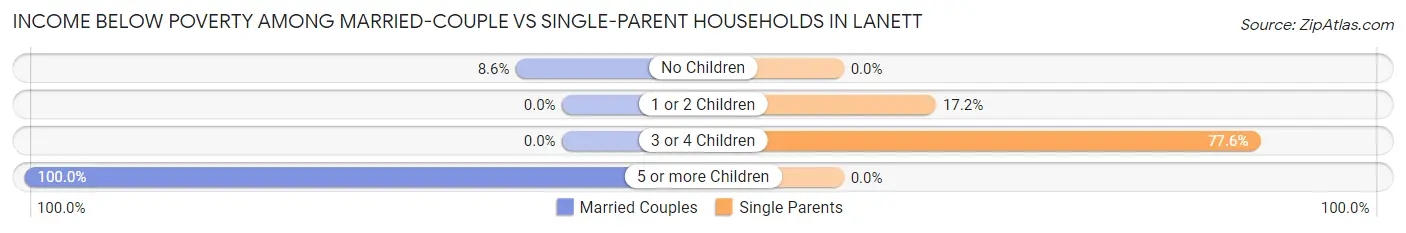
| Children | Married-Couple Families | Single-Parent Households |
| No Children | 37 (8.6%) | 0 (0.0%) |
| 1 or 2 Children | 0 (0.0%) | 44 (17.2%) |
| 3 or 4 Children | 0 (0.0%) | 128 (77.6%) |
| 5 or more Children | 7 (100.0%) | 0 (0.0%) |
| Total | 44 (5.9%) | 172 (22.2%) |
Employment Characteristics in Lanett
Employment by Class of Employer in Lanett
Among the 2,796 employed individuals in Lanett, private company employees (2,100 | 75.1%), federal government employees (212 | 7.6%), and local government employees (211 | 7.5%) make up the most common classes of employment.
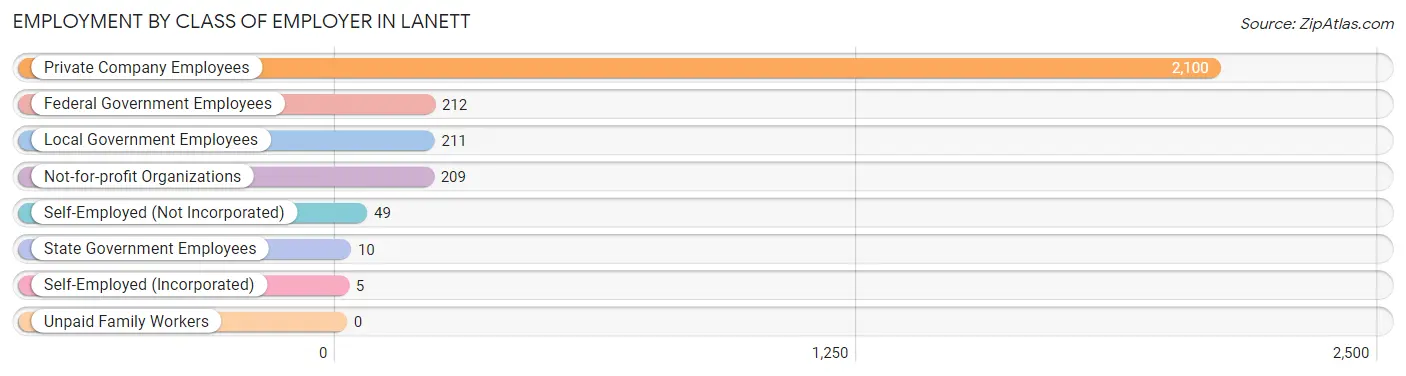
| Employer Class | # Employees | % Employees |
| Private Company Employees | 2,100 | 75.1% |
| Self-Employed (Incorporated) | 5 | 0.2% |
| Self-Employed (Not Incorporated) | 49 | 1.8% |
| Not-for-profit Organizations | 209 | 7.5% |
| Local Government Employees | 211 | 7.5% |
| State Government Employees | 10 | 0.4% |
| Federal Government Employees | 212 | 7.6% |
| Unpaid Family Workers | 0 | 0.0% |
| Total | 2,796 | 100.0% |
Employment Status by Age in Lanett
According to the labor force statistics for Lanett, out of the total population over 16 years of age (5,355), 57.0% or 3,052 individuals are in the labor force, with 5.6% or 171 of them unemployed. The age group with the highest labor force participation rate is 30 to 34 years, with 100.0% or 521 individuals in the labor force. Within the labor force, the 20 to 24 years age range has the highest percentage of unemployed individuals, with 31.4% or 138 of them being unemployed.
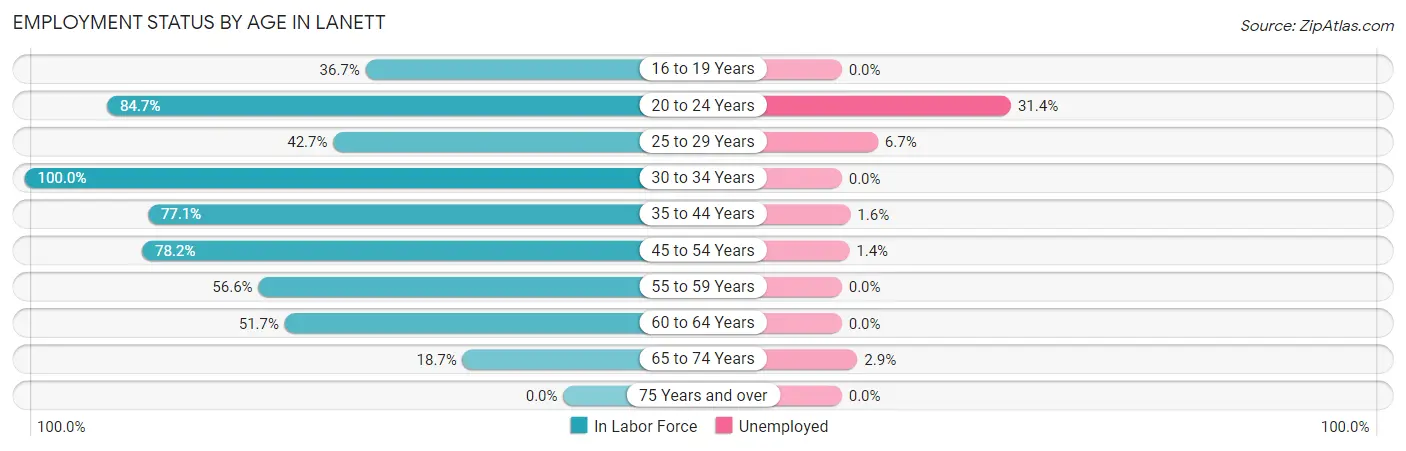
| Age Bracket | In Labor Force | Unemployed |
| 16 to 19 Years | 72 (36.7%) | 0 (0.0%) |
| 20 to 24 Years | 439 (84.7%) | 138 (31.4%) |
| 25 to 29 Years | 105 (42.7%) | 7 (6.7%) |
| 30 to 34 Years | 521 (100.0%) | 0 (0.0%) |
| 35 to 44 Years | 536 (77.1%) | 9 (1.6%) |
| 45 to 54 Years | 690 (78.2%) | 10 (1.4%) |
| 55 to 59 Years | 338 (56.6%) | 0 (0.0%) |
| 60 to 64 Years | 178 (51.7%) | 0 (0.0%) |
| 65 to 74 Years | 173 (18.7%) | 5 (2.9%) |
| 75 Years and over | 0 (0.0%) | 0 (0.0%) |
| Total | 3,052 (57.0%) | 171 (5.6%) |
Employment Status by Educational Attainment in Lanett
According to labor force statistics for Lanett, 72.1% of individuals (2,368) out of the total population between 25 and 64 years of age (3,285) are in the labor force, with 1.1% or 26 of them being unemployed. The group with the highest labor force participation rate are those with the educational attainment of bachelor's degree or higher, with 95.9% or 330 individuals in the labor force. Within the labor force, individuals with bachelor's degree or higher education have the highest percentage of unemployment, with 4.0% or 13 of them being unemployed.
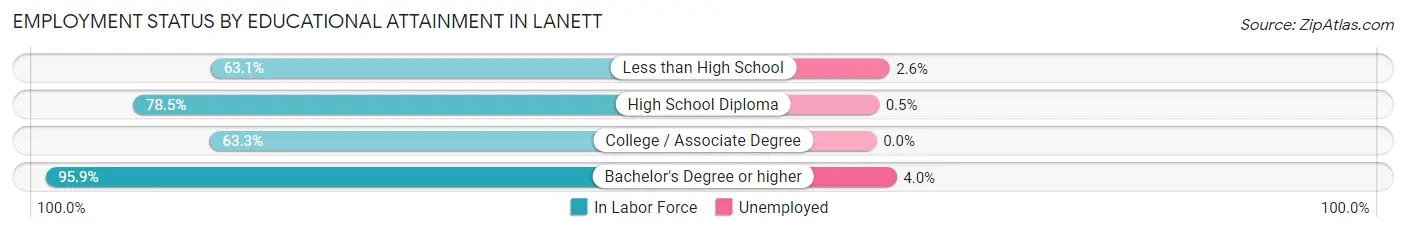
| Educational Attainment | In Labor Force | Unemployed |
| Less than High School | 304 (63.1%) | 13 (2.6%) |
| High School Diploma | 918 (78.5%) | 6 (0.5%) |
| College / Associate Degree | 816 (63.3%) | 0 (0.0%) |
| Bachelor's Degree or higher | 330 (95.9%) | 14 (4.0%) |
| Total | 2,368 (72.1%) | 36 (1.1%) |
Employment Occupations by Sex in Lanett
Management, Business, Science and Arts Occupations
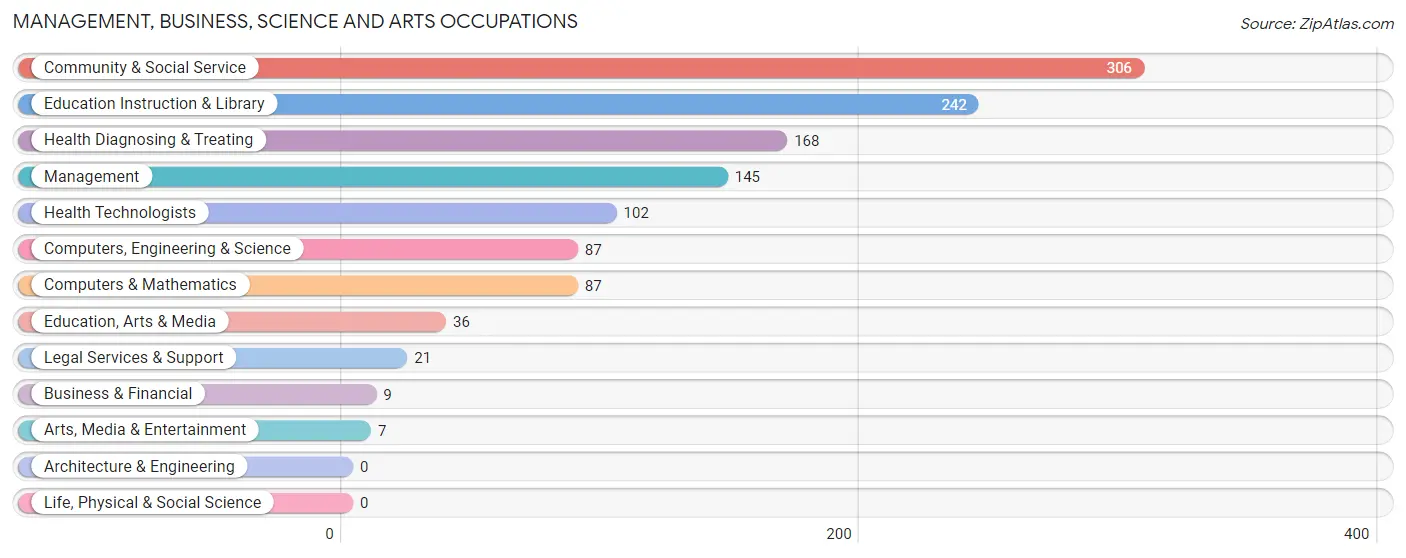
The most common Management, Business, Science and Arts occupations in Lanett are Community & Social Service (306 | 10.7%), Education Instruction & Library (242 | 8.5%), Health Diagnosing & Treating (168 | 5.9%), Management (145 | 5.1%), and Health Technologists (102 | 3.6%).
Management, Business, Science and Arts Occupations by Sex
Within the Management, Business, Science and Arts occupations in Lanett, the most male-oriented occupations are Education, Arts & Media (100.0%), Computers, Engineering & Science (85.1%), and Computers & Mathematics (85.1%), while the most female-oriented occupations are Business & Financial (100.0%), Legal Services & Support (100.0%), and Arts, Media & Entertainment (100.0%).
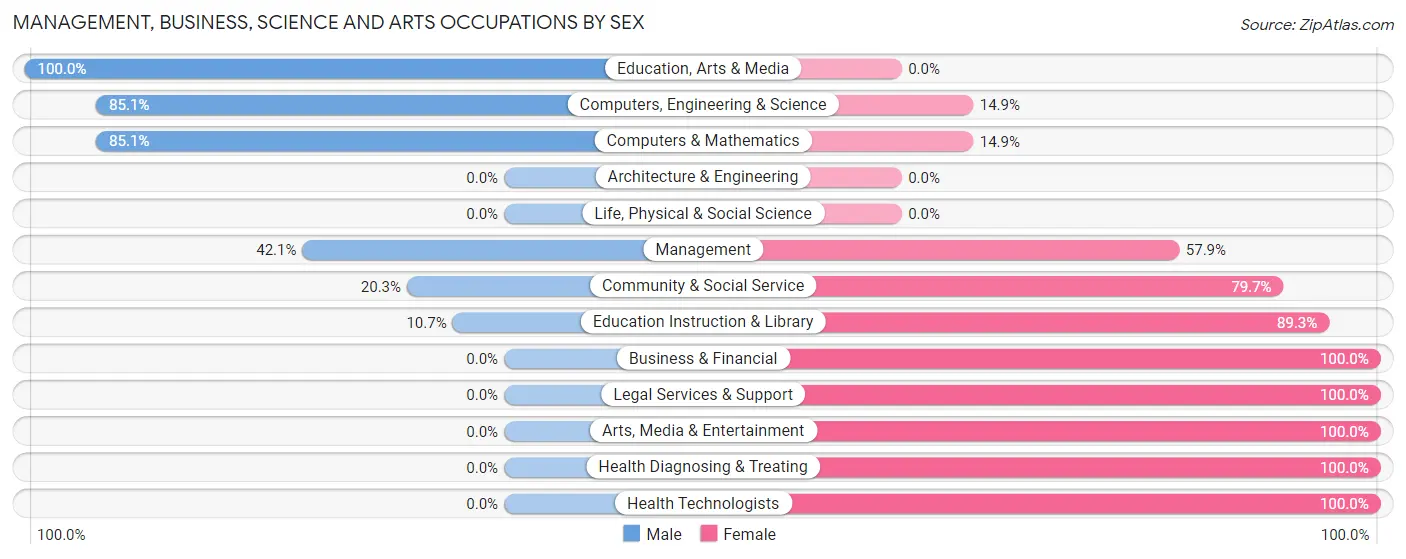
| Occupation | Male | Female |
| Management | 61 (42.1%) | 84 (57.9%) |
| Business & Financial | 0 (0.0%) | 9 (100.0%) |
| Computers, Engineering & Science | 74 (85.1%) | 13 (14.9%) |
| Computers & Mathematics | 74 (85.1%) | 13 (14.9%) |
| Architecture & Engineering | 0 (0.0%) | 0 (0.0%) |
| Life, Physical & Social Science | 0 (0.0%) | 0 (0.0%) |
| Community & Social Service | 62 (20.3%) | 244 (79.7%) |
| Education, Arts & Media | 36 (100.0%) | 0 (0.0%) |
| Legal Services & Support | 0 (0.0%) | 21 (100.0%) |
| Education Instruction & Library | 26 (10.7%) | 216 (89.3%) |
| Arts, Media & Entertainment | 0 (0.0%) | 7 (100.0%) |
| Health Diagnosing & Treating | 0 (0.0%) | 168 (100.0%) |
| Health Technologists | 0 (0.0%) | 102 (100.0%) |
| Total (Category) | 197 (27.6%) | 518 (72.5%) |
| Total (Overall) | 1,407 (49.3%) | 1,449 (50.7%) |
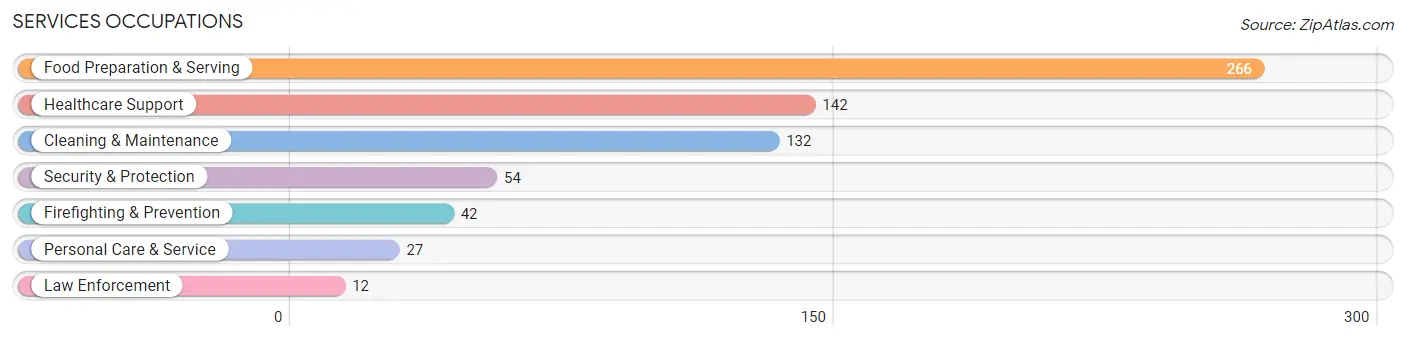
Services Occupations
The most common Services occupations in Lanett are Food Preparation & Serving (266 | 9.3%), Healthcare Support (142 | 5.0%), Cleaning & Maintenance (132 | 4.6%), Security & Protection (54 | 1.9%), and Firefighting & Prevention (42 | 1.5%).
Services Occupations by Sex
Within the Services occupations in Lanett, the most male-oriented occupations are Law Enforcement (100.0%), Security & Protection (64.8%), and Cleaning & Maintenance (64.4%), while the most female-oriented occupations are Healthcare Support (100.0%), Personal Care & Service (100.0%), and Food Preparation & Serving (47.7%).
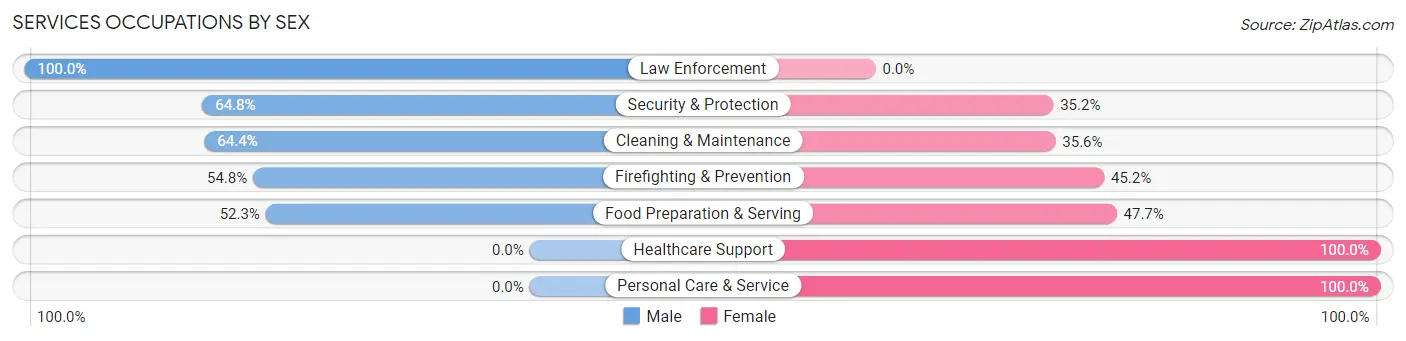
| Occupation | Male | Female |
| Healthcare Support | 0 (0.0%) | 142 (100.0%) |
| Security & Protection | 35 (64.8%) | 19 (35.2%) |
| Firefighting & Prevention | 23 (54.8%) | 19 (45.2%) |
| Law Enforcement | 12 (100.0%) | 0 (0.0%) |
| Food Preparation & Serving | 139 (52.3%) | 127 (47.7%) |
| Cleaning & Maintenance | 85 (64.4%) | 47 (35.6%) |
| Personal Care & Service | 0 (0.0%) | 27 (100.0%) |
| Total (Category) | 259 (41.7%) | 362 (58.3%) |
| Total (Overall) | 1,407 (49.3%) | 1,449 (50.7%) |
Sales and Office Occupations
The most common Sales and Office occupations in Lanett are Sales & Related (271 | 9.5%), and Office & Administration (162 | 5.7%).

Sales and Office Occupations by Sex
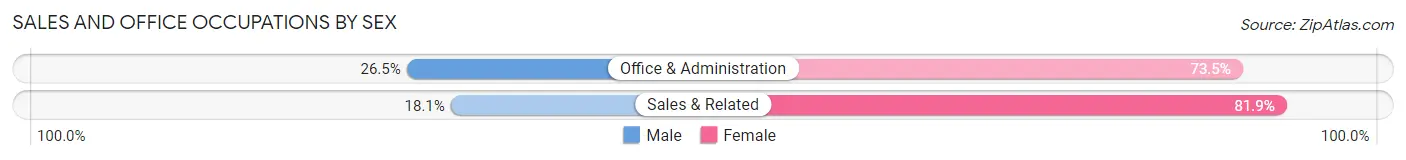
| Occupation | Male | Female |
| Sales & Related | 49 (18.1%) | 222 (81.9%) |
| Office & Administration | 43 (26.5%) | 119 (73.5%) |
| Total (Category) | 92 (21.2%) | 341 (78.7%) |
| Total (Overall) | 1,407 (49.3%) | 1,449 (50.7%) |
Natural Resources, Construction and Maintenance Occupations
The most common Natural Resources, Construction and Maintenance occupations in Lanett are Construction & Extraction (99 | 3.5%), and Installation, Maintenance & Repair (44 | 1.5%).
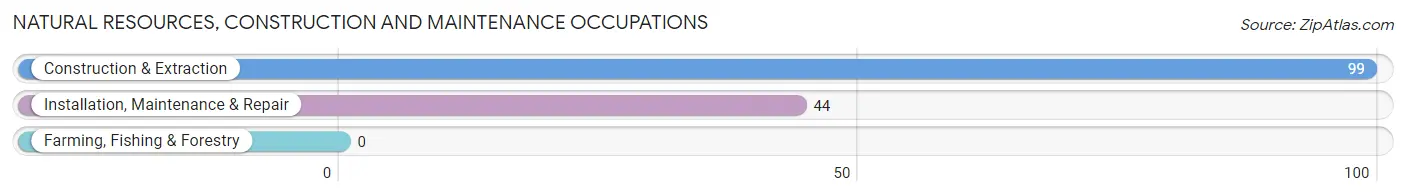
Natural Resources, Construction and Maintenance Occupations by Sex

| Occupation | Male | Female |
| Farming, Fishing & Forestry | 0 (0.0%) | 0 (0.0%) |
| Construction & Extraction | 99 (100.0%) | 0 (0.0%) |
| Installation, Maintenance & Repair | 44 (100.0%) | 0 (0.0%) |
| Total (Category) | 143 (100.0%) | 0 (0.0%) |
| Total (Overall) | 1,407 (49.3%) | 1,449 (50.7%) |
Production, Transportation and Moving Occupations
The most common Production, Transportation and Moving occupations in Lanett are Production (476 | 16.7%), Material Moving (443 | 15.5%), and Transportation (25 | 0.9%).
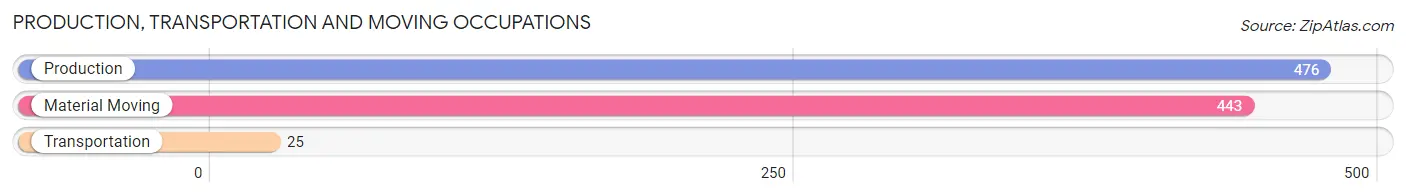
Production, Transportation and Moving Occupations by Sex
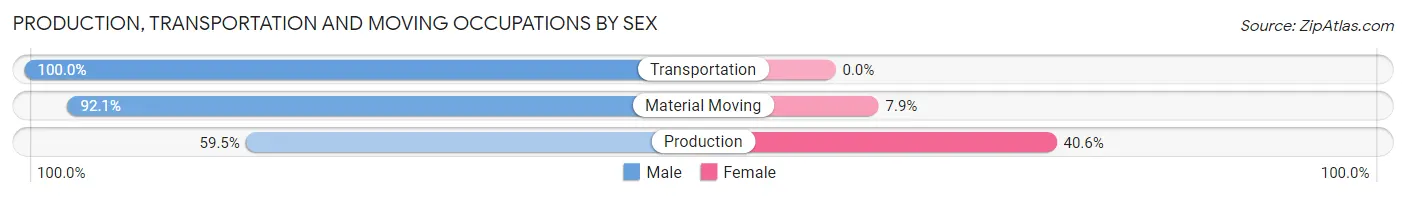
| Occupation | Male | Female |
| Production | 283 (59.5%) | 193 (40.6%) |
| Transportation | 25 (100.0%) | 0 (0.0%) |
| Material Moving | 408 (92.1%) | 35 (7.9%) |
| Total (Category) | 716 (75.8%) | 228 (24.1%) |
| Total (Overall) | 1,407 (49.3%) | 1,449 (50.7%) |
Employment Industries by Sex in Lanett
Employment Industries in Lanett
The major employment industries in Lanett include Manufacturing (815 | 28.5%), Health Care & Social Assistance (391 | 13.7%), Educational Services (338 | 11.8%), Retail Trade (318 | 11.1%), and Accommodation & Food Services (158 | 5.5%).
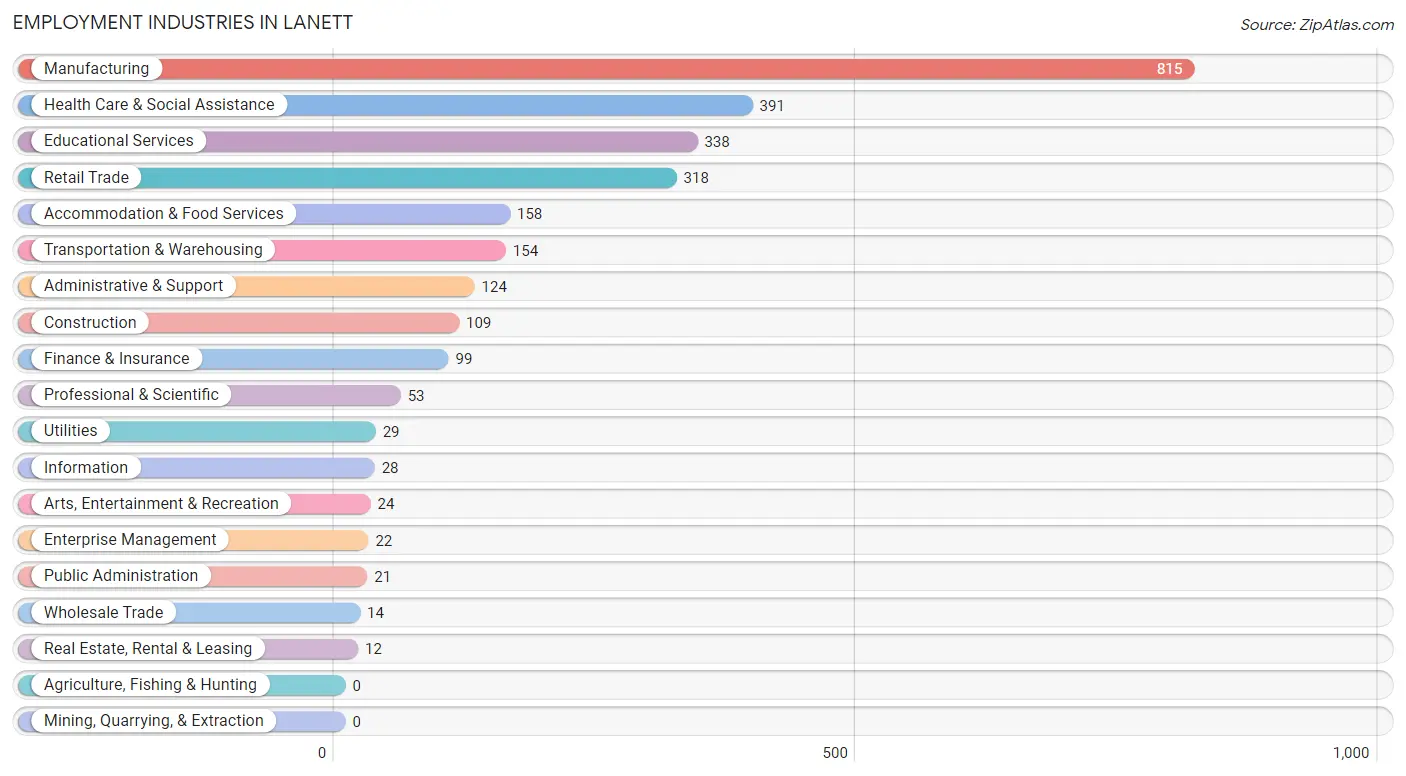
Employment Industries by Sex in Lanett
The Lanett industries that see more men than women are Construction (100.0%), Wholesale Trade (100.0%), and Transportation & Warehousing (100.0%), whereas the industries that tend to have a higher number of women are Information (100.0%), Enterprise Management (100.0%), and Educational Services (84.3%).
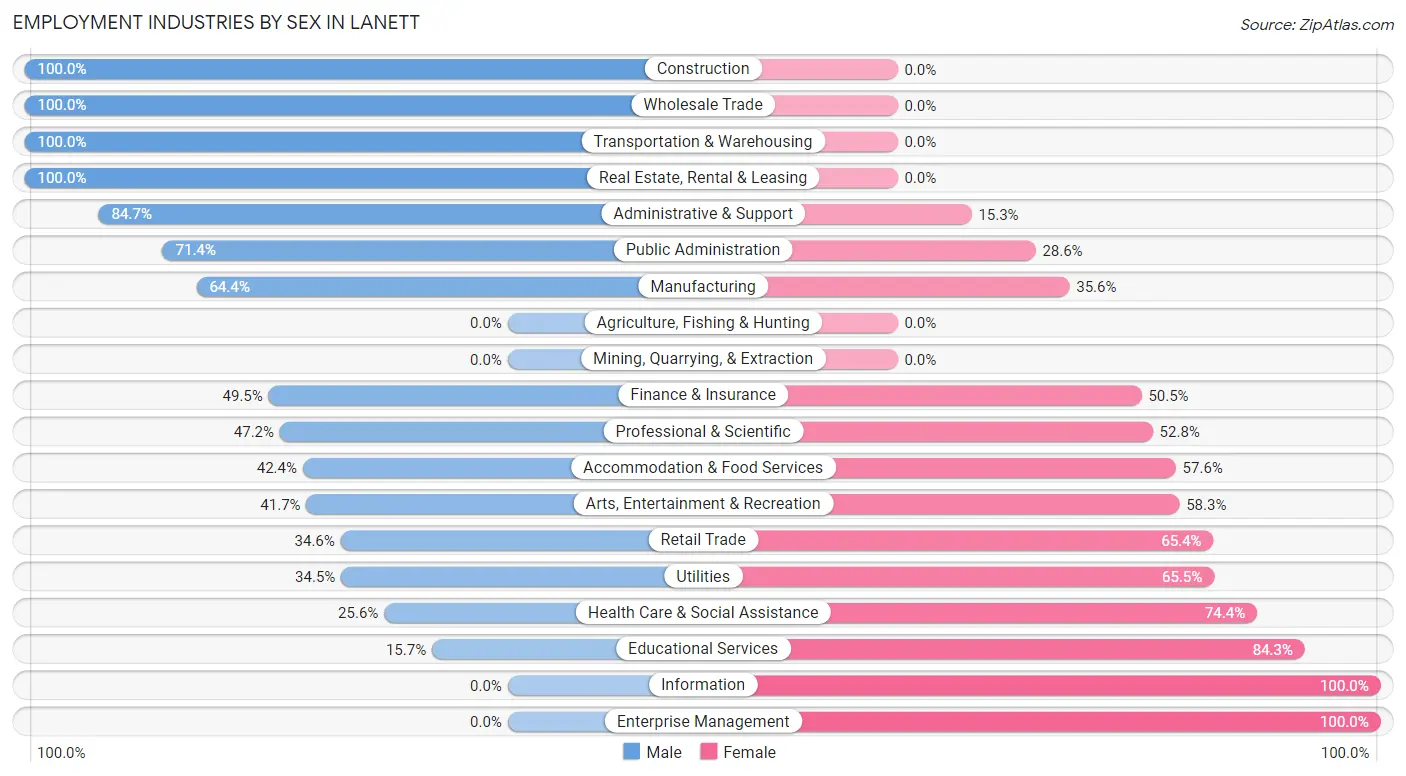
| Industry | Male | Female |
| Agriculture, Fishing & Hunting | 0 (0.0%) | 0 (0.0%) |
| Mining, Quarrying, & Extraction | 0 (0.0%) | 0 (0.0%) |
| Construction | 109 (100.0%) | 0 (0.0%) |
| Manufacturing | 525 (64.4%) | 290 (35.6%) |
| Wholesale Trade | 14 (100.0%) | 0 (0.0%) |
| Retail Trade | 110 (34.6%) | 208 (65.4%) |
| Transportation & Warehousing | 154 (100.0%) | 0 (0.0%) |
| Utilities | 10 (34.5%) | 19 (65.5%) |
| Information | 0 (0.0%) | 28 (100.0%) |
| Finance & Insurance | 49 (49.5%) | 50 (50.5%) |
| Real Estate, Rental & Leasing | 12 (100.0%) | 0 (0.0%) |
| Professional & Scientific | 25 (47.2%) | 28 (52.8%) |
| Enterprise Management | 0 (0.0%) | 22 (100.0%) |
| Administrative & Support | 105 (84.7%) | 19 (15.3%) |
| Educational Services | 53 (15.7%) | 285 (84.3%) |
| Health Care & Social Assistance | 100 (25.6%) | 291 (74.4%) |
| Arts, Entertainment & Recreation | 10 (41.7%) | 14 (58.3%) |
| Accommodation & Food Services | 67 (42.4%) | 91 (57.6%) |
| Public Administration | 15 (71.4%) | 6 (28.6%) |
| Total | 1,407 (49.3%) | 1,449 (50.7%) |
Education in Lanett
School Enrollment in Lanett
The most common levels of schooling among the 1,605 students in Lanett are middle school (504 | 31.4%), college / undergraduate (390 | 24.3%), and high school (276 | 17.2%).
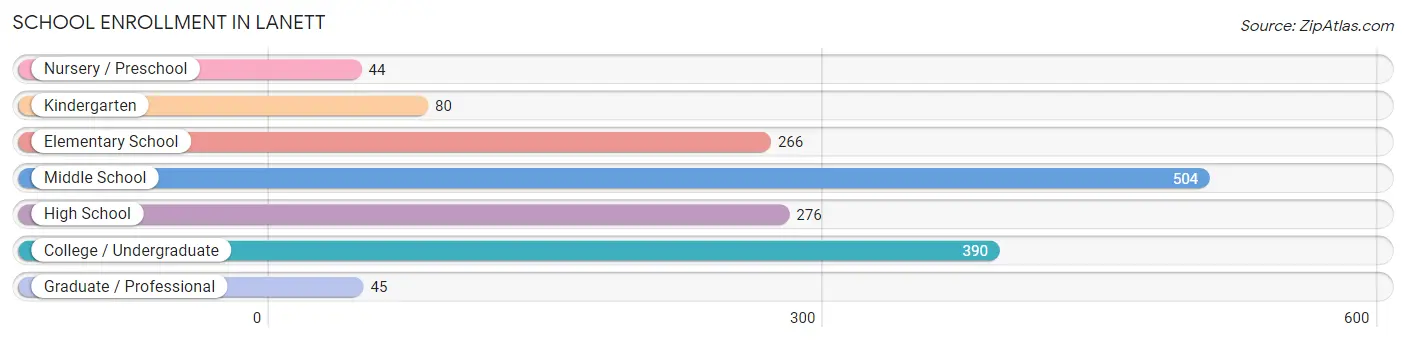
| School Level | # Students | % Students |
| Nursery / Preschool | 44 | 2.7% |
| Kindergarten | 80 | 5.0% |
| Elementary School | 266 | 16.6% |
| Middle School | 504 | 31.4% |
| High School | 276 | 17.2% |
| College / Undergraduate | 390 | 24.3% |
| Graduate / Professional | 45 | 2.8% |
| Total | 1,605 | 100.0% |
School Enrollment by Age by Funding Source in Lanett
Out of a total of 1,605 students who are enrolled in schools in Lanett, 177 (11.0%) attend a private institution, while the remaining 1,428 (89.0%) are enrolled in public schools. The age group of 35 years and over has the highest likelihood of being enrolled in private schools, with 45 (53.6% in the age bracket) enrolled. Conversely, the age group of 18 to 19 year olds has the lowest likelihood of being enrolled in a private school, with 63 (100.0% in the age bracket) attending a public institution.
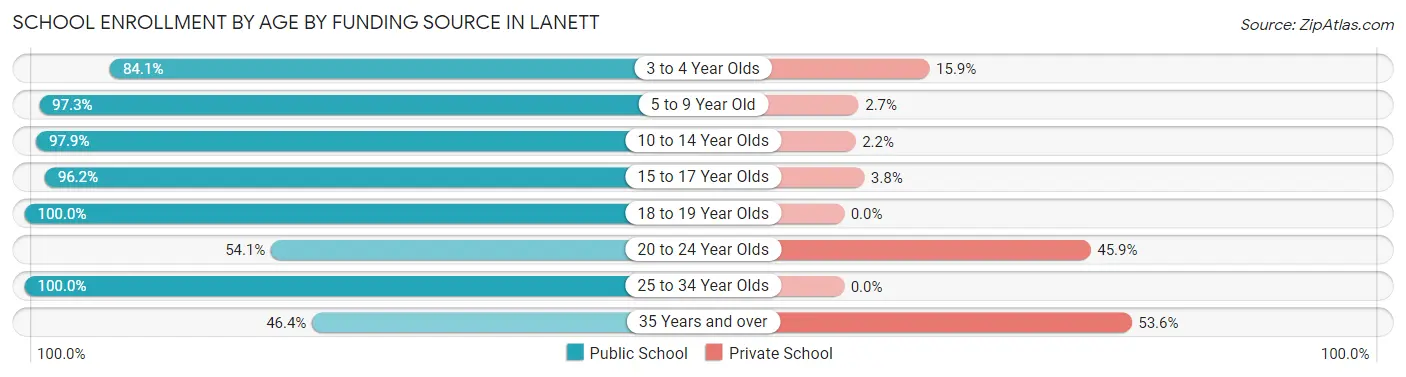
| Age Bracket | Public School | Private School |
| 3 to 4 Year Olds | 37 (84.1%) | 7 (15.9%) |
| 5 to 9 Year Old | 250 (97.3%) | 7 (2.7%) |
| 10 to 14 Year Olds | 593 (97.9%) | 13 (2.1%) |
| 15 to 17 Year Olds | 204 (96.2%) | 8 (3.8%) |
| 18 to 19 Year Olds | 63 (100.0%) | 0 (0.0%) |
| 20 to 24 Year Olds | 113 (54.1%) | 96 (45.9%) |
| 25 to 34 Year Olds | 130 (100.0%) | 0 (0.0%) |
| 35 Years and over | 39 (46.4%) | 45 (53.6%) |
| Total | 1,428 (89.0%) | 177 (11.0%) |
Educational Attainment by Field of Study in Lanett
Business (151 | 28.9%), science & technology (141 | 27.0%), education (83 | 15.9%), liberal arts & history (28 | 5.4%), and social sciences (23 | 4.4%) are the most common fields of study among 522 individuals in Lanett who have obtained a bachelor's degree or higher.

| Field of Study | # Graduates | % Graduates |
| Computers & Mathematics | 16 | 3.1% |
| Bio, Nature & Agricultural | 22 | 4.2% |
| Physical & Health Sciences | 0 | 0.0% |
| Psychology | 7 | 1.3% |
| Social Sciences | 23 | 4.4% |
| Engineering | 3 | 0.6% |
| Multidisciplinary Studies | 0 | 0.0% |
| Science & Technology | 141 | 27.0% |
| Business | 151 | 28.9% |
| Education | 83 | 15.9% |
| Literature & Languages | 10 | 1.9% |
| Liberal Arts & History | 28 | 5.4% |
| Visual & Performing Arts | 14 | 2.7% |
| Communications | 7 | 1.3% |
| Arts & Humanities | 17 | 3.3% |
| Total | 522 | 100.0% |
Transportation & Commute in Lanett
Vehicle Availability by Sex in Lanett
The most prevalent vehicle ownership categories in Lanett are males with 2 vehicles (438, accounting for 31.7%) and females with 2 vehicles (371, making up 31.9%).
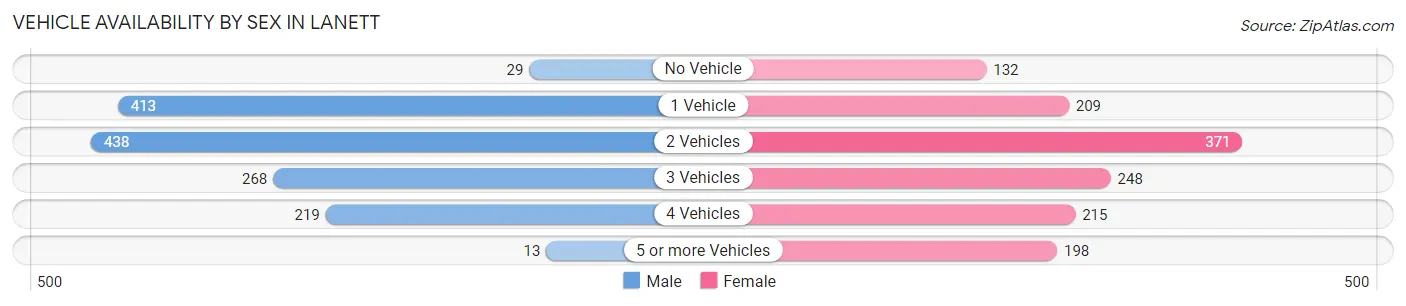
| Vehicles Available | Male | Female |
| No Vehicle | 29 (2.1%) | 132 (9.6%) |
| 1 Vehicle | 413 (29.9%) | 209 (15.2%) |
| 2 Vehicles | 438 (31.7%) | 371 (27.0%) |
| 3 Vehicles | 268 (19.4%) | 248 (18.1%) |
| 4 Vehicles | 219 (15.9%) | 215 (15.7%) |
| 5 or more Vehicles | 13 (0.9%) | 198 (14.4%) |
| Total | 1,380 (100.0%) | 1,373 (100.0%) |
Commute Time in Lanett
The most frequently occuring commute durations in Lanett are 10 to 14 minutes (711 commuters, 25.9%), 15 to 19 minutes (579 commuters, 21.1%), and 30 to 34 minutes (456 commuters, 16.6%).
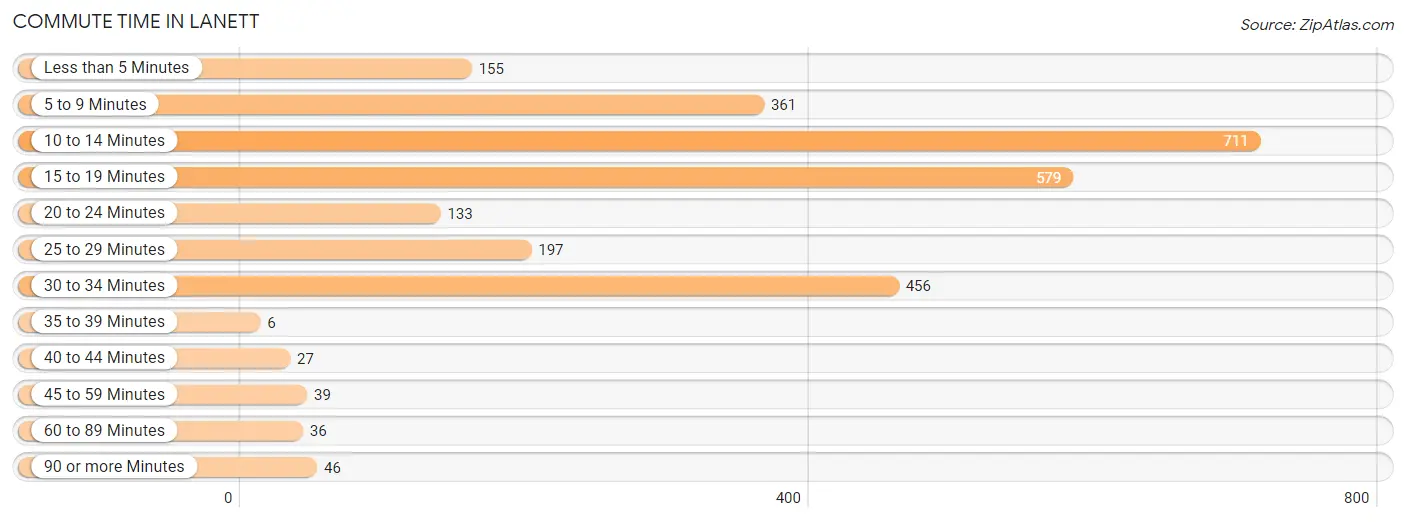
| Commute Time | # Commuters | % Commuters |
| Less than 5 Minutes | 155 | 5.6% |
| 5 to 9 Minutes | 361 | 13.2% |
| 10 to 14 Minutes | 711 | 25.9% |
| 15 to 19 Minutes | 579 | 21.1% |
| 20 to 24 Minutes | 133 | 4.8% |
| 25 to 29 Minutes | 197 | 7.2% |
| 30 to 34 Minutes | 456 | 16.6% |
| 35 to 39 Minutes | 6 | 0.2% |
| 40 to 44 Minutes | 27 | 1.0% |
| 45 to 59 Minutes | 39 | 1.4% |
| 60 to 89 Minutes | 36 | 1.3% |
| 90 or more Minutes | 46 | 1.7% |
Commute Time by Sex in Lanett
The most common commute times in Lanett are 30 to 34 minutes (316 commuters, 23.1%) for males and 10 to 14 minutes (439 commuters, 31.8%) for females.
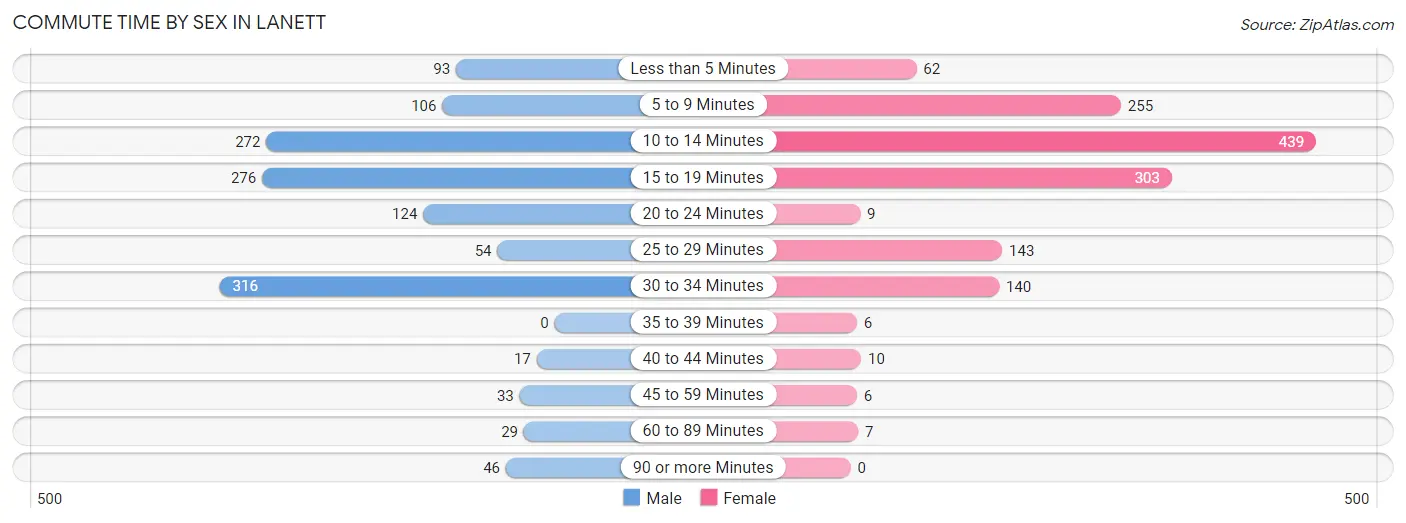
| Commute Time | Male | Female |
| Less than 5 Minutes | 93 (6.8%) | 62 (4.5%) |
| 5 to 9 Minutes | 106 (7.8%) | 255 (18.5%) |
| 10 to 14 Minutes | 272 (19.9%) | 439 (31.8%) |
| 15 to 19 Minutes | 276 (20.2%) | 303 (22.0%) |
| 20 to 24 Minutes | 124 (9.1%) | 9 (0.6%) |
| 25 to 29 Minutes | 54 (4.0%) | 143 (10.4%) |
| 30 to 34 Minutes | 316 (23.1%) | 140 (10.1%) |
| 35 to 39 Minutes | 0 (0.0%) | 6 (0.4%) |
| 40 to 44 Minutes | 17 (1.2%) | 10 (0.7%) |
| 45 to 59 Minutes | 33 (2.4%) | 6 (0.4%) |
| 60 to 89 Minutes | 29 (2.1%) | 7 (0.5%) |
| 90 or more Minutes | 46 (3.4%) | 0 (0.0%) |
Time of Departure to Work by Sex in Lanett
The most frequent times of departure to work in Lanett are 7:00 AM to 7:29 AM (254, 18.6%) for males and 7:30 AM to 7:59 AM (292, 21.2%) for females.
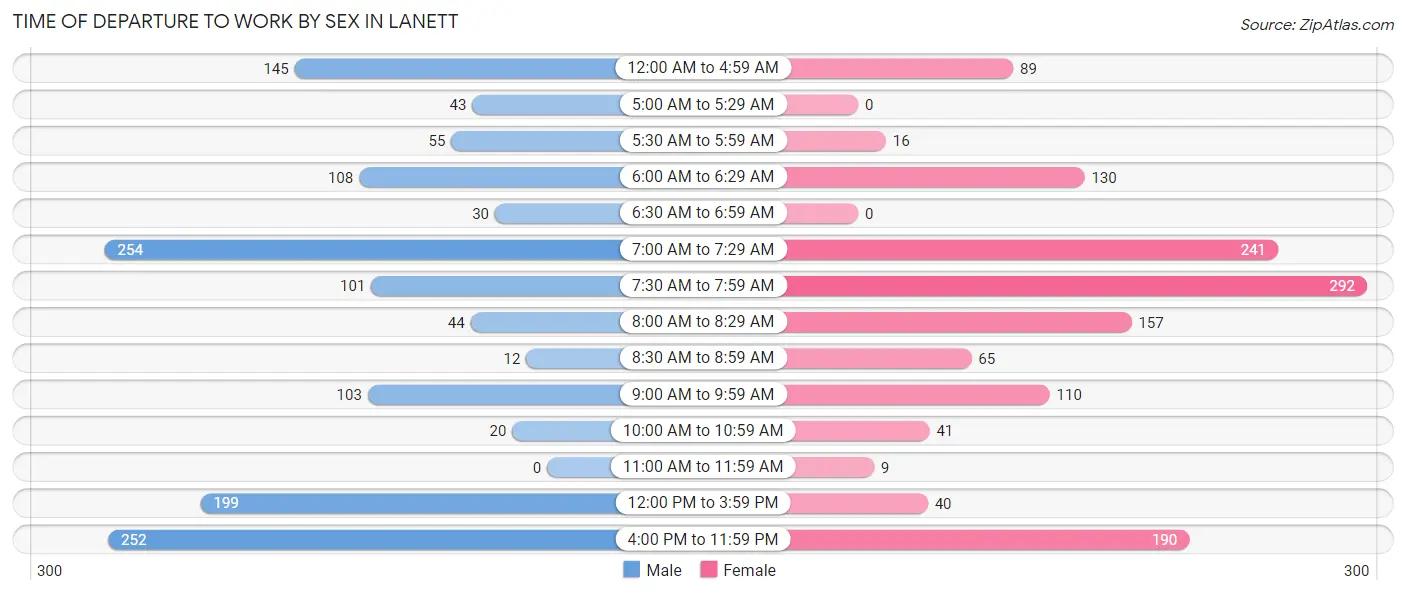
| Time of Departure | Male | Female |
| 12:00 AM to 4:59 AM | 145 (10.6%) | 89 (6.5%) |
| 5:00 AM to 5:29 AM | 43 (3.2%) | 0 (0.0%) |
| 5:30 AM to 5:59 AM | 55 (4.0%) | 16 (1.2%) |
| 6:00 AM to 6:29 AM | 108 (7.9%) | 130 (9.4%) |
| 6:30 AM to 6:59 AM | 30 (2.2%) | 0 (0.0%) |
| 7:00 AM to 7:29 AM | 254 (18.6%) | 241 (17.5%) |
| 7:30 AM to 7:59 AM | 101 (7.4%) | 292 (21.2%) |
| 8:00 AM to 8:29 AM | 44 (3.2%) | 157 (11.4%) |
| 8:30 AM to 8:59 AM | 12 (0.9%) | 65 (4.7%) |
| 9:00 AM to 9:59 AM | 103 (7.5%) | 110 (8.0%) |
| 10:00 AM to 10:59 AM | 20 (1.5%) | 41 (3.0%) |
| 11:00 AM to 11:59 AM | 0 (0.0%) | 9 (0.6%) |
| 12:00 PM to 3:59 PM | 199 (14.6%) | 40 (2.9%) |
| 4:00 PM to 11:59 PM | 252 (18.4%) | 190 (13.8%) |
| Total | 1,366 (100.0%) | 1,380 (100.0%) |
Housing Occupancy in Lanett
Occupancy by Ownership in Lanett
Of the total 2,430 dwellings in Lanett, owner-occupied units account for 1,510 (62.1%), while renter-occupied units make up 920 (37.9%).
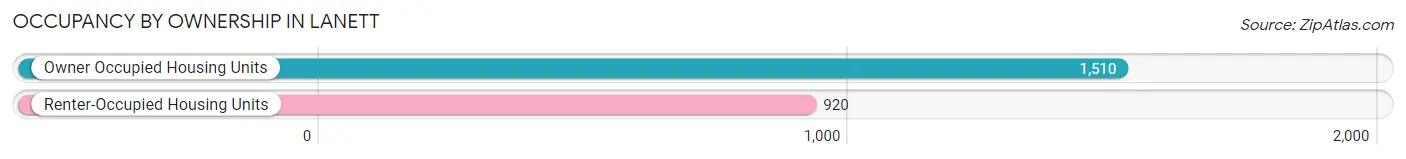
| Occupancy | # Housing Units | % Housing Units |
| Owner Occupied Housing Units | 1,510 | 62.1% |
| Renter-Occupied Housing Units | 920 | 37.9% |
| Total Occupied Housing Units | 2,430 | 100.0% |
Occupancy by Household Size in Lanett
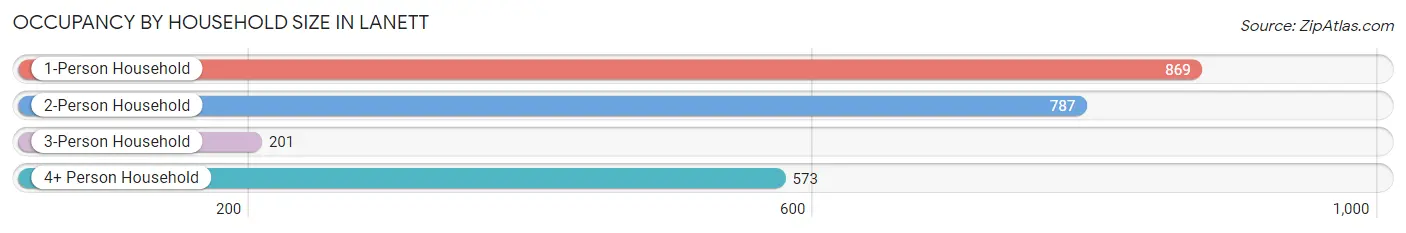
| Household Size | # Housing Units | % Housing Units |
| 1-Person Household | 869 | 35.8% |
| 2-Person Household | 787 | 32.4% |
| 3-Person Household | 201 | 8.3% |
| 4+ Person Household | 573 | 23.6% |
| Total Housing Units | 2,430 | 100.0% |
Occupancy by Ownership by Household Size in Lanett
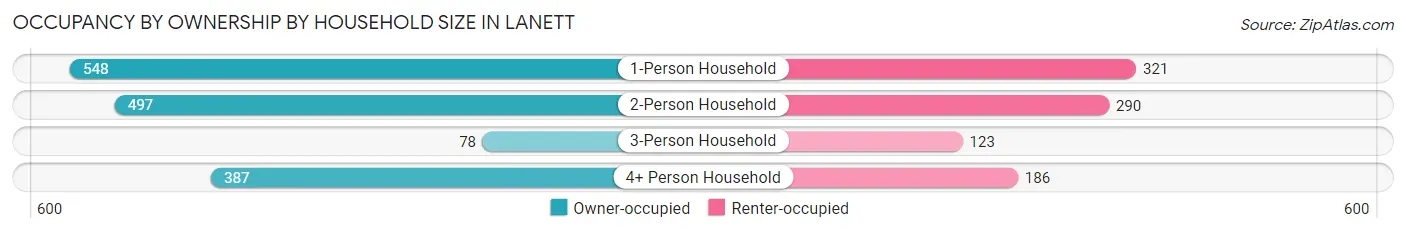
| Household Size | Owner-occupied | Renter-occupied |
| 1-Person Household | 548 (63.1%) | 321 (36.9%) |
| 2-Person Household | 497 (63.1%) | 290 (36.8%) |
| 3-Person Household | 78 (38.8%) | 123 (61.2%) |
| 4+ Person Household | 387 (67.5%) | 186 (32.5%) |
| Total Housing Units | 1,510 (62.1%) | 920 (37.9%) |
Occupancy by Educational Attainment in Lanett
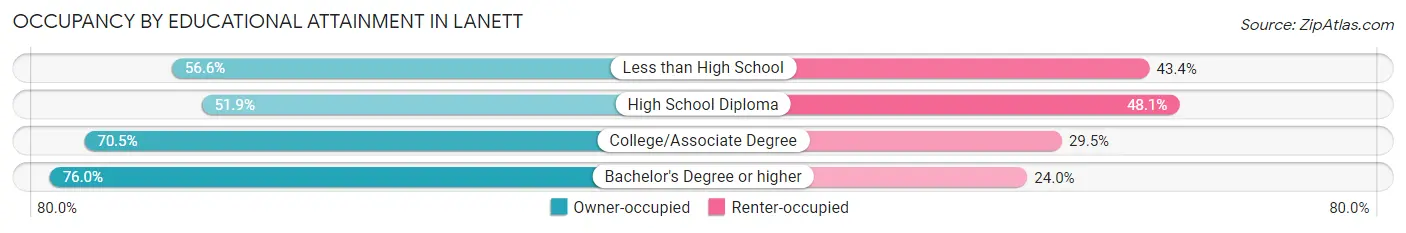
| Household Size | Owner-occupied | Renter-occupied |
| Less than High School | 286 (56.6%) | 219 (43.4%) |
| High School Diploma | 415 (51.9%) | 384 (48.1%) |
| College/Associate Degree | 603 (70.5%) | 252 (29.5%) |
| Bachelor's Degree or higher | 206 (76.0%) | 65 (24.0%) |
Occupancy by Age of Householder in Lanett
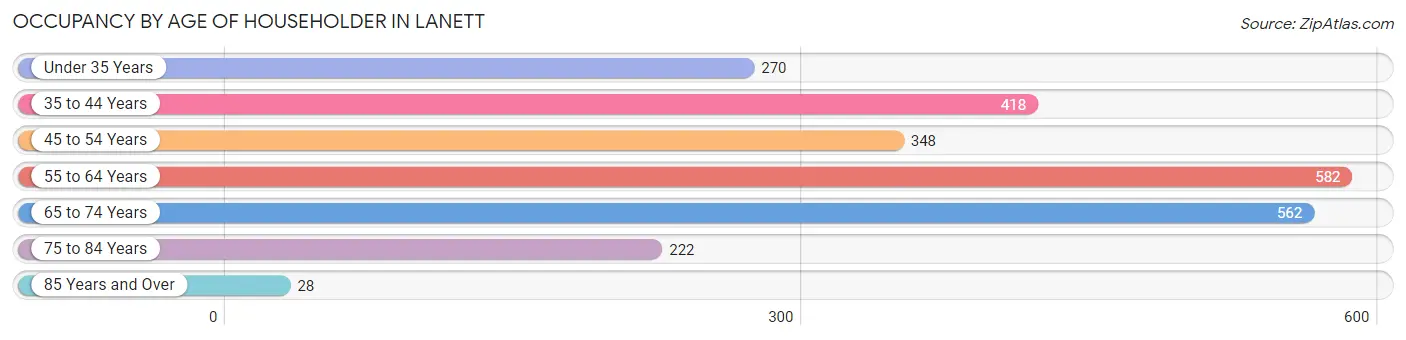
| Age Bracket | # Households | % Households |
| Under 35 Years | 270 | 11.1% |
| 35 to 44 Years | 418 | 17.2% |
| 45 to 54 Years | 348 | 14.3% |
| 55 to 64 Years | 582 | 23.9% |
| 65 to 74 Years | 562 | 23.1% |
| 75 to 84 Years | 222 | 9.1% |
| 85 Years and Over | 28 | 1.1% |
| Total | 2,430 | 100.0% |
Housing Finances in Lanett
Median Income by Occupancy in Lanett
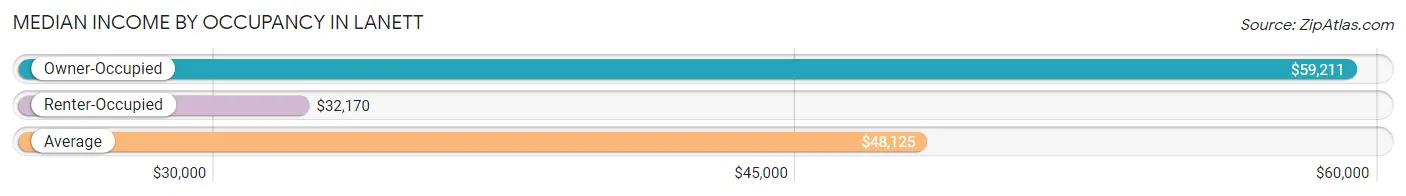
| Occupancy Type | # Households | Median Income |
| Owner-Occupied | 1,510 (62.1%) | $59,211 |
| Renter-Occupied | 920 (37.9%) | $32,170 |
| Average | 2,430 (100.0%) | $48,125 |
Occupancy by Householder Income Bracket in Lanett
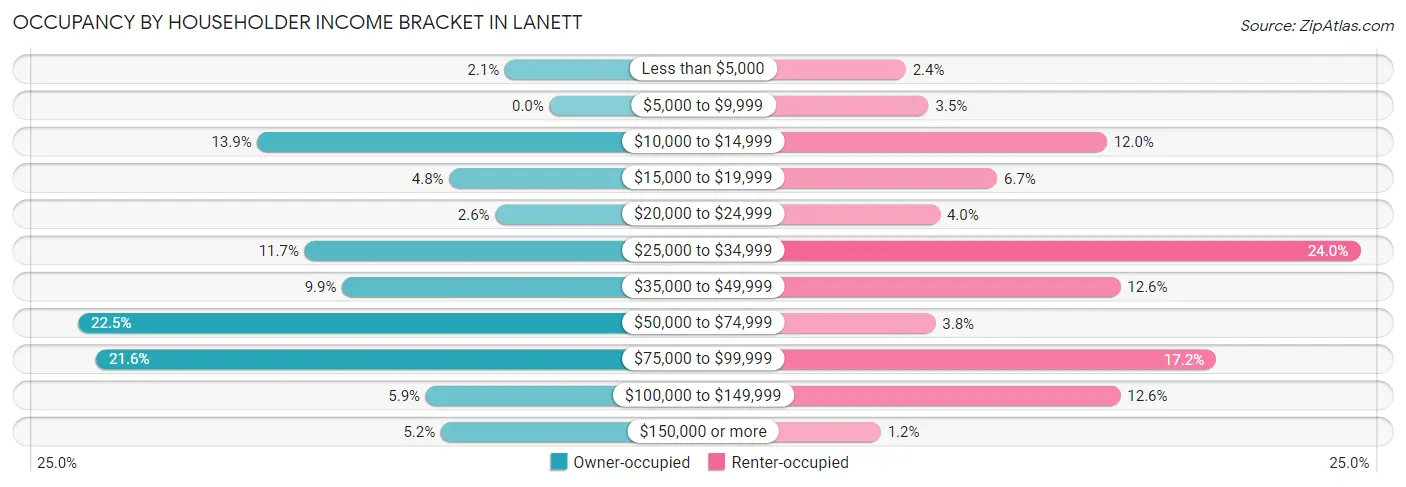
| Income Bracket | Owner-occupied | Renter-occupied |
| Less than $5,000 | 32 (2.1%) | 22 (2.4%) |
| $5,000 to $9,999 | 0 (0.0%) | 32 (3.5%) |
| $10,000 to $14,999 | 210 (13.9%) | 110 (12.0%) |
| $15,000 to $19,999 | 72 (4.8%) | 62 (6.7%) |
| $20,000 to $24,999 | 39 (2.6%) | 37 (4.0%) |
| $25,000 to $34,999 | 176 (11.7%) | 221 (24.0%) |
| $35,000 to $49,999 | 149 (9.9%) | 116 (12.6%) |
| $50,000 to $74,999 | 339 (22.5%) | 35 (3.8%) |
| $75,000 to $99,999 | 326 (21.6%) | 158 (17.2%) |
| $100,000 to $149,999 | 89 (5.9%) | 116 (12.6%) |
| $150,000 or more | 78 (5.2%) | 11 (1.2%) |
| Total | 1,510 (100.0%) | 920 (100.0%) |
Monthly Housing Cost Tiers in Lanett
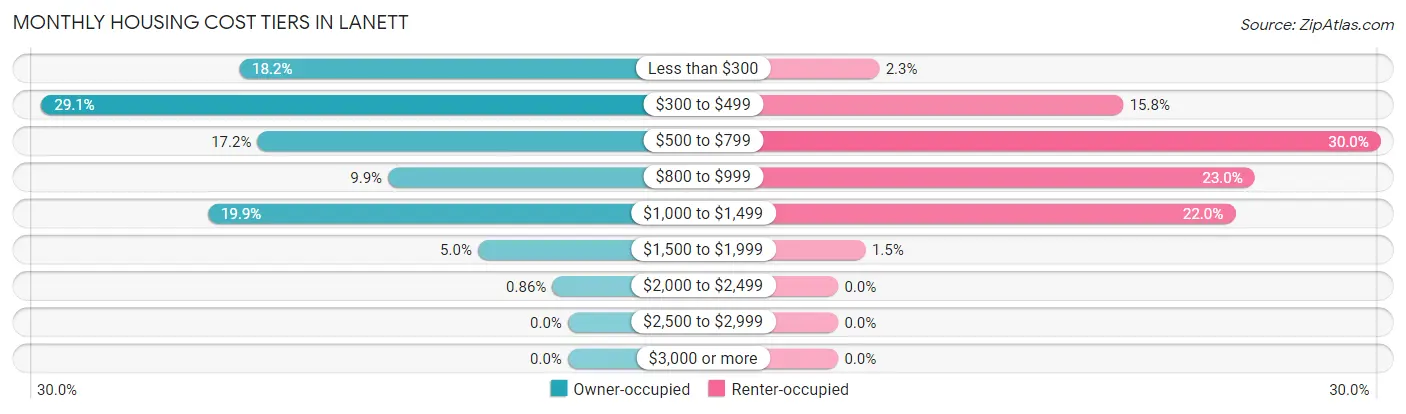
| Monthly Cost | Owner-occupied | Renter-occupied |
| Less than $300 | 274 (18.1%) | 21 (2.3%) |
| $300 to $499 | 439 (29.1%) | 145 (15.8%) |
| $500 to $799 | 259 (17.2%) | 276 (30.0%) |
| $800 to $999 | 150 (9.9%) | 212 (23.0%) |
| $1,000 to $1,499 | 300 (19.9%) | 202 (22.0%) |
| $1,500 to $1,999 | 75 (5.0%) | 14 (1.5%) |
| $2,000 to $2,499 | 13 (0.9%) | 0 (0.0%) |
| $2,500 to $2,999 | 0 (0.0%) | 0 (0.0%) |
| $3,000 or more | 0 (0.0%) | 0 (0.0%) |
| Total | 1,510 (100.0%) | 920 (100.0%) |
Physical Housing Characteristics in Lanett
Housing Structures in Lanett
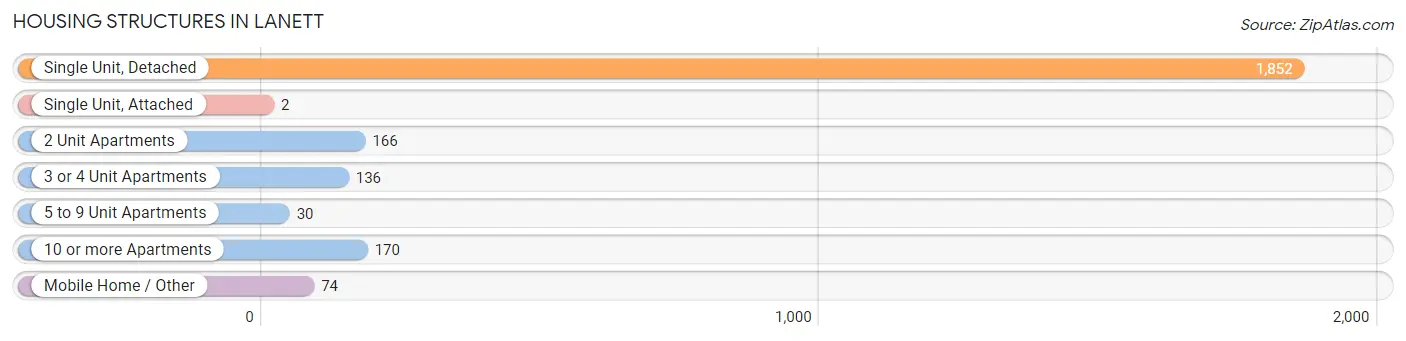
| Structure Type | # Housing Units | % Housing Units |
| Single Unit, Detached | 1,852 | 76.2% |
| Single Unit, Attached | 2 | 0.1% |
| 2 Unit Apartments | 166 | 6.8% |
| 3 or 4 Unit Apartments | 136 | 5.6% |
| 5 to 9 Unit Apartments | 30 | 1.2% |
| 10 or more Apartments | 170 | 7.0% |
| Mobile Home / Other | 74 | 3.0% |
| Total | 2,430 | 100.0% |
Housing Structures by Occupancy in Lanett
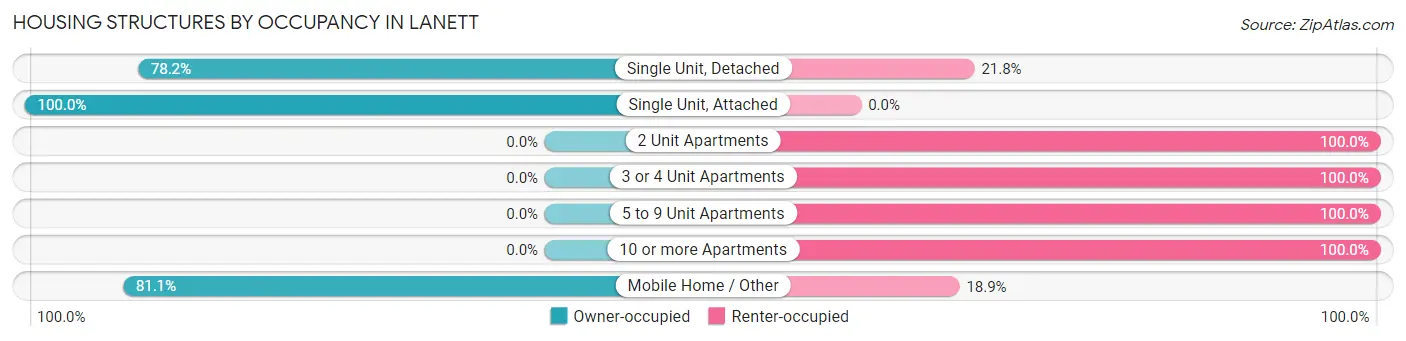
| Structure Type | Owner-occupied | Renter-occupied |
| Single Unit, Detached | 1,448 (78.2%) | 404 (21.8%) |
| Single Unit, Attached | 2 (100.0%) | 0 (0.0%) |
| 2 Unit Apartments | 0 (0.0%) | 166 (100.0%) |
| 3 or 4 Unit Apartments | 0 (0.0%) | 136 (100.0%) |
| 5 to 9 Unit Apartments | 0 (0.0%) | 30 (100.0%) |
| 10 or more Apartments | 0 (0.0%) | 170 (100.0%) |
| Mobile Home / Other | 60 (81.1%) | 14 (18.9%) |
| Total | 1,510 (62.1%) | 920 (37.9%) |
Housing Structures by Number of Rooms in Lanett
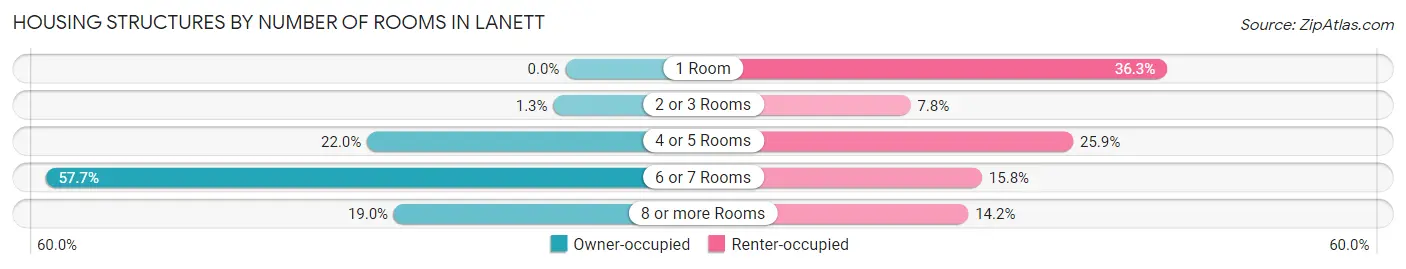
| Number of Rooms | Owner-occupied | Renter-occupied |
| 1 Room | 0 (0.0%) | 334 (36.3%) |
| 2 or 3 Rooms | 20 (1.3%) | 72 (7.8%) |
| 4 or 5 Rooms | 332 (22.0%) | 238 (25.9%) |
| 6 or 7 Rooms | 871 (57.7%) | 145 (15.8%) |
| 8 or more Rooms | 287 (19.0%) | 131 (14.2%) |
| Total | 1,510 (100.0%) | 920 (100.0%) |
Housing Structure by Heating Type in Lanett
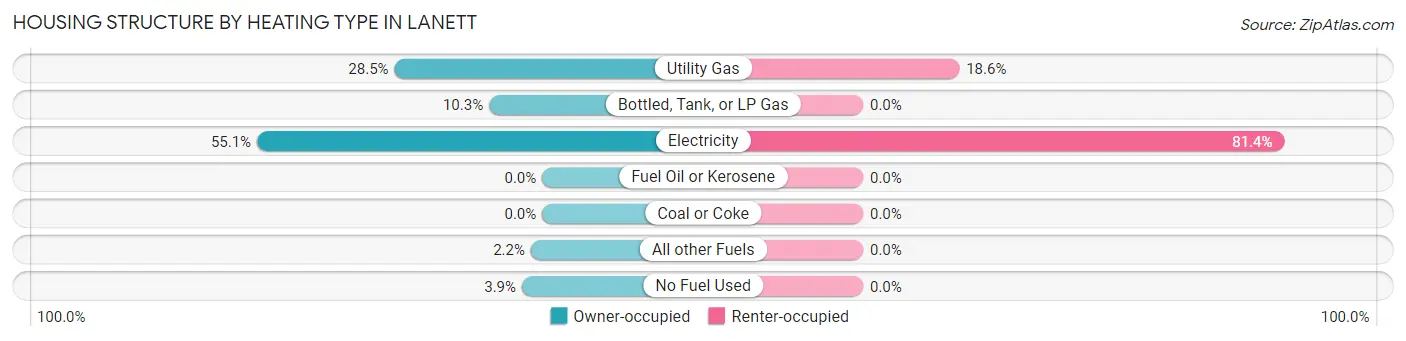
| Heating Type | Owner-occupied | Renter-occupied |
| Utility Gas | 431 (28.5%) | 171 (18.6%) |
| Bottled, Tank, or LP Gas | 155 (10.3%) | 0 (0.0%) |
| Electricity | 832 (55.1%) | 749 (81.4%) |
| Fuel Oil or Kerosene | 0 (0.0%) | 0 (0.0%) |
| Coal or Coke | 0 (0.0%) | 0 (0.0%) |
| All other Fuels | 33 (2.2%) | 0 (0.0%) |
| No Fuel Used | 59 (3.9%) | 0 (0.0%) |
| Total | 1,510 (100.0%) | 920 (100.0%) |
Household Vehicle Usage in Lanett
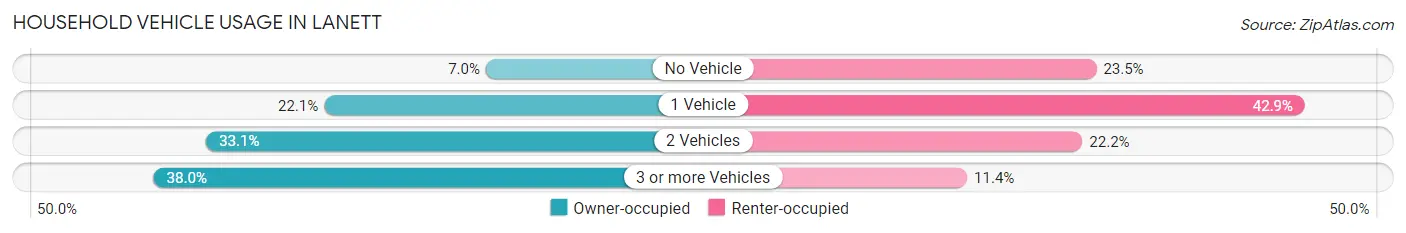
| Vehicles per Household | Owner-occupied | Renter-occupied |
| No Vehicle | 105 (7.0%) | 216 (23.5%) |
| 1 Vehicle | 333 (22.1%) | 395 (42.9%) |
| 2 Vehicles | 499 (33.1%) | 204 (22.2%) |
| 3 or more Vehicles | 573 (38.0%) | 105 (11.4%) |
| Total | 1,510 (100.0%) | 920 (100.0%) |
Real Estate & Mortgages in Lanett
Real Estate and Mortgage Overview in Lanett
| Characteristic | Without Mortgage | With Mortgage |
| Housing Units | 860 | 650 |
| Median Property Value | $93,800 | $116,300 |
| Median Household Income | $35,250 | $47 |
| Monthly Housing Costs | $404 | $0 |
| Real Estate Taxes | $321 | $14 |
Property Value by Mortgage Status in Lanett
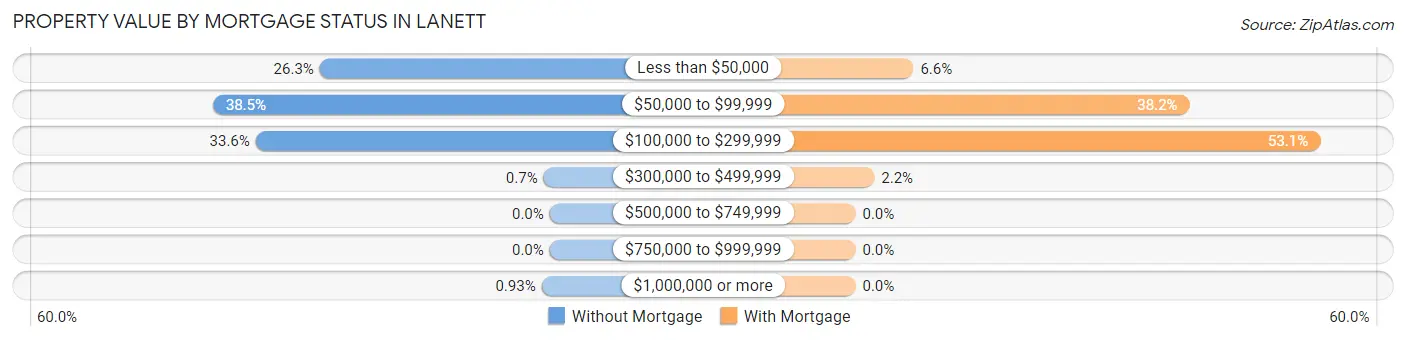
| Property Value | Without Mortgage | With Mortgage |
| Less than $50,000 | 226 (26.3%) | 43 (6.6%) |
| $50,000 to $99,999 | 331 (38.5%) | 248 (38.2%) |
| $100,000 to $299,999 | 289 (33.6%) | 345 (53.1%) |
| $300,000 to $499,999 | 6 (0.7%) | 14 (2.1%) |
| $500,000 to $749,999 | 0 (0.0%) | 0 (0.0%) |
| $750,000 to $999,999 | 0 (0.0%) | 0 (0.0%) |
| $1,000,000 or more | 8 (0.9%) | 0 (0.0%) |
| Total | 860 (100.0%) | 650 (100.0%) |
Household Income by Mortgage Status in Lanett
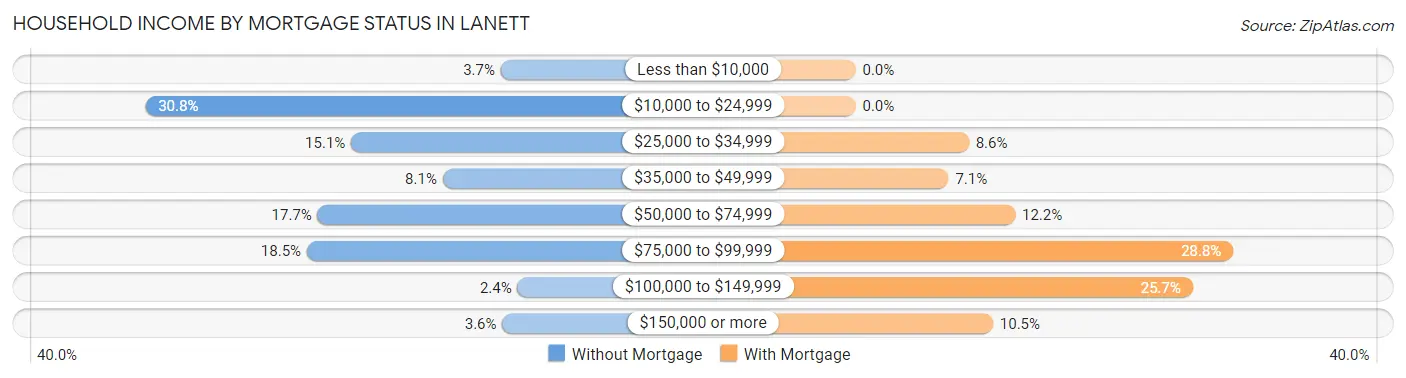
| Household Income | Without Mortgage | With Mortgage |
| Less than $10,000 | 32 (3.7%) | 0 (0.0%) |
| $10,000 to $24,999 | 265 (30.8%) | 0 (0.0%) |
| $25,000 to $34,999 | 130 (15.1%) | 56 (8.6%) |
| $35,000 to $49,999 | 70 (8.1%) | 46 (7.1%) |
| $50,000 to $74,999 | 152 (17.7%) | 79 (12.1%) |
| $75,000 to $99,999 | 159 (18.5%) | 187 (28.8%) |
| $100,000 to $149,999 | 21 (2.4%) | 167 (25.7%) |
| $150,000 or more | 31 (3.6%) | 68 (10.5%) |
| Total | 860 (100.0%) | 650 (100.0%) |
Property Value to Household Income Ratio in Lanett
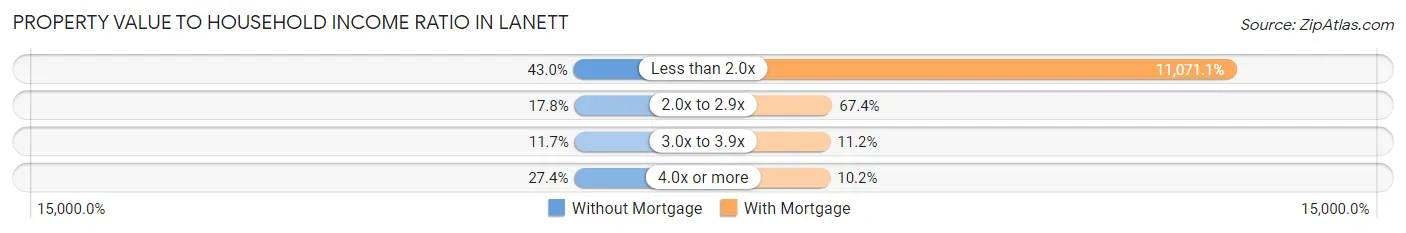
| Value-to-Income Ratio | Without Mortgage | With Mortgage |
| Less than 2.0x | 370 (43.0%) | 71,962 (11,071.1%) |
| 2.0x to 2.9x | 153 (17.8%) | 438 (67.4%) |
| 3.0x to 3.9x | 101 (11.7%) | 73 (11.2%) |
| 4.0x or more | 236 (27.4%) | 66 (10.2%) |
| Total | 860 (100.0%) | 650 (100.0%) |
Real Estate Taxes by Mortgage Status in Lanett
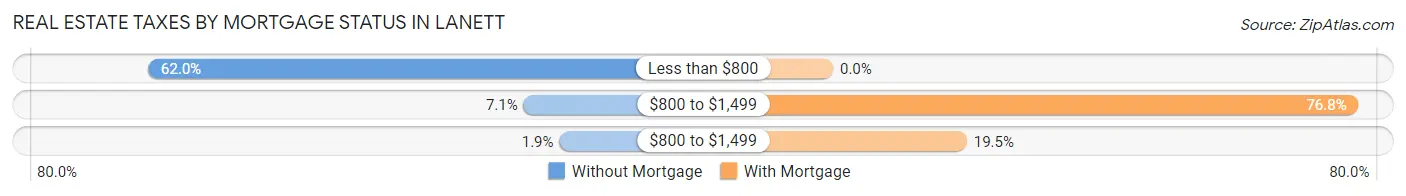
| Property Taxes | Without Mortgage | With Mortgage |
| Less than $800 | 533 (62.0%) | 0 (0.0%) |
| $800 to $1,499 | 61 (7.1%) | 499 (76.8%) |
| $800 to $1,499 | 16 (1.9%) | 127 (19.5%) |
| Total | 860 (100.0%) | 650 (100.0%) |
Health & Disability in Lanett
Health Insurance Coverage by Age in Lanett
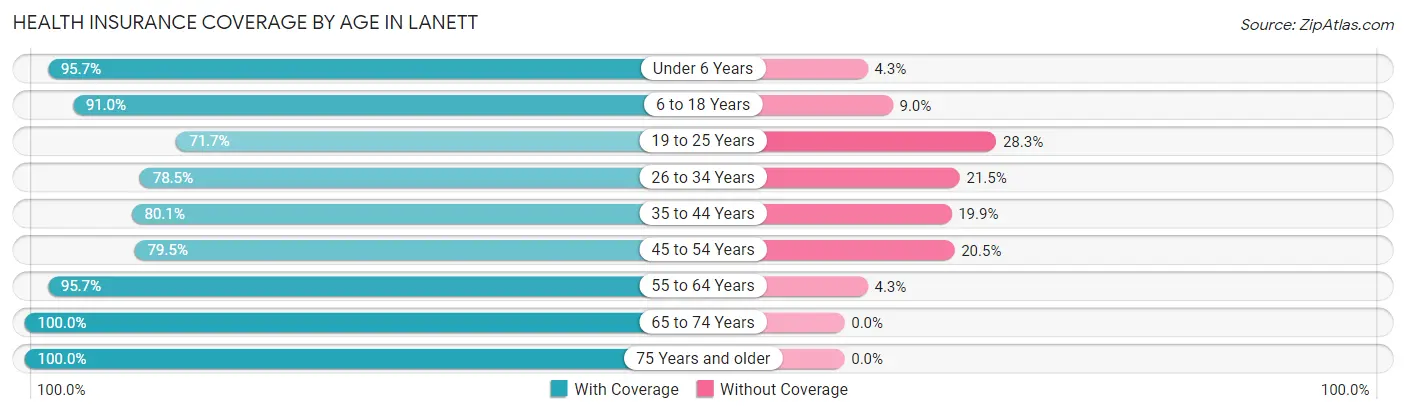
| Age Bracket | With Coverage | Without Coverage |
| Under 6 Years | 532 (95.7%) | 24 (4.3%) |
| 6 to 18 Years | 1,022 (91.0%) | 101 (9.0%) |
| 19 to 25 Years | 431 (71.7%) | 170 (28.3%) |
| 26 to 34 Years | 570 (78.5%) | 156 (21.5%) |
| 35 to 44 Years | 534 (80.1%) | 133 (19.9%) |
| 45 to 54 Years | 694 (79.5%) | 179 (20.5%) |
| 55 to 64 Years | 884 (95.7%) | 40 (4.3%) |
| 65 to 74 Years | 895 (100.0%) | 0 (0.0%) |
| 75 Years and older | 392 (100.0%) | 0 (0.0%) |
| Total | 5,954 (88.1%) | 803 (11.9%) |
Health Insurance Coverage by Citizenship Status in Lanett
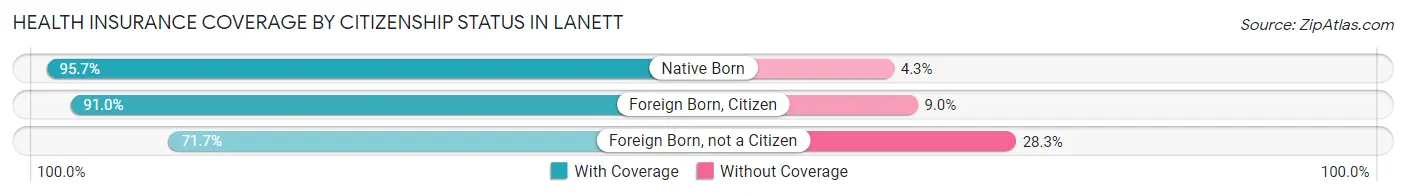
| Citizenship Status | With Coverage | Without Coverage |
| Native Born | 532 (95.7%) | 24 (4.3%) |
| Foreign Born, Citizen | 1,022 (91.0%) | 101 (9.0%) |
| Foreign Born, not a Citizen | 431 (71.7%) | 170 (28.3%) |
Health Insurance Coverage by Household Income in Lanett
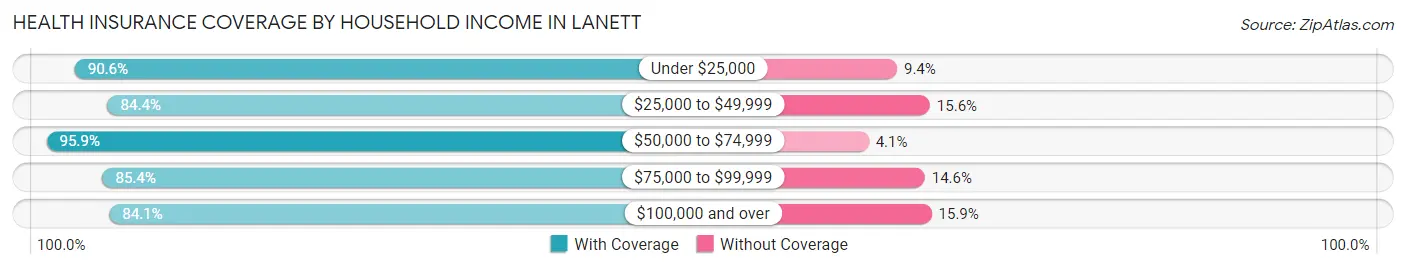
| Household Income | With Coverage | Without Coverage |
| Under $25,000 | 838 (90.6%) | 87 (9.4%) |
| $25,000 to $49,999 | 1,269 (84.4%) | 234 (15.6%) |
| $50,000 to $74,999 | 1,378 (95.9%) | 59 (4.1%) |
| $75,000 to $99,999 | 1,362 (85.4%) | 233 (14.6%) |
| $100,000 and over | 995 (84.1%) | 188 (15.9%) |
Public vs Private Health Insurance Coverage by Age in Lanett
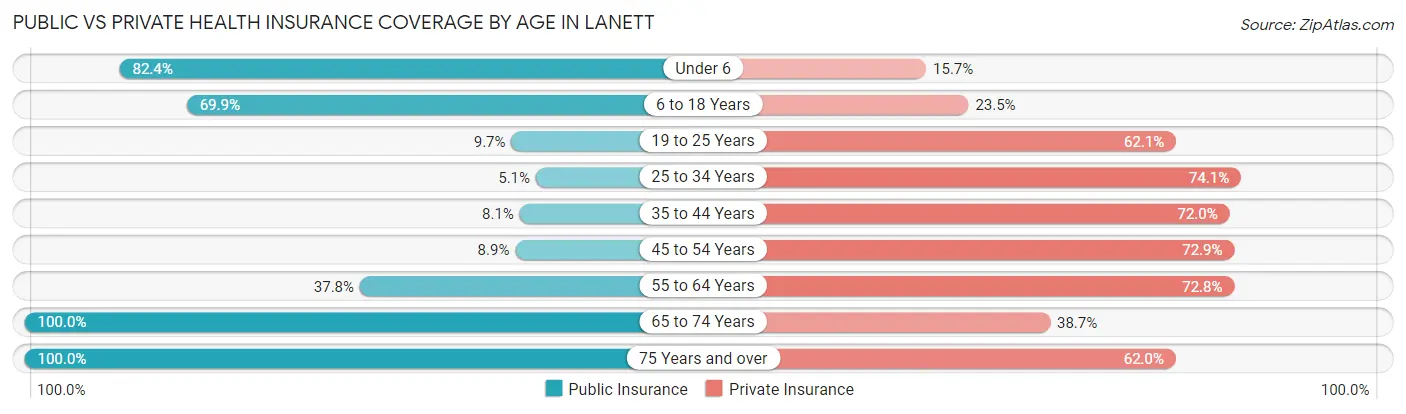
| Age Bracket | Public Insurance | Private Insurance |
| Under 6 | 458 (82.4%) | 87 (15.7%) |
| 6 to 18 Years | 785 (69.9%) | 264 (23.5%) |
| 19 to 25 Years | 58 (9.7%) | 373 (62.1%) |
| 25 to 34 Years | 37 (5.1%) | 538 (74.1%) |
| 35 to 44 Years | 54 (8.1%) | 480 (72.0%) |
| 45 to 54 Years | 78 (8.9%) | 636 (72.9%) |
| 55 to 64 Years | 349 (37.8%) | 673 (72.8%) |
| 65 to 74 Years | 895 (100.0%) | 346 (38.7%) |
| 75 Years and over | 392 (100.0%) | 243 (62.0%) |
| Total | 3,106 (46.0%) | 3,640 (53.9%) |
Disability Status by Sex by Age in Lanett
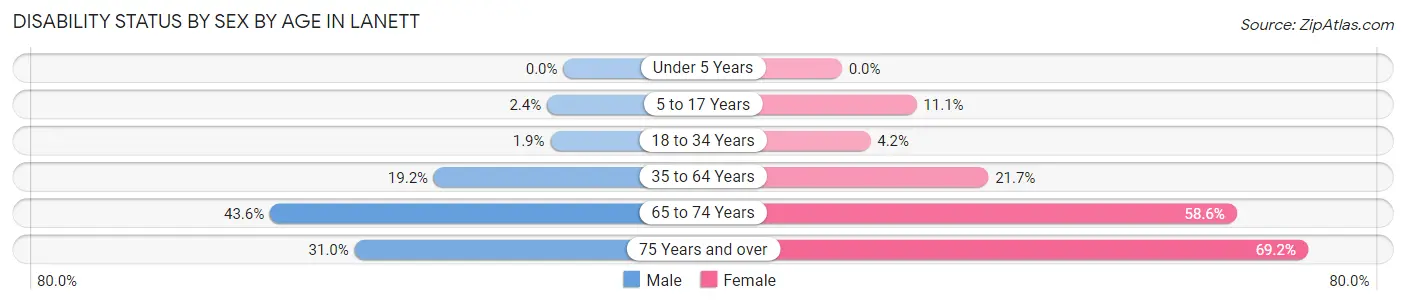
| Age Bracket | Male | Female |
| Under 5 Years | 0 (0.0%) | 0 (0.0%) |
| 5 to 17 Years | 9 (2.4%) | 84 (11.1%) |
| 18 to 34 Years | 11 (1.9%) | 34 (4.2%) |
| 35 to 64 Years | 242 (19.2%) | 262 (21.7%) |
| 65 to 74 Years | 135 (43.5%) | 343 (58.6%) |
| 75 Years and over | 31 (31.0%) | 202 (69.2%) |
Disability Class by Sex by Age in Lanett
Disability Class: Hearing Difficulty
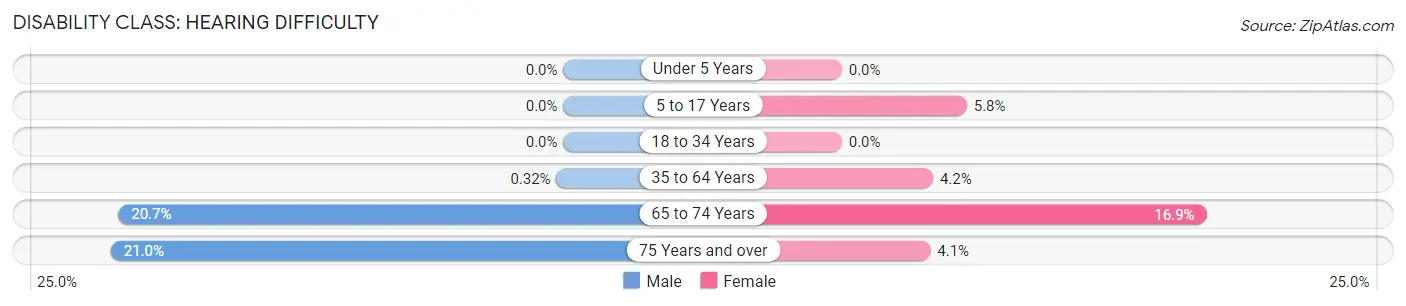
| Age Bracket | Male | Female |
| Under 5 Years | 0 (0.0%) | 0 (0.0%) |
| 5 to 17 Years | 0 (0.0%) | 44 (5.8%) |
| 18 to 34 Years | 0 (0.0%) | 0 (0.0%) |
| 35 to 64 Years | 4 (0.3%) | 51 (4.2%) |
| 65 to 74 Years | 64 (20.6%) | 99 (16.9%) |
| 75 Years and over | 21 (21.0%) | 12 (4.1%) |
Disability Class: Vision Difficulty
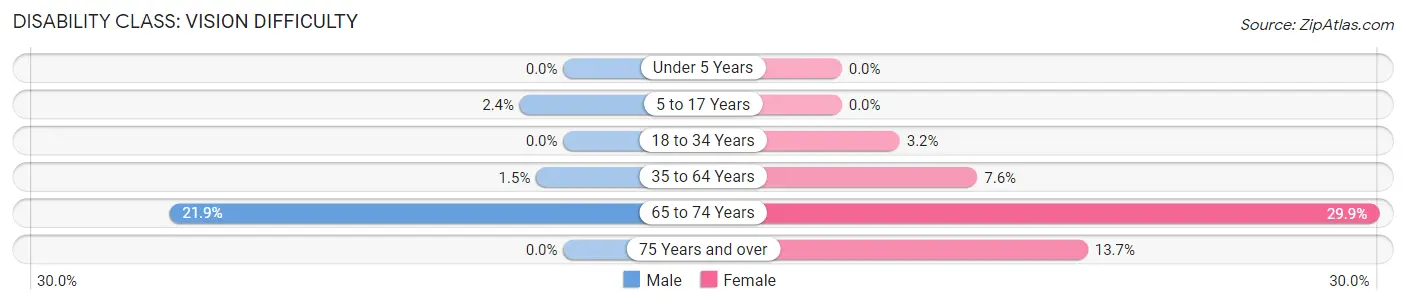
| Age Bracket | Male | Female |
| Under 5 Years | 0 (0.0%) | 0 (0.0%) |
| 5 to 17 Years | 9 (2.4%) | 0 (0.0%) |
| 18 to 34 Years | 0 (0.0%) | 26 (3.2%) |
| 35 to 64 Years | 19 (1.5%) | 91 (7.5%) |
| 65 to 74 Years | 68 (21.9%) | 175 (29.9%) |
| 75 Years and over | 0 (0.0%) | 40 (13.7%) |
Disability Class: Cognitive Difficulty
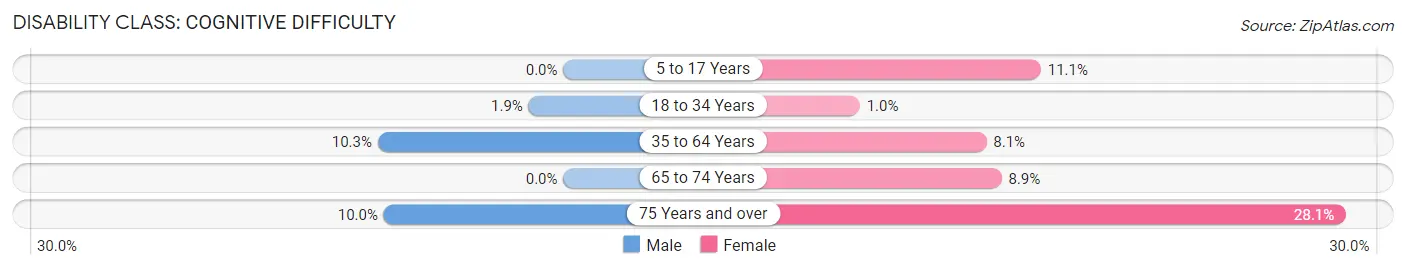
| Age Bracket | Male | Female |
| 5 to 17 Years | 0 (0.0%) | 84 (11.1%) |
| 18 to 34 Years | 11 (1.9%) | 8 (1.0%) |
| 35 to 64 Years | 130 (10.3%) | 97 (8.1%) |
| 65 to 74 Years | 0 (0.0%) | 52 (8.9%) |
| 75 Years and over | 10 (10.0%) | 82 (28.1%) |
Disability Class: Ambulatory Difficulty
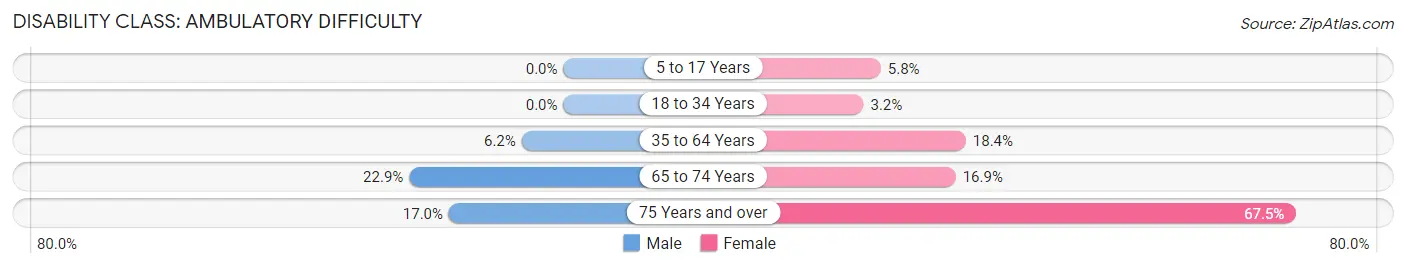
| Age Bracket | Male | Female |
| 5 to 17 Years | 0 (0.0%) | 44 (5.8%) |
| 18 to 34 Years | 0 (0.0%) | 26 (3.2%) |
| 35 to 64 Years | 78 (6.2%) | 222 (18.4%) |
| 65 to 74 Years | 71 (22.9%) | 99 (16.9%) |
| 75 Years and over | 17 (17.0%) | 197 (67.5%) |
Disability Class: Self-Care Difficulty
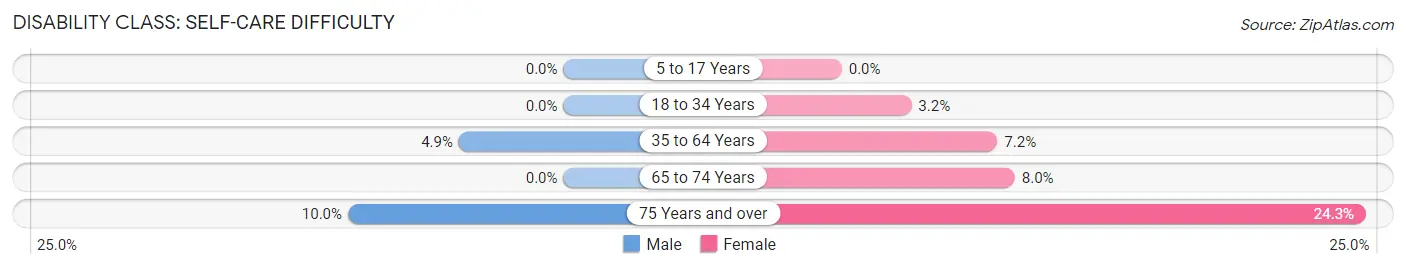
| Age Bracket | Male | Female |
| 5 to 17 Years | 0 (0.0%) | 0 (0.0%) |
| 18 to 34 Years | 0 (0.0%) | 26 (3.2%) |
| 35 to 64 Years | 61 (4.9%) | 87 (7.2%) |
| 65 to 74 Years | 0 (0.0%) | 47 (8.0%) |
| 75 Years and over | 10 (10.0%) | 71 (24.3%) |
Technology Access in Lanett
Computing Device Access in Lanett
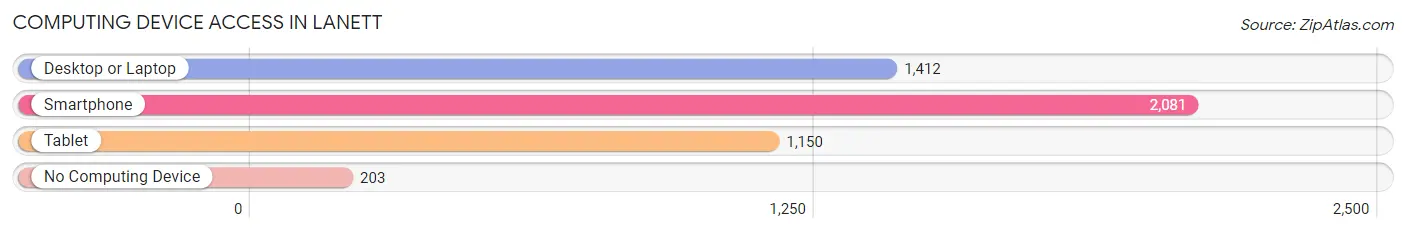
| Device Type | # Households | % Households |
| Desktop or Laptop | 1,412 | 58.1% |
| Smartphone | 2,081 | 85.6% |
| Tablet | 1,150 | 47.3% |
| No Computing Device | 203 | 8.4% |
| Total | 2,430 | 100.0% |
Internet Access in Lanett
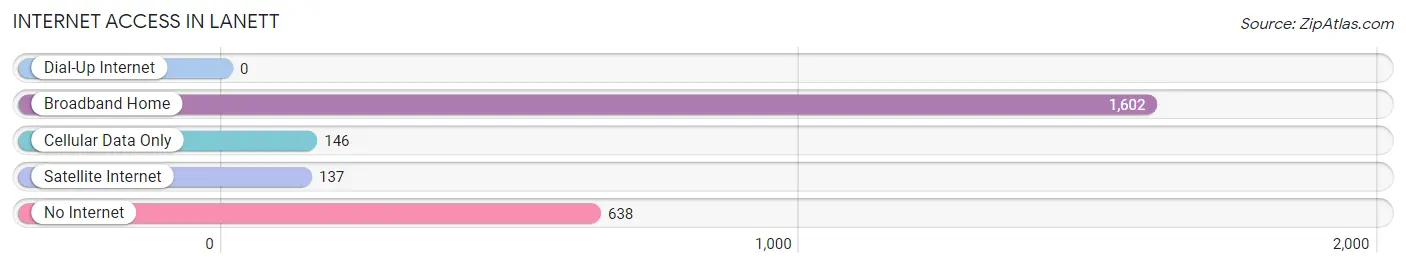
| Internet Type | # Households | % Households |
| Dial-Up Internet | 0 | 0.0% |
| Broadband Home | 1,602 | 65.9% |
| Cellular Data Only | 146 | 6.0% |
| Satellite Internet | 137 | 5.6% |
| No Internet | 638 | 26.3% |
| Total | 2,430 | 100.0% |
Lanett Summary
Lanett, Alabama is a small city located in Chambers County, Alabama. It is situated on the banks of the Chattahoochee River, which forms the border between Alabama and Georgia. The city has a population of 6,468 as of the 2010 census, making it the second-largest city in Chambers County.
History
Lanett was founded in 1882 by the West Point Manufacturing Company, which was established to produce cotton textiles. The company was owned by the Lanier family, who named the city after their daughter, Lanny Lanier. The city was incorporated in 1883 and quickly became a major center for the cotton industry. The city was also home to several other industries, including a paper mill, a brick factory, and a furniture factory.
In the early 20th century, Lanett was a major center for the Ku Klux Klan, and the city was the site of several lynchings. In the 1950s, the city was the site of a major civil rights struggle, as African Americans sought to gain access to public facilities and services. The city was also the site of a major labor dispute in the 1970s, when workers at the West Point Manufacturing Company went on strike.
Geography
Lanett is located in the southeastern corner of Chambers County, Alabama, at the intersection of U.S. Route 29 and Alabama State Route 50. The city is situated on the banks of the Chattahoochee River, which forms the border between Alabama and Georgia. The city has a total area of 8.2 square miles, all of which is land.
Economy
Lanett's economy is largely based on manufacturing. The city is home to several major industries, including the West Point Manufacturing Company, which produces cotton textiles, and the Lanett Paper Mill, which produces paper products. The city is also home to several smaller industries, including a furniture factory, a brick factory, and a printing company.
Demographics
As of the 2010 census, Lanett had a population of 6,468. The racial makeup of the city was 57.3% African American, 37.7% White, 0.3% Native American, 0.2% Asian, 0.1% Pacific Islander, and 4.4% from other races. The median household income was $25,945, and the median family income was $31,944. The per capita income was $14,945. About 24.3% of the population was below the poverty line.
Conclusion
Lanett, Alabama is a small city located in Chambers County, Alabama. It is situated on the banks of the Chattahoochee River, which forms the border between Alabama and Georgia. The city has a population of 6,468 as of the 2010 census, making it the second-largest city in Chambers County. The city's economy is largely based on manufacturing, and it is home to several major industries, including the West Point Manufacturing Company and the Lanett Paper Mill. The racial makeup of the city is 57.3% African American, 37.7% White, 0.3% Native American, 0.2% Asian, 0.1% Pacific Islander, and 4.4% from other races. The median household income was $25,945, and the median family income was $31,944. About 24.3% of the population was below the poverty line.
Common Questions
What is the Total Population of Lanett?
Total Population of Lanett is 6,880.
What is the Total Male Population of Lanett?
Total Male Population of Lanett is 2,832.
What is the Total Female Population of Lanett?
Total Female Population of Lanett is 4,048.
What is the Ratio of Males per 100 Females in Lanett?
There are 69.96 Males per 100 Females in Lanett.
What is the Ratio of Females per 100 Males in Lanett?
There are 142.94 Females per 100 Males in Lanett.
What is the Median Population Age in Lanett?
Median Population Age in Lanett is 39.9 Years.
What is the Average Family Size in Lanett
Average Family Size in Lanett is 3.6 People.
What is the Average Household Size in Lanett
Average Household Size in Lanett is 2.8 People.
What is Per Capita Income in Lanett?
Per Capita income in Lanett is $22,691.
What is the Median Family Income in Lanett?
Median Family Income in Lanett is $64,138.
What is the Median Household income in Lanett?
Median Household Income in Lanett is $48,125.
What is Income or Wage Gap in Lanett?
Income or Wage Gap in Lanett is 22.0%.
Women in Lanett earn 78.0 cents for every dollar earned by a man.
What is Family Income Deficit in Lanett?
Family Income Deficit in Lanett is $13,285.
Families that are below poverty line in Lanett earn $13,285 less on average than the poverty threshold level.
What is Inequality or Gini Index in Lanett?
Inequality or Gini Index in Lanett is 0.40.
How Large is the Labor Force in Lanett?
There are 3,052 People in the Labor Forcein in Lanett.
What is the Percentage of People in the Labor Force in Lanett?
57.0% of People are in the Labor Force in Lanett.
What is the Unemployment Rate in Lanett?
Unemployment Rate in Lanett is 5.6%.