Good Hope, AL
Good Hope Map
Good Hope Overview
2,502
TOTAL POPULATION
1,220
MALE POPULATION
1,282
FEMALE POPULATION
95.16
MALES / 100 FEMALES
105.08
FEMALES / 100 MALES
33.3
MEDIAN AGE
3.5
AVG FAMILY SIZE
3.1
AVG HOUSEHOLD SIZE
$33,098
PER CAPITA INCOME
$90,764
AVG FAMILY INCOME
$68,500
AVG HOUSEHOLD INCOME
35.7%
WAGE / INCOME GAP [ % ]
64.3¢/ $1
WAGE / INCOME GAP [ $ ]
0.45
INEQUALITY / GINI INDEX
1,174
LABOR FORCE [ PEOPLE ]
64.8%
PERCENT IN LABOR FORCE
3.1%
UNEMPLOYMENT RATE
Good Hope Area Codes
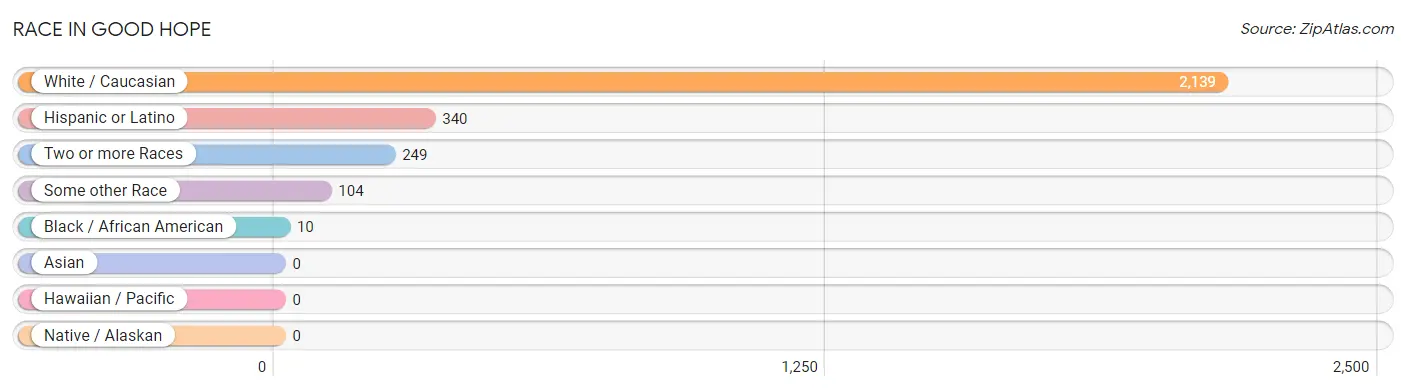
Race in Good Hope
The most populous races in Good Hope are White / Caucasian (2,139 | 85.5%), Hispanic or Latino (340 | 13.6%), and Two or more Races (249 | 10.0%).
| Race | # Population | % Population |
| Asian | 0 | 0.0% |
| Black / African American | 10 | 0.4% |
| Hawaiian / Pacific | 0 | 0.0% |
| Hispanic or Latino | 340 | 13.6% |
| Native / Alaskan | 0 | 0.0% |
| White / Caucasian | 2,139 | 85.5% |
| Two or more Races | 249 | 10.0% |
| Some other Race | 104 | 4.2% |
| Total | 2,502 | 100.0% |
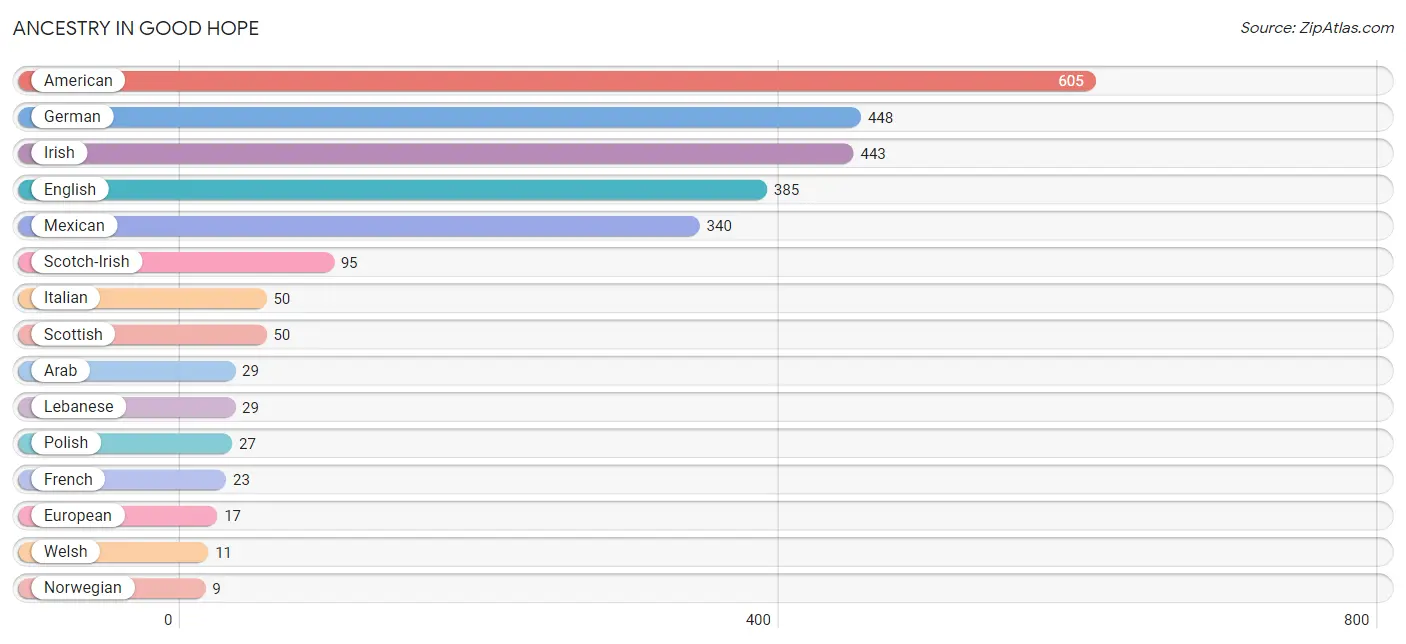
Ancestry in Good Hope
The most populous ancestries reported in Good Hope are American (605 | 24.2%), German (448 | 17.9%), Irish (443 | 17.7%), English (385 | 15.4%), and Mexican (340 | 13.6%), together accounting for 88.8% of all Good Hope residents.
| Ancestry | # Population | % Population |
| American | 605 | 24.2% |
| Arab | 29 | 1.2% |
| Chickasaw | 5 | 0.2% |
| Creek | 3 | 0.1% |
| Dutch | 4 | 0.2% |
| English | 385 | 15.4% |
| European | 17 | 0.7% |
| French | 23 | 0.9% |
| German | 448 | 17.9% |
| Irish | 443 | 17.7% |
| Italian | 50 | 2.0% |
| Lebanese | 29 | 1.2% |
| Mexican | 340 | 13.6% |
| Norwegian | 9 | 0.4% |
| Polish | 27 | 1.1% |
| Scotch-Irish | 95 | 3.8% |
| Scottish | 50 | 2.0% |
| Ukrainian | 4 | 0.2% |
| Welsh | 11 | 0.4% | View All 19 Rows |
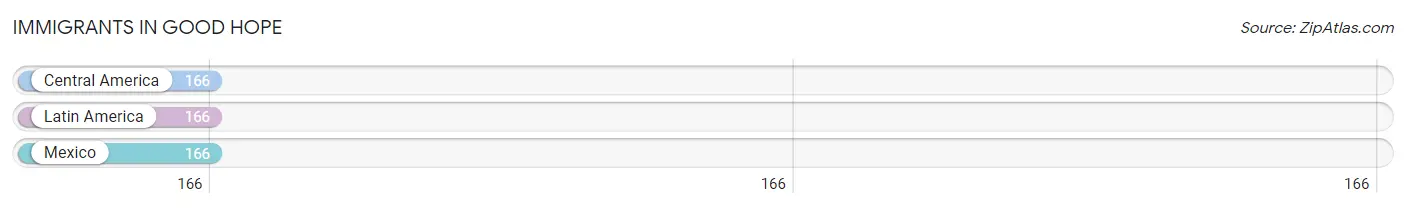
Immigrants in Good Hope
The most numerous immigrant groups reported in Good Hope came from Central America (166 | 6.6%), Latin America (166 | 6.6%), and Mexico (166 | 6.6%), together accounting for 19.9% of all Good Hope residents.
| Immigration Origin | # Population | % Population |
| Central America | 166 | 6.6% |
| Latin America | 166 | 6.6% |
| Mexico | 166 | 6.6% | View All 3 Rows |
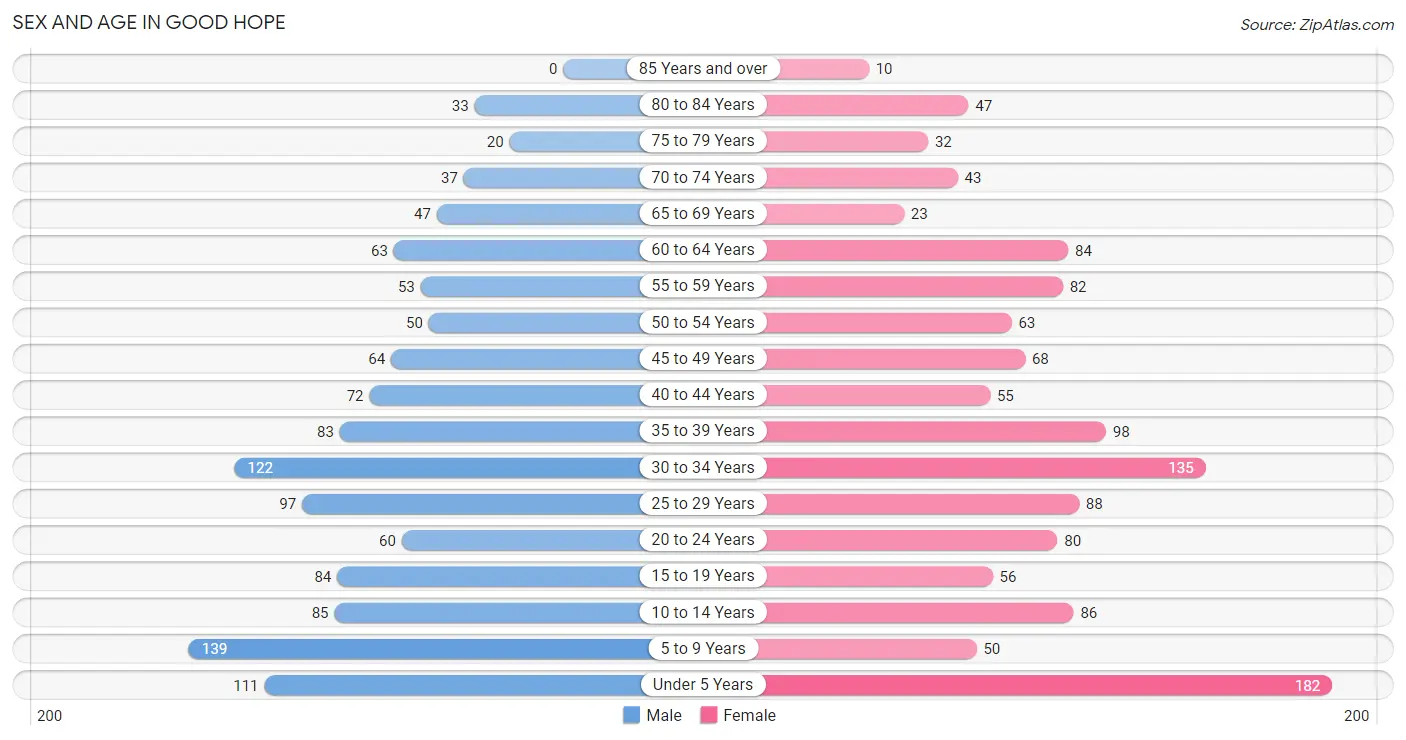
Sex and Age in Good Hope
Sex and Age in Good Hope
The most populous age groups in Good Hope are 5 to 9 Years (139 | 11.4%) for men and Under 5 Years (182 | 14.2%) for women.
| Age Bracket | Male | Female |
| Under 5 Years | 111 (9.1%) | 182 (14.2%) |
| 5 to 9 Years | 139 (11.4%) | 50 (3.9%) |
| 10 to 14 Years | 85 (7.0%) | 86 (6.7%) |
| 15 to 19 Years | 84 (6.9%) | 56 (4.4%) |
| 20 to 24 Years | 60 (4.9%) | 80 (6.2%) |
| 25 to 29 Years | 97 (8.0%) | 88 (6.9%) |
| 30 to 34 Years | 122 (10.0%) | 135 (10.5%) |
| 35 to 39 Years | 83 (6.8%) | 98 (7.6%) |
| 40 to 44 Years | 72 (5.9%) | 55 (4.3%) |
| 45 to 49 Years | 64 (5.2%) | 68 (5.3%) |
| 50 to 54 Years | 50 (4.1%) | 63 (4.9%) |
| 55 to 59 Years | 53 (4.3%) | 82 (6.4%) |
| 60 to 64 Years | 63 (5.2%) | 84 (6.6%) |
| 65 to 69 Years | 47 (3.8%) | 23 (1.8%) |
| 70 to 74 Years | 37 (3.0%) | 43 (3.4%) |
| 75 to 79 Years | 20 (1.6%) | 32 (2.5%) |
| 80 to 84 Years | 33 (2.7%) | 47 (3.7%) |
| 85 Years and over | 0 (0.0%) | 10 (0.8%) |
| Total | 1,220 (100.0%) | 1,282 (100.0%) |
Families and Households in Good Hope
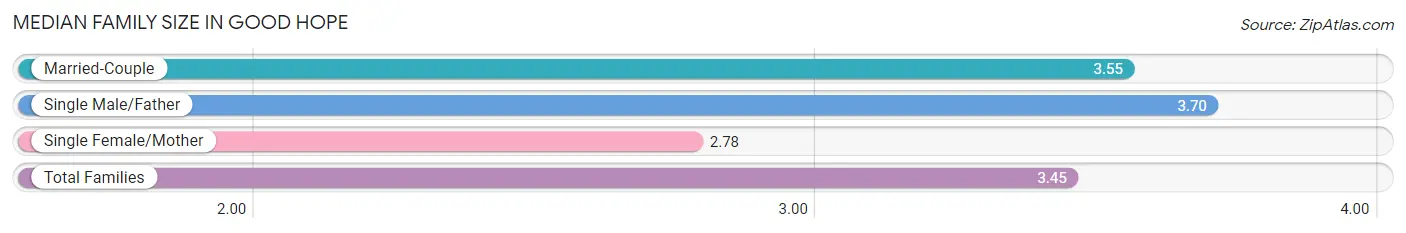
Median Family Size in Good Hope
The median family size in Good Hope is 3.45 persons per family, with single male/father families (40 | 6.1%) accounting for the largest median family size of 3.7 persons per family. On the other hand, single female/mother families (97 | 14.8%) represent the smallest median family size with 2.78 persons per family.
| Family Type | # Families | Family Size |
| Married-Couple | 518 (79.1%) | 3.55 |
| Single Male/Father | 40 (6.1%) | 3.70 |
| Single Female/Mother | 97 (14.8%) | 2.78 |
| Total Families | 655 (100.0%) | 3.45 |
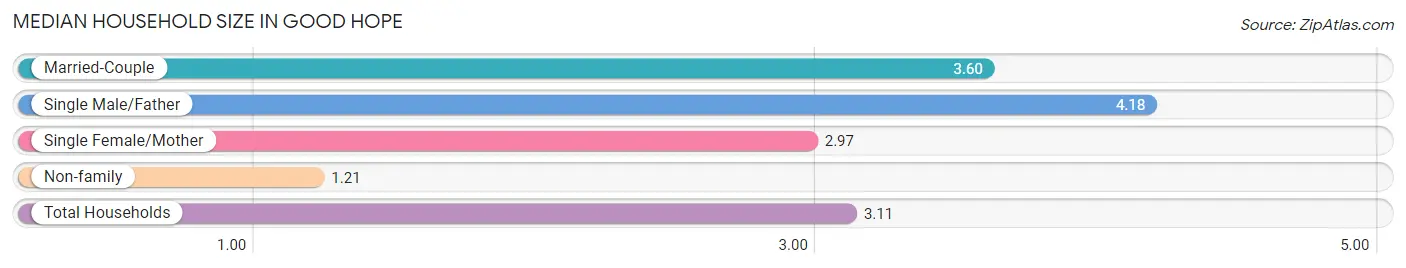
Median Household Size in Good Hope
The median household size in Good Hope is 3.11 persons per household, with single male/father households (40 | 5.0%) accounting for the largest median household size of 4.18 persons per household. non-family households (149 | 18.5%) represent the smallest median household size with 1.21 persons per household.
| Household Type | # Households | Household Size |
| Married-Couple | 518 (64.4%) | 3.60 |
| Single Male/Father | 40 (5.0%) | 4.18 |
| Single Female/Mother | 97 (12.1%) | 2.97 |
| Non-family | 149 (18.5%) | 1.21 |
| Total Households | 804 (100.0%) | 3.11 |
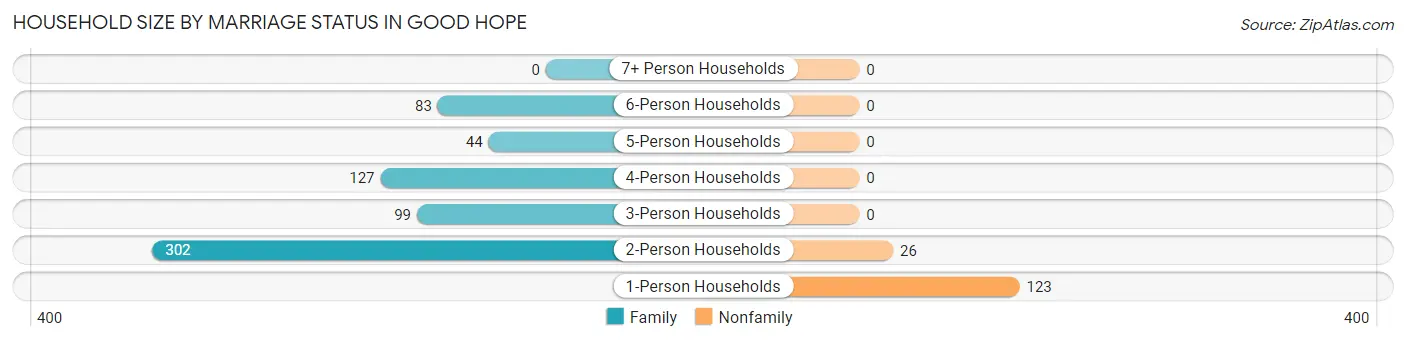
Household Size by Marriage Status in Good Hope
Out of a total of 804 households in Good Hope, 655 (81.5%) are family households, while 149 (18.5%) are nonfamily households. The most numerous type of family households are 2-person households, comprising 302, and the most common type of nonfamily households are 1-person households, comprising 123.
| Household Size | Family Households | Nonfamily Households |
| 1-Person Households | - | 123 (15.3%) |
| 2-Person Households | 302 (37.6%) | 26 (3.2%) |
| 3-Person Households | 99 (12.3%) | 0 (0.0%) |
| 4-Person Households | 127 (15.8%) | 0 (0.0%) |
| 5-Person Households | 44 (5.5%) | 0 (0.0%) |
| 6-Person Households | 83 (10.3%) | 0 (0.0%) |
| 7+ Person Households | 0 (0.0%) | 0 (0.0%) |
| Total | 655 (81.5%) | 149 (18.5%) |
Female Fertility in Good Hope
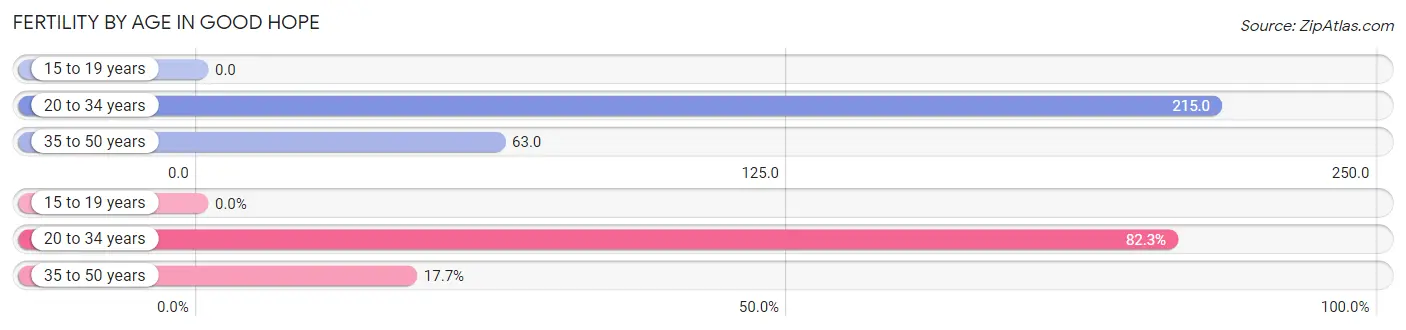
Fertility by Age in Good Hope
Average fertility rate in Good Hope is 136.0 births per 1,000 women. Women in the age bracket of 20 to 34 years have the highest fertility rate with 215.0 births per 1,000 women. Women in the age bracket of 20 to 34 years acount for 82.3% of all women with births.
| Age Bracket | Women with Births | Births / 1,000 Women |
| 15 to 19 years | 0 (0.0%) | 0.0 |
| 20 to 34 years | 65 (82.3%) | 215.0 |
| 35 to 50 years | 14 (17.7%) | 63.0 |
| Total | 79 (100.0%) | 136.0 |
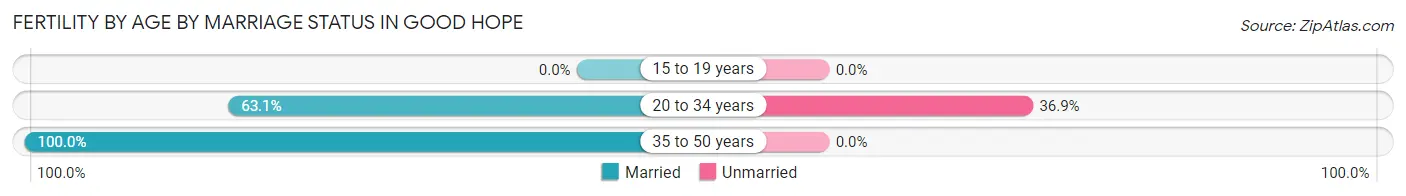
Fertility by Age by Marriage Status in Good Hope
69.6% of women with births (79) in Good Hope are married. The highest percentage of unmarried women with births falls into 20 to 34 years age bracket with 36.9% of them unmarried at the time of birth, while the lowest percentage of unmarried women with births belong to 35 to 50 years age bracket with 0.0% of them unmarried.
| Age Bracket | Married | Unmarried |
| 15 to 19 years | 0 (0.0%) | 0 (0.0%) |
| 20 to 34 years | 41 (63.1%) | 24 (36.9%) |
| 35 to 50 years | 14 (100.0%) | 0 (0.0%) |
| Total | 55 (69.6%) | 24 (30.4%) |
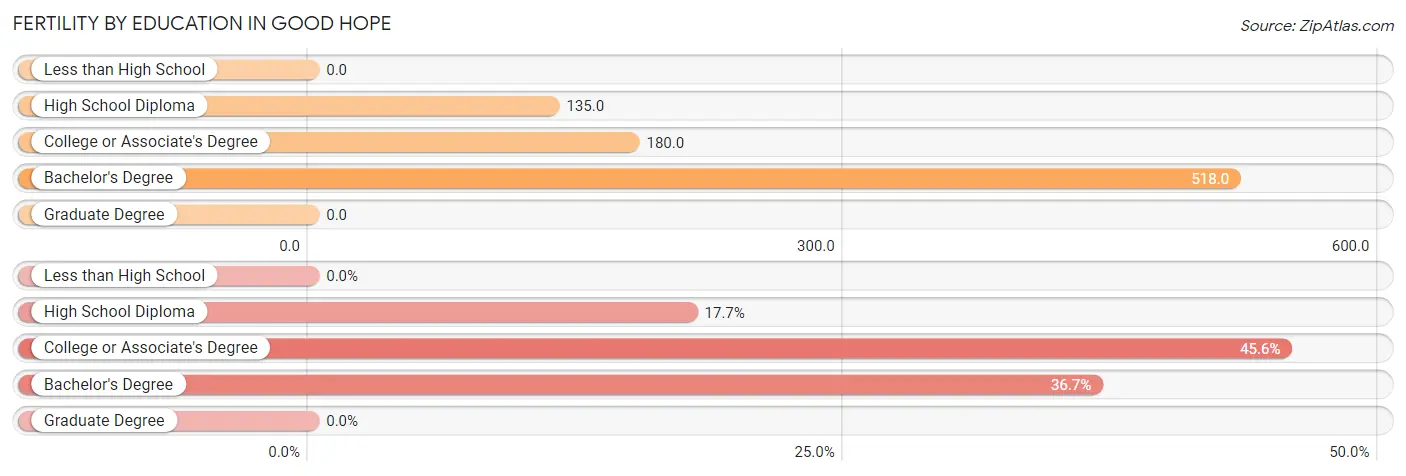
Fertility by Education in Good Hope
| Educational Attainment | Women with Births | Births / 1,000 Women |
| Less than High School | 0 (0.0%) | 0.0 |
| High School Diploma | 14 (17.7%) | 135.0 |
| College or Associate's Degree | 36 (45.6%) | 180.0 |
| Bachelor's Degree | 29 (36.7%) | 518.0 |
| Graduate Degree | 0 (0.0%) | 0.0 |
| Total | 79 (100.0%) | 136.0 |
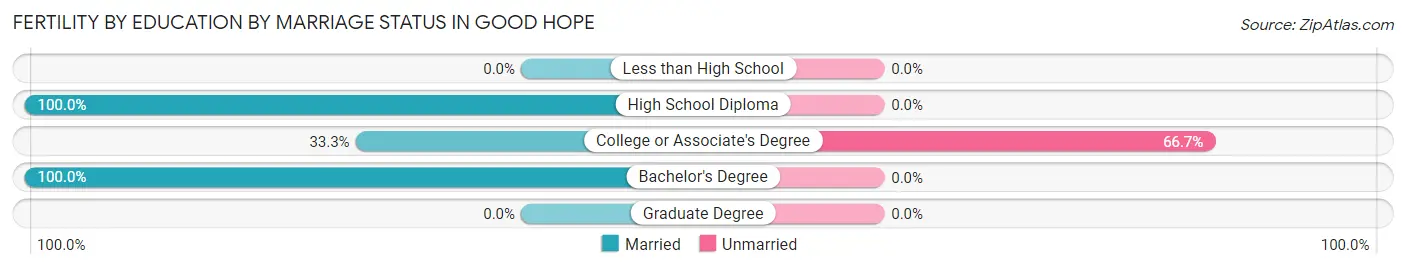
Fertility by Education by Marriage Status in Good Hope
30.4% of women with births in Good Hope are unmarried. Women with the educational attainment of high school diploma are most likely to be married with 100.0% of them married at childbirth, while women with the educational attainment of college or associate's degree are least likely to be married with 66.7% of them unmarried at childbirth.
| Educational Attainment | Married | Unmarried |
| Less than High School | 0 (0.0%) | 0 (0.0%) |
| High School Diploma | 14 (100.0%) | 0 (0.0%) |
| College or Associate's Degree | 12 (33.3%) | 24 (66.7%) |
| Bachelor's Degree | 29 (100.0%) | 0 (0.0%) |
| Graduate Degree | 0 (0.0%) | 0 (0.0%) |
| Total | 55 (69.6%) | 24 (30.4%) |
Income in Good Hope
Income Overview in Good Hope
Per Capita Income in Good Hope is $33,098, while median incomes of families and households are $90,764 and $68,500 respectively.
| Characteristic | Number | Measure |
| Per Capita Income | 2,502 | $33,098 |
| Median Family Income | 655 | $90,764 |
| Mean Family Income | 655 | $104,832 |
| Median Household Income | 804 | $68,500 |
| Mean Household Income | 804 | $93,589 |
| Income Deficit | 655 | $0 |
| Wage / Income Gap (%) | 2,502 | 35.66% |
| Wage / Income Gap ($) | 2,502 | 64.34¢ per $1 |
| Gini / Inequality Index | 2,502 | 0.45 |
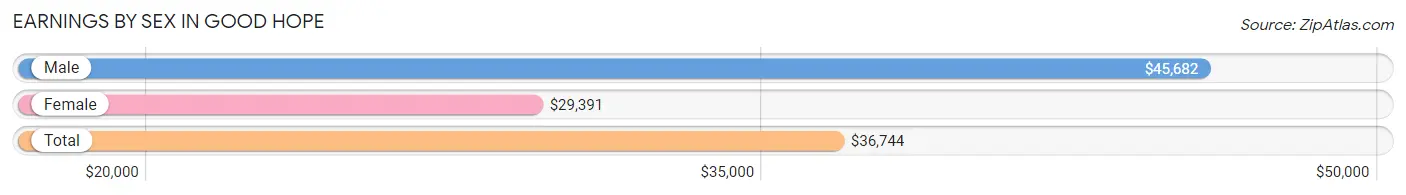
Earnings by Sex in Good Hope
Average Earnings in Good Hope are $36,744, $45,682 for men and $29,391 for women, a difference of 35.7%.
| Sex | Number | Average Earnings |
| Male | 608 (50.5%) | $45,682 |
| Female | 597 (49.5%) | $29,391 |
| Total | 1,205 (100.0%) | $36,744 |
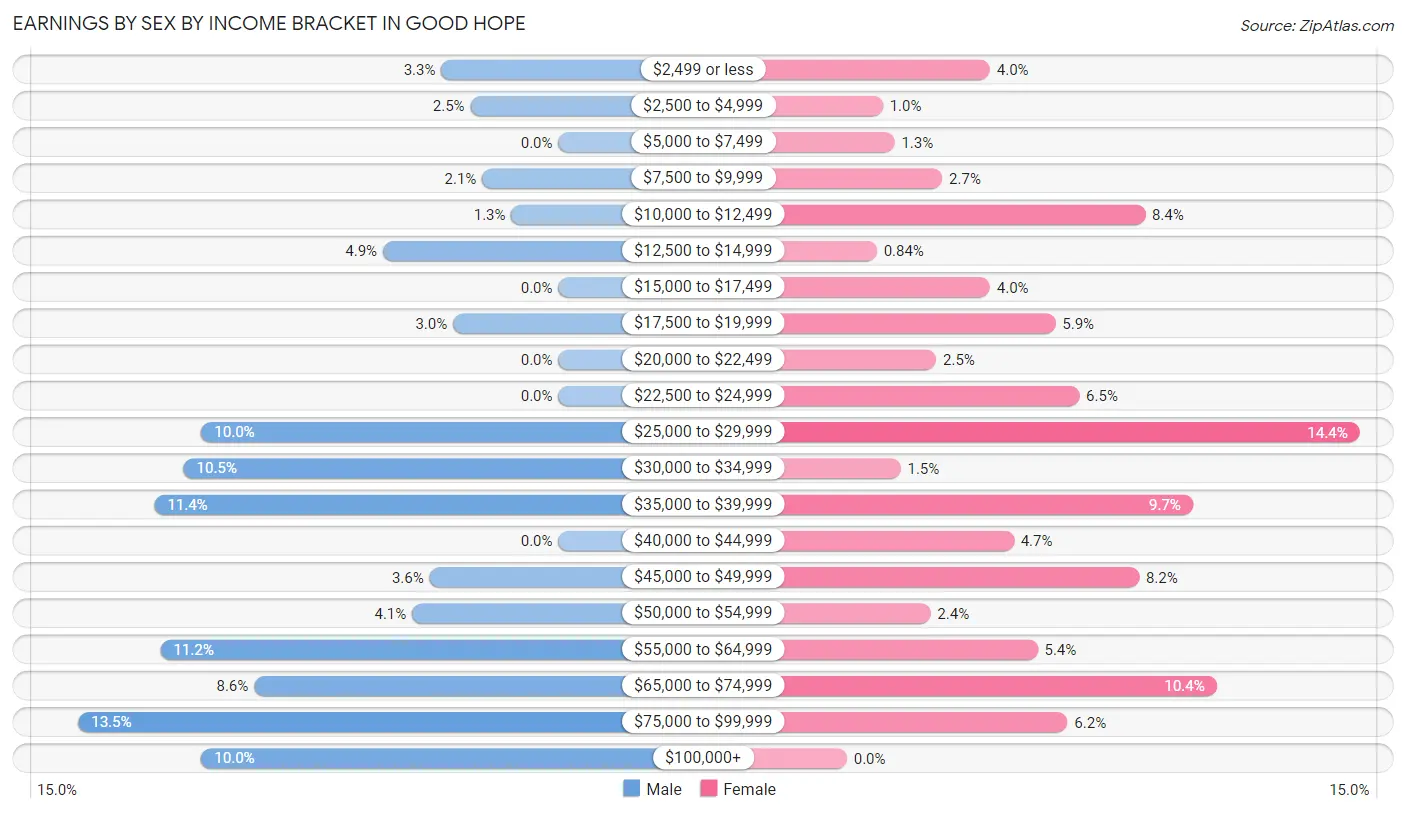
Earnings by Sex by Income Bracket in Good Hope
The most common earnings brackets in Good Hope are $75,000 to $99,999 for men (82 | 13.5%) and $25,000 to $29,999 for women (86 | 14.4%).
| Income | Male | Female |
| $2,499 or less | 20 (3.3%) | 24 (4.0%) |
| $2,500 to $4,999 | 15 (2.5%) | 6 (1.0%) |
| $5,000 to $7,499 | 0 (0.0%) | 8 (1.3%) |
| $7,500 to $9,999 | 13 (2.1%) | 16 (2.7%) |
| $10,000 to $12,499 | 8 (1.3%) | 50 (8.4%) |
| $12,500 to $14,999 | 30 (4.9%) | 5 (0.8%) |
| $15,000 to $17,499 | 0 (0.0%) | 24 (4.0%) |
| $17,500 to $19,999 | 18 (3.0%) | 35 (5.9%) |
| $20,000 to $22,499 | 0 (0.0%) | 15 (2.5%) |
| $22,500 to $24,999 | 0 (0.0%) | 39 (6.5%) |
| $25,000 to $29,999 | 61 (10.0%) | 86 (14.4%) |
| $30,000 to $34,999 | 64 (10.5%) | 9 (1.5%) |
| $35,000 to $39,999 | 69 (11.4%) | 58 (9.7%) |
| $40,000 to $44,999 | 0 (0.0%) | 28 (4.7%) |
| $45,000 to $49,999 | 22 (3.6%) | 49 (8.2%) |
| $50,000 to $54,999 | 25 (4.1%) | 14 (2.4%) |
| $55,000 to $64,999 | 68 (11.2%) | 32 (5.4%) |
| $65,000 to $74,999 | 52 (8.6%) | 62 (10.4%) |
| $75,000 to $99,999 | 82 (13.5%) | 37 (6.2%) |
| $100,000+ | 61 (10.0%) | 0 (0.0%) |
| Total | 608 (100.0%) | 597 (100.0%) |
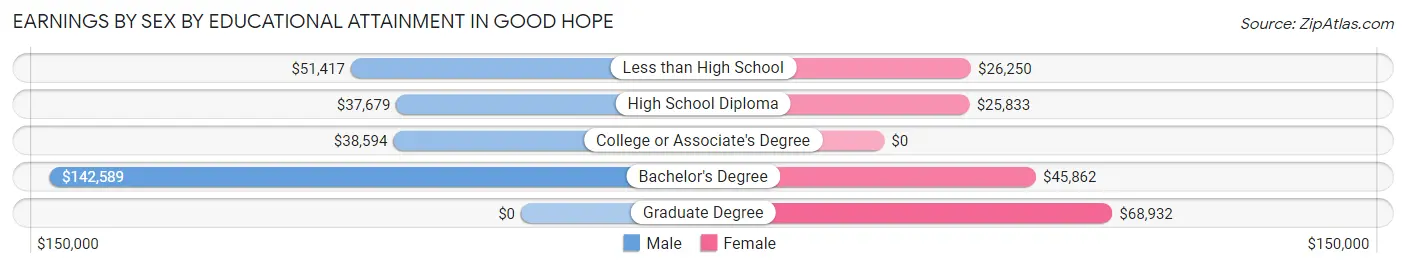
Earnings by Sex by Educational Attainment in Good Hope
Average earnings in Good Hope are $50,500 for men and $36,352 for women, a difference of 28.0%. Men with an educational attainment of bachelor's degree enjoy the highest average annual earnings of $142,589, while those with high school diploma education earn the least with $37,679. Women with an educational attainment of graduate degree earn the most with the average annual earnings of $68,932, while those with high school diploma education have the smallest earnings of $25,833.
| Educational Attainment | Male Income | Female Income |
| Less than High School | $51,417 | $26,250 |
| High School Diploma | $37,679 | $25,833 |
| College or Associate's Degree | $38,594 | $0 |
| Bachelor's Degree | $142,589 | $45,862 |
| Graduate Degree | - | - |
| Total | $50,500 | $36,352 |
Family Income in Good Hope
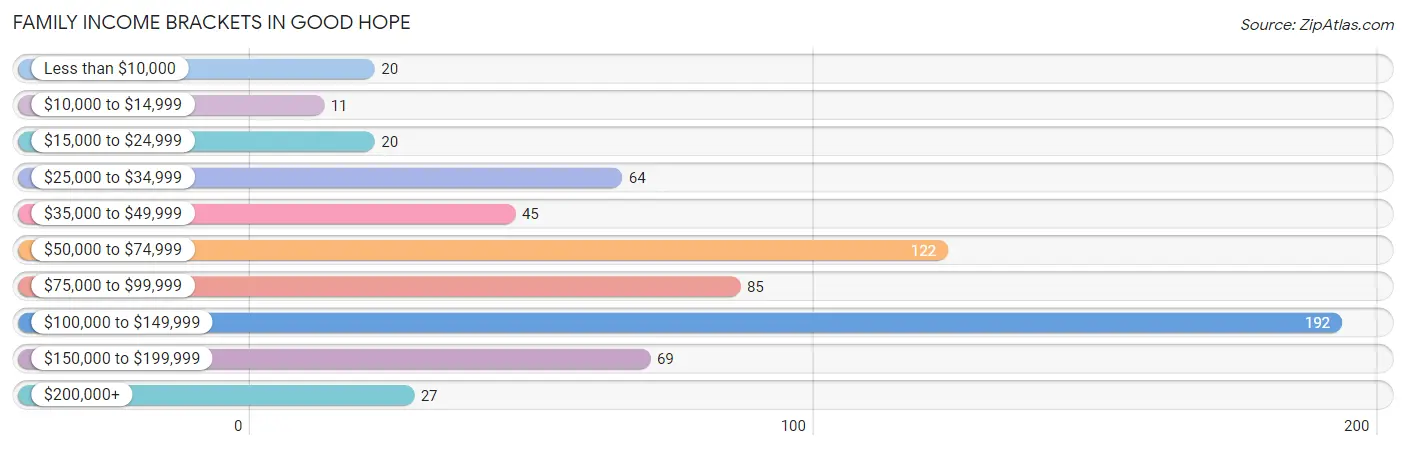
Family Income Brackets in Good Hope
According to the Good Hope family income data, there are 192 families falling into the $100,000 to $149,999 income range, which is the most common income bracket and makes up 29.3% of all families. Conversely, the $10,000 to $14,999 income bracket is the least frequent group with only 11 families (1.7%) belonging to this category.
| Income Bracket | # Families | % Families |
| Less than $10,000 | 20 | 3.1% |
| $10,000 to $14,999 | 11 | 1.7% |
| $15,000 to $24,999 | 20 | 3.1% |
| $25,000 to $34,999 | 64 | 9.8% |
| $35,000 to $49,999 | 45 | 6.9% |
| $50,000 to $74,999 | 122 | 18.6% |
| $75,000 to $99,999 | 85 | 13.0% |
| $100,000 to $149,999 | 192 | 29.3% |
| $150,000 to $199,999 | 69 | 10.5% |
| $200,000+ | 27 | 4.1% |
Family Income by Famaliy Size in Good Hope
5-person families (71 | 10.8%) account for the highest median family income in Good Hope with $107,750 per family, while 2-person families (323 | 49.3%) have the highest median income of $47,153 per family member.
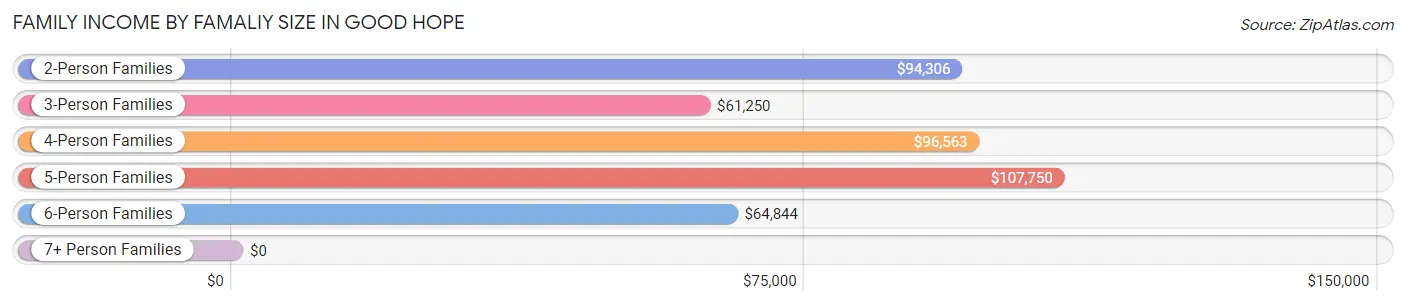
| Income Bracket | # Families | Median Income |
| 2-Person Families | 323 (49.3%) | $94,306 |
| 3-Person Families | 88 (13.4%) | $61,250 |
| 4-Person Families | 117 (17.9%) | $96,563 |
| 5-Person Families | 71 (10.8%) | $107,750 |
| 6-Person Families | 56 (8.6%) | $64,844 |
| 7+ Person Families | 0 (0.0%) | $0 |
| Total | 655 (100.0%) | $90,764 |
Family Income by Number of Earners in Good Hope
The median family income in Good Hope is $90,764, with families comprising 3+ earners (61) having the highest median family income of $195,893, while families with no earners (105) have the lowest median family income of $54,375, accounting for 9.3% and 16.0% of families, respectively.
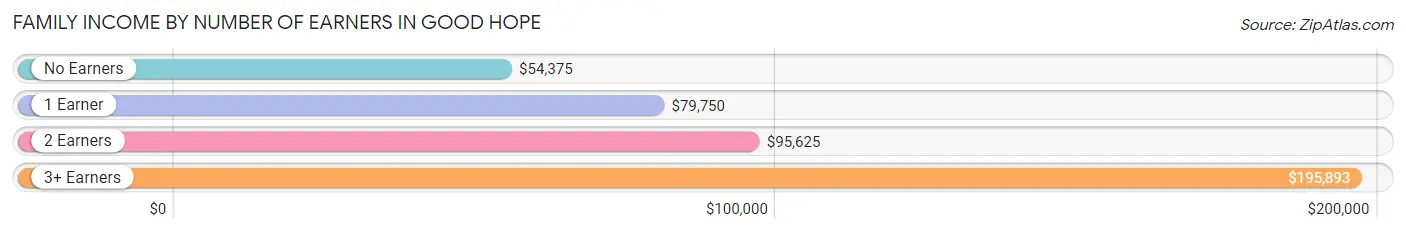
| Number of Earners | # Families | Median Income |
| No Earners | 105 (16.0%) | $54,375 |
| 1 Earner | 189 (28.8%) | $79,750 |
| 2 Earners | 300 (45.8%) | $95,625 |
| 3+ Earners | 61 (9.3%) | $195,893 |
| Total | 655 (100.0%) | $90,764 |
Household Income in Good Hope
Household Income Brackets in Good Hope
With 192 households falling in the category, the $100,000 to $149,999 income range is the most frequent in Good Hope, accounting for 23.9% of all households. In contrast, only 26 households (3.2%) fall into the $10,000 to $14,999 income bracket, making it the least populous group.
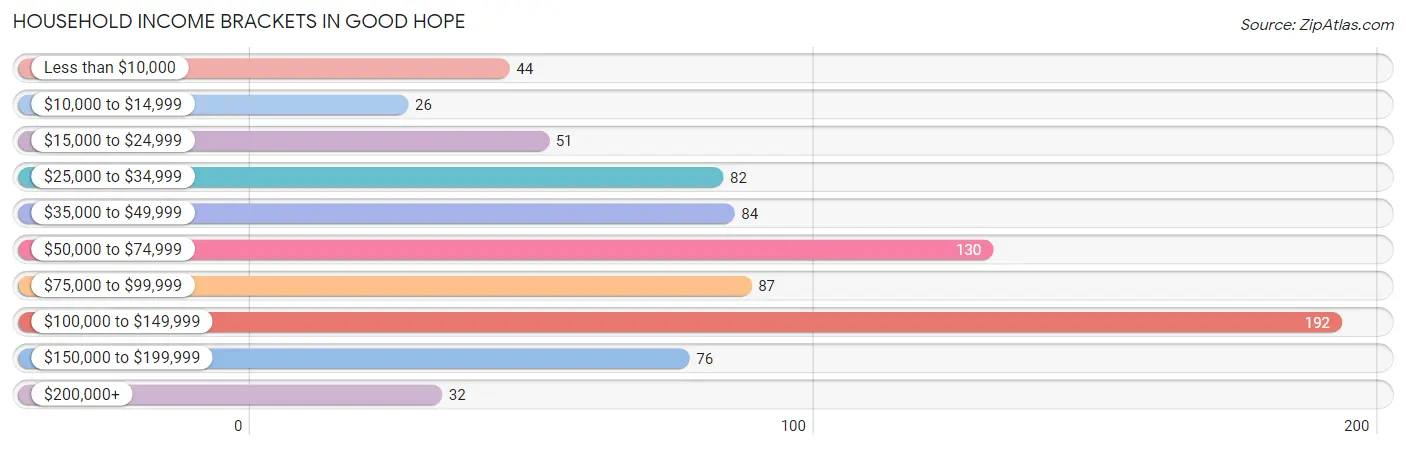
| Income Bracket | # Households | % Households |
| Less than $10,000 | 44 | 5.5% |
| $10,000 to $14,999 | 26 | 3.2% |
| $15,000 to $24,999 | 51 | 6.3% |
| $25,000 to $34,999 | 82 | 10.2% |
| $35,000 to $49,999 | 84 | 10.4% |
| $50,000 to $74,999 | 130 | 16.2% |
| $75,000 to $99,999 | 87 | 10.8% |
| $100,000 to $149,999 | 192 | 23.9% |
| $150,000 to $199,999 | 76 | 9.5% |
| $200,000+ | 32 | 4.0% |
Household Income by Householder Age in Good Hope
The median household income in Good Hope is $68,500, with the highest median household income of $82,885 found in the 45 to 64 years age bracket for the primary householder. A total of 264 households (32.8%) fall into this category. Meanwhile, the 15 to 24 years age bracket for the primary householder has the lowest median household income of $29,063, with 13 households (1.6%) in this group.
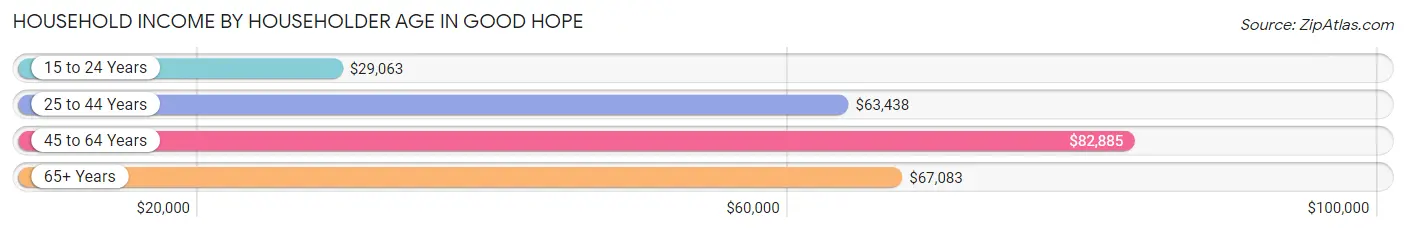
| Income Bracket | # Households | Median Income |
| 15 to 24 Years | 13 (1.6%) | $29,063 |
| 25 to 44 Years | 342 (42.5%) | $63,438 |
| 45 to 64 Years | 264 (32.8%) | $82,885 |
| 65+ Years | 185 (23.0%) | $67,083 |
| Total | 804 (100.0%) | $68,500 |
Poverty in Good Hope
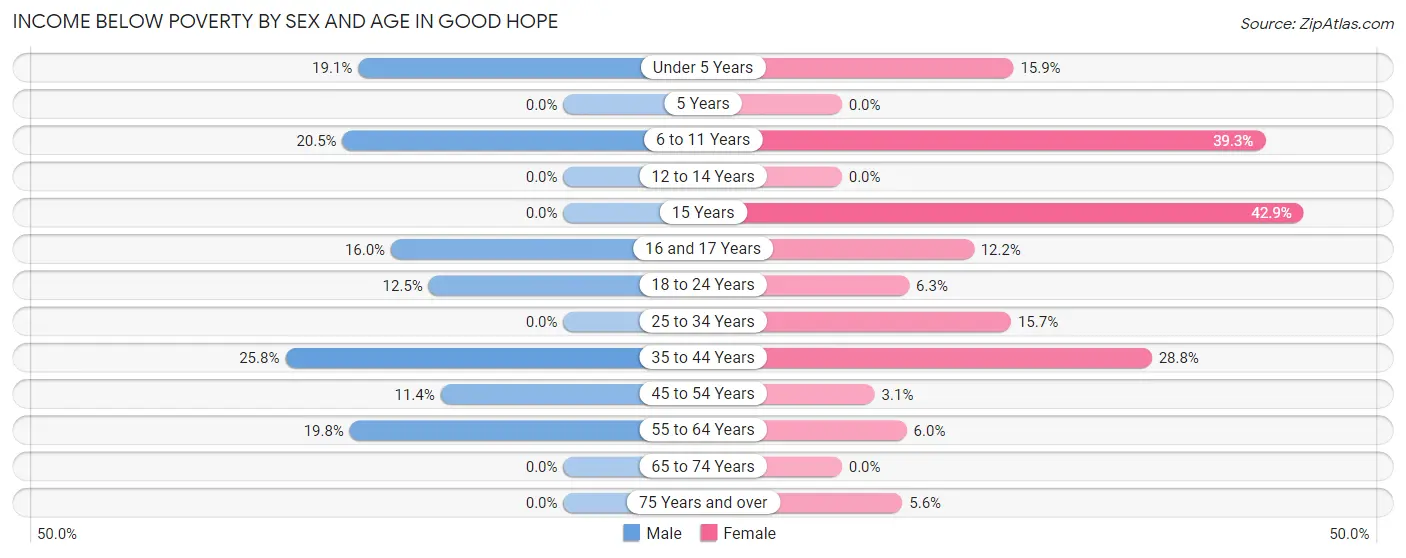
Income Below Poverty by Sex and Age in Good Hope
With 12.6% poverty level for males and 12.0% for females among the residents of Good Hope, 35 to 44 year old males and 15 year old females are the most vulnerable to poverty, with 40 males (25.8%) and 3 females (42.9%) in their respective age groups living below the poverty level.
| Age Bracket | Male | Female |
| Under 5 Years | 20 (19.1%) | 29 (15.9%) |
| 5 Years | 0 (0.0%) | 0 (0.0%) |
| 6 to 11 Years | 41 (20.5%) | 11 (39.3%) |
| 12 to 14 Years | 0 (0.0%) | 0 (0.0%) |
| 15 Years | 0 (0.0%) | 3 (42.9%) |
| 16 and 17 Years | 8 (16.0%) | 6 (12.2%) |
| 18 to 24 Years | 8 (12.5%) | 5 (6.2%) |
| 25 to 34 Years | 0 (0.0%) | 35 (15.7%) |
| 35 to 44 Years | 40 (25.8%) | 44 (28.8%) |
| 45 to 54 Years | 13 (11.4%) | 4 (3.0%) |
| 55 to 64 Years | 23 (19.8%) | 10 (6.0%) |
| 65 to 74 Years | 0 (0.0%) | 0 (0.0%) |
| 75 Years and over | 0 (0.0%) | 5 (5.6%) |
| Total | 153 (12.6%) | 152 (12.0%) |
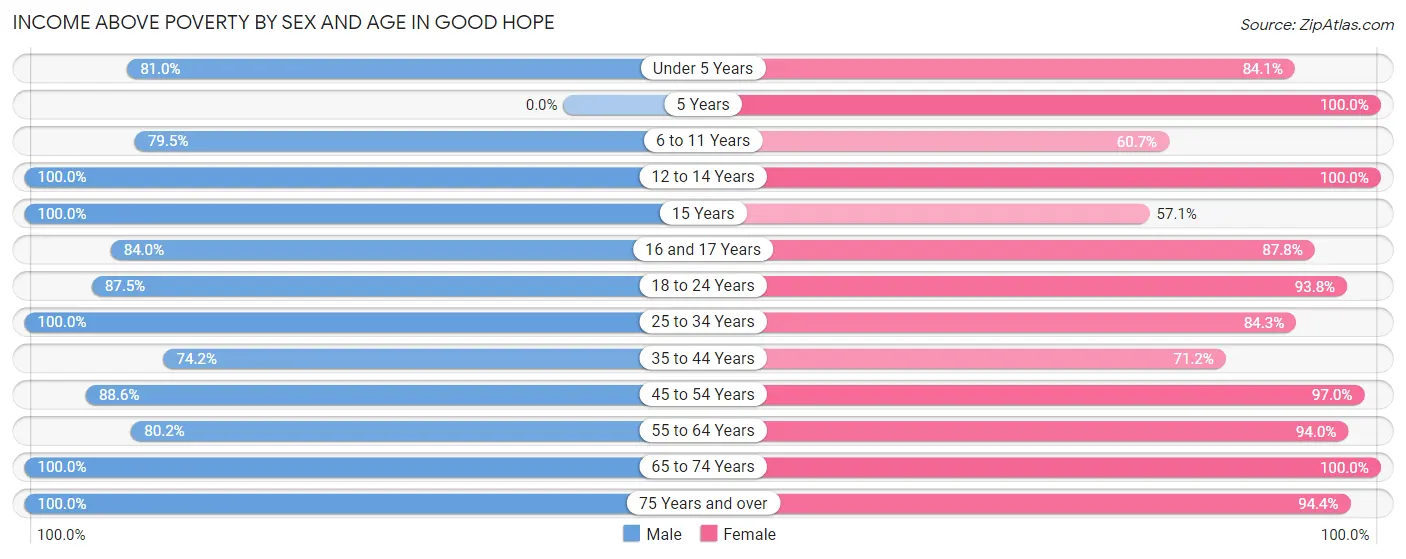
Income Above Poverty by Sex and Age in Good Hope
According to the poverty statistics in Good Hope, males aged 12 to 14 years and females aged 5 years are the age groups that are most secure financially, with 100.0% of males and 100.0% of females in these age groups living above the poverty line.
| Age Bracket | Male | Female |
| Under 5 Years | 85 (80.9%) | 153 (84.1%) |
| 5 Years | 0 (0.0%) | 9 (100.0%) |
| 6 to 11 Years | 159 (79.5%) | 17 (60.7%) |
| 12 to 14 Years | 24 (100.0%) | 86 (100.0%) |
| 15 Years | 30 (100.0%) | 4 (57.1%) |
| 16 and 17 Years | 42 (84.0%) | 43 (87.8%) |
| 18 to 24 Years | 56 (87.5%) | 75 (93.8%) |
| 25 to 34 Years | 219 (100.0%) | 188 (84.3%) |
| 35 to 44 Years | 115 (74.2%) | 109 (71.2%) |
| 45 to 54 Years | 101 (88.6%) | 127 (97.0%) |
| 55 to 64 Years | 93 (80.2%) | 156 (94.0%) |
| 65 to 74 Years | 84 (100.0%) | 66 (100.0%) |
| 75 Years and over | 53 (100.0%) | 84 (94.4%) |
| Total | 1,061 (87.4%) | 1,117 (88.0%) |
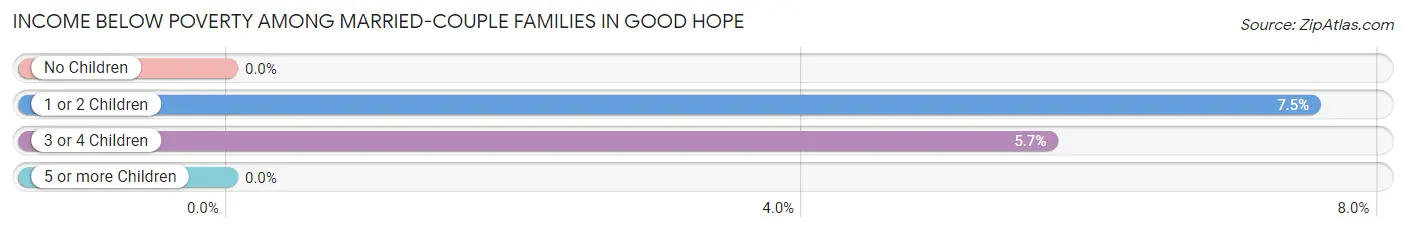
Income Below Poverty Among Married-Couple Families in Good Hope
The poverty statistics for married-couple families in Good Hope show that 3.7% or 19 of the total 518 families live below the poverty line. Families with 1 or 2 children have the highest poverty rate of 7.5%, comprising of 15 families. On the other hand, families with no children have the lowest poverty rate of 0.0%, which includes 0 families.
| Children | Above Poverty | Below Poverty |
| No Children | 249 (100.0%) | 0 (0.0%) |
| 1 or 2 Children | 184 (92.5%) | 15 (7.5%) |
| 3 or 4 Children | 66 (94.3%) | 4 (5.7%) |
| 5 or more Children | 0 (0.0%) | 0 (0.0%) |
| Total | 499 (96.3%) | 19 (3.7%) |
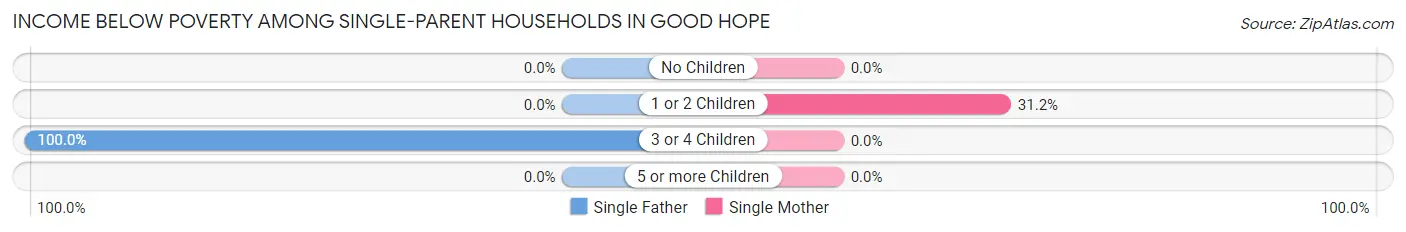
Income Below Poverty Among Single-Parent Households in Good Hope
According to the poverty data in Good Hope, 32.5% or 13 single-father households and 19.6% or 19 single-mother households are living below the poverty line. Among single-father households, those with 3 or 4 children have the highest poverty rate, with 13 households (100.0%) experiencing poverty. Likewise, among single-mother households, those with 1 or 2 children have the highest poverty rate, with 19 households (31.1%) falling below the poverty line.
| Children | Single Father | Single Mother |
| No Children | 0 (0.0%) | 0 (0.0%) |
| 1 or 2 Children | 0 (0.0%) | 19 (31.1%) |
| 3 or 4 Children | 13 (100.0%) | 0 (0.0%) |
| 5 or more Children | 0 (0.0%) | 0 (0.0%) |
| Total | 13 (32.5%) | 19 (19.6%) |
Income Below Poverty Among Married-Couple vs Single-Parent Households in Good Hope
The poverty data for Good Hope shows that 19 of the married-couple family households (3.7%) and 32 of the single-parent households (23.4%) are living below the poverty level. Within the married-couple family households, those with 1 or 2 children have the highest poverty rate, with 15 households (7.5%) falling below the poverty line. Among the single-parent households, those with 3 or 4 children have the highest poverty rate, with 13 household (100.0%) living below poverty.
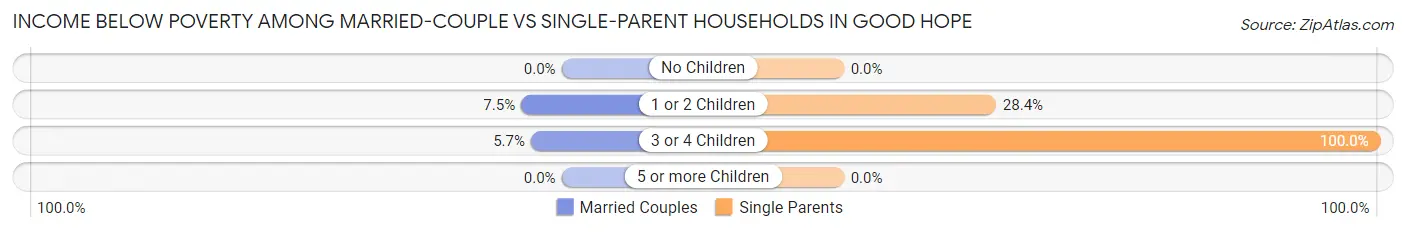
| Children | Married-Couple Families | Single-Parent Households |
| No Children | 0 (0.0%) | 0 (0.0%) |
| 1 or 2 Children | 15 (7.5%) | 19 (28.4%) |
| 3 or 4 Children | 4 (5.7%) | 13 (100.0%) |
| 5 or more Children | 0 (0.0%) | 0 (0.0%) |
| Total | 19 (3.7%) | 32 (23.4%) |
Employment Characteristics in Good Hope
Employment by Class of Employer in Good Hope
Among the 1,103 employed individuals in Good Hope, private company employees (844 | 76.5%), not-for-profit organizations (77 | 7.0%), and state government employees (56 | 5.1%) make up the most common classes of employment.
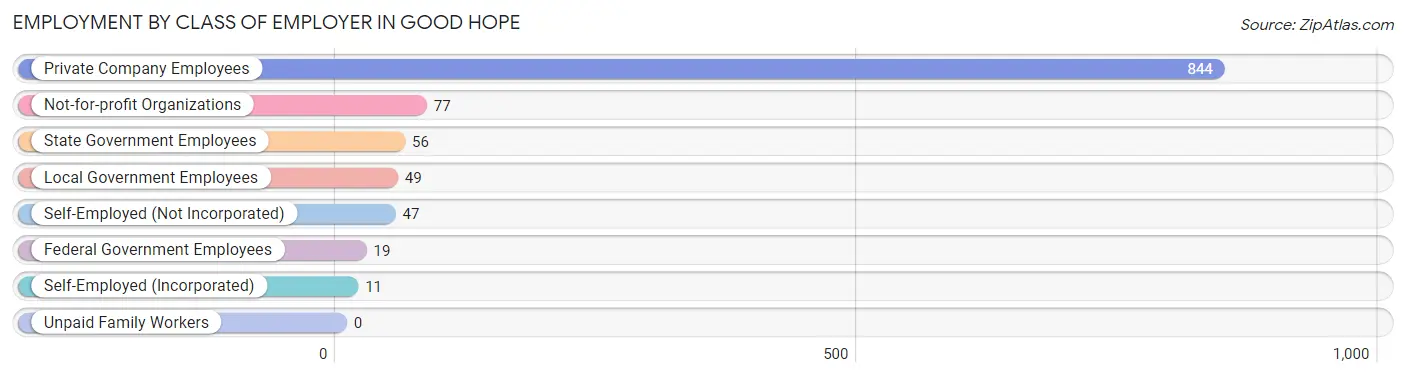
| Employer Class | # Employees | % Employees |
| Private Company Employees | 844 | 76.5% |
| Self-Employed (Incorporated) | 11 | 1.0% |
| Self-Employed (Not Incorporated) | 47 | 4.3% |
| Not-for-profit Organizations | 77 | 7.0% |
| Local Government Employees | 49 | 4.4% |
| State Government Employees | 56 | 5.1% |
| Federal Government Employees | 19 | 1.7% |
| Unpaid Family Workers | 0 | 0.0% |
| Total | 1,103 | 100.0% |
Employment Status by Age in Good Hope
According to the labor force statistics for Good Hope, out of the total population over 16 years of age (1,812), 64.8% or 1,174 individuals are in the labor force, with 3.1% or 36 of them unemployed. The age group with the highest labor force participation rate is 30 to 34 years, with 94.9% or 244 individuals in the labor force. Within the labor force, the 35 to 44 years age range has the highest percentage of unemployed individuals, with 17.9% or 36 of them being unemployed.
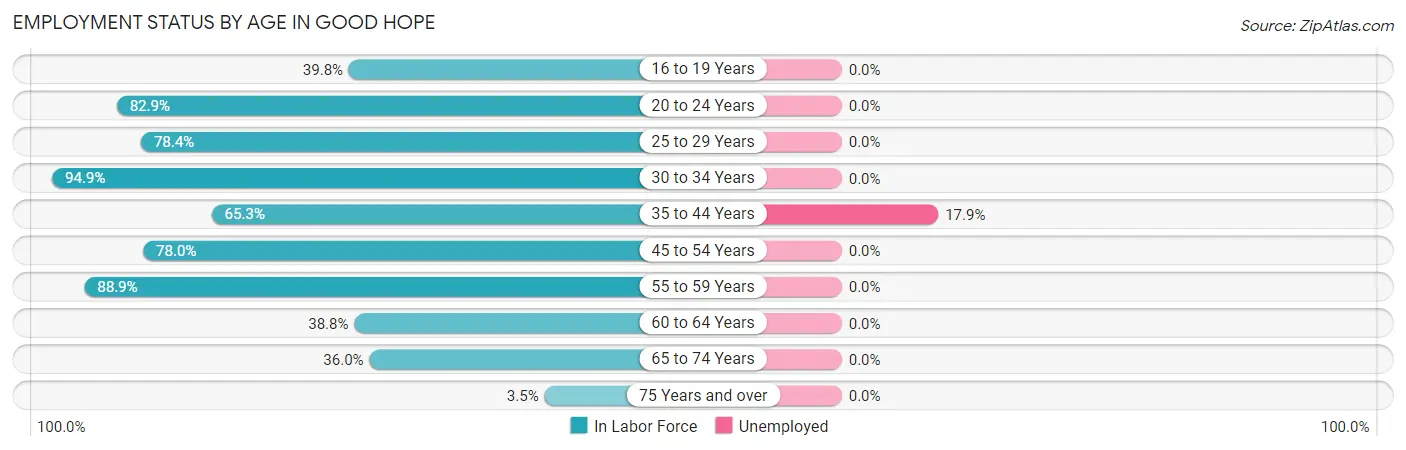
| Age Bracket | In Labor Force | Unemployed |
| 16 to 19 Years | 41 (39.8%) | 0 (0.0%) |
| 20 to 24 Years | 116 (82.9%) | 0 (0.0%) |
| 25 to 29 Years | 145 (78.4%) | 0 (0.0%) |
| 30 to 34 Years | 244 (94.9%) | 0 (0.0%) |
| 35 to 44 Years | 201 (65.3%) | 36 (17.9%) |
| 45 to 54 Years | 191 (78.0%) | 0 (0.0%) |
| 55 to 59 Years | 120 (88.9%) | 0 (0.0%) |
| 60 to 64 Years | 57 (38.8%) | 0 (0.0%) |
| 65 to 74 Years | 54 (36.0%) | 0 (0.0%) |
| 75 Years and over | 5 (3.5%) | 0 (0.0%) |
| Total | 1,174 (64.8%) | 36 (3.1%) |
Employment Status by Educational Attainment in Good Hope
According to labor force statistics for Good Hope, 75.0% of individuals (958) out of the total population between 25 and 64 years of age (1,277) are in the labor force, with 3.8% or 36 of them being unemployed. The group with the highest labor force participation rate are those with the educational attainment of bachelor's degree or higher, with 97.0% or 257 individuals in the labor force. Within the labor force, individuals with less than high school education have the highest percentage of unemployment, with 10.7% or 19 of them being unemployed.
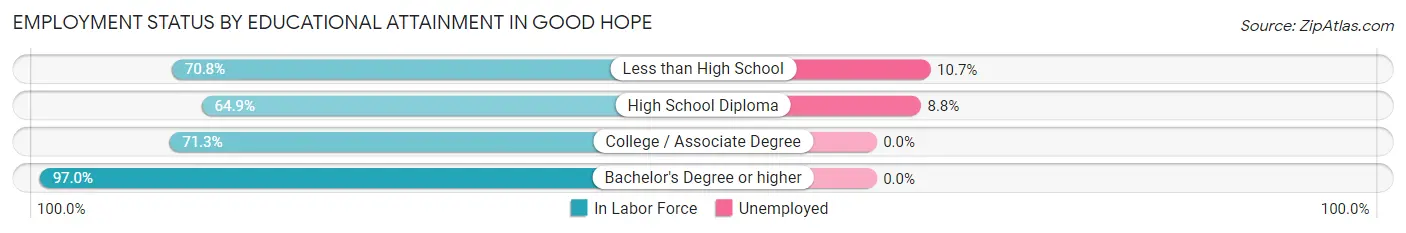
| Educational Attainment | In Labor Force | Unemployed |
| Less than High School | 177 (70.8%) | 27 (10.7%) |
| High School Diploma | 194 (64.9%) | 26 (8.8%) |
| College / Associate Degree | 330 (71.3%) | 0 (0.0%) |
| Bachelor's Degree or higher | 257 (97.0%) | 0 (0.0%) |
| Total | 958 (75.0%) | 49 (3.8%) |
Employment Occupations by Sex in Good Hope
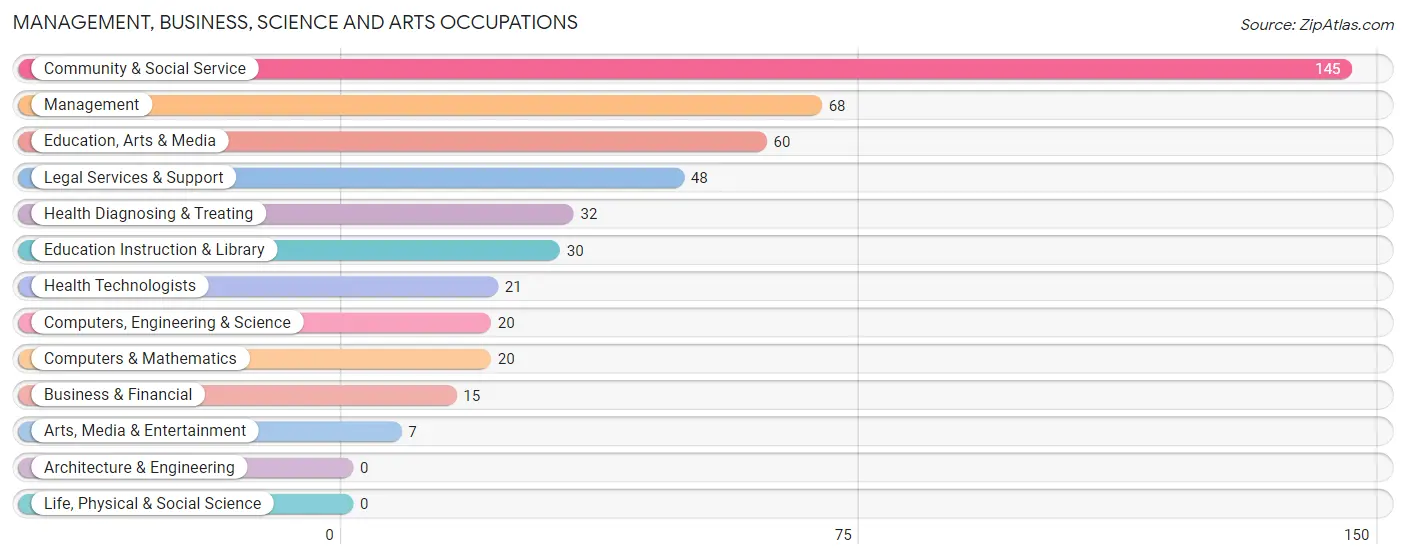
Management, Business, Science and Arts Occupations
The most common Management, Business, Science and Arts occupations in Good Hope are Community & Social Service (145 | 12.7%), Management (68 | 6.0%), Education, Arts & Media (60 | 5.3%), Legal Services & Support (48 | 4.2%), and Health Diagnosing & Treating (32 | 2.8%).
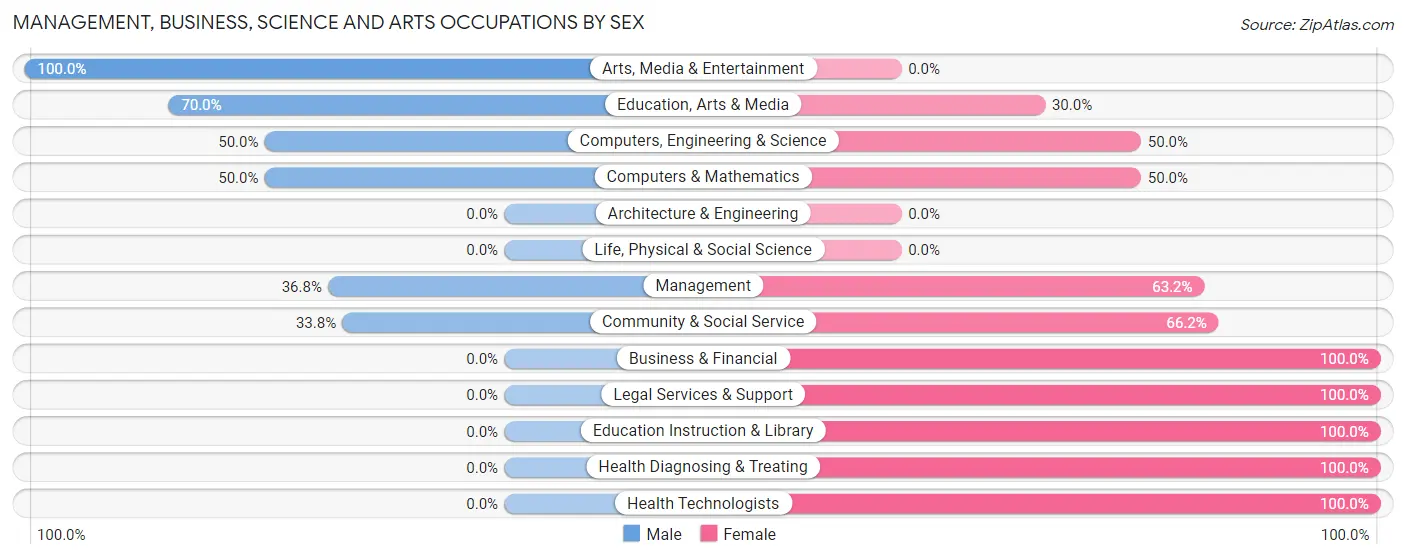
Management, Business, Science and Arts Occupations by Sex
Within the Management, Business, Science and Arts occupations in Good Hope, the most male-oriented occupations are Arts, Media & Entertainment (100.0%), Education, Arts & Media (70.0%), and Computers, Engineering & Science (50.0%), while the most female-oriented occupations are Business & Financial (100.0%), Legal Services & Support (100.0%), and Education Instruction & Library (100.0%).
| Occupation | Male | Female |
| Management | 25 (36.8%) | 43 (63.2%) |
| Business & Financial | 0 (0.0%) | 15 (100.0%) |
| Computers, Engineering & Science | 10 (50.0%) | 10 (50.0%) |
| Computers & Mathematics | 10 (50.0%) | 10 (50.0%) |
| Architecture & Engineering | 0 (0.0%) | 0 (0.0%) |
| Life, Physical & Social Science | 0 (0.0%) | 0 (0.0%) |
| Community & Social Service | 49 (33.8%) | 96 (66.2%) |
| Education, Arts & Media | 42 (70.0%) | 18 (30.0%) |
| Legal Services & Support | 0 (0.0%) | 48 (100.0%) |
| Education Instruction & Library | 0 (0.0%) | 30 (100.0%) |
| Arts, Media & Entertainment | 7 (100.0%) | 0 (0.0%) |
| Health Diagnosing & Treating | 0 (0.0%) | 32 (100.0%) |
| Health Technologists | 0 (0.0%) | 21 (100.0%) |
| Total (Category) | 84 (30.0%) | 196 (70.0%) |
| Total (Overall) | 587 (51.6%) | 551 (48.4%) |
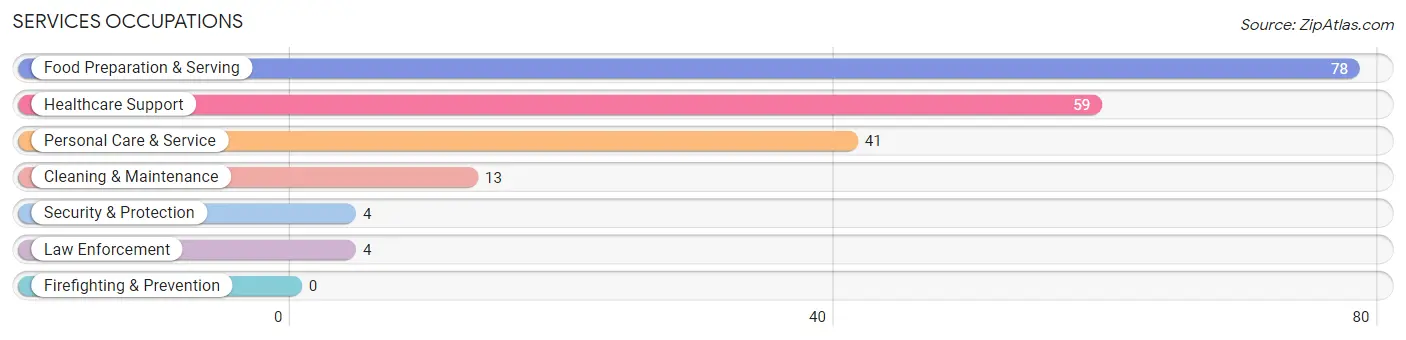
Services Occupations
The most common Services occupations in Good Hope are Food Preparation & Serving (78 | 6.9%), Healthcare Support (59 | 5.2%), Personal Care & Service (41 | 3.6%), Cleaning & Maintenance (13 | 1.1%), and Security & Protection (4 | 0.4%).
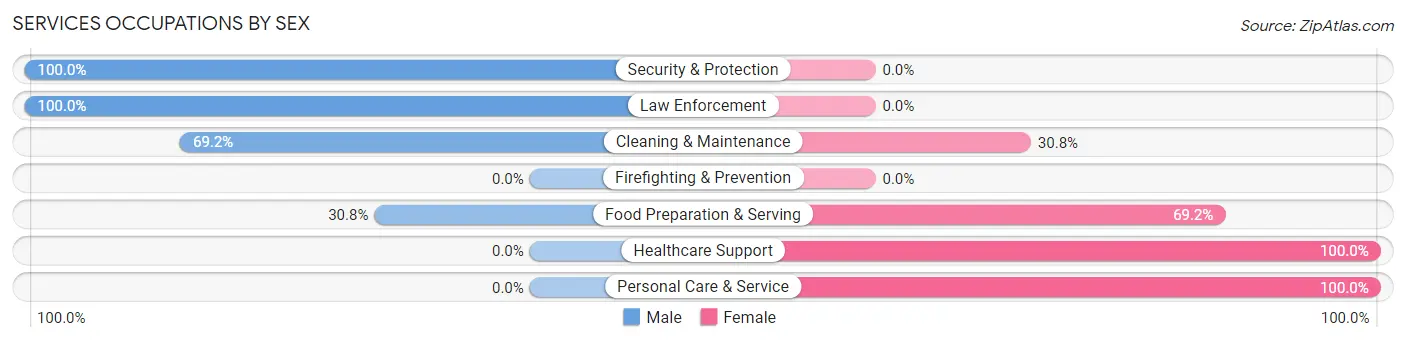
Services Occupations by Sex
Within the Services occupations in Good Hope, the most male-oriented occupations are Security & Protection (100.0%), Law Enforcement (100.0%), and Cleaning & Maintenance (69.2%), while the most female-oriented occupations are Healthcare Support (100.0%), Personal Care & Service (100.0%), and Food Preparation & Serving (69.2%).
| Occupation | Male | Female |
| Healthcare Support | 0 (0.0%) | 59 (100.0%) |
| Security & Protection | 4 (100.0%) | 0 (0.0%) |
| Firefighting & Prevention | 0 (0.0%) | 0 (0.0%) |
| Law Enforcement | 4 (100.0%) | 0 (0.0%) |
| Food Preparation & Serving | 24 (30.8%) | 54 (69.2%) |
| Cleaning & Maintenance | 9 (69.2%) | 4 (30.8%) |
| Personal Care & Service | 0 (0.0%) | 41 (100.0%) |
| Total (Category) | 37 (19.0%) | 158 (81.0%) |
| Total (Overall) | 587 (51.6%) | 551 (48.4%) |
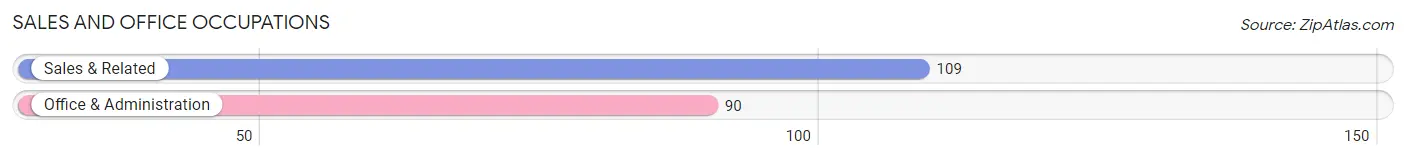
Sales and Office Occupations
The most common Sales and Office occupations in Good Hope are Sales & Related (109 | 9.6%), and Office & Administration (90 | 7.9%).
Sales and Office Occupations by Sex
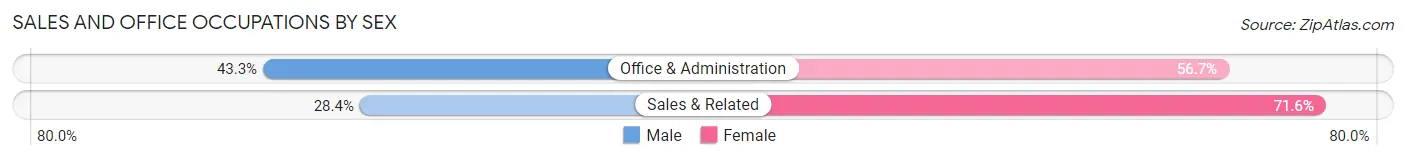
| Occupation | Male | Female |
| Sales & Related | 31 (28.4%) | 78 (71.6%) |
| Office & Administration | 39 (43.3%) | 51 (56.7%) |
| Total (Category) | 70 (35.2%) | 129 (64.8%) |
| Total (Overall) | 587 (51.6%) | 551 (48.4%) |
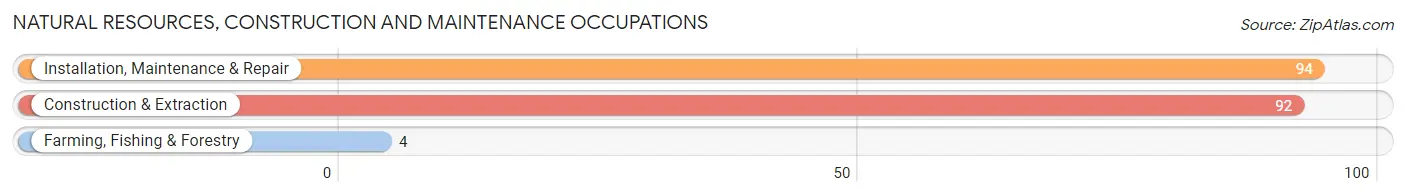
Natural Resources, Construction and Maintenance Occupations
The most common Natural Resources, Construction and Maintenance occupations in Good Hope are Installation, Maintenance & Repair (94 | 8.3%), Construction & Extraction (92 | 8.1%), and Farming, Fishing & Forestry (4 | 0.4%).
Natural Resources, Construction and Maintenance Occupations by Sex
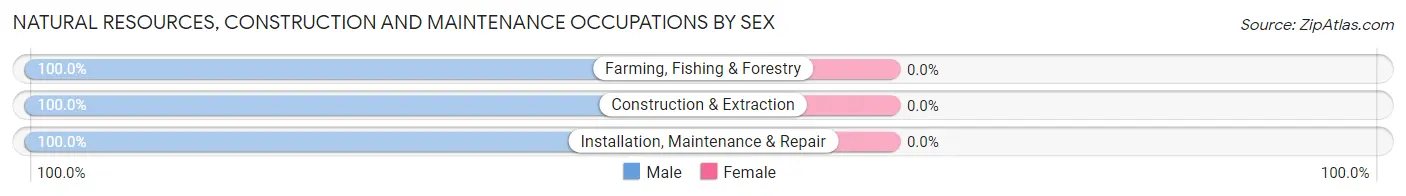
| Occupation | Male | Female |
| Farming, Fishing & Forestry | 4 (100.0%) | 0 (0.0%) |
| Construction & Extraction | 92 (100.0%) | 0 (0.0%) |
| Installation, Maintenance & Repair | 94 (100.0%) | 0 (0.0%) |
| Total (Category) | 190 (100.0%) | 0 (0.0%) |
| Total (Overall) | 587 (51.6%) | 551 (48.4%) |
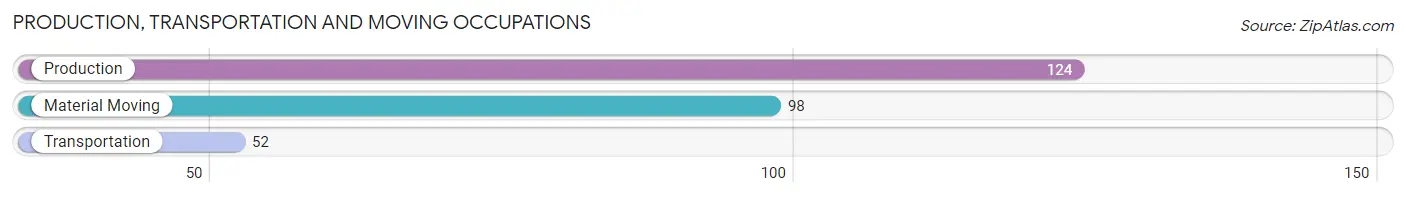
Production, Transportation and Moving Occupations
The most common Production, Transportation and Moving occupations in Good Hope are Production (124 | 10.9%), Material Moving (98 | 8.6%), and Transportation (52 | 4.6%).
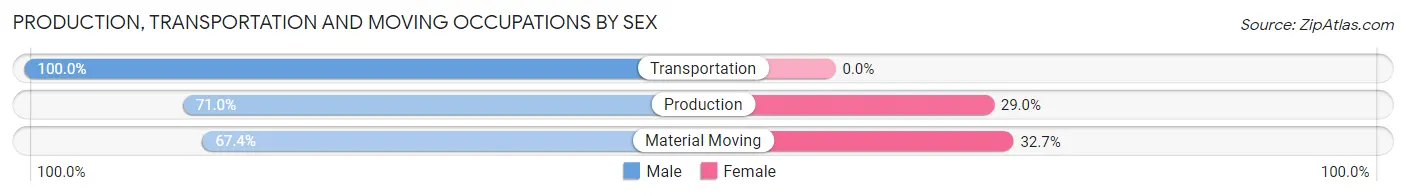
Production, Transportation and Moving Occupations by Sex
| Occupation | Male | Female |
| Production | 88 (71.0%) | 36 (29.0%) |
| Transportation | 52 (100.0%) | 0 (0.0%) |
| Material Moving | 66 (67.3%) | 32 (32.7%) |
| Total (Category) | 206 (75.2%) | 68 (24.8%) |
| Total (Overall) | 587 (51.6%) | 551 (48.4%) |
Employment Industries by Sex in Good Hope
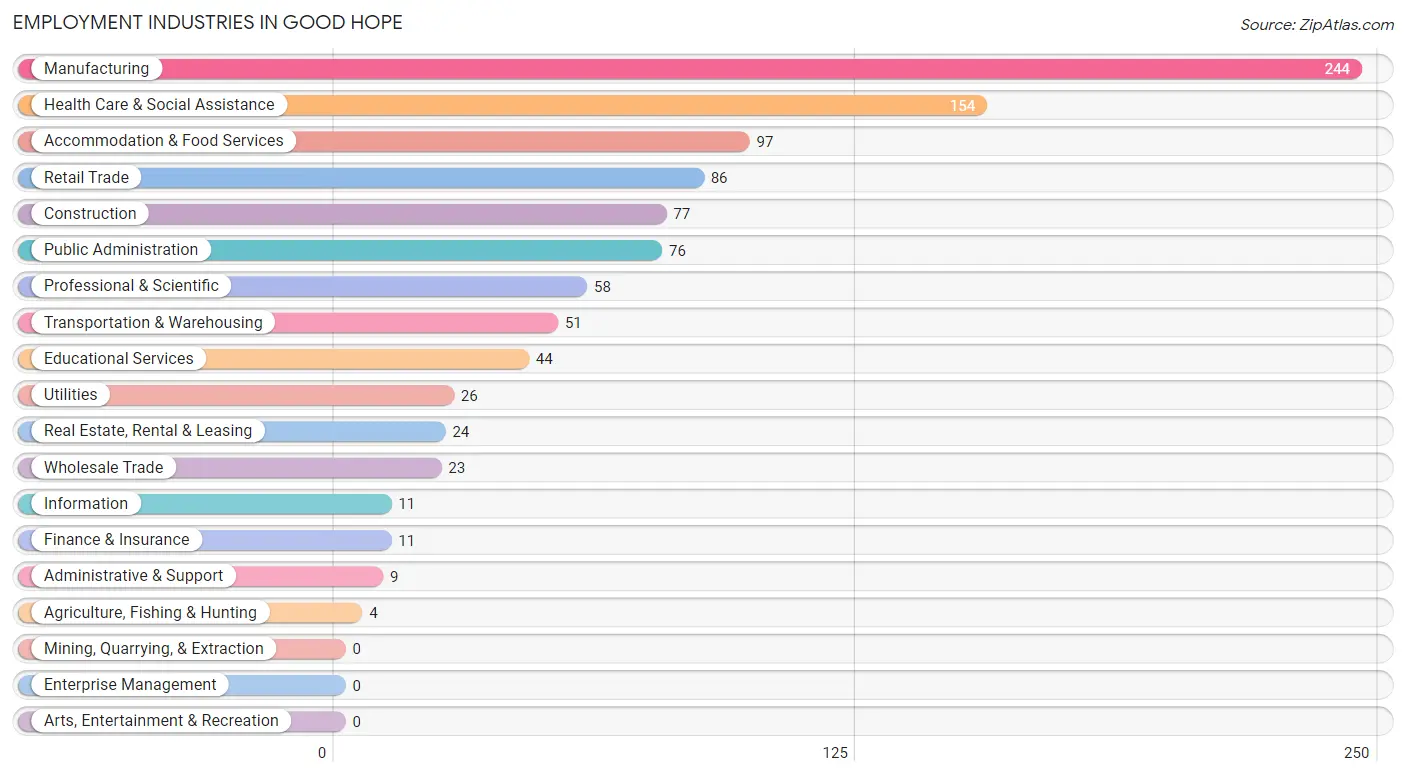
Employment Industries in Good Hope
The major employment industries in Good Hope include Manufacturing (244 | 21.4%), Health Care & Social Assistance (154 | 13.5%), Accommodation & Food Services (97 | 8.5%), Retail Trade (86 | 7.6%), and Construction (77 | 6.8%).
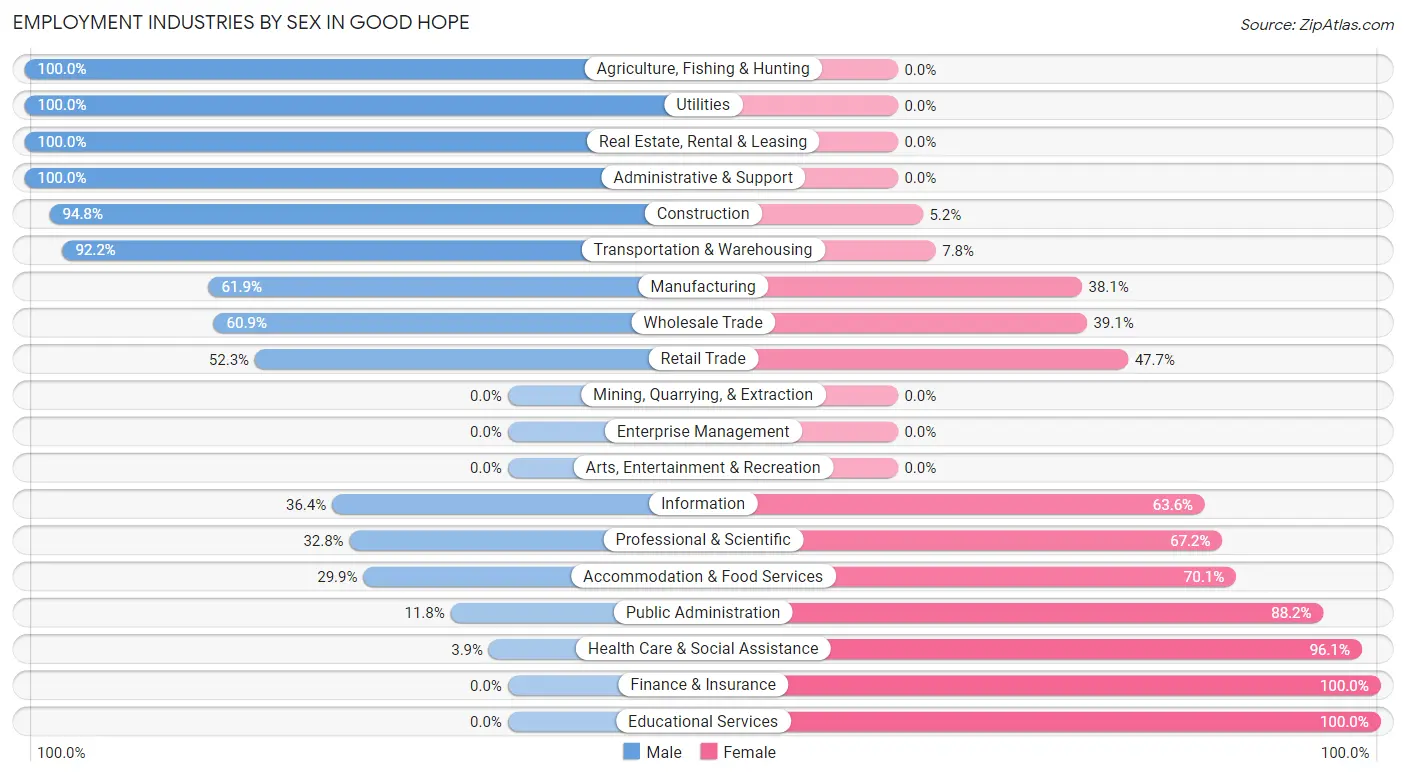
Employment Industries by Sex in Good Hope
The Good Hope industries that see more men than women are Agriculture, Fishing & Hunting (100.0%), Utilities (100.0%), and Real Estate, Rental & Leasing (100.0%), whereas the industries that tend to have a higher number of women are Finance & Insurance (100.0%), Educational Services (100.0%), and Health Care & Social Assistance (96.1%).
| Industry | Male | Female |
| Agriculture, Fishing & Hunting | 4 (100.0%) | 0 (0.0%) |
| Mining, Quarrying, & Extraction | 0 (0.0%) | 0 (0.0%) |
| Construction | 73 (94.8%) | 4 (5.2%) |
| Manufacturing | 151 (61.9%) | 93 (38.1%) |
| Wholesale Trade | 14 (60.9%) | 9 (39.1%) |
| Retail Trade | 45 (52.3%) | 41 (47.7%) |
| Transportation & Warehousing | 47 (92.2%) | 4 (7.8%) |
| Utilities | 26 (100.0%) | 0 (0.0%) |
| Information | 4 (36.4%) | 7 (63.6%) |
| Finance & Insurance | 0 (0.0%) | 11 (100.0%) |
| Real Estate, Rental & Leasing | 24 (100.0%) | 0 (0.0%) |
| Professional & Scientific | 19 (32.8%) | 39 (67.2%) |
| Enterprise Management | 0 (0.0%) | 0 (0.0%) |
| Administrative & Support | 9 (100.0%) | 0 (0.0%) |
| Educational Services | 0 (0.0%) | 44 (100.0%) |
| Health Care & Social Assistance | 6 (3.9%) | 148 (96.1%) |
| Arts, Entertainment & Recreation | 0 (0.0%) | 0 (0.0%) |
| Accommodation & Food Services | 29 (29.9%) | 68 (70.1%) |
| Public Administration | 9 (11.8%) | 67 (88.2%) |
| Total | 587 (51.6%) | 551 (48.4%) |
Education in Good Hope
School Enrollment in Good Hope
The most common levels of schooling among the 591 students in Good Hope are elementary school (216 | 36.5%), middle school (128 | 21.7%), and high school (126 | 21.3%).
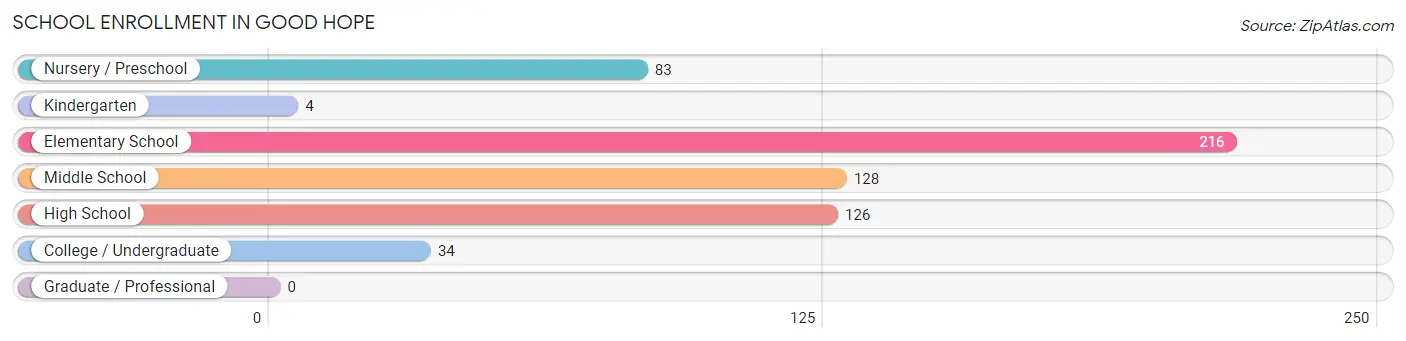
| School Level | # Students | % Students |
| Nursery / Preschool | 83 | 14.0% |
| Kindergarten | 4 | 0.7% |
| Elementary School | 216 | 36.5% |
| Middle School | 128 | 21.7% |
| High School | 126 | 21.3% |
| College / Undergraduate | 34 | 5.8% |
| Graduate / Professional | 0 | 0.0% |
| Total | 591 | 100.0% |
School Enrollment by Age by Funding Source in Good Hope
Out of a total of 591 students who are enrolled in schools in Good Hope, 22 (3.7%) attend a private institution, while the remaining 569 (96.3%) are enrolled in public schools. The age group of 25 to 34 year olds has the highest likelihood of being enrolled in private schools, with 5 (100.0% in the age bracket) enrolled. Conversely, the age group of 15 to 17 year olds has the lowest likelihood of being enrolled in a private school, with 122 (100.0% in the age bracket) attending a public institution.
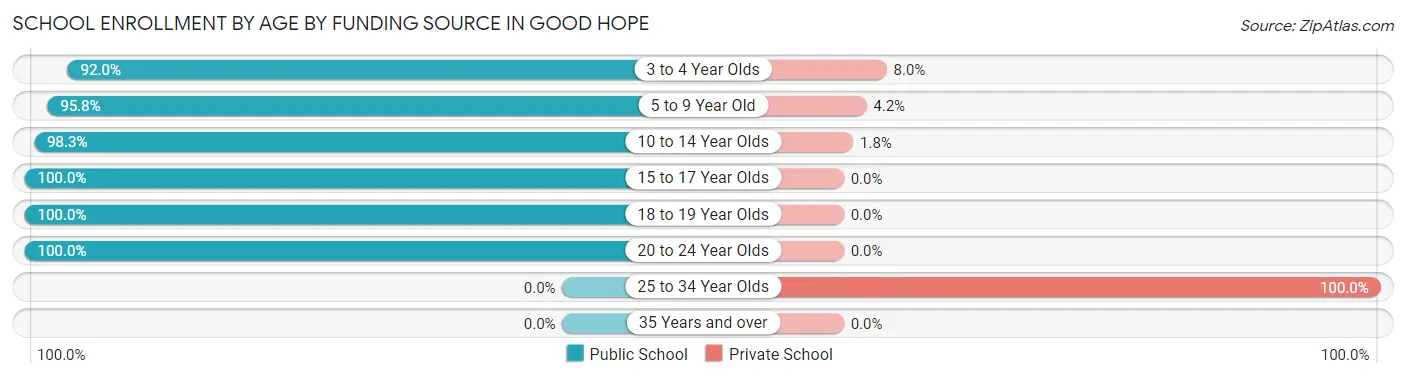
| Age Bracket | Public School | Private School |
| 3 to 4 Year Olds | 69 (92.0%) | 6 (8.0%) |
| 5 to 9 Year Old | 181 (95.8%) | 8 (4.2%) |
| 10 to 14 Year Olds | 168 (98.3%) | 3 (1.8%) |
| 15 to 17 Year Olds | 122 (100.0%) | 0 (0.0%) |
| 18 to 19 Year Olds | 4 (100.0%) | 0 (0.0%) |
| 20 to 24 Year Olds | 25 (100.0%) | 0 (0.0%) |
| 25 to 34 Year Olds | 0 (0.0%) | 5 (100.0%) |
| 35 Years and over | 0 (0.0%) | 0 (0.0%) |
| Total | 569 (96.3%) | 22 (3.7%) |
Educational Attainment by Field of Study in Good Hope
Literature & languages (86 | 29.0%), business (60 | 20.3%), education (30 | 10.1%), computers & mathematics (21 | 7.1%), and physical & health sciences (18 | 6.1%) are the most common fields of study among 296 individuals in Good Hope who have obtained a bachelor's degree or higher.

| Field of Study | # Graduates | % Graduates |
| Computers & Mathematics | 21 | 7.1% |
| Bio, Nature & Agricultural | 0 | 0.0% |
| Physical & Health Sciences | 18 | 6.1% |
| Psychology | 10 | 3.4% |
| Social Sciences | 11 | 3.7% |
| Engineering | 16 | 5.4% |
| Multidisciplinary Studies | 0 | 0.0% |
| Science & Technology | 17 | 5.7% |
| Business | 60 | 20.3% |
| Education | 30 | 10.1% |
| Literature & Languages | 86 | 29.0% |
| Liberal Arts & History | 9 | 3.0% |
| Visual & Performing Arts | 0 | 0.0% |
| Communications | 0 | 0.0% |
| Arts & Humanities | 18 | 6.1% |
| Total | 296 | 100.0% |
Transportation & Commute in Good Hope
Vehicle Availability by Sex in Good Hope
The most prevalent vehicle ownership categories in Good Hope are males with 3 vehicles (208, accounting for 36.7%) and females with 3 vehicles (164, making up 38.8%).
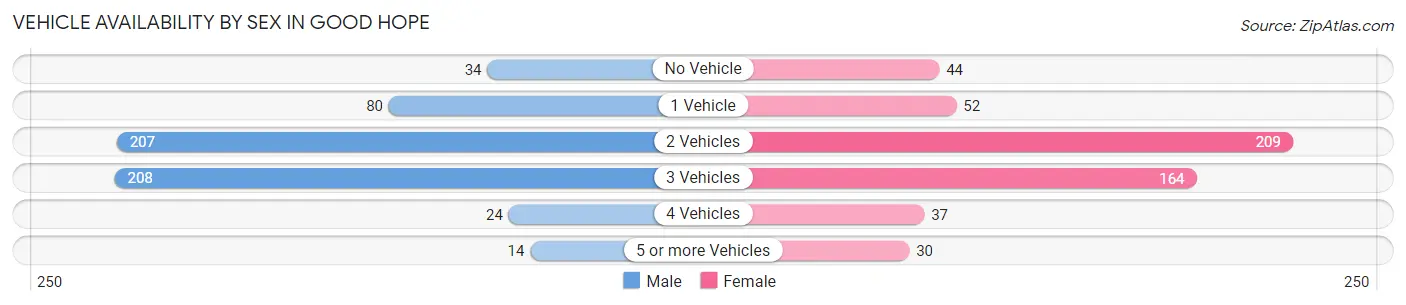
| Vehicles Available | Male | Female |
| No Vehicle | 34 (6.0%) | 44 (8.2%) |
| 1 Vehicle | 80 (14.1%) | 52 (9.7%) |
| 2 Vehicles | 207 (36.5%) | 209 (39.0%) |
| 3 Vehicles | 208 (36.7%) | 164 (30.6%) |
| 4 Vehicles | 24 (4.2%) | 37 (6.9%) |
| 5 or more Vehicles | 14 (2.5%) | 30 (5.6%) |
| Total | 567 (100.0%) | 536 (100.0%) |
Commute Time in Good Hope
The most frequently occuring commute durations in Good Hope are 10 to 14 minutes (233 commuters, 21.5%), 15 to 19 minutes (206 commuters, 19.1%), and 5 to 9 minutes (200 commuters, 18.5%).
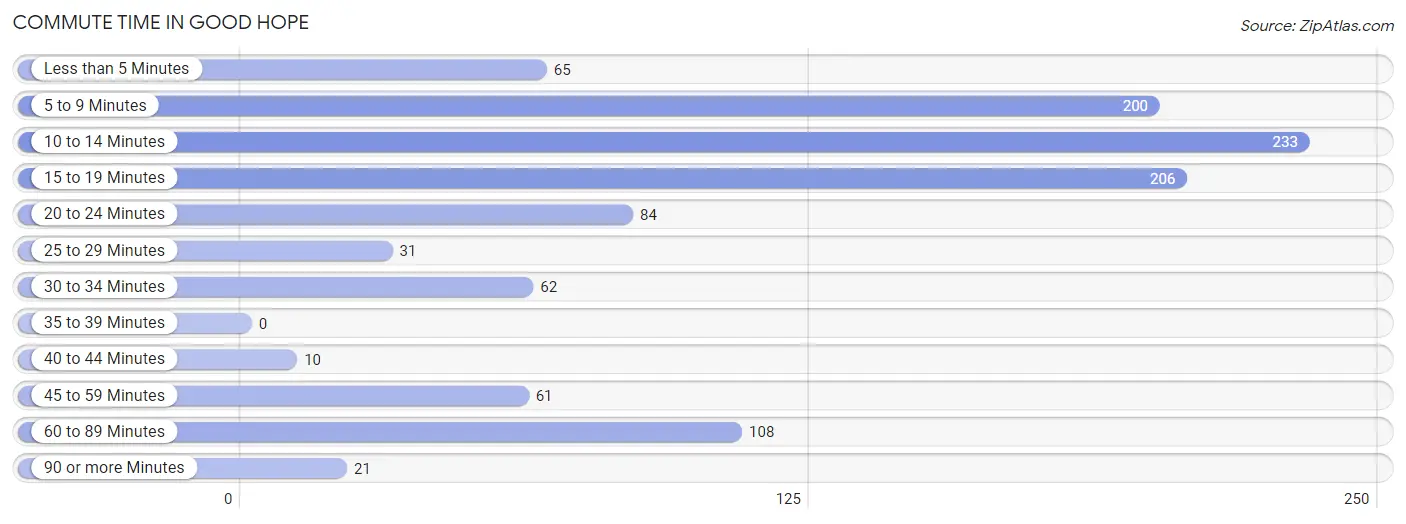
| Commute Time | # Commuters | % Commuters |
| Less than 5 Minutes | 65 | 6.0% |
| 5 to 9 Minutes | 200 | 18.5% |
| 10 to 14 Minutes | 233 | 21.5% |
| 15 to 19 Minutes | 206 | 19.1% |
| 20 to 24 Minutes | 84 | 7.8% |
| 25 to 29 Minutes | 31 | 2.9% |
| 30 to 34 Minutes | 62 | 5.7% |
| 35 to 39 Minutes | 0 | 0.0% |
| 40 to 44 Minutes | 10 | 0.9% |
| 45 to 59 Minutes | 61 | 5.6% |
| 60 to 89 Minutes | 108 | 10.0% |
| 90 or more Minutes | 21 | 1.9% |
Commute Time by Sex in Good Hope
The most common commute times in Good Hope are 10 to 14 minutes (152 commuters, 27.1%) for males and 15 to 19 minutes (153 commuters, 29.4%) for females.
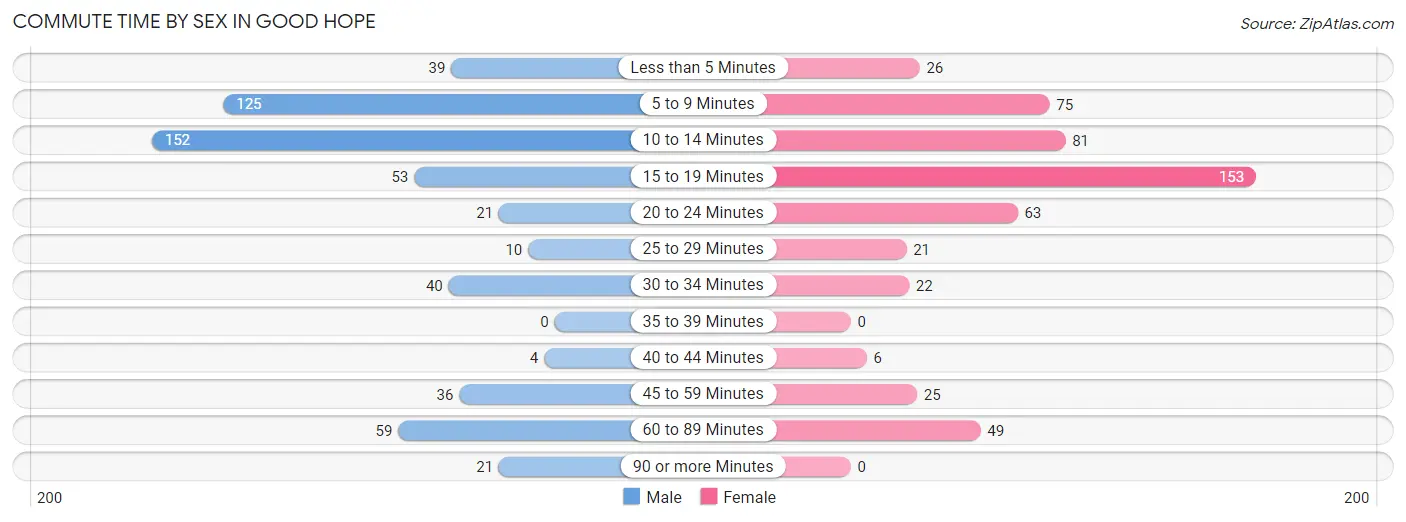
| Commute Time | Male | Female |
| Less than 5 Minutes | 39 (7.0%) | 26 (5.0%) |
| 5 to 9 Minutes | 125 (22.3%) | 75 (14.4%) |
| 10 to 14 Minutes | 152 (27.1%) | 81 (15.5%) |
| 15 to 19 Minutes | 53 (9.5%) | 153 (29.4%) |
| 20 to 24 Minutes | 21 (3.7%) | 63 (12.1%) |
| 25 to 29 Minutes | 10 (1.8%) | 21 (4.0%) |
| 30 to 34 Minutes | 40 (7.1%) | 22 (4.2%) |
| 35 to 39 Minutes | 0 (0.0%) | 0 (0.0%) |
| 40 to 44 Minutes | 4 (0.7%) | 6 (1.1%) |
| 45 to 59 Minutes | 36 (6.4%) | 25 (4.8%) |
| 60 to 89 Minutes | 59 (10.5%) | 49 (9.4%) |
| 90 or more Minutes | 21 (3.7%) | 0 (0.0%) |
Time of Departure to Work by Sex in Good Hope
The most frequent times of departure to work in Good Hope are 7:30 AM to 7:59 AM (123, 22.0%) for males and 7:00 AM to 7:29 AM (111, 21.3%) for females.
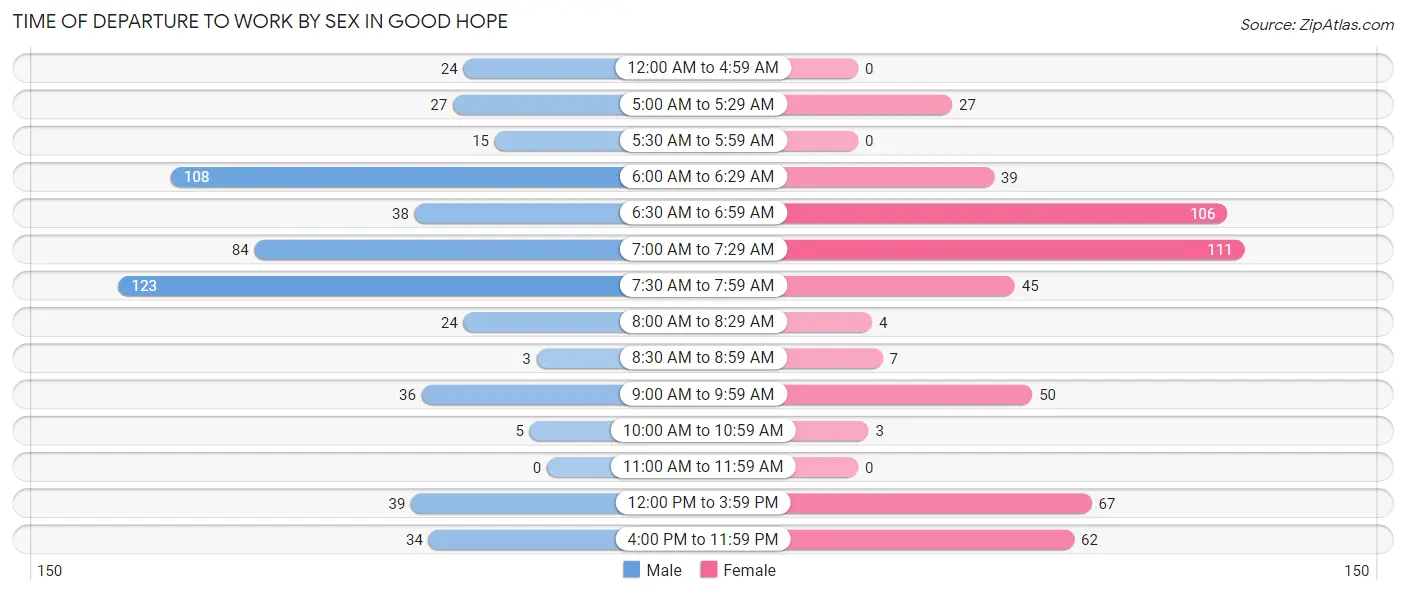
| Time of Departure | Male | Female |
| 12:00 AM to 4:59 AM | 24 (4.3%) | 0 (0.0%) |
| 5:00 AM to 5:29 AM | 27 (4.8%) | 27 (5.2%) |
| 5:30 AM to 5:59 AM | 15 (2.7%) | 0 (0.0%) |
| 6:00 AM to 6:29 AM | 108 (19.3%) | 39 (7.5%) |
| 6:30 AM to 6:59 AM | 38 (6.8%) | 106 (20.3%) |
| 7:00 AM to 7:29 AM | 84 (15.0%) | 111 (21.3%) |
| 7:30 AM to 7:59 AM | 123 (22.0%) | 45 (8.6%) |
| 8:00 AM to 8:29 AM | 24 (4.3%) | 4 (0.8%) |
| 8:30 AM to 8:59 AM | 3 (0.5%) | 7 (1.3%) |
| 9:00 AM to 9:59 AM | 36 (6.4%) | 50 (9.6%) |
| 10:00 AM to 10:59 AM | 5 (0.9%) | 3 (0.6%) |
| 11:00 AM to 11:59 AM | 0 (0.0%) | 0 (0.0%) |
| 12:00 PM to 3:59 PM | 39 (7.0%) | 67 (12.9%) |
| 4:00 PM to 11:59 PM | 34 (6.1%) | 62 (11.9%) |
| Total | 560 (100.0%) | 521 (100.0%) |
Housing Occupancy in Good Hope
Occupancy by Ownership in Good Hope
Of the total 804 dwellings in Good Hope, owner-occupied units account for 568 (70.7%), while renter-occupied units make up 236 (29.3%).
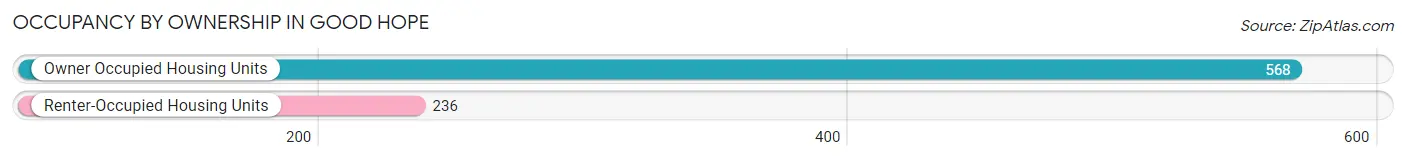
| Occupancy | # Housing Units | % Housing Units |
| Owner Occupied Housing Units | 568 | 70.7% |
| Renter-Occupied Housing Units | 236 | 29.3% |
| Total Occupied Housing Units | 804 | 100.0% |
Occupancy by Household Size in Good Hope
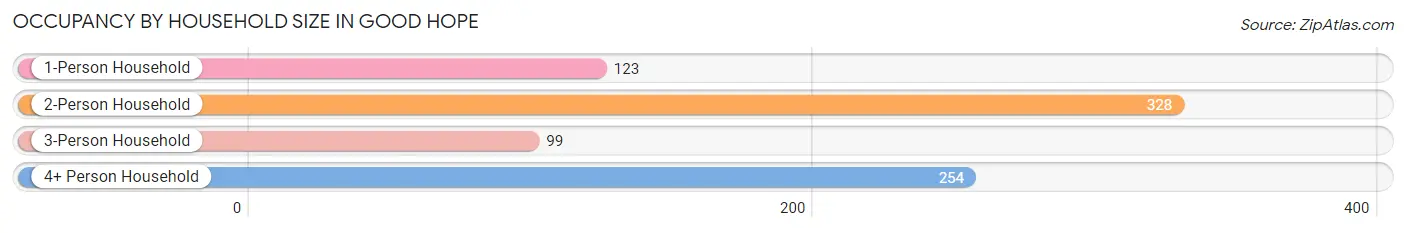
| Household Size | # Housing Units | % Housing Units |
| 1-Person Household | 123 | 15.3% |
| 2-Person Household | 328 | 40.8% |
| 3-Person Household | 99 | 12.3% |
| 4+ Person Household | 254 | 31.6% |
| Total Housing Units | 804 | 100.0% |
Occupancy by Ownership by Household Size in Good Hope
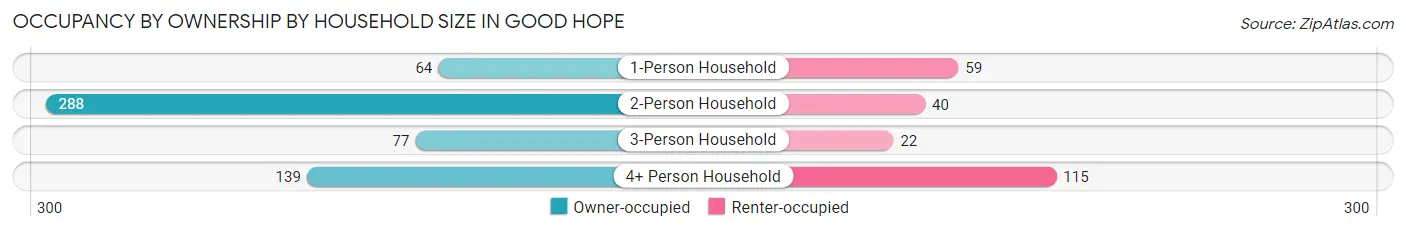
| Household Size | Owner-occupied | Renter-occupied |
| 1-Person Household | 64 (52.0%) | 59 (48.0%) |
| 2-Person Household | 288 (87.8%) | 40 (12.2%) |
| 3-Person Household | 77 (77.8%) | 22 (22.2%) |
| 4+ Person Household | 139 (54.7%) | 115 (45.3%) |
| Total Housing Units | 568 (70.7%) | 236 (29.3%) |
Occupancy by Educational Attainment in Good Hope
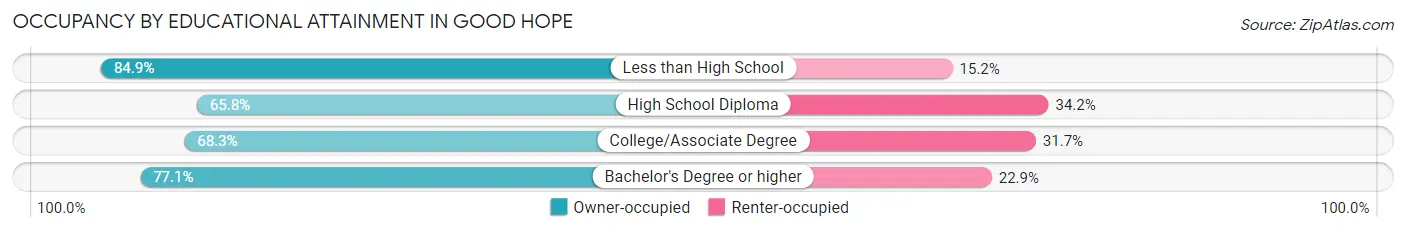
| Household Size | Owner-occupied | Renter-occupied |
| Less than High School | 56 (84.9%) | 10 (15.1%) |
| High School Diploma | 158 (65.8%) | 82 (34.2%) |
| College/Associate Degree | 233 (68.3%) | 108 (31.7%) |
| Bachelor's Degree or higher | 121 (77.1%) | 36 (22.9%) |
Occupancy by Age of Householder in Good Hope
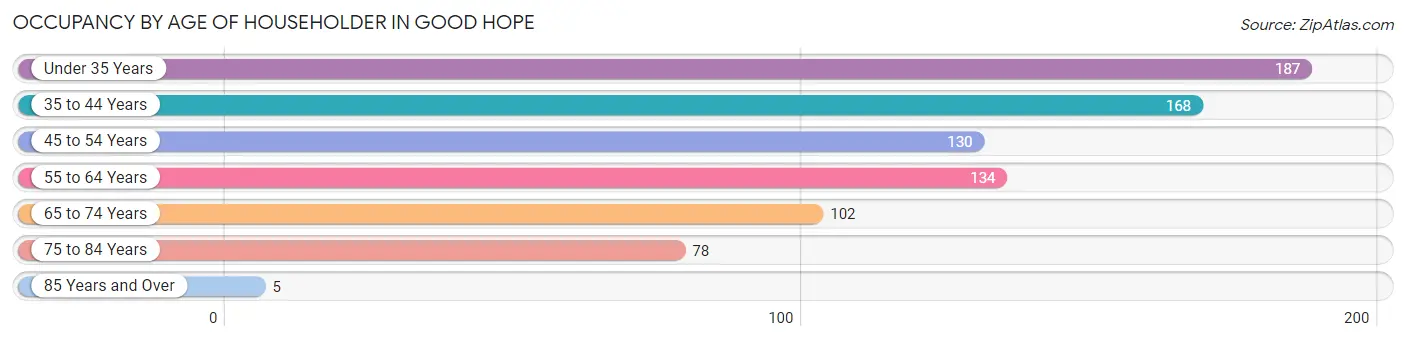
| Age Bracket | # Households | % Households |
| Under 35 Years | 187 | 23.3% |
| 35 to 44 Years | 168 | 20.9% |
| 45 to 54 Years | 130 | 16.2% |
| 55 to 64 Years | 134 | 16.7% |
| 65 to 74 Years | 102 | 12.7% |
| 75 to 84 Years | 78 | 9.7% |
| 85 Years and Over | 5 | 0.6% |
| Total | 804 | 100.0% |
Housing Finances in Good Hope
Median Income by Occupancy in Good Hope
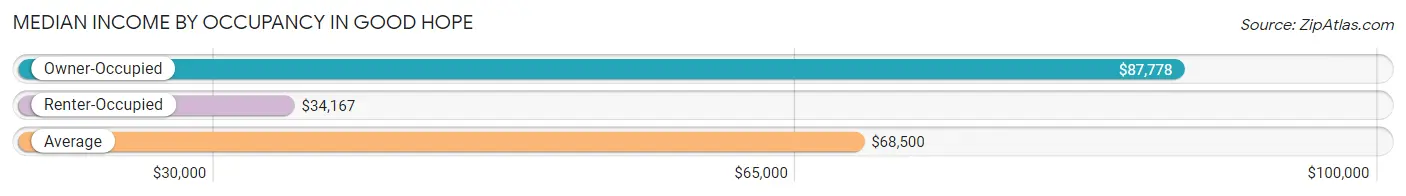
| Occupancy Type | # Households | Median Income |
| Owner-Occupied | 568 (70.7%) | $87,778 |
| Renter-Occupied | 236 (29.3%) | $34,167 |
| Average | 804 (100.0%) | $68,500 |
Occupancy by Householder Income Bracket in Good Hope
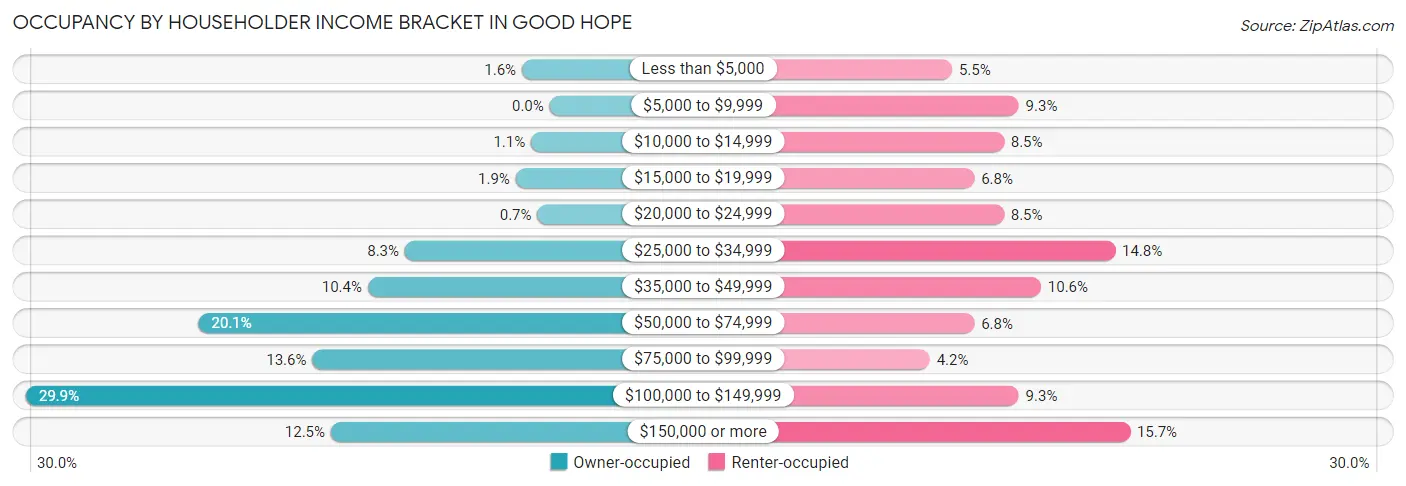
| Income Bracket | Owner-occupied | Renter-occupied |
| Less than $5,000 | 9 (1.6%) | 13 (5.5%) |
| $5,000 to $9,999 | 0 (0.0%) | 22 (9.3%) |
| $10,000 to $14,999 | 6 (1.1%) | 20 (8.5%) |
| $15,000 to $19,999 | 11 (1.9%) | 16 (6.8%) |
| $20,000 to $24,999 | 4 (0.7%) | 20 (8.5%) |
| $25,000 to $34,999 | 47 (8.3%) | 35 (14.8%) |
| $35,000 to $49,999 | 59 (10.4%) | 25 (10.6%) |
| $50,000 to $74,999 | 114 (20.1%) | 16 (6.8%) |
| $75,000 to $99,999 | 77 (13.6%) | 10 (4.2%) |
| $100,000 to $149,999 | 170 (29.9%) | 22 (9.3%) |
| $150,000 or more | 71 (12.5%) | 37 (15.7%) |
| Total | 568 (100.0%) | 236 (100.0%) |
Monthly Housing Cost Tiers in Good Hope
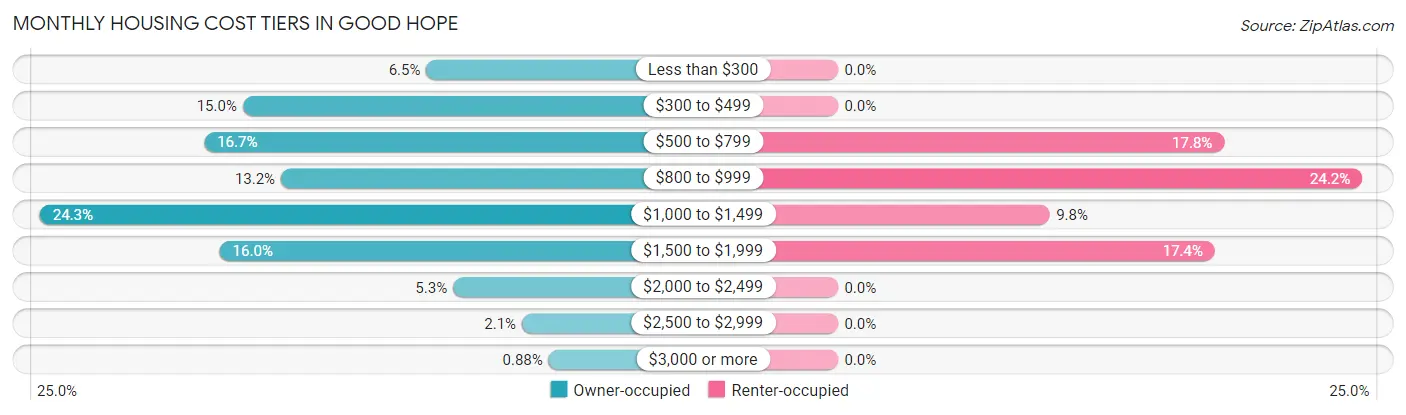
| Monthly Cost | Owner-occupied | Renter-occupied |
| Less than $300 | 37 (6.5%) | 0 (0.0%) |
| $300 to $499 | 85 (15.0%) | 0 (0.0%) |
| $500 to $799 | 95 (16.7%) | 42 (17.8%) |
| $800 to $999 | 75 (13.2%) | 57 (24.1%) |
| $1,000 to $1,499 | 138 (24.3%) | 23 (9.8%) |
| $1,500 to $1,999 | 91 (16.0%) | 41 (17.4%) |
| $2,000 to $2,499 | 30 (5.3%) | 0 (0.0%) |
| $2,500 to $2,999 | 12 (2.1%) | 0 (0.0%) |
| $3,000 or more | 5 (0.9%) | 0 (0.0%) |
| Total | 568 (100.0%) | 236 (100.0%) |
Physical Housing Characteristics in Good Hope
Housing Structures in Good Hope
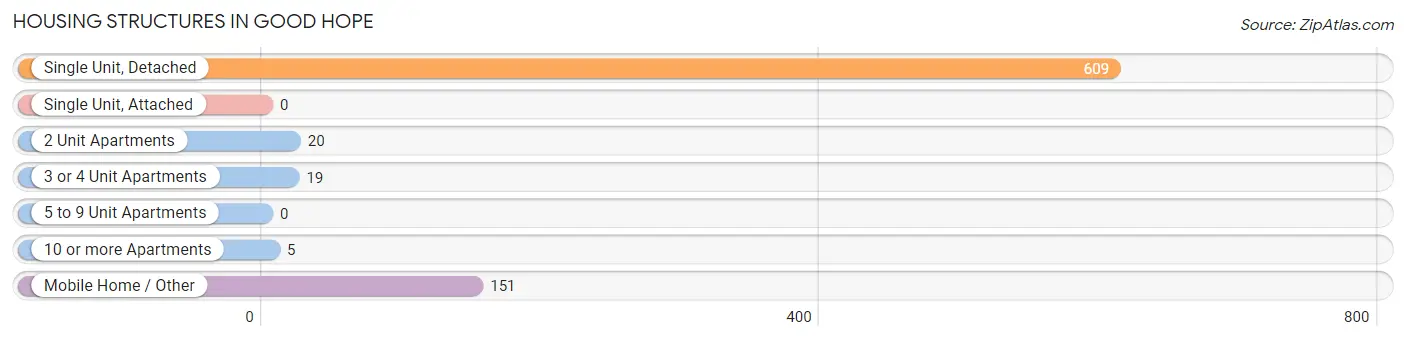
| Structure Type | # Housing Units | % Housing Units |
| Single Unit, Detached | 609 | 75.7% |
| Single Unit, Attached | 0 | 0.0% |
| 2 Unit Apartments | 20 | 2.5% |
| 3 or 4 Unit Apartments | 19 | 2.4% |
| 5 to 9 Unit Apartments | 0 | 0.0% |
| 10 or more Apartments | 5 | 0.6% |
| Mobile Home / Other | 151 | 18.8% |
| Total | 804 | 100.0% |
Housing Structures by Occupancy in Good Hope
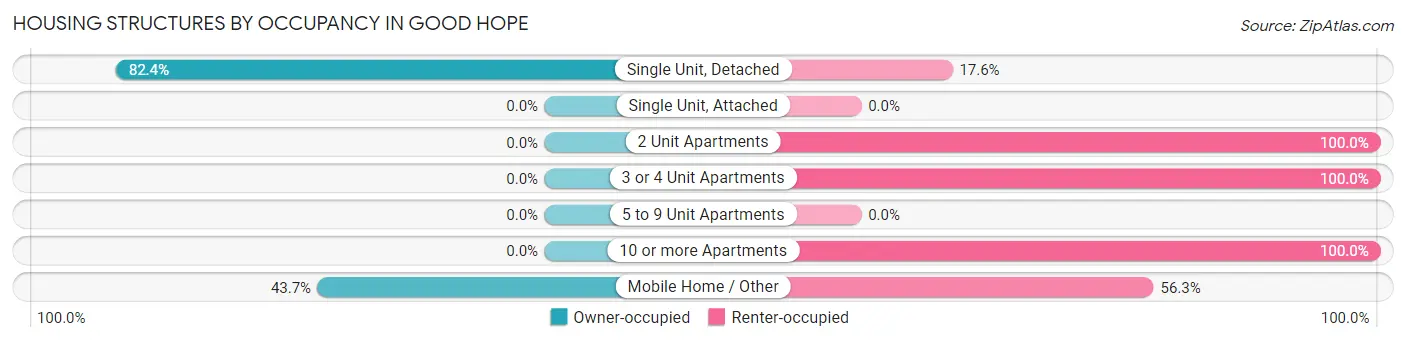
| Structure Type | Owner-occupied | Renter-occupied |
| Single Unit, Detached | 502 (82.4%) | 107 (17.6%) |
| Single Unit, Attached | 0 (0.0%) | 0 (0.0%) |
| 2 Unit Apartments | 0 (0.0%) | 20 (100.0%) |
| 3 or 4 Unit Apartments | 0 (0.0%) | 19 (100.0%) |
| 5 to 9 Unit Apartments | 0 (0.0%) | 0 (0.0%) |
| 10 or more Apartments | 0 (0.0%) | 5 (100.0%) |
| Mobile Home / Other | 66 (43.7%) | 85 (56.3%) |
| Total | 568 (70.7%) | 236 (29.3%) |
Housing Structures by Number of Rooms in Good Hope
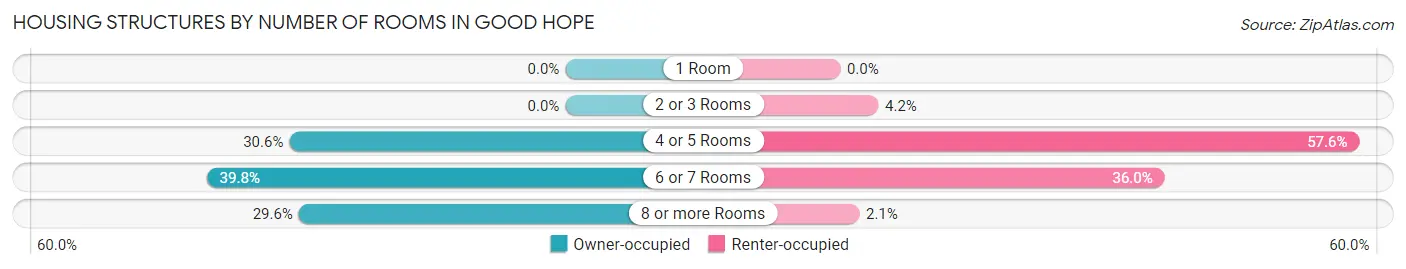
| Number of Rooms | Owner-occupied | Renter-occupied |
| 1 Room | 0 (0.0%) | 0 (0.0%) |
| 2 or 3 Rooms | 0 (0.0%) | 10 (4.2%) |
| 4 or 5 Rooms | 174 (30.6%) | 136 (57.6%) |
| 6 or 7 Rooms | 226 (39.8%) | 85 (36.0%) |
| 8 or more Rooms | 168 (29.6%) | 5 (2.1%) |
| Total | 568 (100.0%) | 236 (100.0%) |
Housing Structure by Heating Type in Good Hope
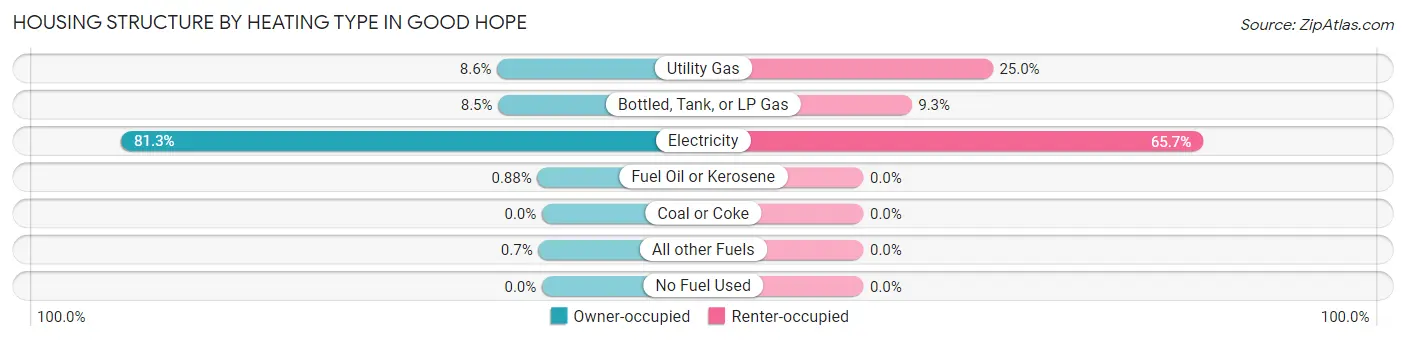
| Heating Type | Owner-occupied | Renter-occupied |
| Utility Gas | 49 (8.6%) | 59 (25.0%) |
| Bottled, Tank, or LP Gas | 48 (8.5%) | 22 (9.3%) |
| Electricity | 462 (81.3%) | 155 (65.7%) |
| Fuel Oil or Kerosene | 5 (0.9%) | 0 (0.0%) |
| Coal or Coke | 0 (0.0%) | 0 (0.0%) |
| All other Fuels | 4 (0.7%) | 0 (0.0%) |
| No Fuel Used | 0 (0.0%) | 0 (0.0%) |
| Total | 568 (100.0%) | 236 (100.0%) |
Household Vehicle Usage in Good Hope
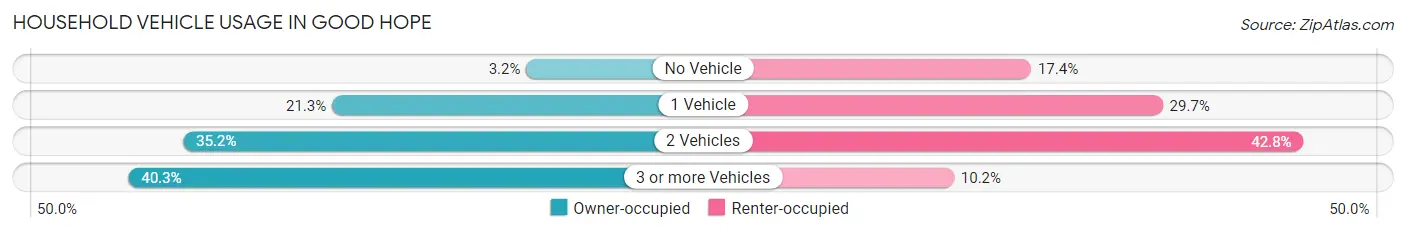
| Vehicles per Household | Owner-occupied | Renter-occupied |
| No Vehicle | 18 (3.2%) | 41 (17.4%) |
| 1 Vehicle | 121 (21.3%) | 70 (29.7%) |
| 2 Vehicles | 200 (35.2%) | 101 (42.8%) |
| 3 or more Vehicles | 229 (40.3%) | 24 (10.2%) |
| Total | 568 (100.0%) | 236 (100.0%) |
Real Estate & Mortgages in Good Hope
Real Estate and Mortgage Overview in Good Hope
| Characteristic | Without Mortgage | With Mortgage |
| Housing Units | 190 | 378 |
| Median Property Value | $121,700 | $206,700 |
| Median Household Income | $51,786 | $57 |
| Monthly Housing Costs | $450 | $5 |
| Real Estate Taxes | $279 | $68 |
Property Value by Mortgage Status in Good Hope
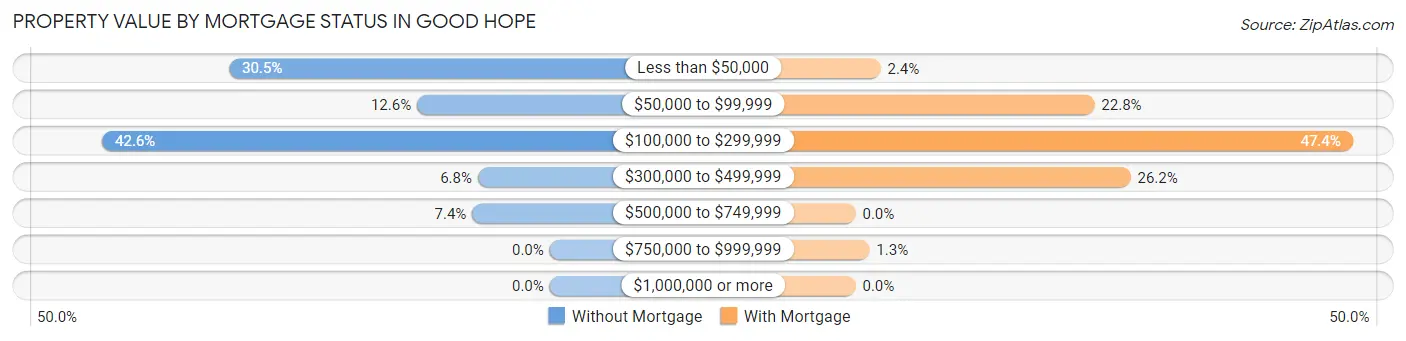
| Property Value | Without Mortgage | With Mortgage |
| Less than $50,000 | 58 (30.5%) | 9 (2.4%) |
| $50,000 to $99,999 | 24 (12.6%) | 86 (22.8%) |
| $100,000 to $299,999 | 81 (42.6%) | 179 (47.3%) |
| $300,000 to $499,999 | 13 (6.8%) | 99 (26.2%) |
| $500,000 to $749,999 | 14 (7.4%) | 0 (0.0%) |
| $750,000 to $999,999 | 0 (0.0%) | 5 (1.3%) |
| $1,000,000 or more | 0 (0.0%) | 0 (0.0%) |
| Total | 190 (100.0%) | 378 (100.0%) |
Household Income by Mortgage Status in Good Hope
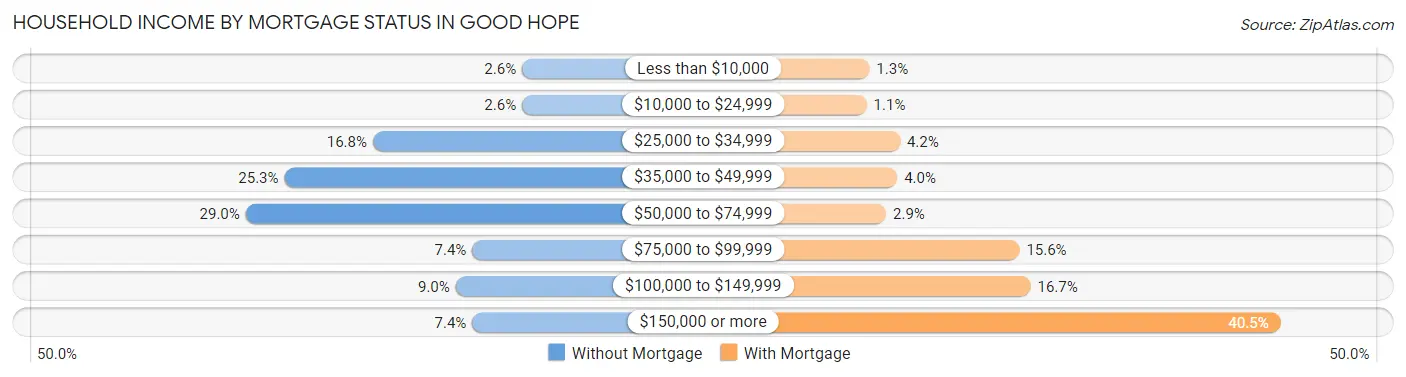
| Household Income | Without Mortgage | With Mortgage |
| Less than $10,000 | 5 (2.6%) | 5 (1.3%) |
| $10,000 to $24,999 | 5 (2.6%) | 4 (1.1%) |
| $25,000 to $34,999 | 32 (16.8%) | 16 (4.2%) |
| $35,000 to $49,999 | 48 (25.3%) | 15 (4.0%) |
| $50,000 to $74,999 | 55 (28.9%) | 11 (2.9%) |
| $75,000 to $99,999 | 14 (7.4%) | 59 (15.6%) |
| $100,000 to $149,999 | 17 (8.9%) | 63 (16.7%) |
| $150,000 or more | 14 (7.4%) | 153 (40.5%) |
| Total | 190 (100.0%) | 378 (100.0%) |
Property Value to Household Income Ratio in Good Hope
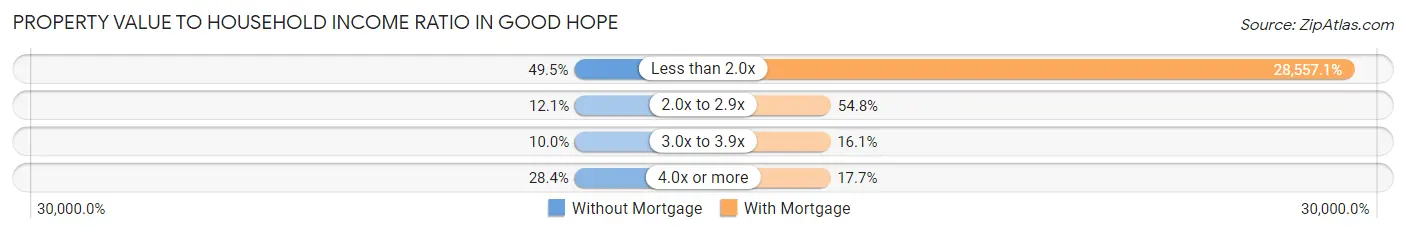
| Value-to-Income Ratio | Without Mortgage | With Mortgage |
| Less than 2.0x | 94 (49.5%) | 107,946 (28,557.1%) |
| 2.0x to 2.9x | 23 (12.1%) | 207 (54.8%) |
| 3.0x to 3.9x | 19 (10.0%) | 61 (16.1%) |
| 4.0x or more | 54 (28.4%) | 67 (17.7%) |
| Total | 190 (100.0%) | 378 (100.0%) |
Real Estate Taxes by Mortgage Status in Good Hope
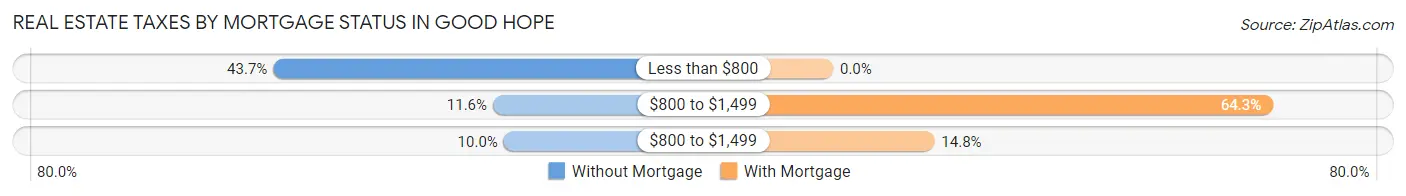
| Property Taxes | Without Mortgage | With Mortgage |
| Less than $800 | 83 (43.7%) | 0 (0.0%) |
| $800 to $1,499 | 22 (11.6%) | 243 (64.3%) |
| $800 to $1,499 | 19 (10.0%) | 56 (14.8%) |
| Total | 190 (100.0%) | 378 (100.0%) |
Health & Disability in Good Hope
Health Insurance Coverage by Age in Good Hope
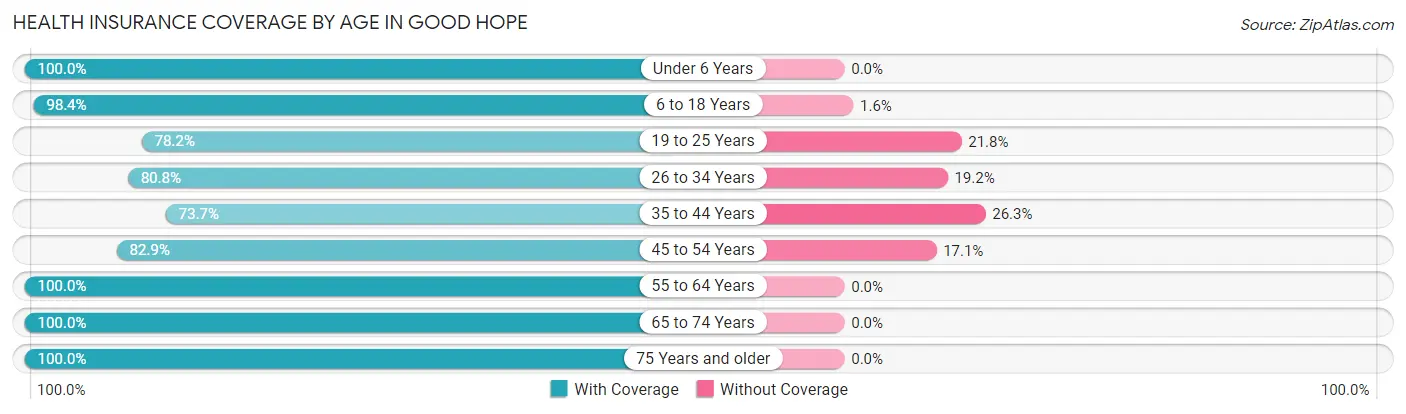
| Age Bracket | With Coverage | Without Coverage |
| Under 6 Years | 302 (100.0%) | 0 (0.0%) |
| 6 to 18 Years | 479 (98.4%) | 8 (1.6%) |
| 19 to 25 Years | 129 (78.2%) | 36 (21.8%) |
| 26 to 34 Years | 340 (80.8%) | 81 (19.2%) |
| 35 to 44 Years | 227 (73.7%) | 81 (26.3%) |
| 45 to 54 Years | 203 (82.9%) | 42 (17.1%) |
| 55 to 64 Years | 282 (100.0%) | 0 (0.0%) |
| 65 to 74 Years | 150 (100.0%) | 0 (0.0%) |
| 75 Years and older | 142 (100.0%) | 0 (0.0%) |
| Total | 2,254 (90.1%) | 248 (9.9%) |
Health Insurance Coverage by Citizenship Status in Good Hope
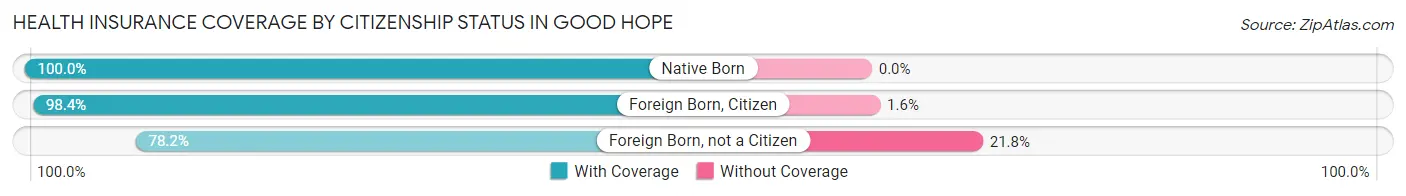
| Citizenship Status | With Coverage | Without Coverage |
| Native Born | 302 (100.0%) | 0 (0.0%) |
| Foreign Born, Citizen | 479 (98.4%) | 8 (1.6%) |
| Foreign Born, not a Citizen | 129 (78.2%) | 36 (21.8%) |
Health Insurance Coverage by Household Income in Good Hope
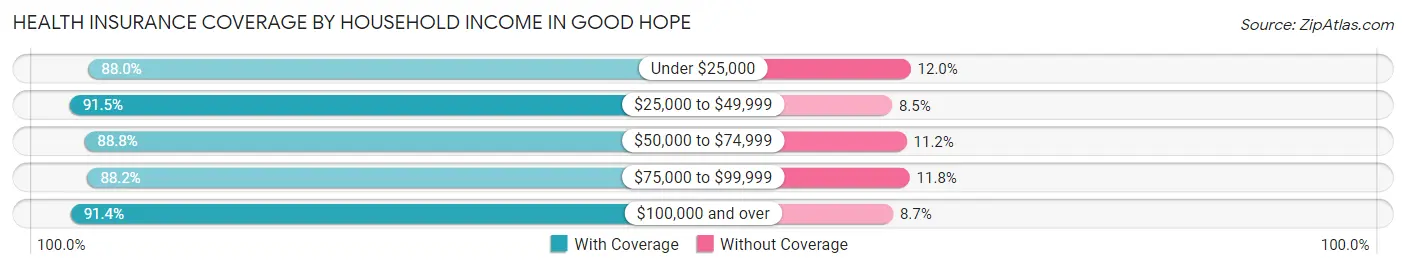
| Household Income | With Coverage | Without Coverage |
| Under $25,000 | 243 (88.0%) | 33 (12.0%) |
| $25,000 to $49,999 | 411 (91.5%) | 38 (8.5%) |
| $50,000 to $74,999 | 483 (88.8%) | 61 (11.2%) |
| $75,000 to $99,999 | 262 (88.2%) | 35 (11.8%) |
| $100,000 and over | 855 (91.3%) | 81 (8.6%) |
Public vs Private Health Insurance Coverage by Age in Good Hope
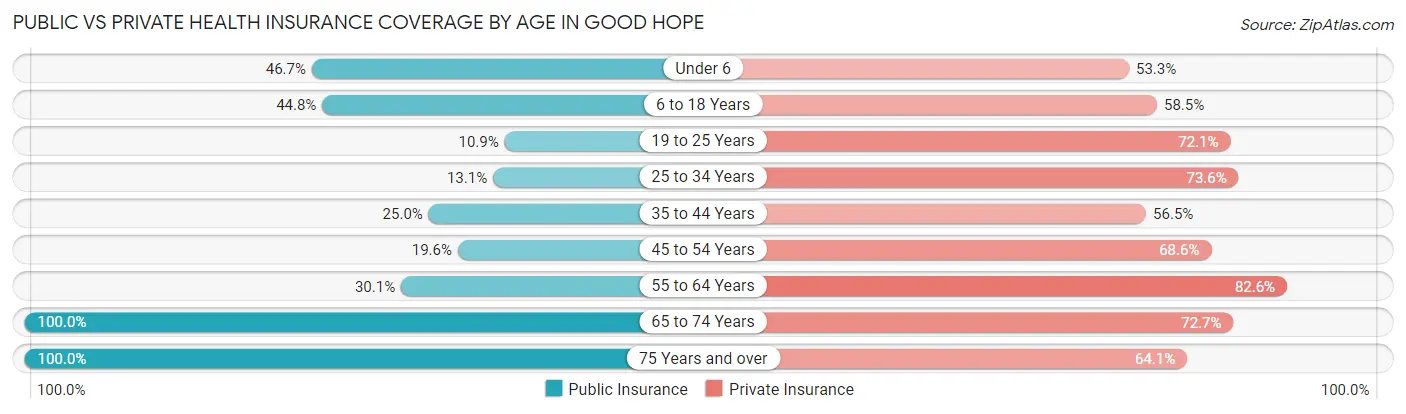
| Age Bracket | Public Insurance | Private Insurance |
| Under 6 | 141 (46.7%) | 161 (53.3%) |
| 6 to 18 Years | 218 (44.8%) | 285 (58.5%) |
| 19 to 25 Years | 18 (10.9%) | 119 (72.1%) |
| 25 to 34 Years | 55 (13.1%) | 310 (73.6%) |
| 35 to 44 Years | 77 (25.0%) | 174 (56.5%) |
| 45 to 54 Years | 48 (19.6%) | 168 (68.6%) |
| 55 to 64 Years | 85 (30.1%) | 233 (82.6%) |
| 65 to 74 Years | 150 (100.0%) | 109 (72.7%) |
| 75 Years and over | 142 (100.0%) | 91 (64.1%) |
| Total | 934 (37.3%) | 1,650 (65.9%) |
Disability Status by Sex by Age in Good Hope
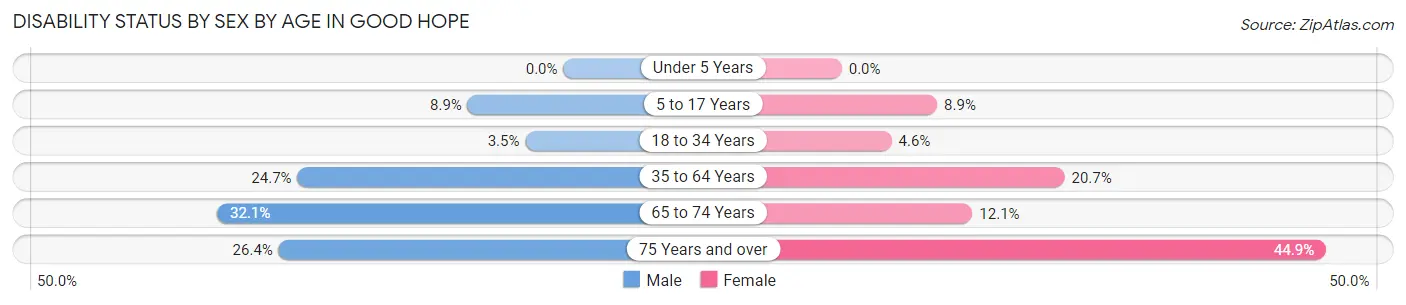
| Age Bracket | Male | Female |
| Under 5 Years | 0 (0.0%) | 0 (0.0%) |
| 5 to 17 Years | 27 (8.9%) | 17 (8.8%) |
| 18 to 34 Years | 10 (3.5%) | 14 (4.6%) |
| 35 to 64 Years | 95 (24.7%) | 93 (20.7%) |
| 65 to 74 Years | 27 (32.1%) | 8 (12.1%) |
| 75 Years and over | 14 (26.4%) | 40 (44.9%) |
Disability Class by Sex by Age in Good Hope
Disability Class: Hearing Difficulty
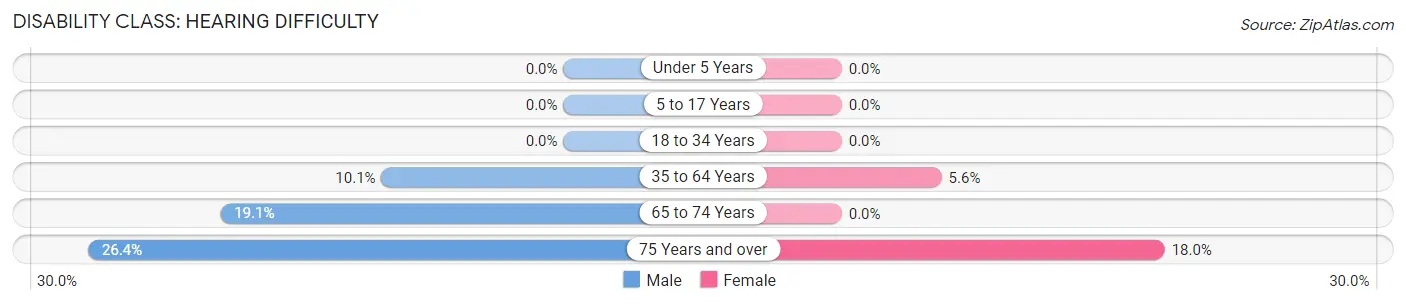
| Age Bracket | Male | Female |
| Under 5 Years | 0 (0.0%) | 0 (0.0%) |
| 5 to 17 Years | 0 (0.0%) | 0 (0.0%) |
| 18 to 34 Years | 0 (0.0%) | 0 (0.0%) |
| 35 to 64 Years | 39 (10.1%) | 25 (5.6%) |
| 65 to 74 Years | 16 (19.1%) | 0 (0.0%) |
| 75 Years and over | 14 (26.4%) | 16 (18.0%) |
Disability Class: Vision Difficulty
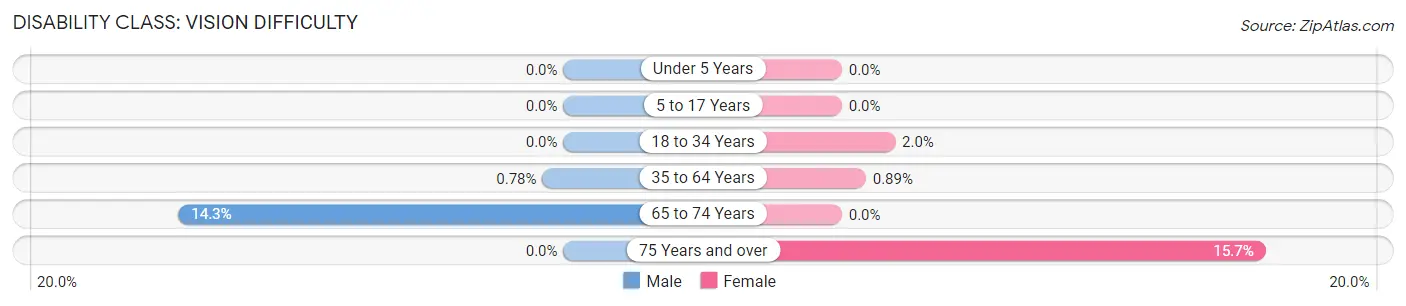
| Age Bracket | Male | Female |
| Under 5 Years | 0 (0.0%) | 0 (0.0%) |
| 5 to 17 Years | 0 (0.0%) | 0 (0.0%) |
| 18 to 34 Years | 0 (0.0%) | 6 (2.0%) |
| 35 to 64 Years | 3 (0.8%) | 4 (0.9%) |
| 65 to 74 Years | 12 (14.3%) | 0 (0.0%) |
| 75 Years and over | 0 (0.0%) | 14 (15.7%) |
Disability Class: Cognitive Difficulty
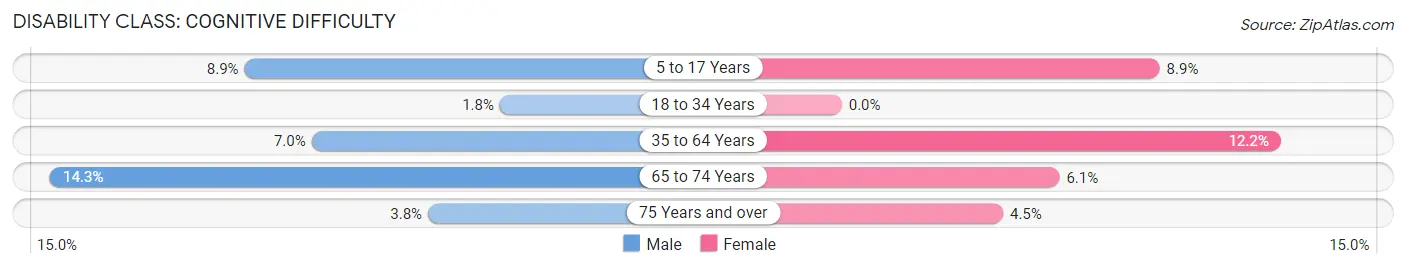
| Age Bracket | Male | Female |
| 5 to 17 Years | 27 (8.9%) | 17 (8.8%) |
| 18 to 34 Years | 5 (1.8%) | 0 (0.0%) |
| 35 to 64 Years | 27 (7.0%) | 55 (12.2%) |
| 65 to 74 Years | 12 (14.3%) | 4 (6.1%) |
| 75 Years and over | 2 (3.8%) | 4 (4.5%) |
Disability Class: Ambulatory Difficulty
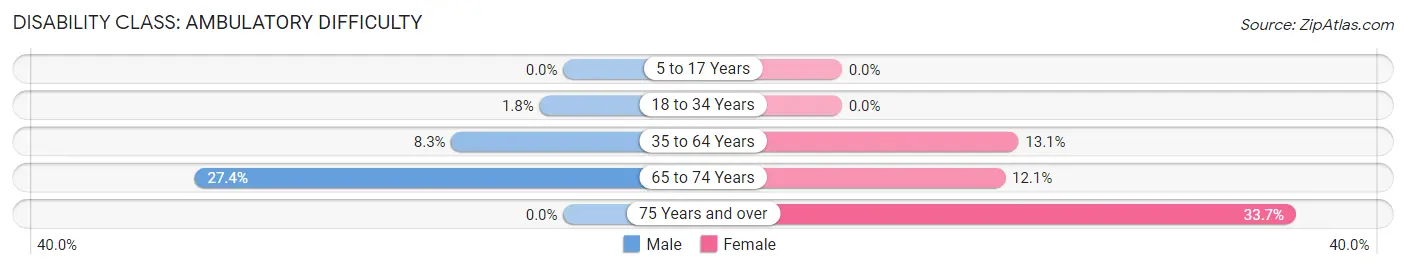
| Age Bracket | Male | Female |
| 5 to 17 Years | 0 (0.0%) | 0 (0.0%) |
| 18 to 34 Years | 5 (1.8%) | 0 (0.0%) |
| 35 to 64 Years | 32 (8.3%) | 59 (13.1%) |
| 65 to 74 Years | 23 (27.4%) | 8 (12.1%) |
| 75 Years and over | 0 (0.0%) | 30 (33.7%) |
Disability Class: Self-Care Difficulty
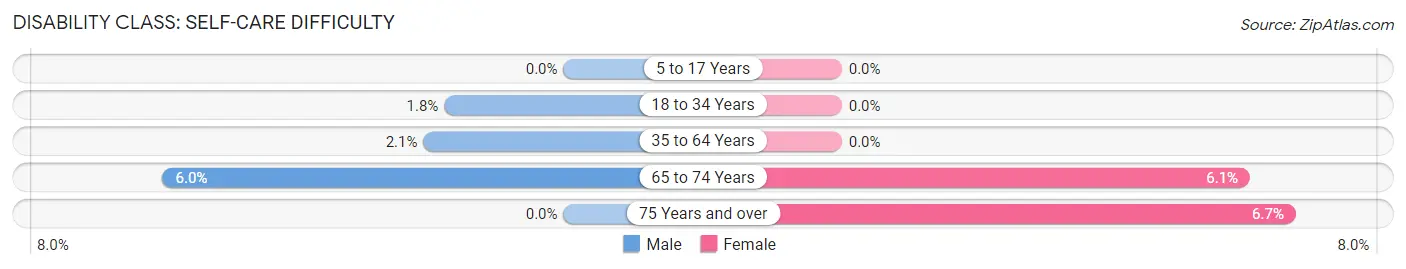
| Age Bracket | Male | Female |
| 5 to 17 Years | 0 (0.0%) | 0 (0.0%) |
| 18 to 34 Years | 5 (1.8%) | 0 (0.0%) |
| 35 to 64 Years | 8 (2.1%) | 0 (0.0%) |
| 65 to 74 Years | 5 (5.9%) | 4 (6.1%) |
| 75 Years and over | 0 (0.0%) | 6 (6.7%) |
Technology Access in Good Hope
Computing Device Access in Good Hope
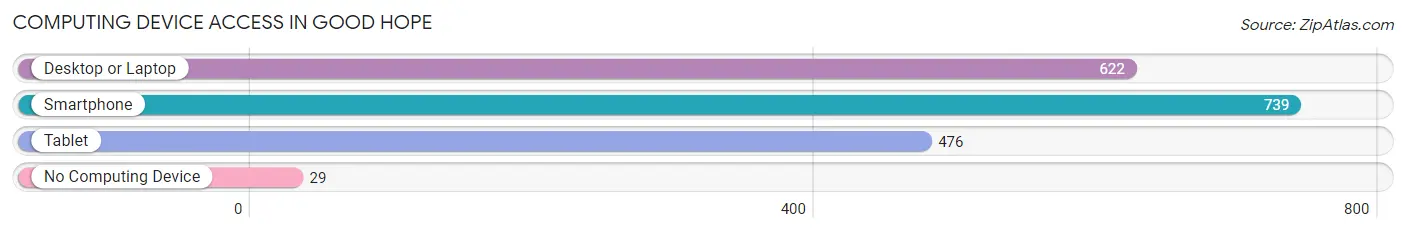
| Device Type | # Households | % Households |
| Desktop or Laptop | 622 | 77.4% |
| Smartphone | 739 | 91.9% |
| Tablet | 476 | 59.2% |
| No Computing Device | 29 | 3.6% |
| Total | 804 | 100.0% |
Internet Access in Good Hope
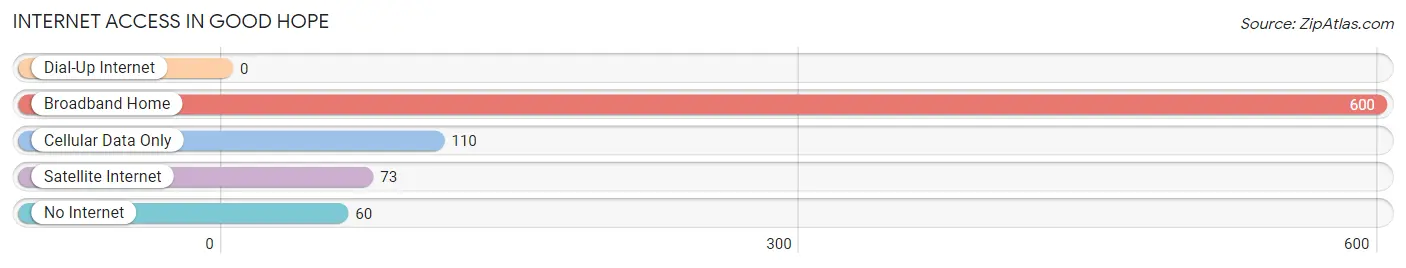
| Internet Type | # Households | % Households |
| Dial-Up Internet | 0 | 0.0% |
| Broadband Home | 600 | 74.6% |
| Cellular Data Only | 110 | 13.7% |
| Satellite Internet | 73 | 9.1% |
| No Internet | 60 | 7.5% |
| Total | 804 | 100.0% |
Good Hope Summary
Good Hope is a small town located in the northwest corner of Alabama, in the county of Cullman. It is situated on the banks of the Mulberry Fork of the Black Warrior River, and is part of the Birmingham-Hoover Metropolitan Statistical Area. The town has a population of 1,845 people, according to the 2010 census.
History
Good Hope was founded in 1818 by a group of settlers from North Carolina. The town was originally known as Mulberry, but was later renamed Good Hope in 1836. The name was chosen to reflect the optimism of the settlers, who were hoping for a better life in the new settlement.
The town was incorporated in 1891, and the first mayor was elected in 1892. The town grew steadily throughout the 19th century, and by the early 20th century, it had become a thriving agricultural center. The town was also home to several businesses, including a cotton gin, a grist mill, and a sawmill.
Geography
Good Hope is located in the northwest corner of Alabama, in the county of Cullman. It is situated on the banks of the Mulberry Fork of the Black Warrior River, and is part of the Birmingham-Hoover Metropolitan Statistical Area. The town has a total area of 2.2 square miles, all of which is land.
The town is located in a hilly region, with the highest point being the summit of Good Hope Mountain, which is located just south of the town. The town is also located near the Sipsey Wilderness, a 25,000-acre area of protected land.
Economy
Good Hope’s economy is largely based on agriculture. The town is home to several farms, which produce a variety of crops, including corn, soybeans, cotton, and hay. The town is also home to several businesses, including a lumber mill, a feed store, and a hardware store.
Demographics
According to the 2010 census, Good Hope has a population of 1,845 people. The racial makeup of the town is 97.3% White, 0.7% African American, 0.3% Native American, 0.2% Asian, 0.1% Pacific Islander, 0.7% from other races, and 0.9% from two or more races.
The median household income in Good Hope is $37,917, and the median family income is $45,938. The per capita income in the town is $18,945. The town has a poverty rate of 17.3%, and the unemployment rate is 6.2%.
Conclusion
Good Hope is a small town located in the northwest corner of Alabama, in the county of Cullman. It is situated on the banks of the Mulberry Fork of the Black Warrior River, and is part of the Birmingham-Hoover Metropolitan Statistical Area. The town has a population of 1,845 people, according to the 2010 census. The town’s economy is largely based on agriculture, and it is home to several businesses. The town has a median household income of $37,917, and a poverty rate of 17.3%.
Common Questions
What is the Total Population of Good Hope?
Total Population of Good Hope is 2,502.
What is the Total Male Population of Good Hope?
Total Male Population of Good Hope is 1,220.
What is the Total Female Population of Good Hope?
Total Female Population of Good Hope is 1,282.
What is the Ratio of Males per 100 Females in Good Hope?
There are 95.16 Males per 100 Females in Good Hope.
What is the Ratio of Females per 100 Males in Good Hope?
There are 105.08 Females per 100 Males in Good Hope.
What is the Median Population Age in Good Hope?
Median Population Age in Good Hope is 33.3 Years.
What is the Average Family Size in Good Hope
Average Family Size in Good Hope is 3.5 People.
What is the Average Household Size in Good Hope
Average Household Size in Good Hope is 3.1 People.
What is Per Capita Income in Good Hope?
Per Capita income in Good Hope is $33,098.
What is the Median Family Income in Good Hope?
Median Family Income in Good Hope is $90,764.
What is the Median Household income in Good Hope?
Median Household Income in Good Hope is $68,500.
What is Income or Wage Gap in Good Hope?
Income or Wage Gap in Good Hope is 35.7%.
Women in Good Hope earn 64.3 cents for every dollar earned by a man.
What is Inequality or Gini Index in Good Hope?
Inequality or Gini Index in Good Hope is 0.45.
How Large is the Labor Force in Good Hope?
There are 1,174 People in the Labor Forcein in Good Hope.
What is the Percentage of People in the Labor Force in Good Hope?
64.8% of People are in the Labor Force in Good Hope.
What is the Unemployment Rate in Good Hope?
Unemployment Rate in Good Hope is 3.1%.