Reform, AL
Reform Map
Reform Overview
1,913
TOTAL POPULATION
891
MALE POPULATION
1,022
FEMALE POPULATION
87.18
MALES / 100 FEMALES
114.70
FEMALES / 100 MALES
34.5
MEDIAN AGE
3.4
AVG FAMILY SIZE
2.5
AVG HOUSEHOLD SIZE
$20,810
PER CAPITA INCOME
$46,875
AVG FAMILY INCOME
$32,375
AVG HOUSEHOLD INCOME
20.1%
WAGE / INCOME GAP [ % ]
79.9¢/ $1
WAGE / INCOME GAP [ $ ]
0.52
INEQUALITY / GINI INDEX
762
LABOR FORCE [ PEOPLE ]
50.9%
PERCENT IN LABOR FORCE
3.5%
UNEMPLOYMENT RATE
Reform Zip Codes
Reform Area Codes
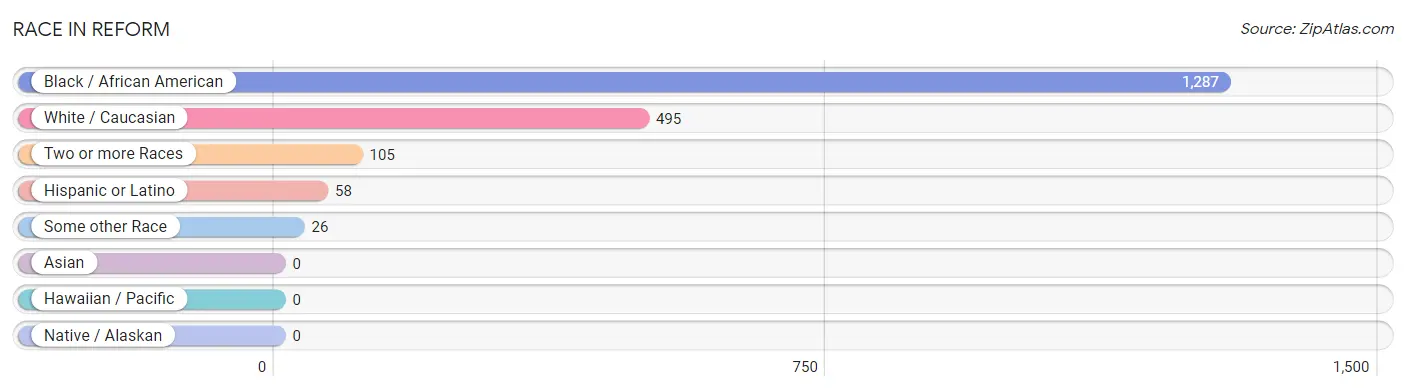
Race in Reform
The most populous races in Reform are Black / African American (1,287 | 67.3%), White / Caucasian (495 | 25.9%), and Two or more Races (105 | 5.5%).
| Race | # Population | % Population |
| Asian | 0 | 0.0% |
| Black / African American | 1,287 | 67.3% |
| Hawaiian / Pacific | 0 | 0.0% |
| Hispanic or Latino | 58 | 3.0% |
| Native / Alaskan | 0 | 0.0% |
| White / Caucasian | 495 | 25.9% |
| Two or more Races | 105 | 5.5% |
| Some other Race | 26 | 1.4% |
| Total | 1,913 | 100.0% |
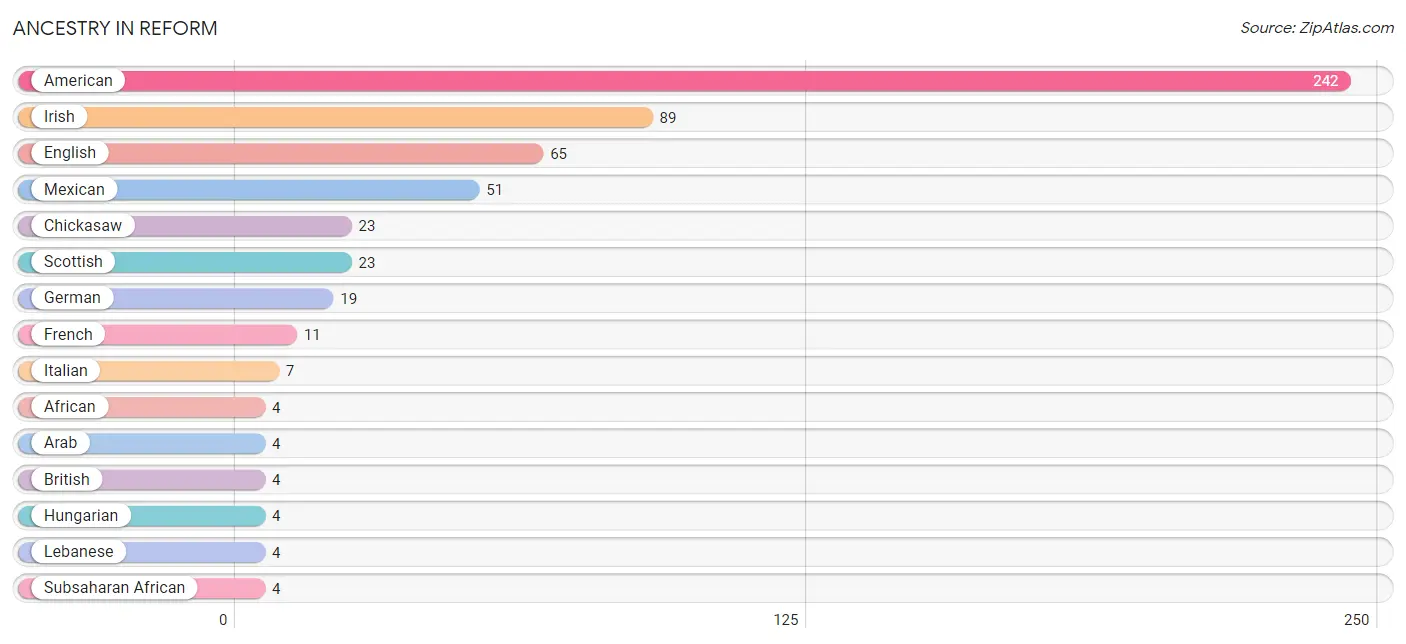
Ancestry in Reform
The most populous ancestries reported in Reform are American (242 | 12.7%), Irish (89 | 4.6%), English (65 | 3.4%), Mexican (51 | 2.7%), and Chickasaw (23 | 1.2%), together accounting for 24.6% of all Reform residents.
| Ancestry | # Population | % Population |
| African | 4 | 0.2% |
| American | 242 | 12.7% |
| Arab | 4 | 0.2% |
| British | 4 | 0.2% |
| Chickasaw | 23 | 1.2% |
| English | 65 | 3.4% |
| French | 11 | 0.6% |
| German | 19 | 1.0% |
| Hungarian | 4 | 0.2% |
| Irish | 89 | 4.6% |
| Italian | 7 | 0.4% |
| Lebanese | 4 | 0.2% |
| Mexican | 51 | 2.7% |
| Russian | 3 | 0.2% |
| Scottish | 23 | 1.2% |
| Subsaharan African | 4 | 0.2% | View All 16 Rows |
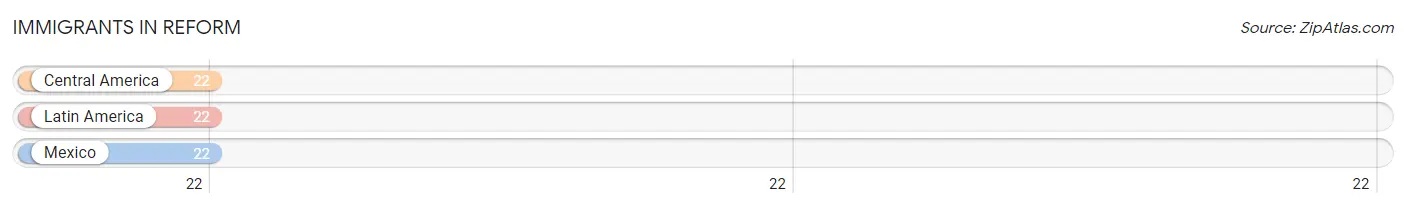
Immigrants in Reform
The most numerous immigrant groups reported in Reform came from Central America (22 | 1.1%), Latin America (22 | 1.1%), and Mexico (22 | 1.1%), together accounting for 3.5% of all Reform residents.
| Immigration Origin | # Population | % Population |
| Central America | 22 | 1.1% |
| Latin America | 22 | 1.1% |
| Mexico | 22 | 1.1% | View All 3 Rows |
Sex and Age in Reform
Sex and Age in Reform
The most populous age groups in Reform are 30 to 34 Years (108 | 12.1%) for men and 15 to 19 Years (116 | 11.4%) for women.
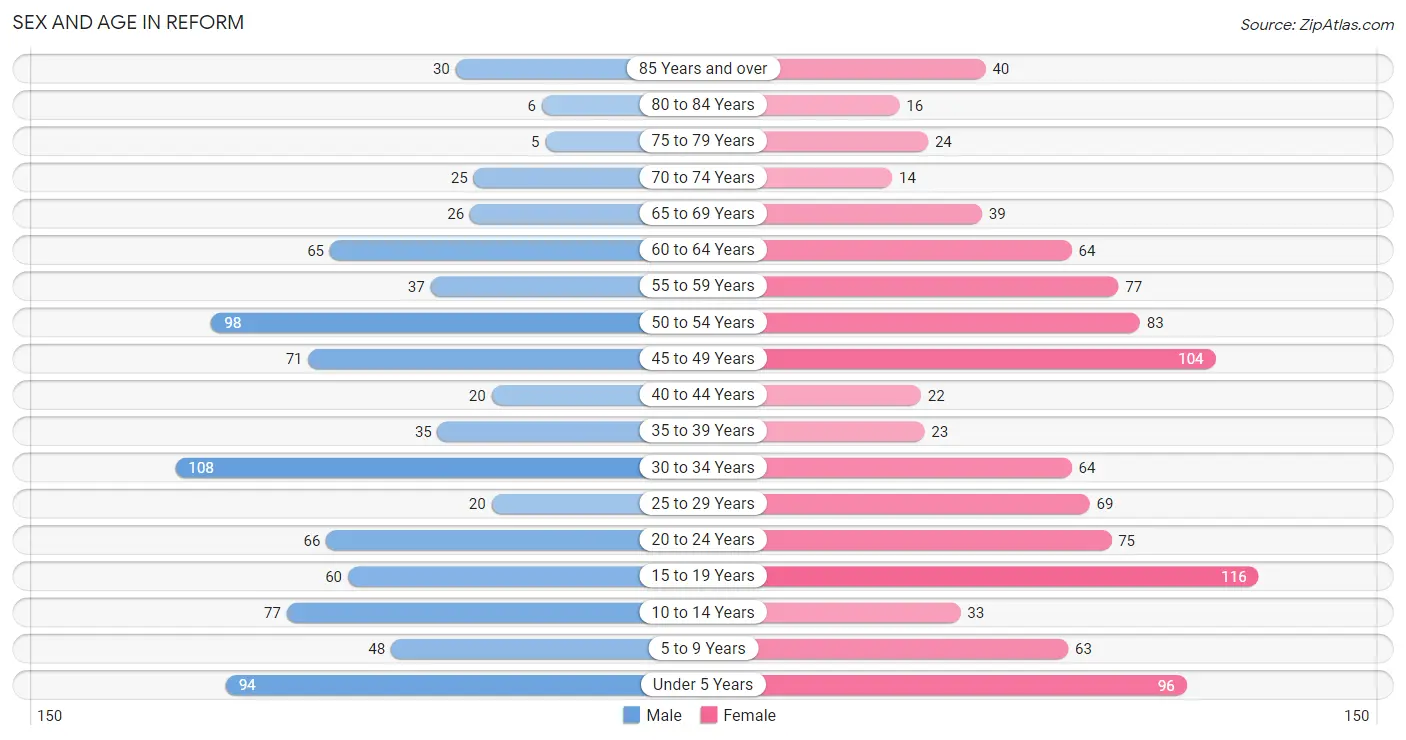
| Age Bracket | Male | Female |
| Under 5 Years | 94 (10.5%) | 96 (9.4%) |
| 5 to 9 Years | 48 (5.4%) | 63 (6.2%) |
| 10 to 14 Years | 77 (8.6%) | 33 (3.2%) |
| 15 to 19 Years | 60 (6.7%) | 116 (11.4%) |
| 20 to 24 Years | 66 (7.4%) | 75 (7.3%) |
| 25 to 29 Years | 20 (2.2%) | 69 (6.8%) |
| 30 to 34 Years | 108 (12.1%) | 64 (6.3%) |
| 35 to 39 Years | 35 (3.9%) | 23 (2.2%) |
| 40 to 44 Years | 20 (2.2%) | 22 (2.1%) |
| 45 to 49 Years | 71 (8.0%) | 104 (10.2%) |
| 50 to 54 Years | 98 (11.0%) | 83 (8.1%) |
| 55 to 59 Years | 37 (4.2%) | 77 (7.5%) |
| 60 to 64 Years | 65 (7.3%) | 64 (6.3%) |
| 65 to 69 Years | 26 (2.9%) | 39 (3.8%) |
| 70 to 74 Years | 25 (2.8%) | 14 (1.4%) |
| 75 to 79 Years | 5 (0.6%) | 24 (2.4%) |
| 80 to 84 Years | 6 (0.7%) | 16 (1.6%) |
| 85 Years and over | 30 (3.4%) | 40 (3.9%) |
| Total | 891 (100.0%) | 1,022 (100.0%) |
Families and Households in Reform
Median Family Size in Reform
The median family size in Reform is 3.42 persons per family, with single female/mother families (231 | 52.9%) accounting for the largest median family size of 3.75 persons per family. On the other hand, married-couple families (195 | 44.6%) represent the smallest median family size with 3.05 persons per family.
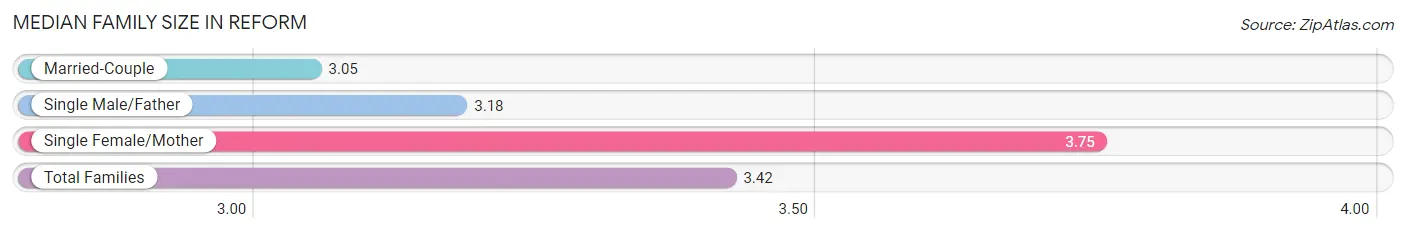
| Family Type | # Families | Family Size |
| Married-Couple | 195 (44.6%) | 3.05 |
| Single Male/Father | 11 (2.5%) | 3.18 |
| Single Female/Mother | 231 (52.9%) | 3.75 |
| Total Families | 437 (100.0%) | 3.42 |
Median Household Size in Reform
The median household size in Reform is 2.54 persons per household, with single female/mother households (231 | 31.5%) accounting for the largest median household size of 3.89 persons per household. non-family households (297 | 40.5%) represent the smallest median household size with 1.13 persons per household.
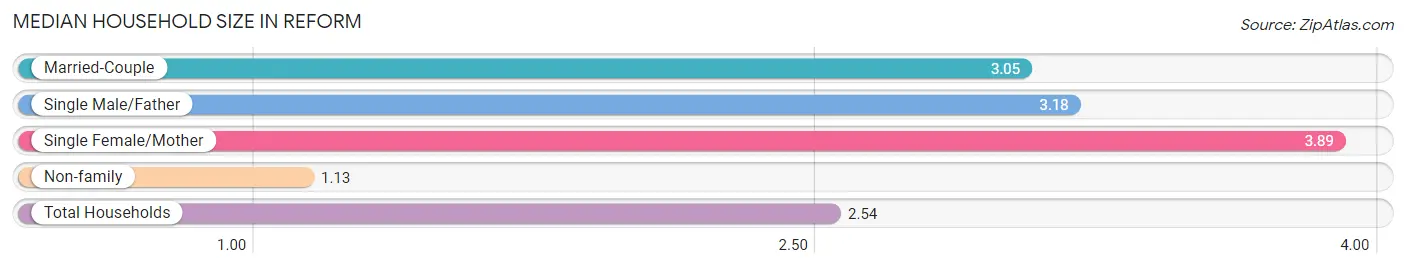
| Household Type | # Households | Household Size |
| Married-Couple | 195 (26.6%) | 3.05 |
| Single Male/Father | 11 (1.5%) | 3.18 |
| Single Female/Mother | 231 (31.5%) | 3.89 |
| Non-family | 297 (40.5%) | 1.13 |
| Total Households | 734 (100.0%) | 2.54 |
Household Size by Marriage Status in Reform
Out of a total of 734 households in Reform, 437 (59.5%) are family households, while 297 (40.5%) are nonfamily households. The most numerous type of family households are 2-person households, comprising 163, and the most common type of nonfamily households are 1-person households, comprising 265.
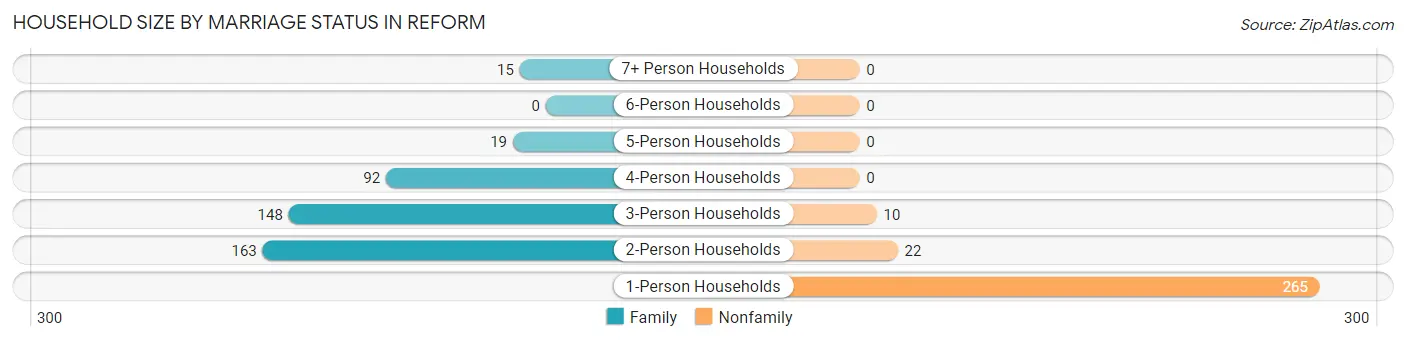
| Household Size | Family Households | Nonfamily Households |
| 1-Person Households | - | 265 (36.1%) |
| 2-Person Households | 163 (22.2%) | 22 (3.0%) |
| 3-Person Households | 148 (20.2%) | 10 (1.4%) |
| 4-Person Households | 92 (12.5%) | 0 (0.0%) |
| 5-Person Households | 19 (2.6%) | 0 (0.0%) |
| 6-Person Households | 0 (0.0%) | 0 (0.0%) |
| 7+ Person Households | 15 (2.0%) | 0 (0.0%) |
| Total | 437 (59.5%) | 297 (40.5%) |
Female Fertility in Reform
Fertility by Age in Reform
Average fertility rate in Reform is 68.0 births per 1,000 women. Women in the age bracket of 15 to 19 years have the highest fertility rate with 103.0 births per 1,000 women. Women in the age bracket of 20 to 34 years acount for 58.8% of all women with births.
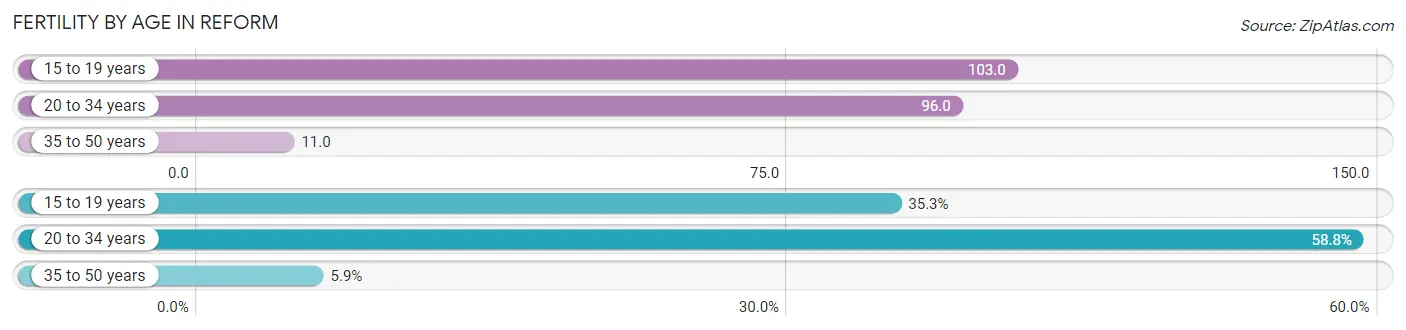
| Age Bracket | Women with Births | Births / 1,000 Women |
| 15 to 19 years | 12 (35.3%) | 103.0 |
| 20 to 34 years | 20 (58.8%) | 96.0 |
| 35 to 50 years | 2 (5.9%) | 11.0 |
| Total | 34 (100.0%) | 68.0 |
Fertility by Age by Marriage Status in Reform
58.8% of women with births (34) in Reform are married. The highest percentage of unmarried women with births falls into 15 to 19 years age bracket with 100.0% of them unmarried at the time of birth, while the lowest percentage of unmarried women with births belong to 20 to 34 years age bracket with 0.0% of them unmarried.
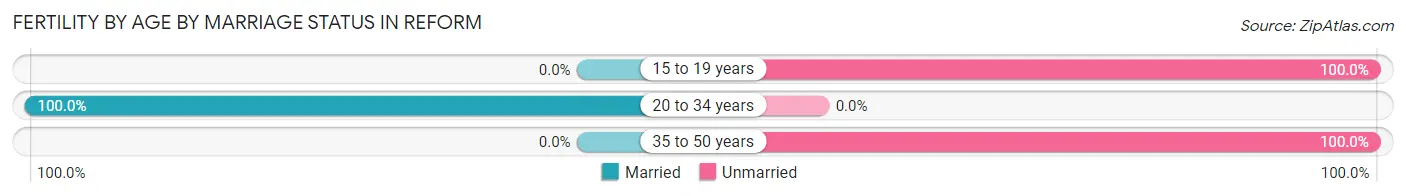
| Age Bracket | Married | Unmarried |
| 15 to 19 years | 0 (0.0%) | 12 (100.0%) |
| 20 to 34 years | 20 (100.0%) | 0 (0.0%) |
| 35 to 50 years | 0 (0.0%) | 2 (100.0%) |
| Total | 20 (58.8%) | 14 (41.2%) |
Fertility by Education in Reform
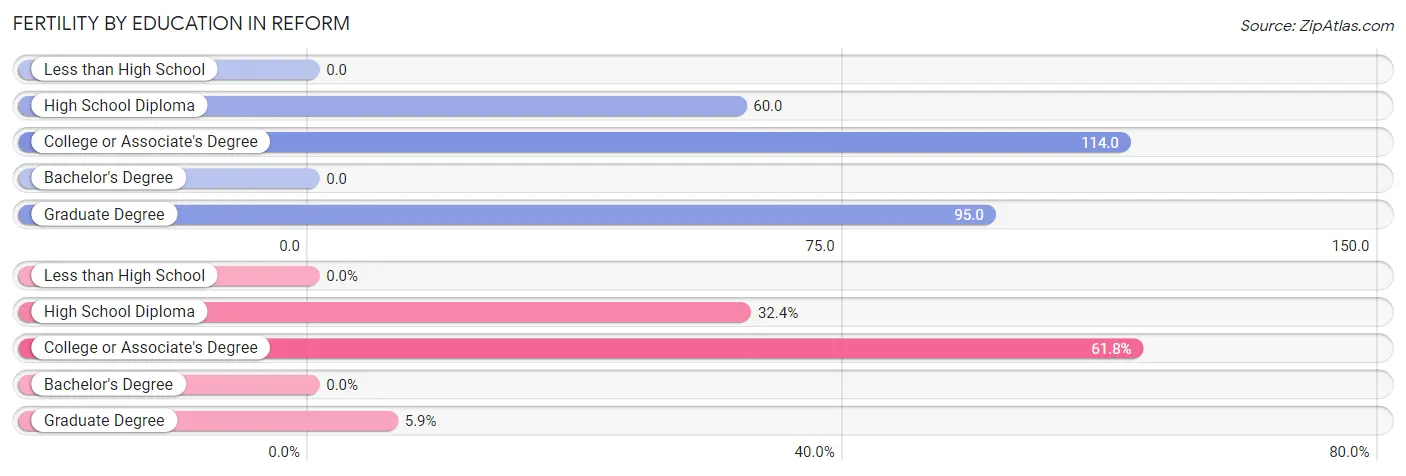
| Educational Attainment | Women with Births | Births / 1,000 Women |
| Less than High School | 0 (0.0%) | 0.0 |
| High School Diploma | 11 (32.4%) | 60.0 |
| College or Associate's Degree | 21 (61.8%) | 114.0 |
| Bachelor's Degree | 0 (0.0%) | 0.0 |
| Graduate Degree | 2 (5.9%) | 95.0 |
| Total | 34 (100.0%) | 68.0 |
Fertility by Education by Marriage Status in Reform
41.2% of women with births in Reform are unmarried. Women with the educational attainment of high school diploma are most likely to be married with 100.0% of them married at childbirth, while women with the educational attainment of graduate degree are least likely to be married with 100.0% of them unmarried at childbirth.
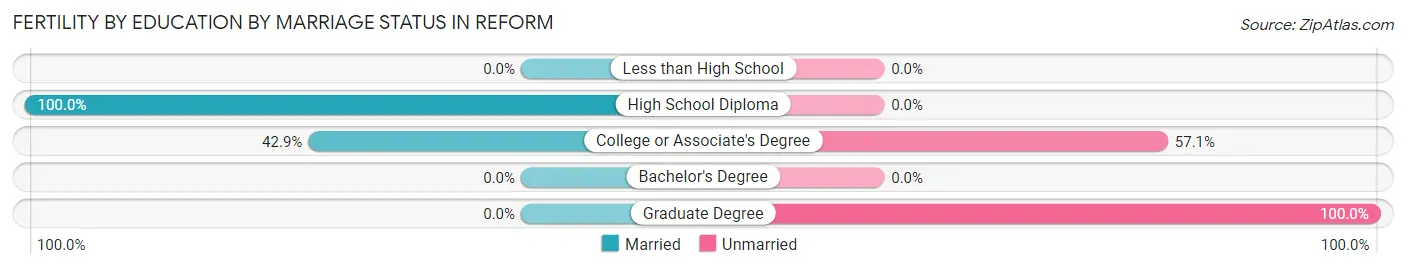
| Educational Attainment | Married | Unmarried |
| Less than High School | 0 (0.0%) | 0 (0.0%) |
| High School Diploma | 11 (100.0%) | 0 (0.0%) |
| College or Associate's Degree | 9 (42.9%) | 12 (57.1%) |
| Bachelor's Degree | 0 (0.0%) | 0 (0.0%) |
| Graduate Degree | 0 (0.0%) | 2 (100.0%) |
| Total | 20 (58.8%) | 14 (41.2%) |
Income in Reform
Income Overview in Reform
Per Capita Income in Reform is $20,810, while median incomes of families and households are $46,875 and $32,375 respectively.
| Characteristic | Number | Measure |
| Per Capita Income | 1,913 | $20,810 |
| Median Family Income | 437 | $46,875 |
| Mean Family Income | 437 | $65,295 |
| Median Household Income | 734 | $32,375 |
| Mean Household Income | 734 | $50,625 |
| Income Deficit | 437 | $0 |
| Wage / Income Gap (%) | 1,913 | 20.13% |
| Wage / Income Gap ($) | 1,913 | 79.87¢ per $1 |
| Gini / Inequality Index | 1,913 | 0.52 |
Earnings by Sex in Reform
Average Earnings in Reform are $38,600, $40,333 for men and $32,212 for women, a difference of 20.1%.
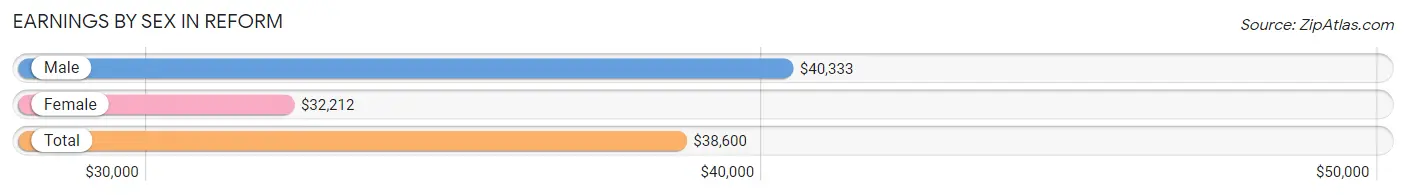
| Sex | Number | Average Earnings |
| Male | 392 (51.4%) | $40,333 |
| Female | 370 (48.6%) | $32,212 |
| Total | 762 (100.0%) | $38,600 |
Earnings by Sex by Income Bracket in Reform
The most common earnings brackets in Reform are $35,000 to $39,999 for men (77 | 19.6%) and $35,000 to $39,999 for women (44 | 11.9%).
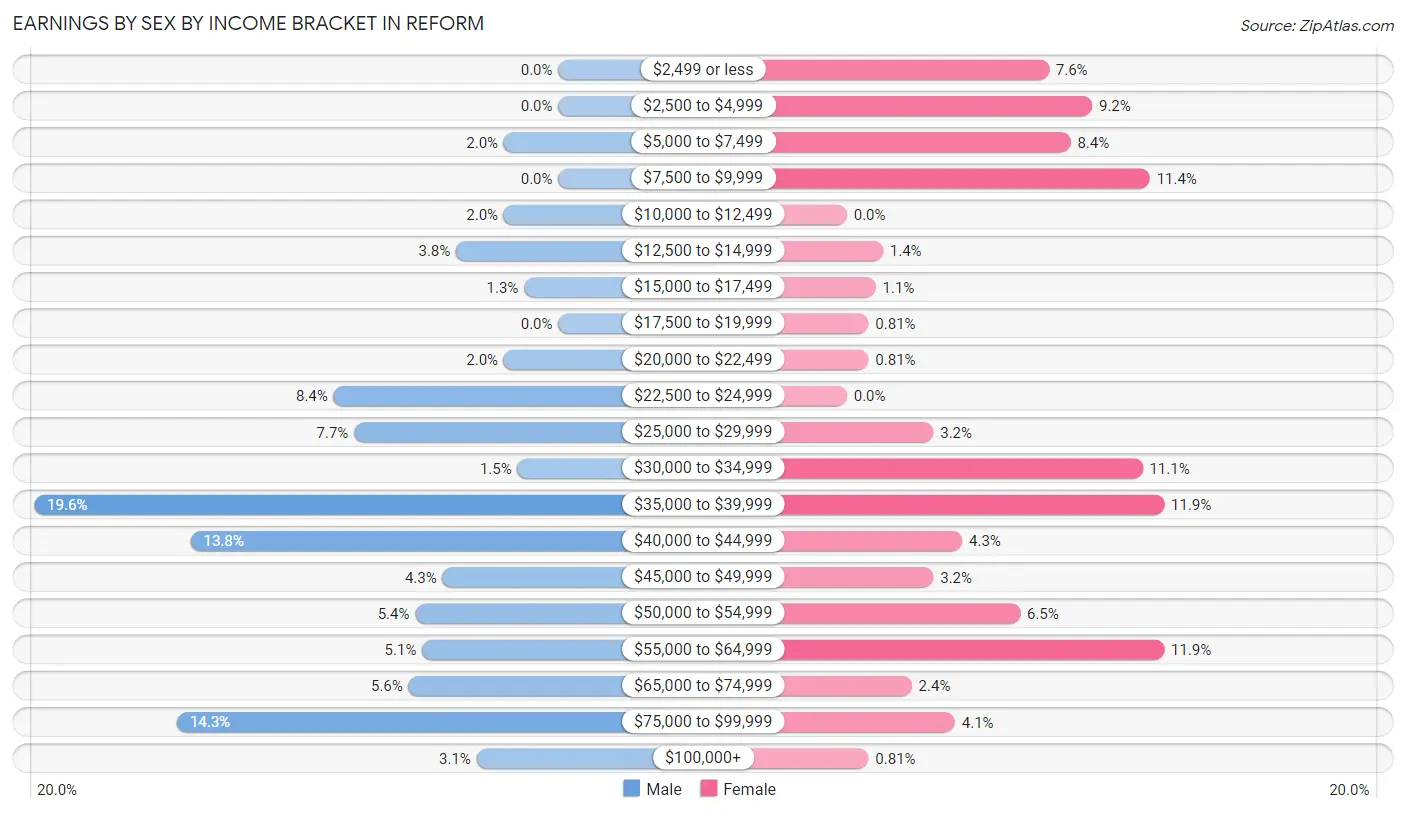
| Income | Male | Female |
| $2,499 or less | 0 (0.0%) | 28 (7.6%) |
| $2,500 to $4,999 | 0 (0.0%) | 34 (9.2%) |
| $5,000 to $7,499 | 8 (2.0%) | 31 (8.4%) |
| $7,500 to $9,999 | 0 (0.0%) | 42 (11.4%) |
| $10,000 to $12,499 | 8 (2.0%) | 0 (0.0%) |
| $12,500 to $14,999 | 15 (3.8%) | 5 (1.3%) |
| $15,000 to $17,499 | 5 (1.3%) | 4 (1.1%) |
| $17,500 to $19,999 | 0 (0.0%) | 3 (0.8%) |
| $20,000 to $22,499 | 8 (2.0%) | 3 (0.8%) |
| $22,500 to $24,999 | 33 (8.4%) | 0 (0.0%) |
| $25,000 to $29,999 | 30 (7.6%) | 12 (3.2%) |
| $30,000 to $34,999 | 6 (1.5%) | 41 (11.1%) |
| $35,000 to $39,999 | 77 (19.6%) | 44 (11.9%) |
| $40,000 to $44,999 | 54 (13.8%) | 16 (4.3%) |
| $45,000 to $49,999 | 17 (4.3%) | 12 (3.2%) |
| $50,000 to $54,999 | 21 (5.4%) | 24 (6.5%) |
| $55,000 to $64,999 | 20 (5.1%) | 44 (11.9%) |
| $65,000 to $74,999 | 22 (5.6%) | 9 (2.4%) |
| $75,000 to $99,999 | 56 (14.3%) | 15 (4.1%) |
| $100,000+ | 12 (3.1%) | 3 (0.8%) |
| Total | 392 (100.0%) | 370 (100.0%) |
Earnings by Sex by Educational Attainment in Reform
Average earnings in Reform are $42,444 for men and $37,609 for women, a difference of 11.4%. Men with an educational attainment of college or associate's degree enjoy the highest average annual earnings of $66,389, while those with graduate degree education earn the least with $14,464. Women with an educational attainment of graduate degree earn the most with the average annual earnings of $57,500, while those with college or associate's degree education have the smallest earnings of $33,417.
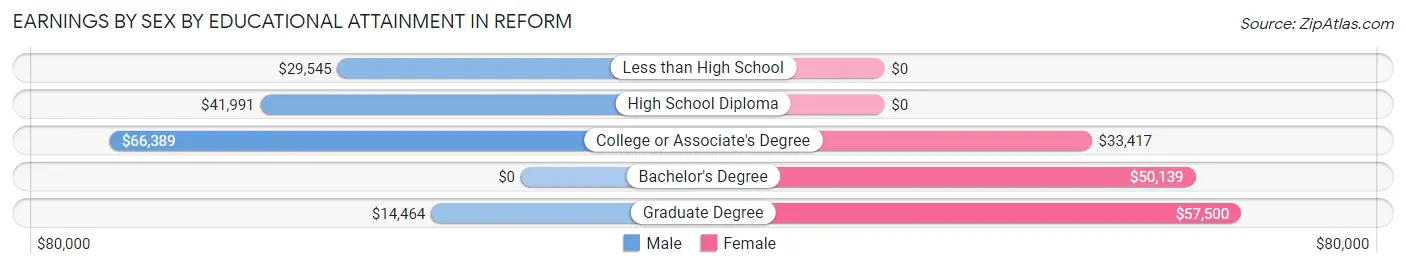
| Educational Attainment | Male Income | Female Income |
| Less than High School | $29,545 | $0 |
| High School Diploma | $41,991 | $0 |
| College or Associate's Degree | $66,389 | $33,417 |
| Bachelor's Degree | - | - |
| Graduate Degree | $14,464 | $57,500 |
| Total | $42,444 | $37,609 |
Family Income in Reform
Family Income Brackets in Reform
According to the Reform family income data, there are 92 families falling into the $100,000 to $149,999 income range, which is the most common income bracket and makes up 21.0% of all families. Conversely, the $25,000 to $34,999 income bracket is the least frequent group with only 11 families (2.5%) belonging to this category.
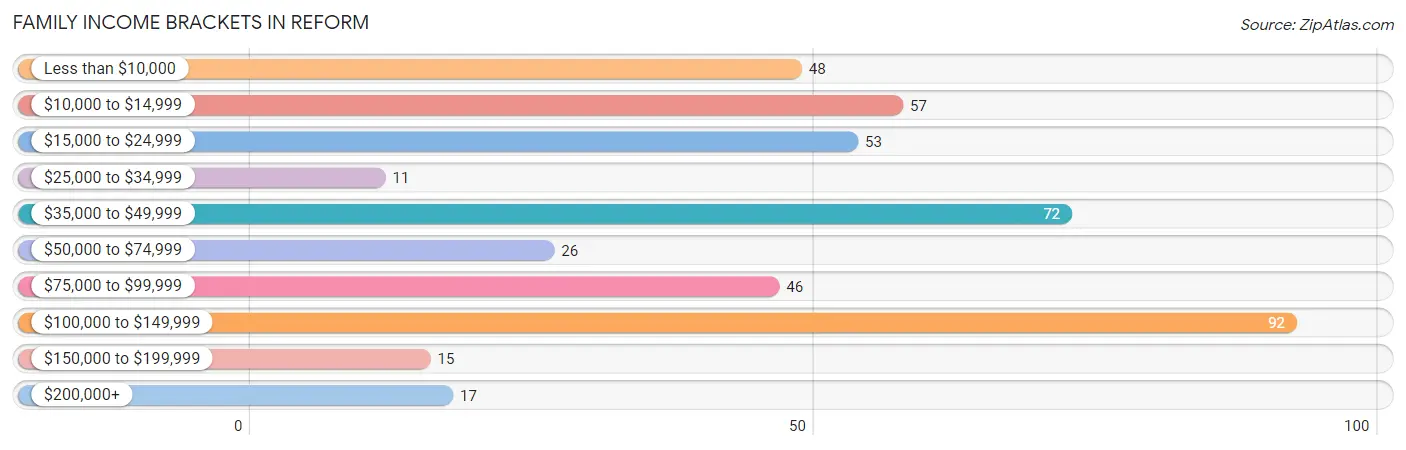
| Income Bracket | # Families | % Families |
| Less than $10,000 | 48 | 11.0% |
| $10,000 to $14,999 | 57 | 13.0% |
| $15,000 to $24,999 | 53 | 12.1% |
| $25,000 to $34,999 | 11 | 2.5% |
| $35,000 to $49,999 | 72 | 16.5% |
| $50,000 to $74,999 | 26 | 5.9% |
| $75,000 to $99,999 | 46 | 10.5% |
| $100,000 to $149,999 | 92 | 21.1% |
| $150,000 to $199,999 | 15 | 3.4% |
| $200,000+ | 17 | 3.9% |
Family Income by Famaliy Size in Reform
4-person families (89 | 20.4%) account for the highest median family income in Reform with $108,542 per family, while 4-person families (89 | 20.4%) have the highest median income of $27,136 per family member.
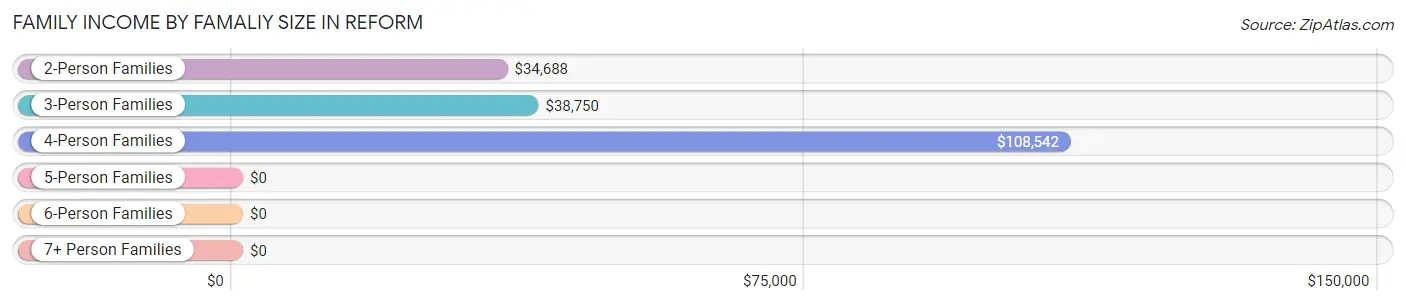
| Income Bracket | # Families | Median Income |
| 2-Person Families | 171 (39.1%) | $34,688 |
| 3-Person Families | 143 (32.7%) | $38,750 |
| 4-Person Families | 89 (20.4%) | $108,542 |
| 5-Person Families | 21 (4.8%) | $0 |
| 6-Person Families | 0 (0.0%) | $0 |
| 7+ Person Families | 13 (3.0%) | $0 |
| Total | 437 (100.0%) | $46,875 |
Family Income by Number of Earners in Reform
The median family income in Reform is $46,875, with families comprising 3+ earners (60) having the highest median family income of $128,000, while families with no earners (134) have the lowest median family income of $15,758, accounting for 13.7% and 30.7% of families, respectively.
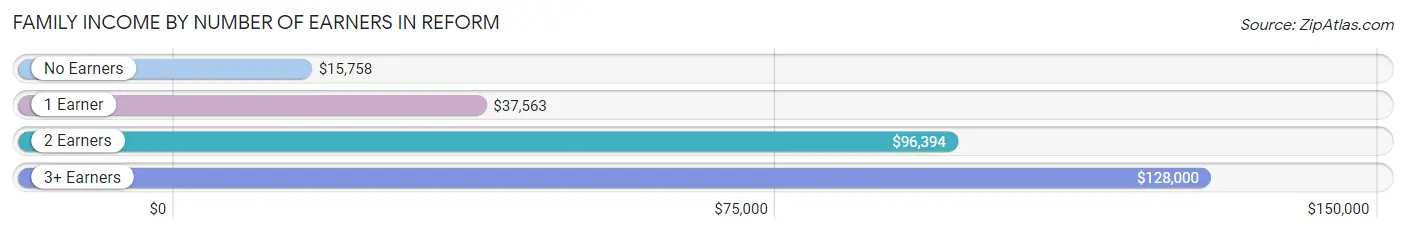
| Number of Earners | # Families | Median Income |
| No Earners | 134 (30.7%) | $15,758 |
| 1 Earner | 124 (28.4%) | $37,563 |
| 2 Earners | 119 (27.2%) | $96,394 |
| 3+ Earners | 60 (13.7%) | $128,000 |
| Total | 437 (100.0%) | $46,875 |
Household Income in Reform
Household Income Brackets in Reform
With 149 households falling in the category, the $10,000 to $14,999 income range is the most frequent in Reform, accounting for 20.3% of all households. In contrast, only 15 households (2.0%) fall into the $150,000 to $199,999 income bracket, making it the least populous group.
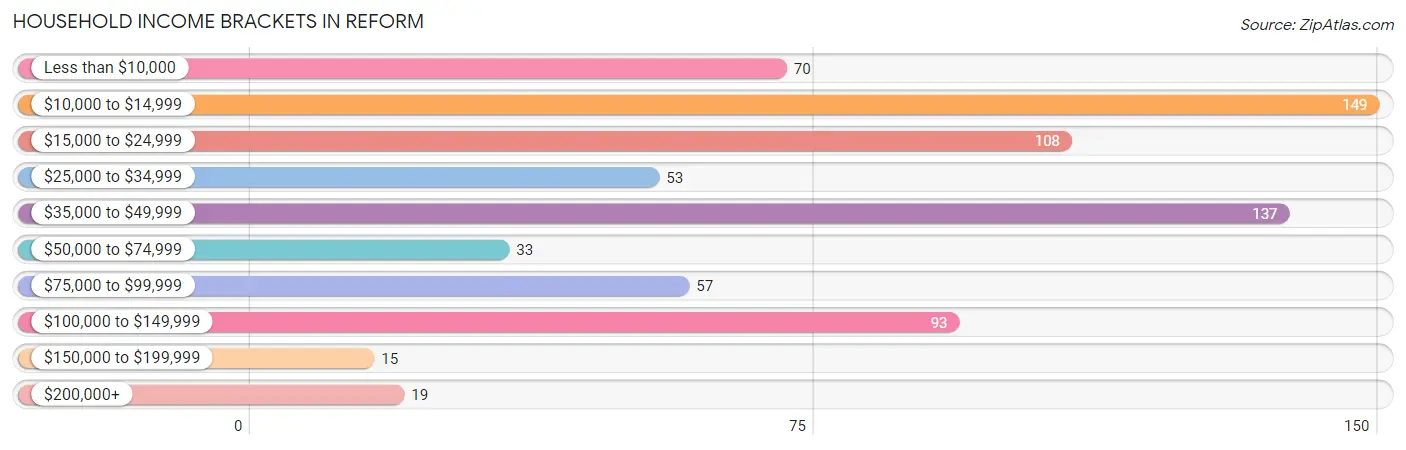
| Income Bracket | # Households | % Households |
| Less than $10,000 | 70 | 9.5% |
| $10,000 to $14,999 | 149 | 20.3% |
| $15,000 to $24,999 | 108 | 14.7% |
| $25,000 to $34,999 | 53 | 7.2% |
| $35,000 to $49,999 | 137 | 18.7% |
| $50,000 to $74,999 | 33 | 4.5% |
| $75,000 to $99,999 | 57 | 7.8% |
| $100,000 to $149,999 | 93 | 12.7% |
| $150,000 to $199,999 | 15 | 2.0% |
| $200,000+ | 19 | 2.6% |
Household Income by Householder Age in Reform
The median household income in Reform is $32,375, with the highest median household income of $40,179 found in the 65+ years age bracket for the primary householder. A total of 159 households (21.7%) fall into this category. Meanwhile, the 15 to 24 years age bracket for the primary householder has the lowest median household income of $0, with 12 households (1.6%) in this group.
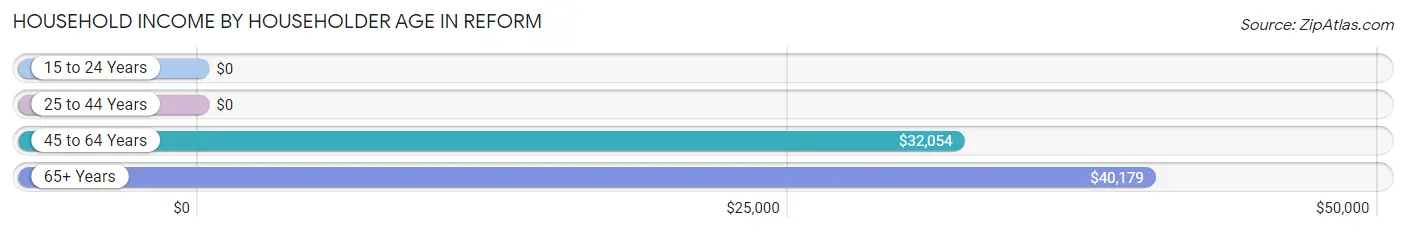
| Income Bracket | # Households | Median Income |
| 15 to 24 Years | 12 (1.6%) | $0 |
| 25 to 44 Years | 240 (32.7%) | $0 |
| 45 to 64 Years | 323 (44.0%) | $32,054 |
| 65+ Years | 159 (21.7%) | $40,179 |
| Total | 734 (100.0%) | $32,375 |
Poverty in Reform
Income Below Poverty by Sex and Age in Reform
With 25.0% poverty level for males and 41.2% for females among the residents of Reform, under 5 year old males and 12 to 14 year old females are the most vulnerable to poverty, with 78 males (83.0%) and 15 females (100.0%) in their respective age groups living below the poverty level.
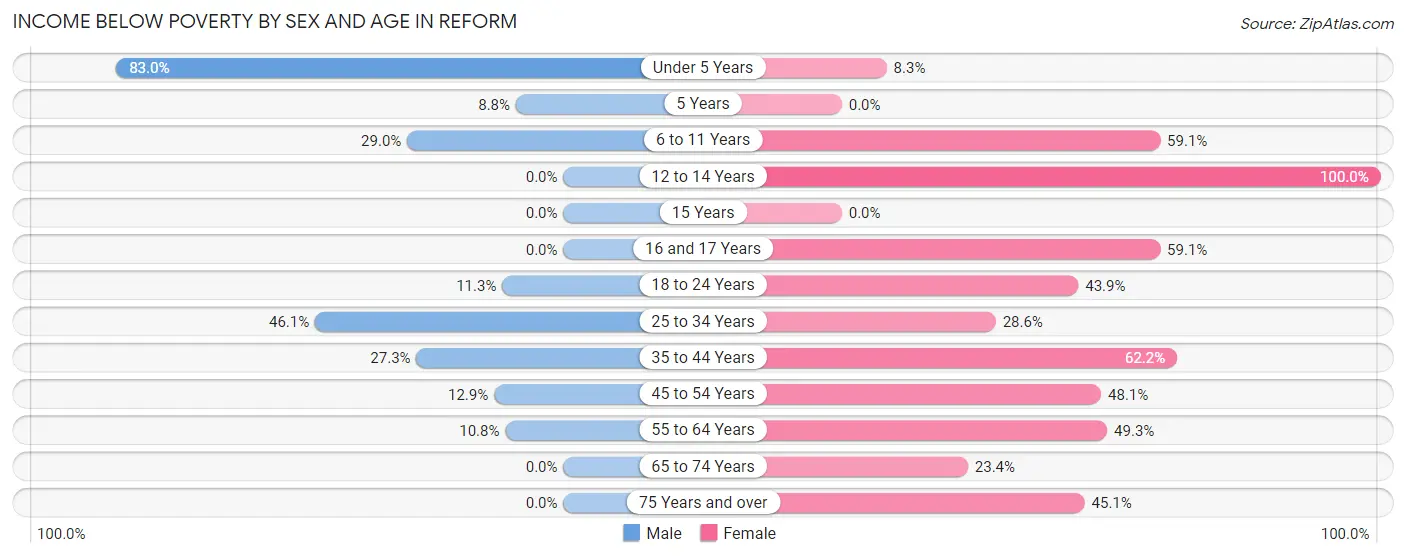
| Age Bracket | Male | Female |
| Under 5 Years | 78 (83.0%) | 8 (8.3%) |
| 5 Years | 3 (8.8%) | 0 (0.0%) |
| 6 to 11 Years | 20 (29.0%) | 39 (59.1%) |
| 12 to 14 Years | 0 (0.0%) | 15 (100.0%) |
| 15 Years | 0 (0.0%) | 0 (0.0%) |
| 16 and 17 Years | 0 (0.0%) | 13 (59.1%) |
| 18 to 24 Years | 11 (11.3%) | 72 (43.9%) |
| 25 to 34 Years | 59 (46.1%) | 38 (28.6%) |
| 35 to 44 Years | 15 (27.3%) | 28 (62.2%) |
| 45 to 54 Years | 18 (12.9%) | 90 (48.1%) |
| 55 to 64 Years | 11 (10.8%) | 67 (49.3%) |
| 65 to 74 Years | 0 (0.0%) | 11 (23.4%) |
| 75 Years and over | 0 (0.0%) | 32 (45.1%) |
| Total | 215 (25.0%) | 413 (41.2%) |
Income Above Poverty by Sex and Age in Reform
According to the poverty statistics in Reform, males aged 12 to 14 years and females aged 5 years are the age groups that are most secure financially, with 100.0% of males and 100.0% of females in these age groups living above the poverty line.
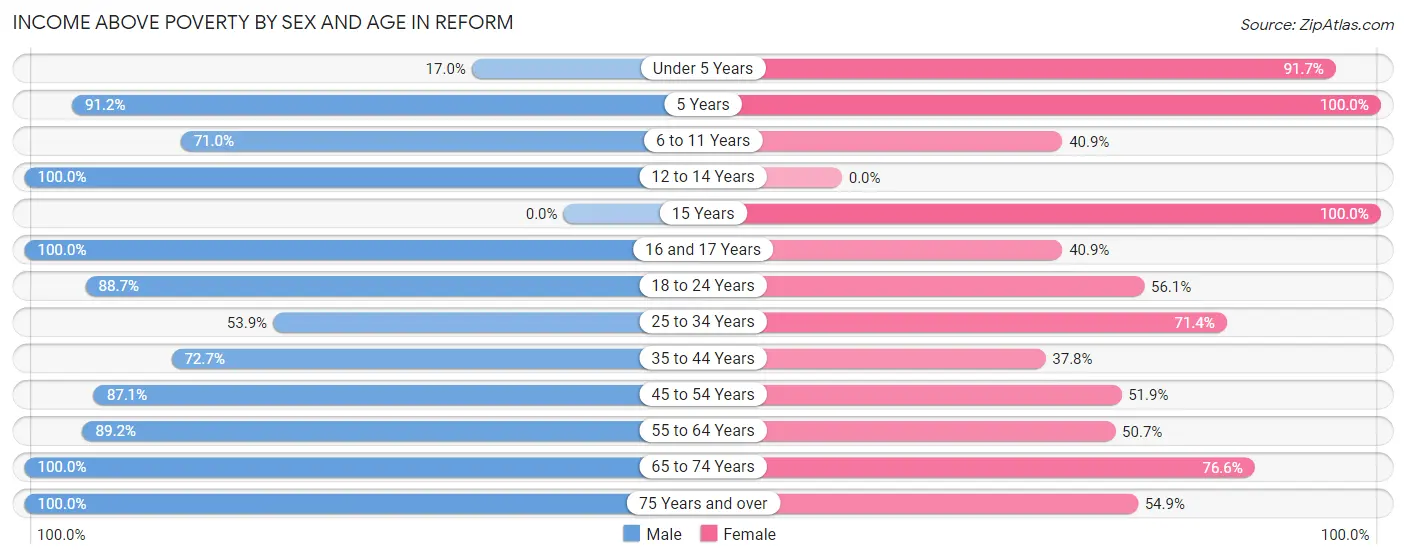
| Age Bracket | Male | Female |
| Under 5 Years | 16 (17.0%) | 88 (91.7%) |
| 5 Years | 31 (91.2%) | 15 (100.0%) |
| 6 to 11 Years | 49 (71.0%) | 27 (40.9%) |
| 12 to 14 Years | 22 (100.0%) | 0 (0.0%) |
| 15 Years | 0 (0.0%) | 5 (100.0%) |
| 16 and 17 Years | 29 (100.0%) | 9 (40.9%) |
| 18 to 24 Years | 86 (88.7%) | 92 (56.1%) |
| 25 to 34 Years | 69 (53.9%) | 95 (71.4%) |
| 35 to 44 Years | 40 (72.7%) | 17 (37.8%) |
| 45 to 54 Years | 122 (87.1%) | 97 (51.9%) |
| 55 to 64 Years | 91 (89.2%) | 69 (50.7%) |
| 65 to 74 Years | 51 (100.0%) | 36 (76.6%) |
| 75 Years and over | 40 (100.0%) | 39 (54.9%) |
| Total | 646 (75.0%) | 589 (58.8%) |
Income Below Poverty Among Married-Couple Families in Reform
The poverty statistics for married-couple families in Reform show that 9.2% or 18 of the total 195 families live below the poverty line. Families with 1 or 2 children have the highest poverty rate of 24.3%, comprising of 18 families. On the other hand, families with no children have the lowest poverty rate of 0.0%, which includes 0 families.
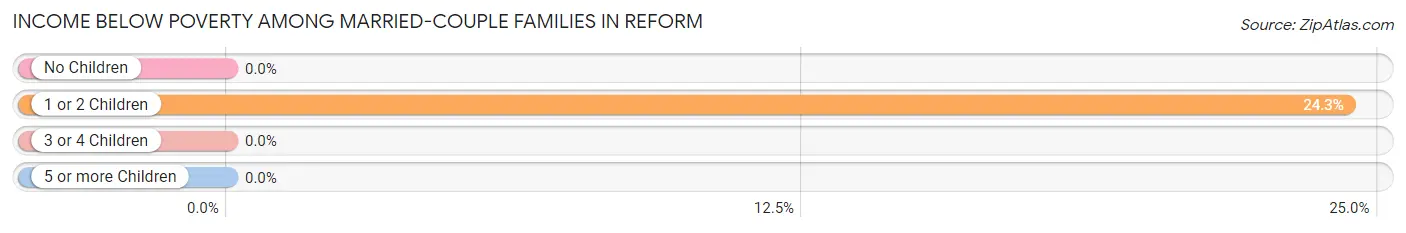
| Children | Above Poverty | Below Poverty |
| No Children | 115 (100.0%) | 0 (0.0%) |
| 1 or 2 Children | 56 (75.7%) | 18 (24.3%) |
| 3 or 4 Children | 6 (100.0%) | 0 (0.0%) |
| 5 or more Children | 0 (0.0%) | 0 (0.0%) |
| Total | 177 (90.8%) | 18 (9.2%) |
Income Below Poverty Among Single-Parent Households in Reform
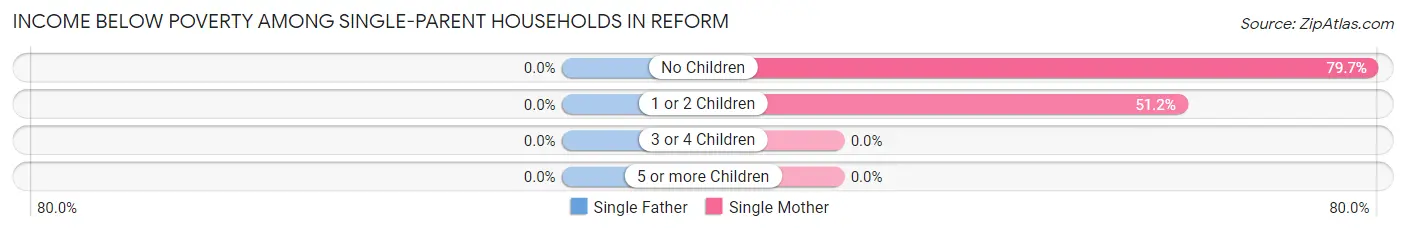
| Children | Single Father | Single Mother |
| No Children | 0 (0.0%) | 55 (79.7%) |
| 1 or 2 Children | 0 (0.0%) | 83 (51.2%) |
| 3 or 4 Children | 0 (0.0%) | 0 (0.0%) |
| 5 or more Children | 0 (0.0%) | 0 (0.0%) |
| Total | 0 (0.0%) | 138 (59.7%) |
Income Below Poverty Among Married-Couple vs Single-Parent Households in Reform
The poverty data for Reform shows that 18 of the married-couple family households (9.2%) and 138 of the single-parent households (57.0%) are living below the poverty level. Within the married-couple family households, those with 1 or 2 children have the highest poverty rate, with 18 households (24.3%) falling below the poverty line. Among the single-parent households, those with no children have the highest poverty rate, with 55 household (68.8%) living below poverty.
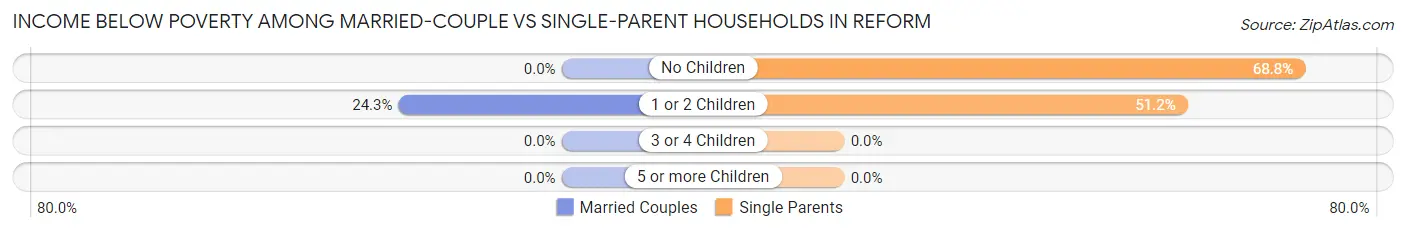
| Children | Married-Couple Families | Single-Parent Households |
| No Children | 0 (0.0%) | 55 (68.8%) |
| 1 or 2 Children | 18 (24.3%) | 83 (51.2%) |
| 3 or 4 Children | 0 (0.0%) | 0 (0.0%) |
| 5 or more Children | 0 (0.0%) | 0 (0.0%) |
| Total | 18 (9.2%) | 138 (57.0%) |
Employment Characteristics in Reform
Employment by Class of Employer in Reform
Among the 705 employed individuals in Reform, private company employees (499 | 70.8%), local government employees (54 | 7.7%), and self-employed (not incorporated) (41 | 5.8%) make up the most common classes of employment.
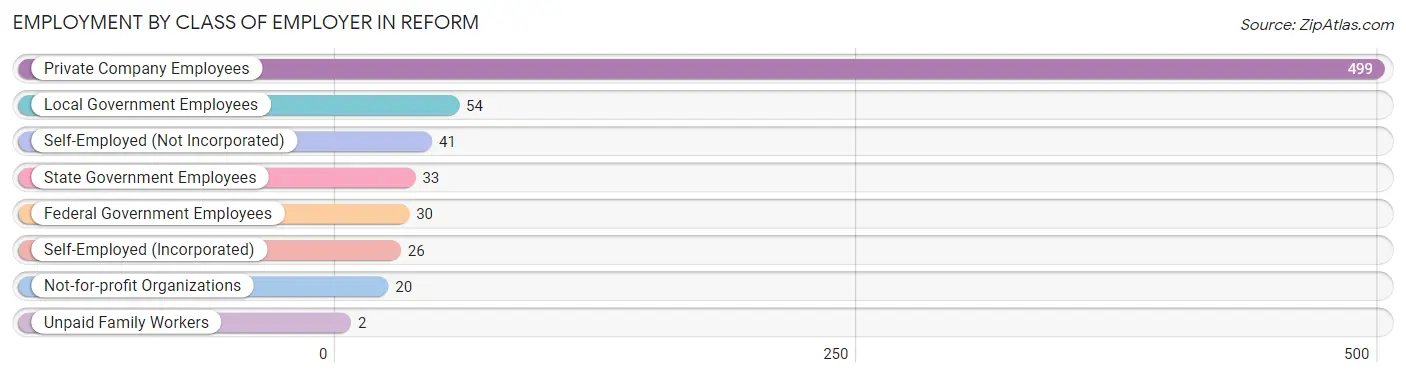
| Employer Class | # Employees | % Employees |
| Private Company Employees | 499 | 70.8% |
| Self-Employed (Incorporated) | 26 | 3.7% |
| Self-Employed (Not Incorporated) | 41 | 5.8% |
| Not-for-profit Organizations | 20 | 2.8% |
| Local Government Employees | 54 | 7.7% |
| State Government Employees | 33 | 4.7% |
| Federal Government Employees | 30 | 4.3% |
| Unpaid Family Workers | 2 | 0.3% |
| Total | 705 | 100.0% |
Employment Status by Age in Reform
According to the labor force statistics for Reform, out of the total population over 16 years of age (1,497), 50.9% or 762 individuals are in the labor force, with 3.5% or 27 of them unemployed. The age group with the highest labor force participation rate is 25 to 29 years, with 77.5% or 69 individuals in the labor force. Within the labor force, the 20 to 24 years age range has the highest percentage of unemployed individuals, with 7.5% or 8 of them being unemployed.
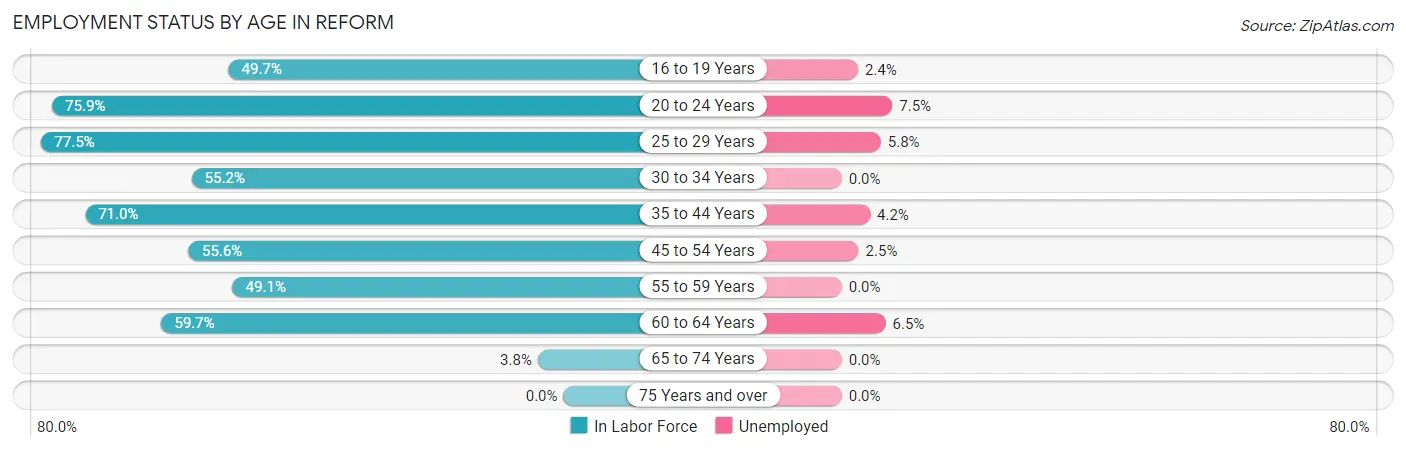
| Age Bracket | In Labor Force | Unemployed |
| 16 to 19 Years | 85 (49.7%) | 2 (2.4%) |
| 20 to 24 Years | 107 (75.9%) | 8 (7.5%) |
| 25 to 29 Years | 69 (77.5%) | 4 (5.8%) |
| 30 to 34 Years | 95 (55.2%) | 0 (0.0%) |
| 35 to 44 Years | 71 (71.0%) | 3 (4.2%) |
| 45 to 54 Years | 198 (55.6%) | 5 (2.5%) |
| 55 to 59 Years | 56 (49.1%) | 0 (0.0%) |
| 60 to 64 Years | 77 (59.7%) | 5 (6.5%) |
| 65 to 74 Years | 4 (3.8%) | 0 (0.0%) |
| 75 Years and over | 0 (0.0%) | 0 (0.0%) |
| Total | 762 (50.9%) | 27 (3.5%) |
Employment Status by Educational Attainment in Reform
According to labor force statistics for Reform, 59.0% of individuals (566) out of the total population between 25 and 64 years of age (960) are in the labor force, with 3.0% or 17 of them being unemployed. The group with the highest labor force participation rate are those with the educational attainment of bachelor's degree or higher, with 97.1% or 100 individuals in the labor force. Within the labor force, individuals with college / associate degree education have the highest percentage of unemployment, with 4.3% or 9 of them being unemployed.
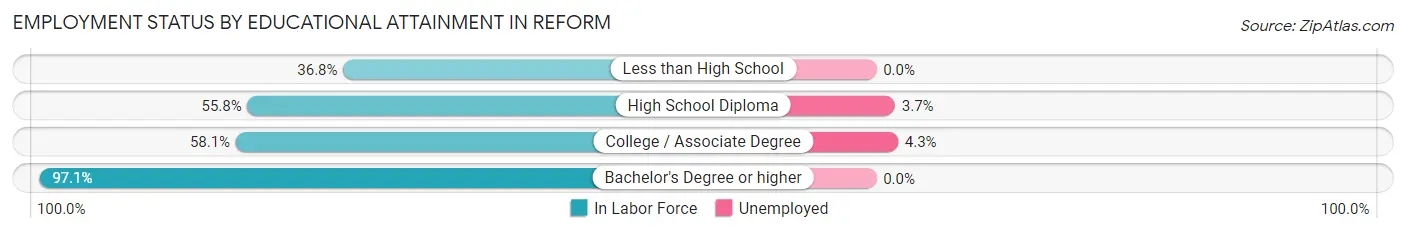
| Educational Attainment | In Labor Force | Unemployed |
| Less than High School | 39 (36.8%) | 0 (0.0%) |
| High School Diploma | 218 (55.8%) | 14 (3.7%) |
| College / Associate Degree | 209 (58.1%) | 15 (4.3%) |
| Bachelor's Degree or higher | 100 (97.1%) | 0 (0.0%) |
| Total | 566 (59.0%) | 29 (3.0%) |
Employment Occupations by Sex in Reform
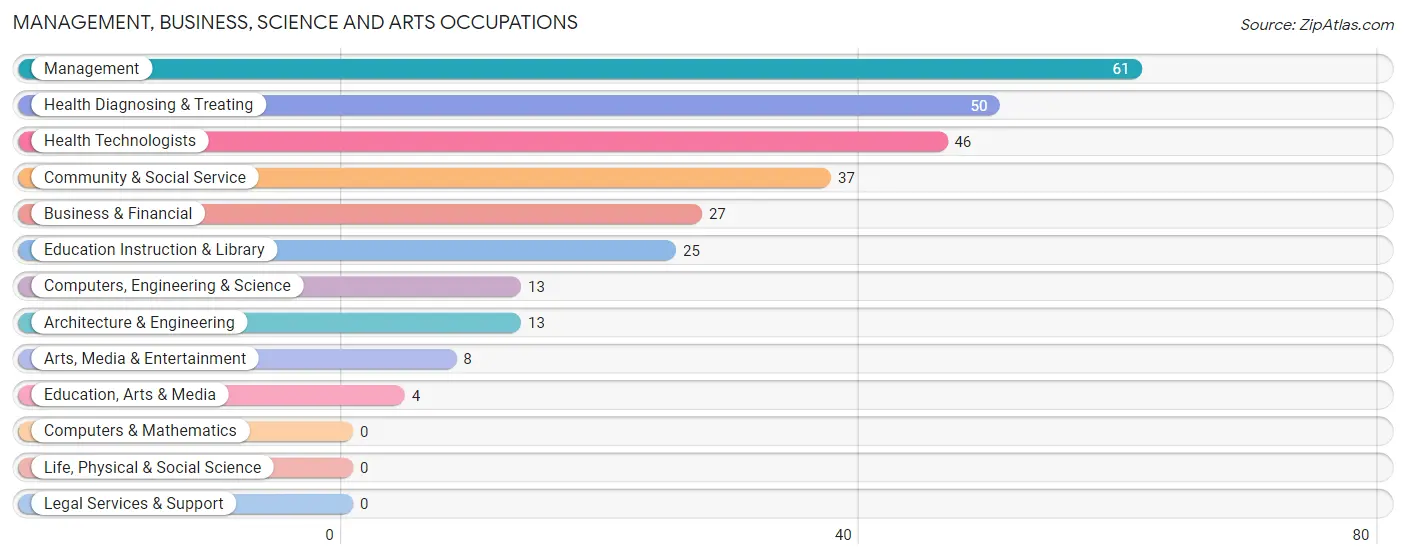
Management, Business, Science and Arts Occupations
The most common Management, Business, Science and Arts occupations in Reform are Management (61 | 8.3%), Health Diagnosing & Treating (50 | 6.8%), Health Technologists (46 | 6.3%), Community & Social Service (37 | 5.0%), and Business & Financial (27 | 3.7%).
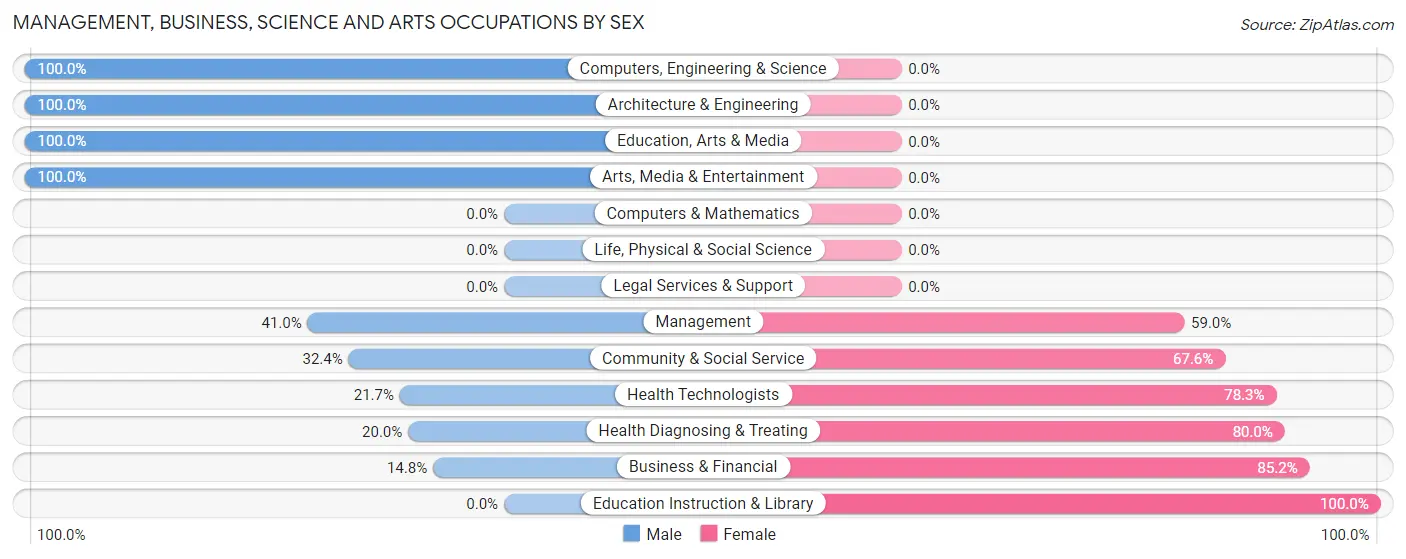
Management, Business, Science and Arts Occupations by Sex
Within the Management, Business, Science and Arts occupations in Reform, the most male-oriented occupations are Computers, Engineering & Science (100.0%), Architecture & Engineering (100.0%), and Education, Arts & Media (100.0%), while the most female-oriented occupations are Education Instruction & Library (100.0%), Business & Financial (85.2%), and Health Diagnosing & Treating (80.0%).
| Occupation | Male | Female |
| Management | 25 (41.0%) | 36 (59.0%) |
| Business & Financial | 4 (14.8%) | 23 (85.2%) |
| Computers, Engineering & Science | 13 (100.0%) | 0 (0.0%) |
| Computers & Mathematics | 0 (0.0%) | 0 (0.0%) |
| Architecture & Engineering | 13 (100.0%) | 0 (0.0%) |
| Life, Physical & Social Science | 0 (0.0%) | 0 (0.0%) |
| Community & Social Service | 12 (32.4%) | 25 (67.6%) |
| Education, Arts & Media | 4 (100.0%) | 0 (0.0%) |
| Legal Services & Support | 0 (0.0%) | 0 (0.0%) |
| Education Instruction & Library | 0 (0.0%) | 25 (100.0%) |
| Arts, Media & Entertainment | 8 (100.0%) | 0 (0.0%) |
| Health Diagnosing & Treating | 10 (20.0%) | 40 (80.0%) |
| Health Technologists | 10 (21.7%) | 36 (78.3%) |
| Total (Category) | 64 (34.0%) | 124 (66.0%) |
| Total (Overall) | 384 (52.2%) | 351 (47.8%) |
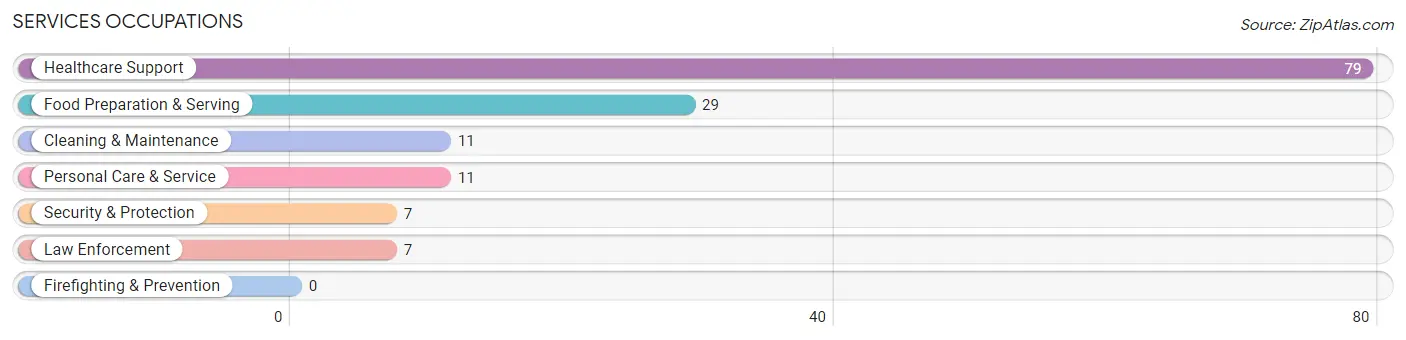
Services Occupations
The most common Services occupations in Reform are Healthcare Support (79 | 10.7%), Food Preparation & Serving (29 | 4.0%), Cleaning & Maintenance (11 | 1.5%), Personal Care & Service (11 | 1.5%), and Security & Protection (7 | 0.9%).
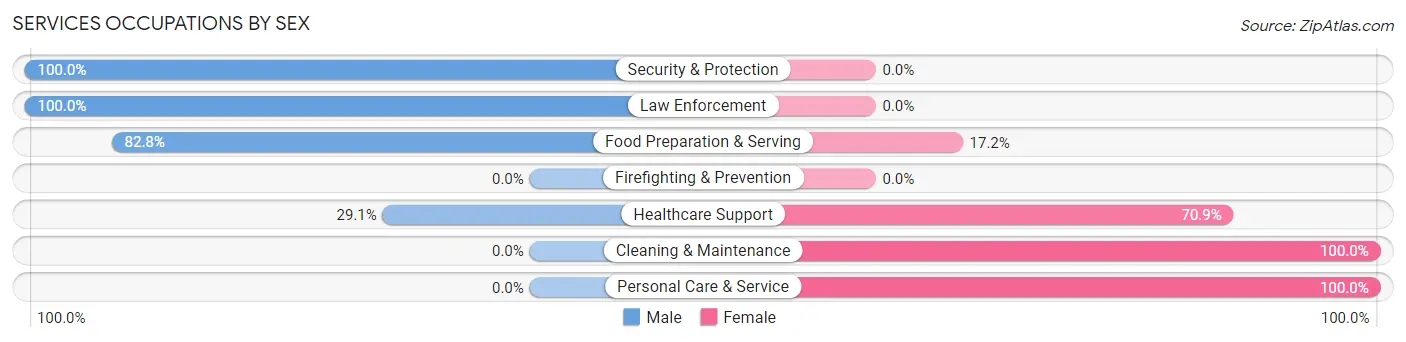
Services Occupations by Sex
Within the Services occupations in Reform, the most male-oriented occupations are Security & Protection (100.0%), Law Enforcement (100.0%), and Food Preparation & Serving (82.8%), while the most female-oriented occupations are Cleaning & Maintenance (100.0%), Personal Care & Service (100.0%), and Healthcare Support (70.9%).
| Occupation | Male | Female |
| Healthcare Support | 23 (29.1%) | 56 (70.9%) |
| Security & Protection | 7 (100.0%) | 0 (0.0%) |
| Firefighting & Prevention | 0 (0.0%) | 0 (0.0%) |
| Law Enforcement | 7 (100.0%) | 0 (0.0%) |
| Food Preparation & Serving | 24 (82.8%) | 5 (17.2%) |
| Cleaning & Maintenance | 0 (0.0%) | 11 (100.0%) |
| Personal Care & Service | 0 (0.0%) | 11 (100.0%) |
| Total (Category) | 54 (39.4%) | 83 (60.6%) |
| Total (Overall) | 384 (52.2%) | 351 (47.8%) |
Sales and Office Occupations
The most common Sales and Office occupations in Reform are Office & Administration (97 | 13.2%), and Sales & Related (33 | 4.5%).
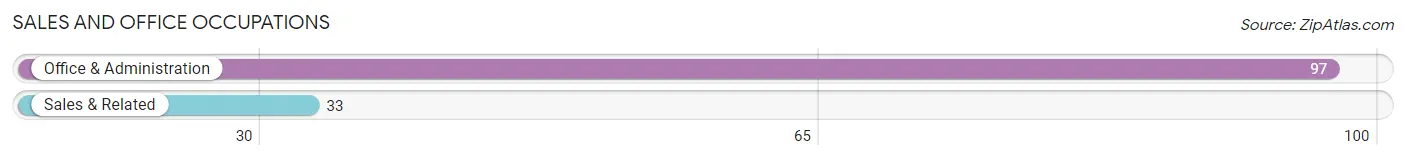
Sales and Office Occupations by Sex
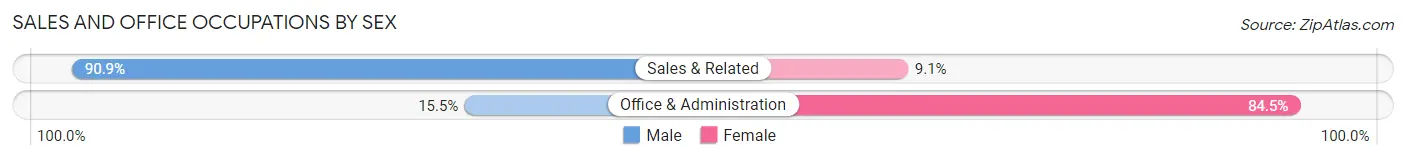
| Occupation | Male | Female |
| Sales & Related | 30 (90.9%) | 3 (9.1%) |
| Office & Administration | 15 (15.5%) | 82 (84.5%) |
| Total (Category) | 45 (34.6%) | 85 (65.4%) |
| Total (Overall) | 384 (52.2%) | 351 (47.8%) |
Natural Resources, Construction and Maintenance Occupations
The most common Natural Resources, Construction and Maintenance occupations in Reform are Construction & Extraction (15 | 2.0%), and Installation, Maintenance & Repair (10 | 1.4%).
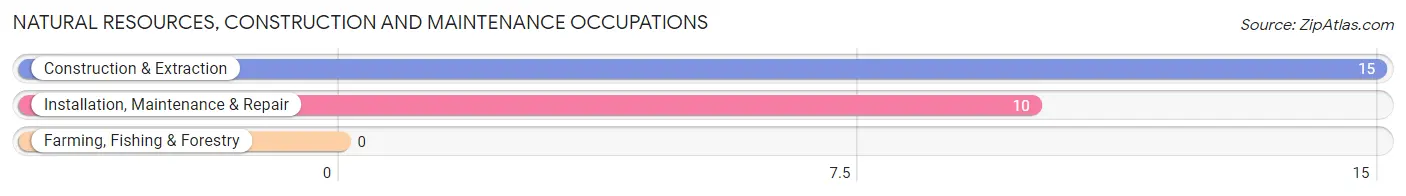
Natural Resources, Construction and Maintenance Occupations by Sex
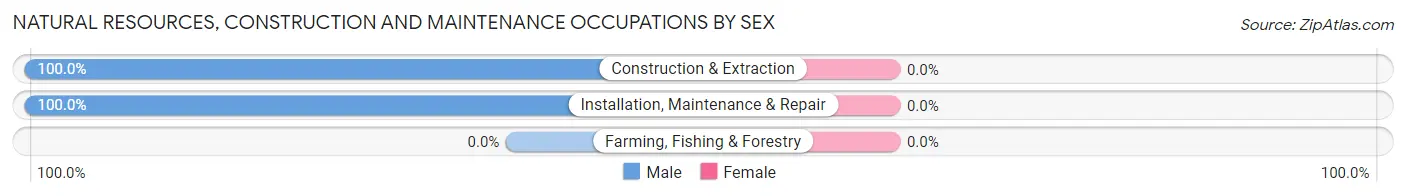
| Occupation | Male | Female |
| Farming, Fishing & Forestry | 0 (0.0%) | 0 (0.0%) |
| Construction & Extraction | 15 (100.0%) | 0 (0.0%) |
| Installation, Maintenance & Repair | 10 (100.0%) | 0 (0.0%) |
| Total (Category) | 25 (100.0%) | 0 (0.0%) |
| Total (Overall) | 384 (52.2%) | 351 (47.8%) |
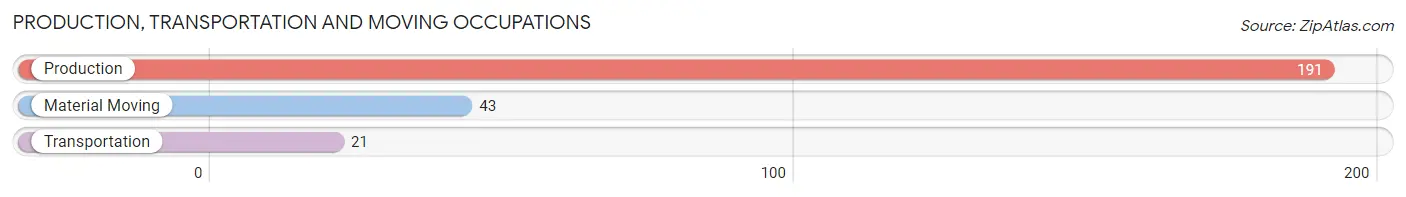
Production, Transportation and Moving Occupations
The most common Production, Transportation and Moving occupations in Reform are Production (191 | 26.0%), Material Moving (43 | 5.9%), and Transportation (21 | 2.9%).
Production, Transportation and Moving Occupations by Sex
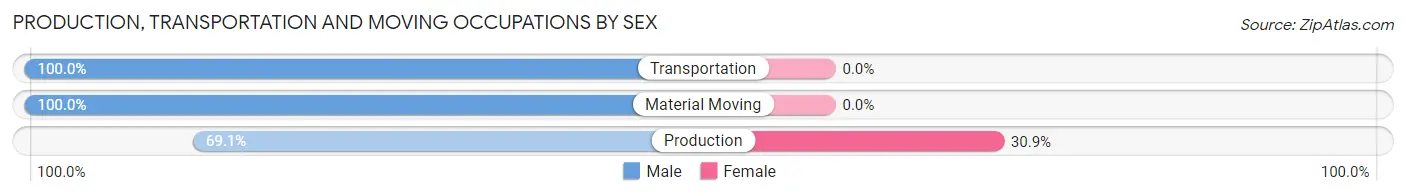
| Occupation | Male | Female |
| Production | 132 (69.1%) | 59 (30.9%) |
| Transportation | 21 (100.0%) | 0 (0.0%) |
| Material Moving | 43 (100.0%) | 0 (0.0%) |
| Total (Category) | 196 (76.9%) | 59 (23.1%) |
| Total (Overall) | 384 (52.2%) | 351 (47.8%) |
Employment Industries by Sex in Reform
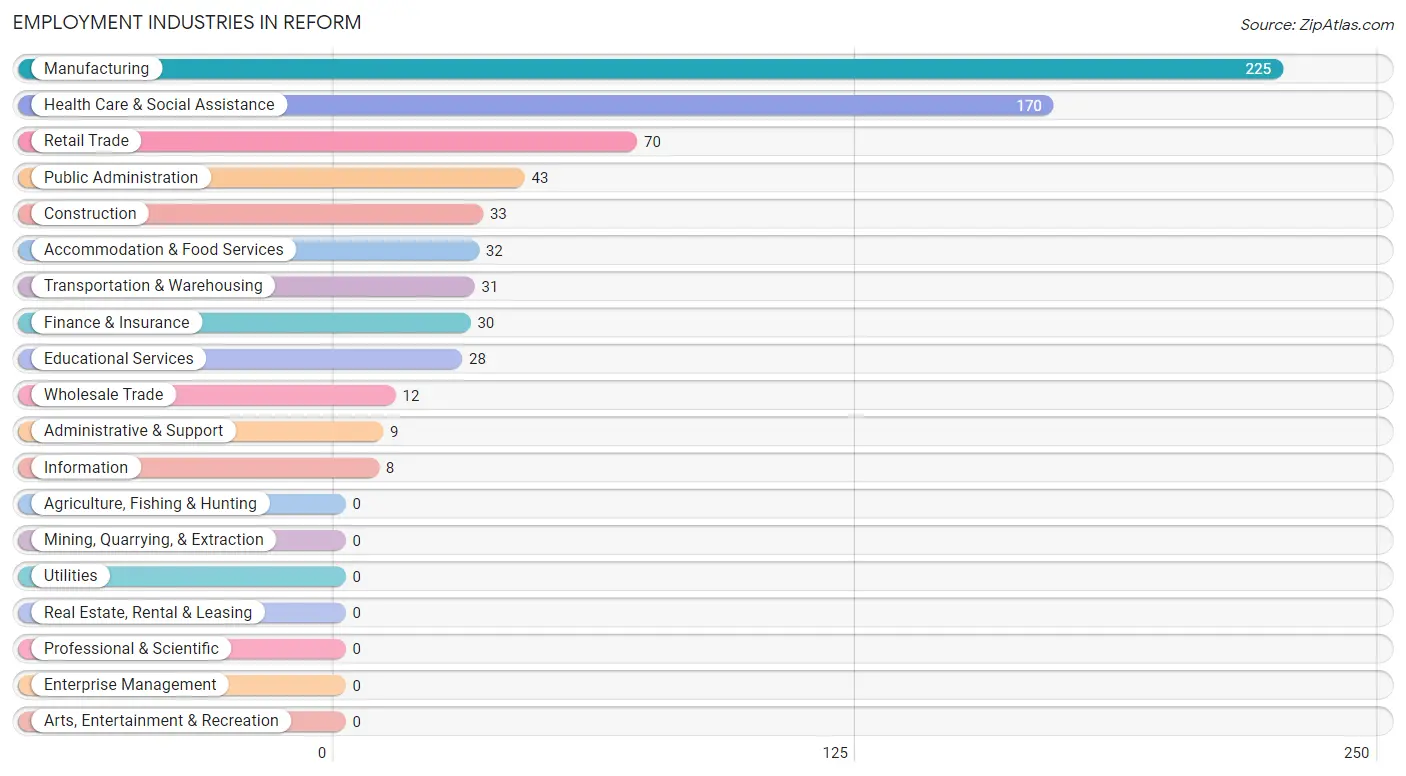
Employment Industries in Reform
The major employment industries in Reform include Manufacturing (225 | 30.6%), Health Care & Social Assistance (170 | 23.1%), Retail Trade (70 | 9.5%), Public Administration (43 | 5.9%), and Construction (33 | 4.5%).
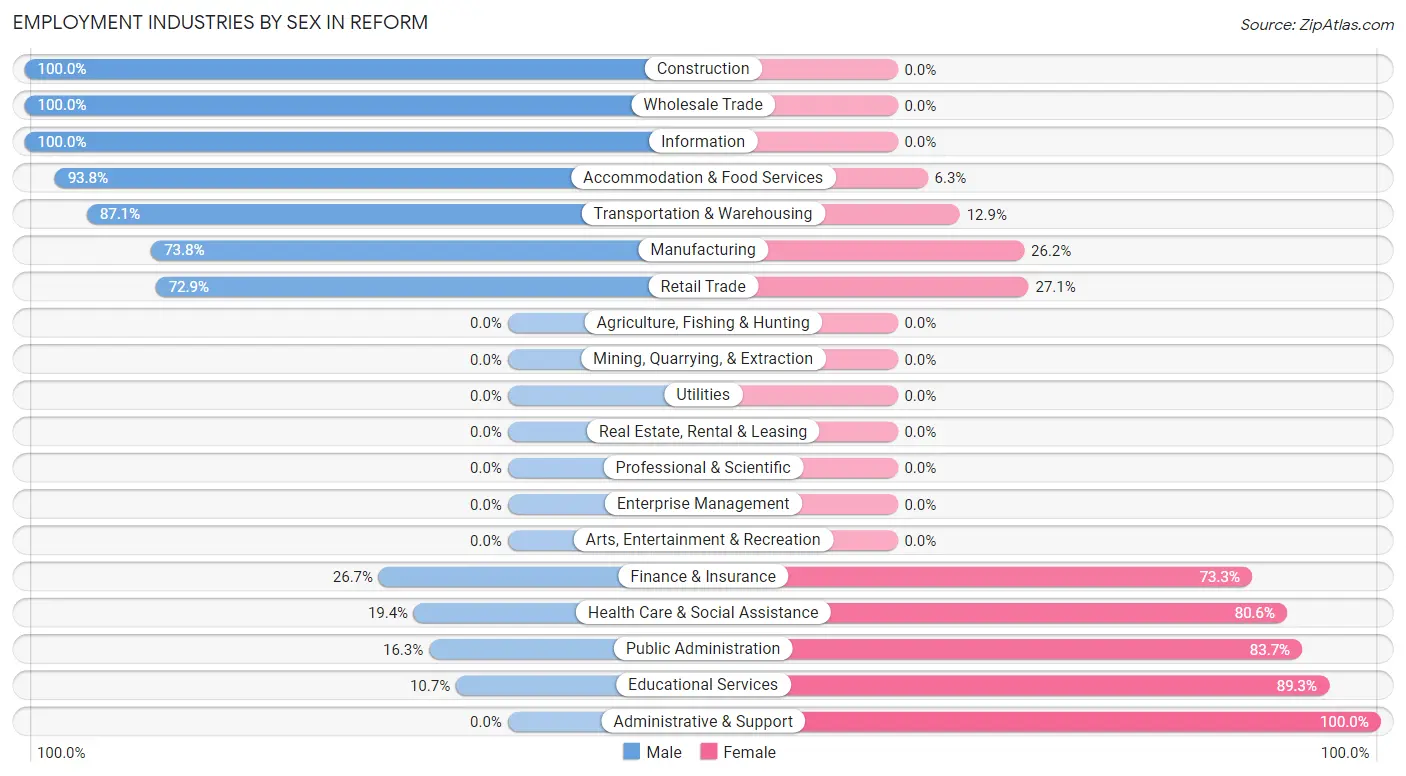
Employment Industries by Sex in Reform
The Reform industries that see more men than women are Construction (100.0%), Wholesale Trade (100.0%), and Information (100.0%), whereas the industries that tend to have a higher number of women are Administrative & Support (100.0%), Educational Services (89.3%), and Public Administration (83.7%).
| Industry | Male | Female |
| Agriculture, Fishing & Hunting | 0 (0.0%) | 0 (0.0%) |
| Mining, Quarrying, & Extraction | 0 (0.0%) | 0 (0.0%) |
| Construction | 33 (100.0%) | 0 (0.0%) |
| Manufacturing | 166 (73.8%) | 59 (26.2%) |
| Wholesale Trade | 12 (100.0%) | 0 (0.0%) |
| Retail Trade | 51 (72.9%) | 19 (27.1%) |
| Transportation & Warehousing | 27 (87.1%) | 4 (12.9%) |
| Utilities | 0 (0.0%) | 0 (0.0%) |
| Information | 8 (100.0%) | 0 (0.0%) |
| Finance & Insurance | 8 (26.7%) | 22 (73.3%) |
| Real Estate, Rental & Leasing | 0 (0.0%) | 0 (0.0%) |
| Professional & Scientific | 0 (0.0%) | 0 (0.0%) |
| Enterprise Management | 0 (0.0%) | 0 (0.0%) |
| Administrative & Support | 0 (0.0%) | 9 (100.0%) |
| Educational Services | 3 (10.7%) | 25 (89.3%) |
| Health Care & Social Assistance | 33 (19.4%) | 137 (80.6%) |
| Arts, Entertainment & Recreation | 0 (0.0%) | 0 (0.0%) |
| Accommodation & Food Services | 30 (93.8%) | 2 (6.2%) |
| Public Administration | 7 (16.3%) | 36 (83.7%) |
| Total | 384 (52.2%) | 351 (47.8%) |
Education in Reform
School Enrollment in Reform
The most common levels of schooling among the 493 students in Reform are college / undergraduate (138 | 28.0%), high school (110 | 22.3%), and kindergarten (79 | 16.0%).
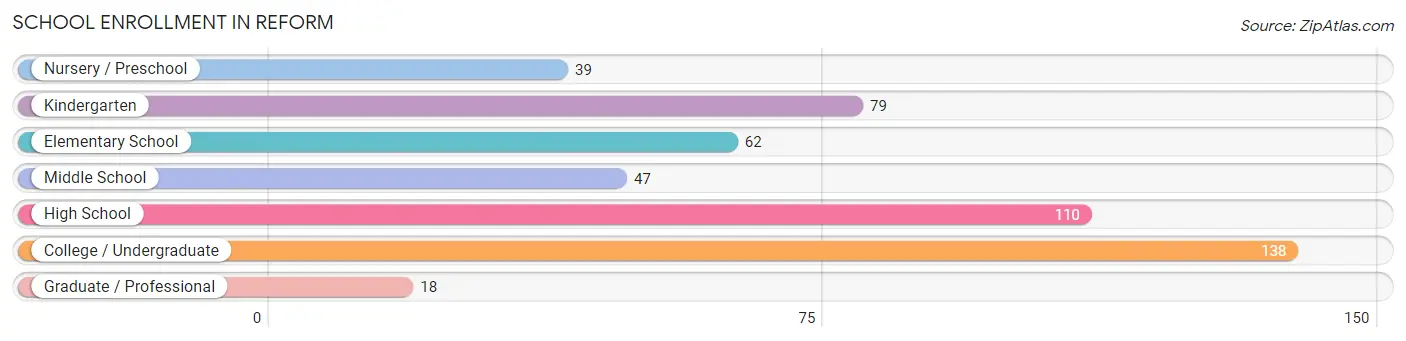
| School Level | # Students | % Students |
| Nursery / Preschool | 39 | 7.9% |
| Kindergarten | 79 | 16.0% |
| Elementary School | 62 | 12.6% |
| Middle School | 47 | 9.5% |
| High School | 110 | 22.3% |
| College / Undergraduate | 138 | 28.0% |
| Graduate / Professional | 18 | 3.6% |
| Total | 493 | 100.0% |
School Enrollment by Age by Funding Source in Reform
Out of a total of 493 students who are enrolled in schools in Reform, 86 (17.4%) attend a private institution, while the remaining 407 (82.6%) are enrolled in public schools. The age group of 35 years and over has the highest likelihood of being enrolled in private schools, with 19 (100.0% in the age bracket) enrolled. Conversely, the age group of 5 to 9 year old has the lowest likelihood of being enrolled in a private school, with 111 (100.0% in the age bracket) attending a public institution.
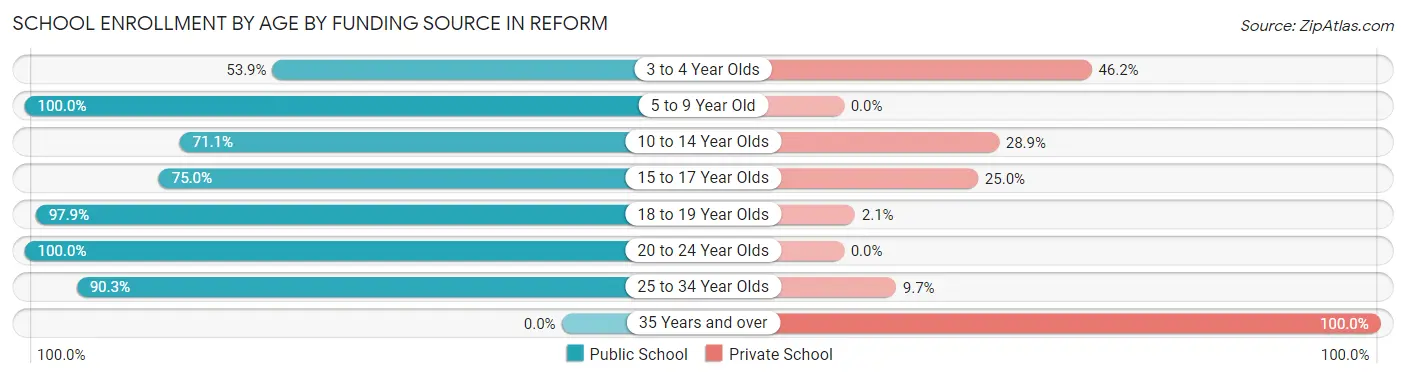
| Age Bracket | Public School | Private School |
| 3 to 4 Year Olds | 21 (53.8%) | 18 (46.2%) |
| 5 to 9 Year Old | 111 (100.0%) | 0 (0.0%) |
| 10 to 14 Year Olds | 64 (71.1%) | 26 (28.9%) |
| 15 to 17 Year Olds | 42 (75.0%) | 14 (25.0%) |
| 18 to 19 Year Olds | 94 (97.9%) | 2 (2.1%) |
| 20 to 24 Year Olds | 10 (100.0%) | 0 (0.0%) |
| 25 to 34 Year Olds | 65 (90.3%) | 7 (9.7%) |
| 35 Years and over | 0 (0.0%) | 19 (100.0%) |
| Total | 407 (82.6%) | 86 (17.4%) |
Educational Attainment by Field of Study in Reform
Science & technology (53 | 36.8%), education (38 | 26.4%), business (24 | 16.7%), bio, nature & agricultural (11 | 7.6%), and arts & humanities (9 | 6.2%) are the most common fields of study among 144 individuals in Reform who have obtained a bachelor's degree or higher.
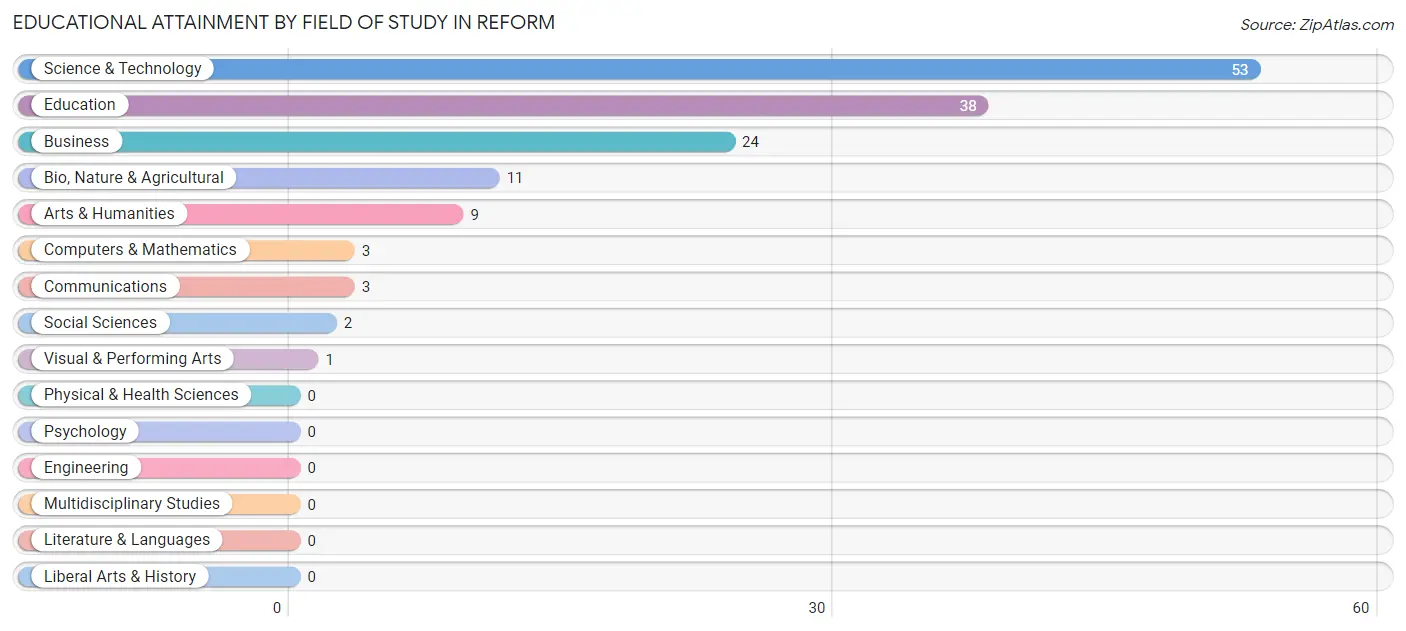
| Field of Study | # Graduates | % Graduates |
| Computers & Mathematics | 3 | 2.1% |
| Bio, Nature & Agricultural | 11 | 7.6% |
| Physical & Health Sciences | 0 | 0.0% |
| Psychology | 0 | 0.0% |
| Social Sciences | 2 | 1.4% |
| Engineering | 0 | 0.0% |
| Multidisciplinary Studies | 0 | 0.0% |
| Science & Technology | 53 | 36.8% |
| Business | 24 | 16.7% |
| Education | 38 | 26.4% |
| Literature & Languages | 0 | 0.0% |
| Liberal Arts & History | 0 | 0.0% |
| Visual & Performing Arts | 1 | 0.7% |
| Communications | 3 | 2.1% |
| Arts & Humanities | 9 | 6.2% |
| Total | 144 | 100.0% |
Transportation & Commute in Reform
Vehicle Availability by Sex in Reform
The most prevalent vehicle ownership categories in Reform are males with 2 vehicles (154, accounting for 40.7%) and females with 2 vehicles (139, making up 47.1%).
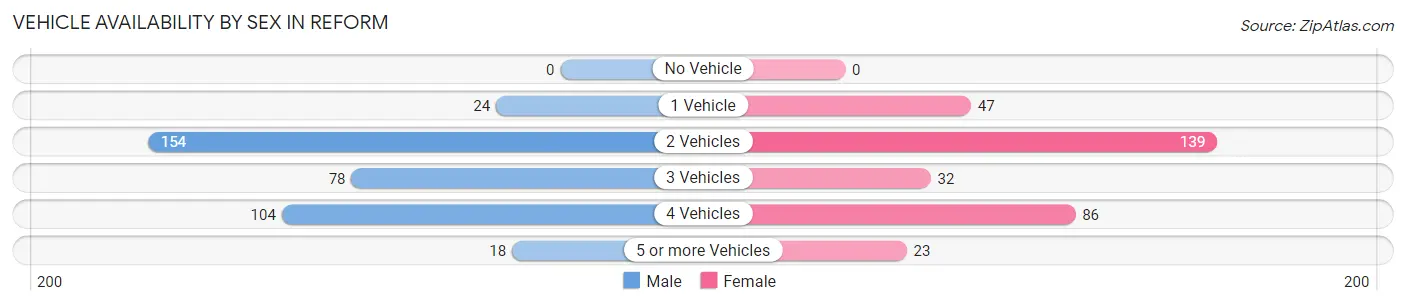
| Vehicles Available | Male | Female |
| No Vehicle | 0 (0.0%) | 0 (0.0%) |
| 1 Vehicle | 24 (6.4%) | 47 (14.4%) |
| 2 Vehicles | 154 (40.7%) | 139 (42.5%) |
| 3 Vehicles | 78 (20.6%) | 32 (9.8%) |
| 4 Vehicles | 104 (27.5%) | 86 (26.3%) |
| 5 or more Vehicles | 18 (4.8%) | 23 (7.0%) |
| Total | 378 (100.0%) | 327 (100.0%) |
Commute Time in Reform
The most frequently occuring commute durations in Reform are 30 to 34 minutes (175 commuters, 25.8%), 40 to 44 minutes (103 commuters, 15.2%), and 45 to 59 minutes (71 commuters, 10.5%).
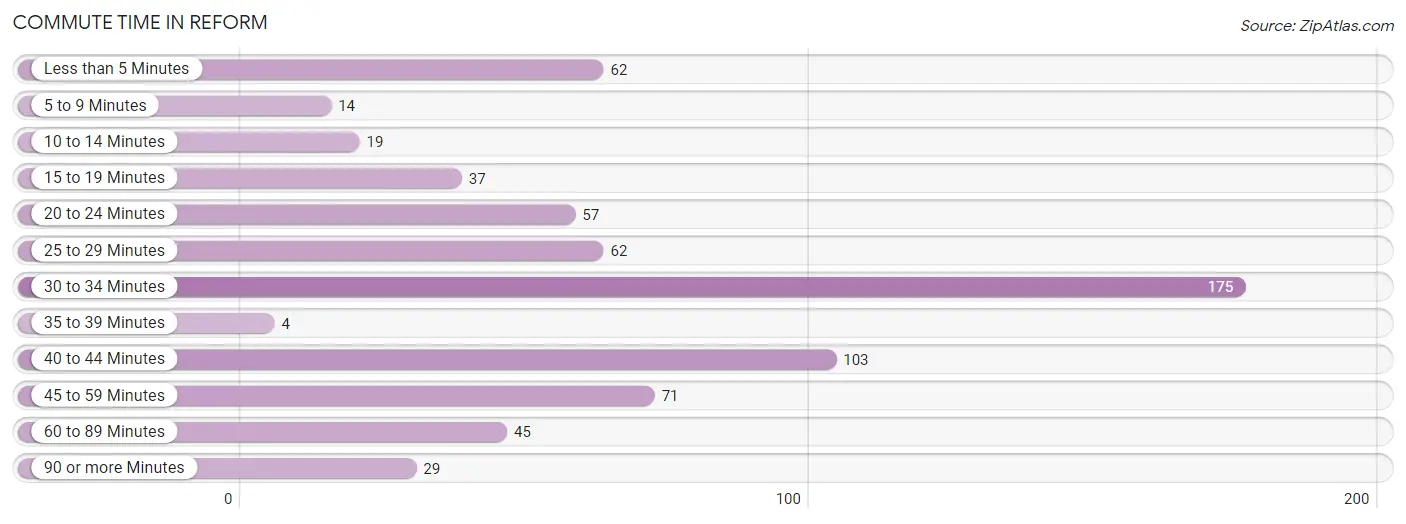
| Commute Time | # Commuters | % Commuters |
| Less than 5 Minutes | 62 | 9.1% |
| 5 to 9 Minutes | 14 | 2.1% |
| 10 to 14 Minutes | 19 | 2.8% |
| 15 to 19 Minutes | 37 | 5.5% |
| 20 to 24 Minutes | 57 | 8.4% |
| 25 to 29 Minutes | 62 | 9.1% |
| 30 to 34 Minutes | 175 | 25.8% |
| 35 to 39 Minutes | 4 | 0.6% |
| 40 to 44 Minutes | 103 | 15.2% |
| 45 to 59 Minutes | 71 | 10.5% |
| 60 to 89 Minutes | 45 | 6.6% |
| 90 or more Minutes | 29 | 4.3% |
Commute Time by Sex in Reform
The most common commute times in Reform are 30 to 34 minutes (157 commuters, 41.5%) for males and 40 to 44 minutes (76 commuters, 25.3%) for females.
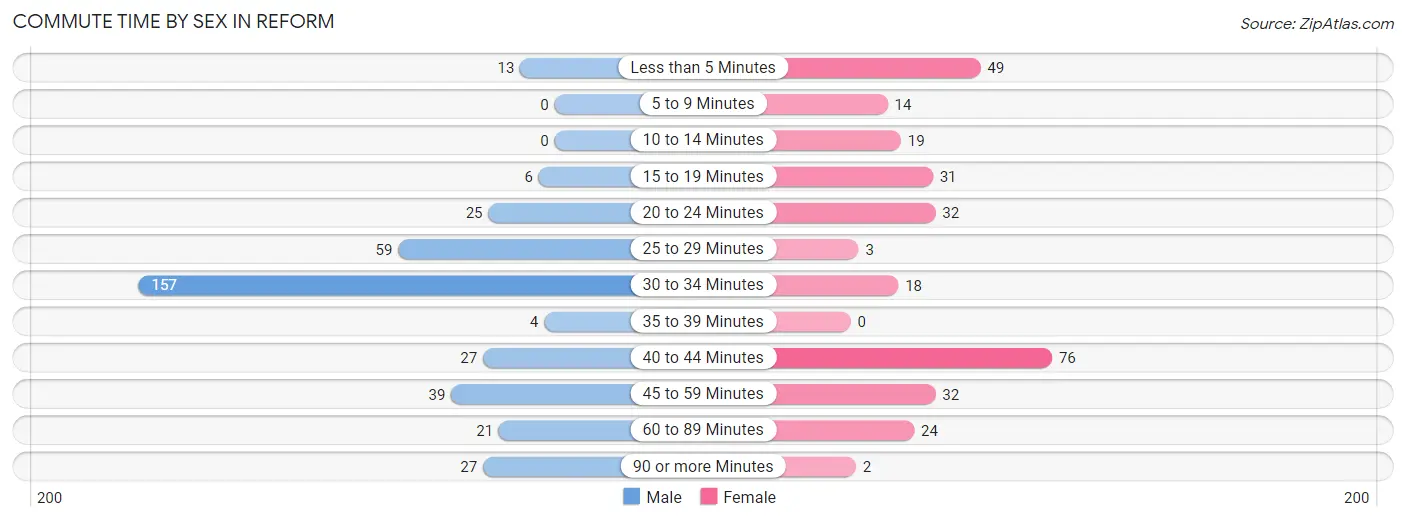
| Commute Time | Male | Female |
| Less than 5 Minutes | 13 (3.4%) | 49 (16.3%) |
| 5 to 9 Minutes | 0 (0.0%) | 14 (4.7%) |
| 10 to 14 Minutes | 0 (0.0%) | 19 (6.3%) |
| 15 to 19 Minutes | 6 (1.6%) | 31 (10.3%) |
| 20 to 24 Minutes | 25 (6.6%) | 32 (10.7%) |
| 25 to 29 Minutes | 59 (15.6%) | 3 (1.0%) |
| 30 to 34 Minutes | 157 (41.5%) | 18 (6.0%) |
| 35 to 39 Minutes | 4 (1.1%) | 0 (0.0%) |
| 40 to 44 Minutes | 27 (7.1%) | 76 (25.3%) |
| 45 to 59 Minutes | 39 (10.3%) | 32 (10.7%) |
| 60 to 89 Minutes | 21 (5.6%) | 24 (8.0%) |
| 90 or more Minutes | 27 (7.1%) | 2 (0.7%) |
Time of Departure to Work by Sex in Reform
The most frequent times of departure to work in Reform are 12:00 AM to 4:59 AM (101, 26.7%) for males and 7:30 AM to 7:59 AM (63, 21.0%) for females.
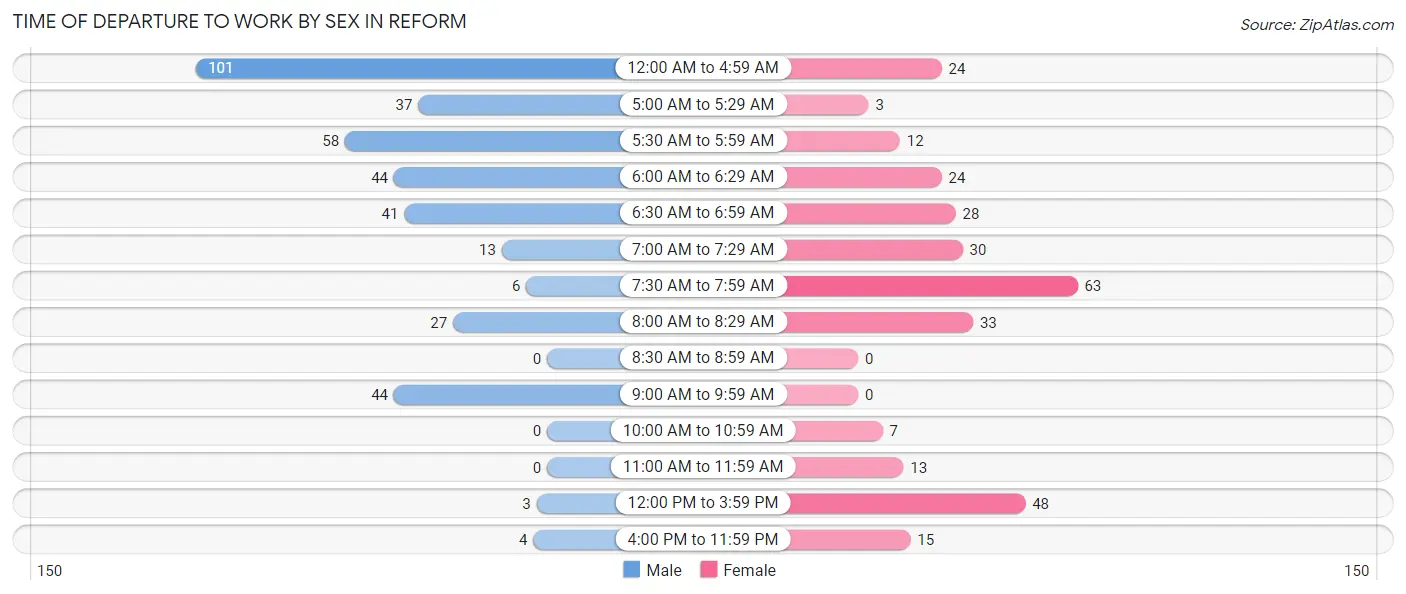
| Time of Departure | Male | Female |
| 12:00 AM to 4:59 AM | 101 (26.7%) | 24 (8.0%) |
| 5:00 AM to 5:29 AM | 37 (9.8%) | 3 (1.0%) |
| 5:30 AM to 5:59 AM | 58 (15.3%) | 12 (4.0%) |
| 6:00 AM to 6:29 AM | 44 (11.6%) | 24 (8.0%) |
| 6:30 AM to 6:59 AM | 41 (10.8%) | 28 (9.3%) |
| 7:00 AM to 7:29 AM | 13 (3.4%) | 30 (10.0%) |
| 7:30 AM to 7:59 AM | 6 (1.6%) | 63 (21.0%) |
| 8:00 AM to 8:29 AM | 27 (7.1%) | 33 (11.0%) |
| 8:30 AM to 8:59 AM | 0 (0.0%) | 0 (0.0%) |
| 9:00 AM to 9:59 AM | 44 (11.6%) | 0 (0.0%) |
| 10:00 AM to 10:59 AM | 0 (0.0%) | 7 (2.3%) |
| 11:00 AM to 11:59 AM | 0 (0.0%) | 13 (4.3%) |
| 12:00 PM to 3:59 PM | 3 (0.8%) | 48 (16.0%) |
| 4:00 PM to 11:59 PM | 4 (1.1%) | 15 (5.0%) |
| Total | 378 (100.0%) | 300 (100.0%) |
Housing Occupancy in Reform
Occupancy by Ownership in Reform
Of the total 734 dwellings in Reform, owner-occupied units account for 382 (52.0%), while renter-occupied units make up 352 (48.0%).
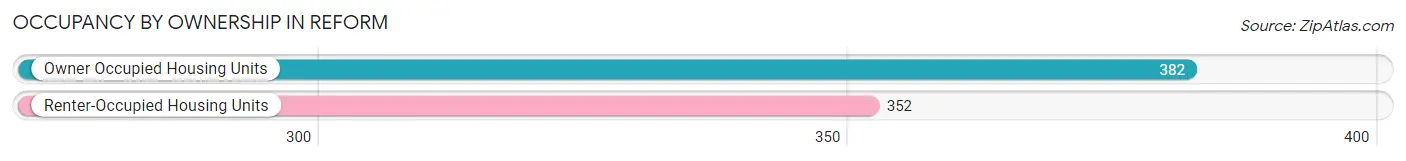
| Occupancy | # Housing Units | % Housing Units |
| Owner Occupied Housing Units | 382 | 52.0% |
| Renter-Occupied Housing Units | 352 | 48.0% |
| Total Occupied Housing Units | 734 | 100.0% |
Occupancy by Household Size in Reform
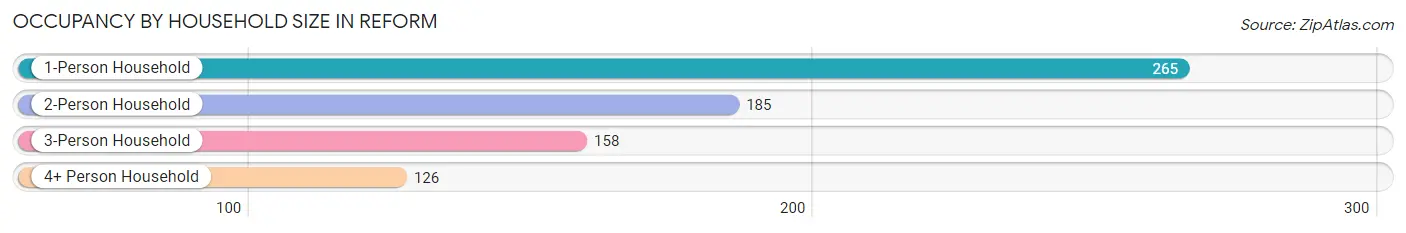
| Household Size | # Housing Units | % Housing Units |
| 1-Person Household | 265 | 36.1% |
| 2-Person Household | 185 | 25.2% |
| 3-Person Household | 158 | 21.5% |
| 4+ Person Household | 126 | 17.2% |
| Total Housing Units | 734 | 100.0% |
Occupancy by Ownership by Household Size in Reform
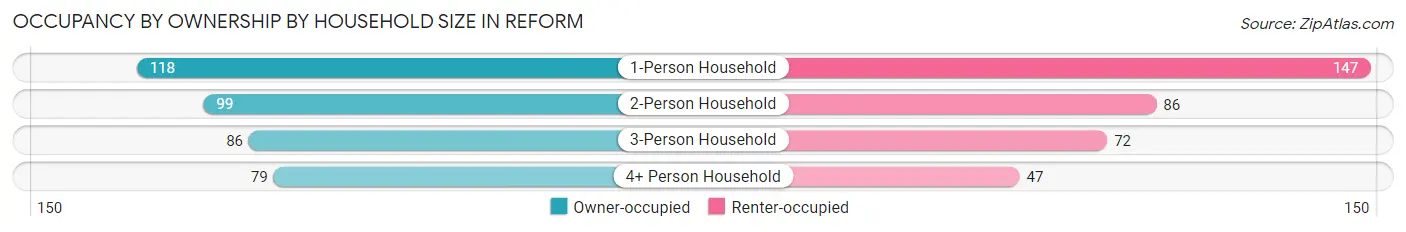
| Household Size | Owner-occupied | Renter-occupied |
| 1-Person Household | 118 (44.5%) | 147 (55.5%) |
| 2-Person Household | 99 (53.5%) | 86 (46.5%) |
| 3-Person Household | 86 (54.4%) | 72 (45.6%) |
| 4+ Person Household | 79 (62.7%) | 47 (37.3%) |
| Total Housing Units | 382 (52.0%) | 352 (48.0%) |
Occupancy by Educational Attainment in Reform
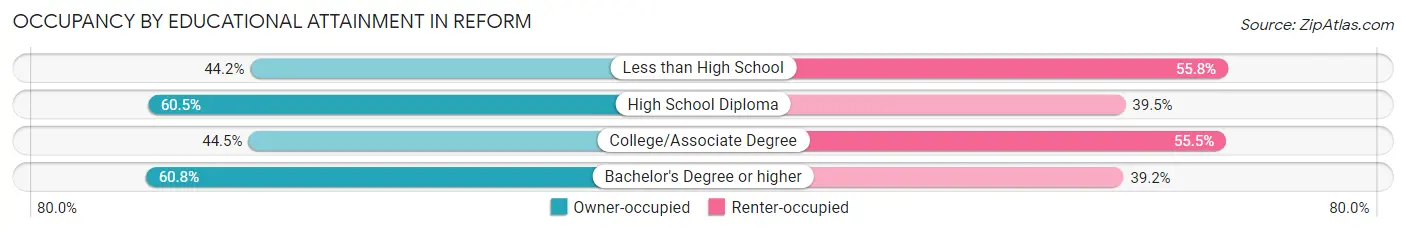
| Household Size | Owner-occupied | Renter-occupied |
| Less than High School | 42 (44.2%) | 53 (55.8%) |
| High School Diploma | 179 (60.5%) | 117 (39.5%) |
| College/Associate Degree | 130 (44.5%) | 162 (55.5%) |
| Bachelor's Degree or higher | 31 (60.8%) | 20 (39.2%) |
Occupancy by Age of Householder in Reform
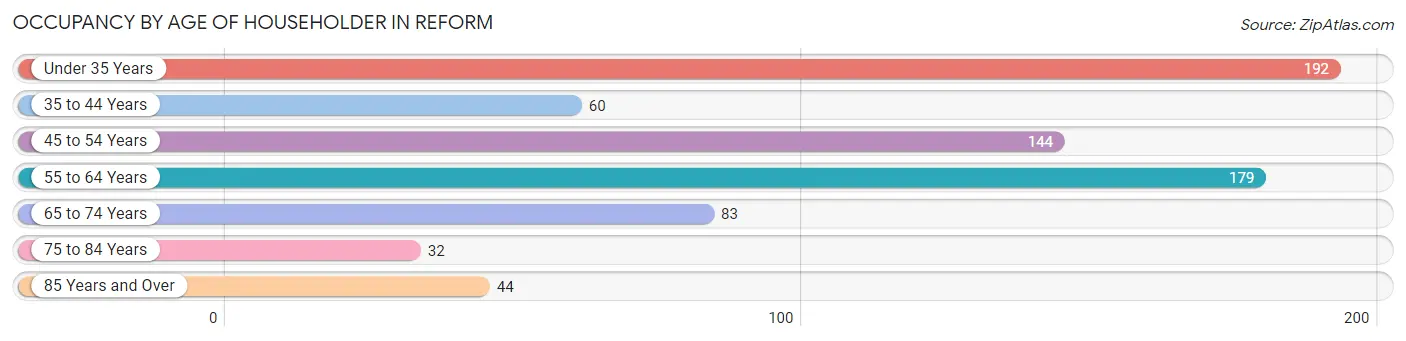
| Age Bracket | # Households | % Households |
| Under 35 Years | 192 | 26.2% |
| 35 to 44 Years | 60 | 8.2% |
| 45 to 54 Years | 144 | 19.6% |
| 55 to 64 Years | 179 | 24.4% |
| 65 to 74 Years | 83 | 11.3% |
| 75 to 84 Years | 32 | 4.4% |
| 85 Years and Over | 44 | 6.0% |
| Total | 734 | 100.0% |
Housing Finances in Reform
Median Income by Occupancy in Reform
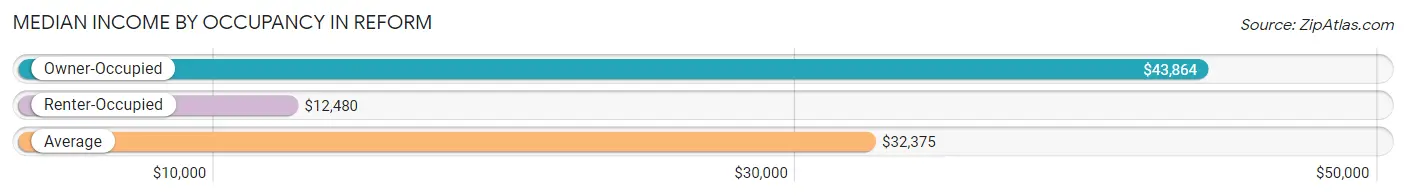
| Occupancy Type | # Households | Median Income |
| Owner-Occupied | 382 (52.0%) | $43,864 |
| Renter-Occupied | 352 (48.0%) | $12,480 |
| Average | 734 (100.0%) | $32,375 |
Occupancy by Householder Income Bracket in Reform
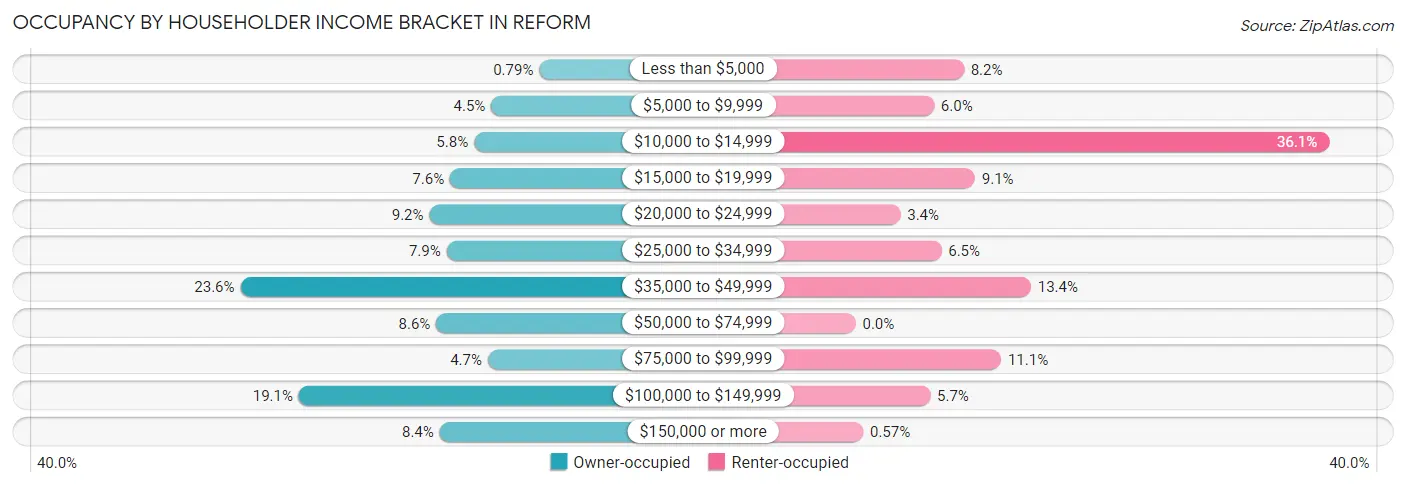
| Income Bracket | Owner-occupied | Renter-occupied |
| Less than $5,000 | 3 (0.8%) | 29 (8.2%) |
| $5,000 to $9,999 | 17 (4.4%) | 21 (6.0%) |
| $10,000 to $14,999 | 22 (5.8%) | 127 (36.1%) |
| $15,000 to $19,999 | 29 (7.6%) | 32 (9.1%) |
| $20,000 to $24,999 | 35 (9.2%) | 12 (3.4%) |
| $25,000 to $34,999 | 30 (7.9%) | 23 (6.5%) |
| $35,000 to $49,999 | 90 (23.6%) | 47 (13.4%) |
| $50,000 to $74,999 | 33 (8.6%) | 0 (0.0%) |
| $75,000 to $99,999 | 18 (4.7%) | 39 (11.1%) |
| $100,000 to $149,999 | 73 (19.1%) | 20 (5.7%) |
| $150,000 or more | 32 (8.4%) | 2 (0.6%) |
| Total | 382 (100.0%) | 352 (100.0%) |
Monthly Housing Cost Tiers in Reform
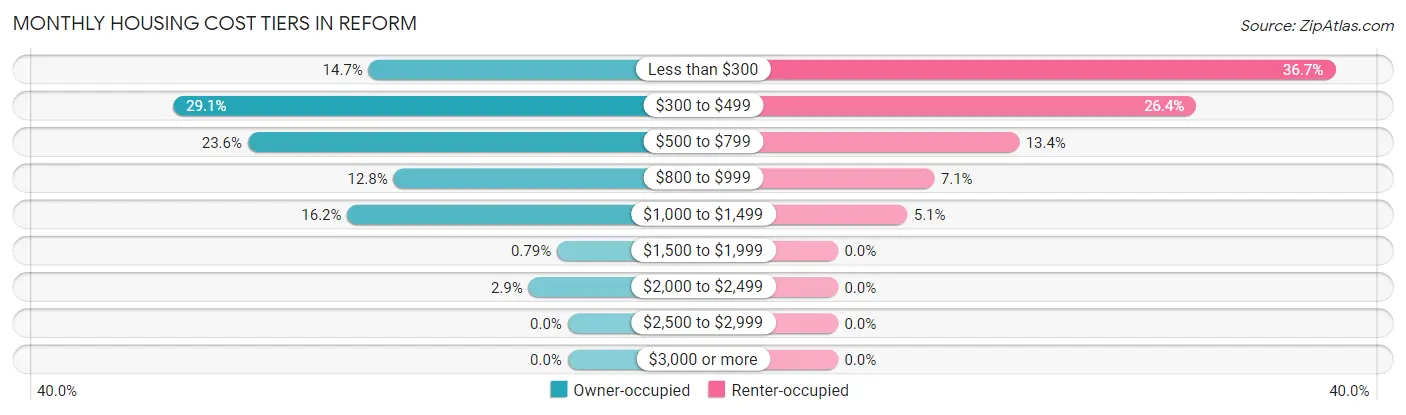
| Monthly Cost | Owner-occupied | Renter-occupied |
| Less than $300 | 56 (14.7%) | 129 (36.6%) |
| $300 to $499 | 111 (29.1%) | 93 (26.4%) |
| $500 to $799 | 90 (23.6%) | 47 (13.4%) |
| $800 to $999 | 49 (12.8%) | 25 (7.1%) |
| $1,000 to $1,499 | 62 (16.2%) | 18 (5.1%) |
| $1,500 to $1,999 | 3 (0.8%) | 0 (0.0%) |
| $2,000 to $2,499 | 11 (2.9%) | 0 (0.0%) |
| $2,500 to $2,999 | 0 (0.0%) | 0 (0.0%) |
| $3,000 or more | 0 (0.0%) | 0 (0.0%) |
| Total | 382 (100.0%) | 352 (100.0%) |
Physical Housing Characteristics in Reform
Housing Structures in Reform
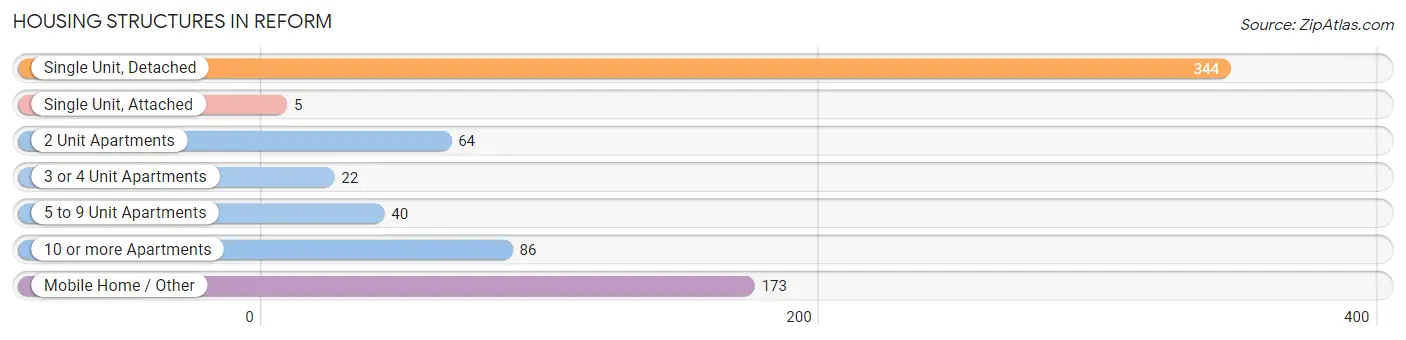
| Structure Type | # Housing Units | % Housing Units |
| Single Unit, Detached | 344 | 46.9% |
| Single Unit, Attached | 5 | 0.7% |
| 2 Unit Apartments | 64 | 8.7% |
| 3 or 4 Unit Apartments | 22 | 3.0% |
| 5 to 9 Unit Apartments | 40 | 5.4% |
| 10 or more Apartments | 86 | 11.7% |
| Mobile Home / Other | 173 | 23.6% |
| Total | 734 | 100.0% |
Housing Structures by Occupancy in Reform
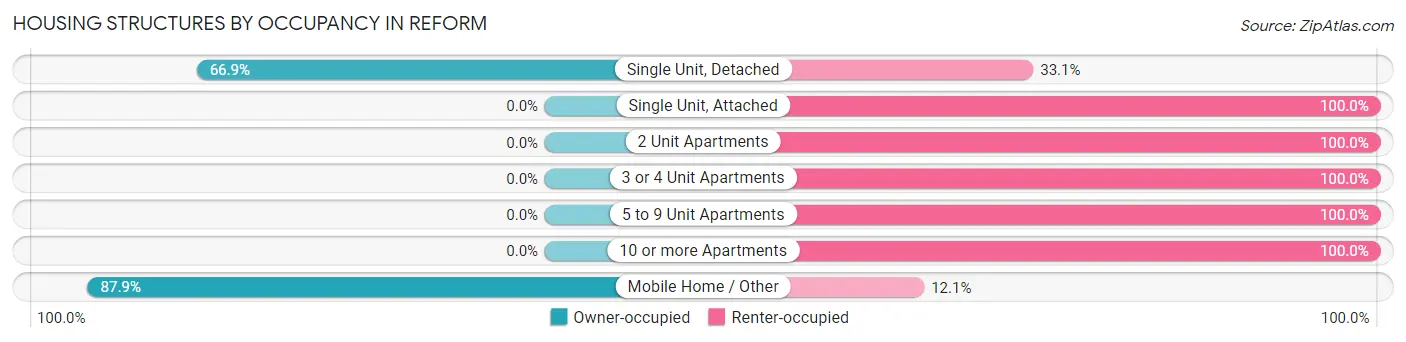
| Structure Type | Owner-occupied | Renter-occupied |
| Single Unit, Detached | 230 (66.9%) | 114 (33.1%) |
| Single Unit, Attached | 0 (0.0%) | 5 (100.0%) |
| 2 Unit Apartments | 0 (0.0%) | 64 (100.0%) |
| 3 or 4 Unit Apartments | 0 (0.0%) | 22 (100.0%) |
| 5 to 9 Unit Apartments | 0 (0.0%) | 40 (100.0%) |
| 10 or more Apartments | 0 (0.0%) | 86 (100.0%) |
| Mobile Home / Other | 152 (87.9%) | 21 (12.1%) |
| Total | 382 (52.0%) | 352 (48.0%) |
Housing Structures by Number of Rooms in Reform
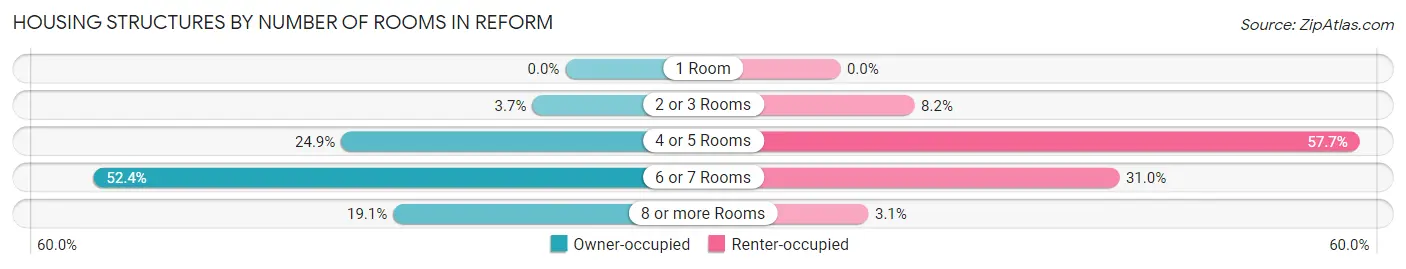
| Number of Rooms | Owner-occupied | Renter-occupied |
| 1 Room | 0 (0.0%) | 0 (0.0%) |
| 2 or 3 Rooms | 14 (3.7%) | 29 (8.2%) |
| 4 or 5 Rooms | 95 (24.9%) | 203 (57.7%) |
| 6 or 7 Rooms | 200 (52.4%) | 109 (31.0%) |
| 8 or more Rooms | 73 (19.1%) | 11 (3.1%) |
| Total | 382 (100.0%) | 352 (100.0%) |
Housing Structure by Heating Type in Reform
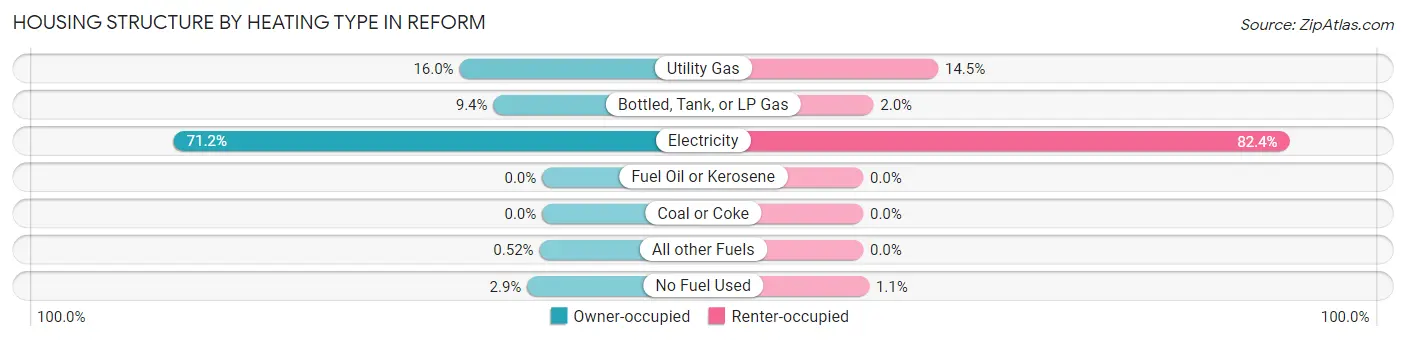
| Heating Type | Owner-occupied | Renter-occupied |
| Utility Gas | 61 (16.0%) | 51 (14.5%) |
| Bottled, Tank, or LP Gas | 36 (9.4%) | 7 (2.0%) |
| Electricity | 272 (71.2%) | 290 (82.4%) |
| Fuel Oil or Kerosene | 0 (0.0%) | 0 (0.0%) |
| Coal or Coke | 0 (0.0%) | 0 (0.0%) |
| All other Fuels | 2 (0.5%) | 0 (0.0%) |
| No Fuel Used | 11 (2.9%) | 4 (1.1%) |
| Total | 382 (100.0%) | 352 (100.0%) |
Household Vehicle Usage in Reform
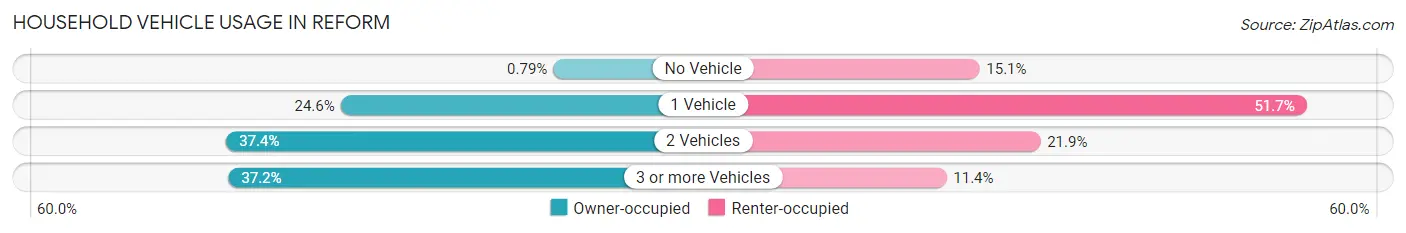
| Vehicles per Household | Owner-occupied | Renter-occupied |
| No Vehicle | 3 (0.8%) | 53 (15.1%) |
| 1 Vehicle | 94 (24.6%) | 182 (51.7%) |
| 2 Vehicles | 143 (37.4%) | 77 (21.9%) |
| 3 or more Vehicles | 142 (37.2%) | 40 (11.4%) |
| Total | 382 (100.0%) | 352 (100.0%) |
Real Estate & Mortgages in Reform
Real Estate and Mortgage Overview in Reform
| Characteristic | Without Mortgage | With Mortgage |
| Housing Units | 214 | 168 |
| Median Property Value | $67,700 | $97,800 |
| Median Household Income | $37,647 | $30 |
| Monthly Housing Costs | $438 | $0 |
| Real Estate Taxes | $289 | $21 |
Property Value by Mortgage Status in Reform
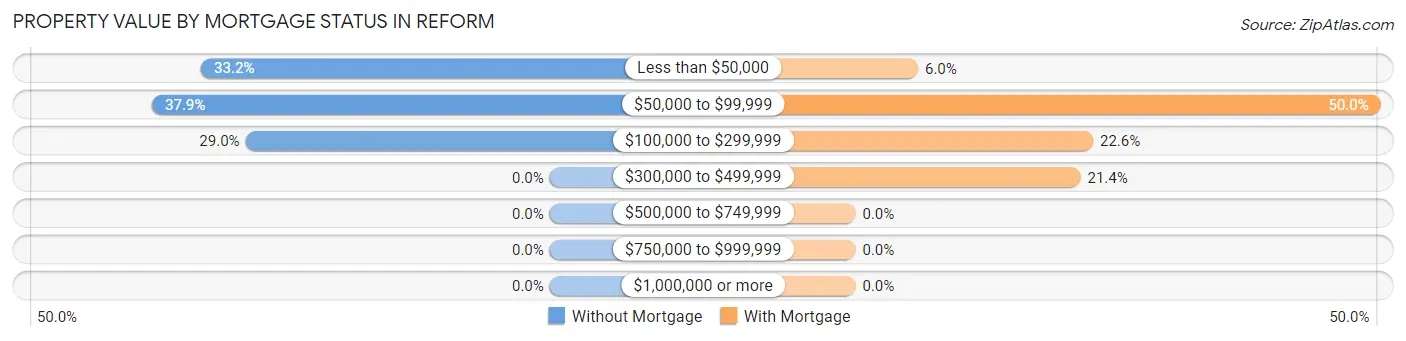
| Property Value | Without Mortgage | With Mortgage |
| Less than $50,000 | 71 (33.2%) | 10 (5.9%) |
| $50,000 to $99,999 | 81 (37.9%) | 84 (50.0%) |
| $100,000 to $299,999 | 62 (29.0%) | 38 (22.6%) |
| $300,000 to $499,999 | 0 (0.0%) | 36 (21.4%) |
| $500,000 to $749,999 | 0 (0.0%) | 0 (0.0%) |
| $750,000 to $999,999 | 0 (0.0%) | 0 (0.0%) |
| $1,000,000 or more | 0 (0.0%) | 0 (0.0%) |
| Total | 214 (100.0%) | 168 (100.0%) |
Household Income by Mortgage Status in Reform
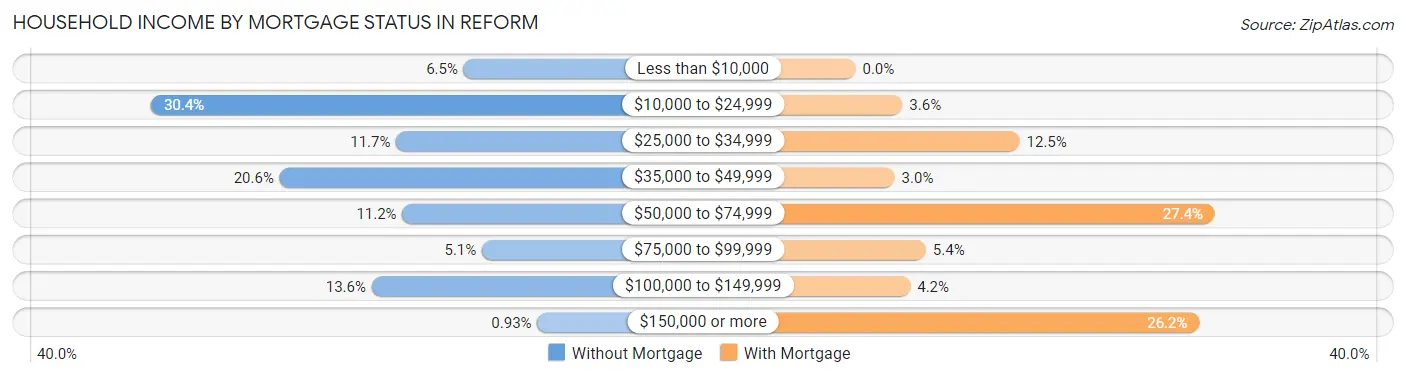
| Household Income | Without Mortgage | With Mortgage |
| Less than $10,000 | 14 (6.5%) | 0 (0.0%) |
| $10,000 to $24,999 | 65 (30.4%) | 6 (3.6%) |
| $25,000 to $34,999 | 25 (11.7%) | 21 (12.5%) |
| $35,000 to $49,999 | 44 (20.6%) | 5 (3.0%) |
| $50,000 to $74,999 | 24 (11.2%) | 46 (27.4%) |
| $75,000 to $99,999 | 11 (5.1%) | 9 (5.4%) |
| $100,000 to $149,999 | 29 (13.6%) | 7 (4.2%) |
| $150,000 or more | 2 (0.9%) | 44 (26.2%) |
| Total | 214 (100.0%) | 168 (100.0%) |
Property Value to Household Income Ratio in Reform
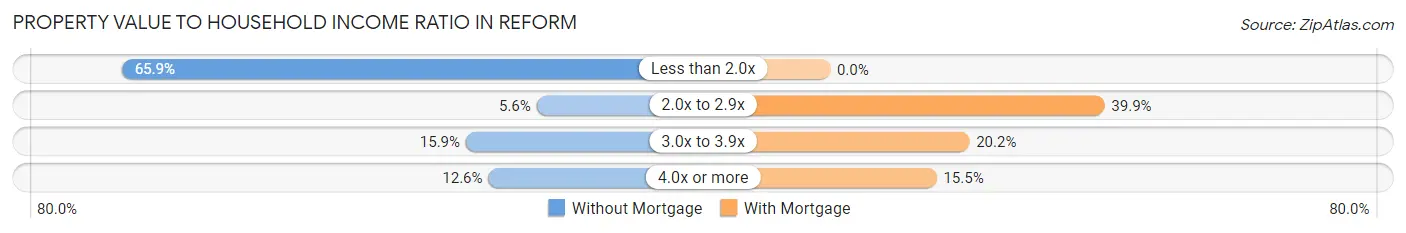
| Value-to-Income Ratio | Without Mortgage | With Mortgage |
| Less than 2.0x | 141 (65.9%) | 0 (0.0%) |
| 2.0x to 2.9x | 12 (5.6%) | 67 (39.9%) |
| 3.0x to 3.9x | 34 (15.9%) | 34 (20.2%) |
| 4.0x or more | 27 (12.6%) | 26 (15.5%) |
| Total | 214 (100.0%) | 168 (100.0%) |
Real Estate Taxes by Mortgage Status in Reform
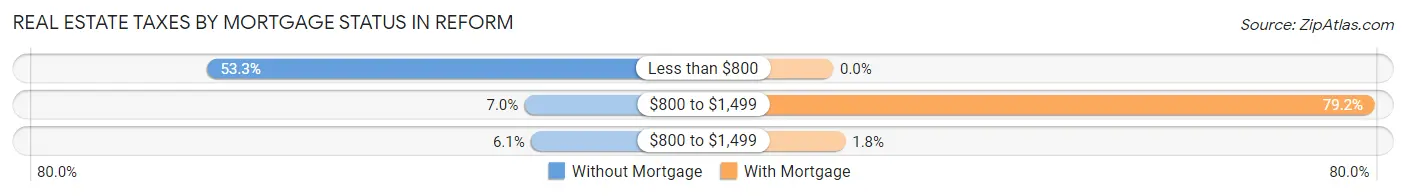
| Property Taxes | Without Mortgage | With Mortgage |
| Less than $800 | 114 (53.3%) | 0 (0.0%) |
| $800 to $1,499 | 15 (7.0%) | 133 (79.2%) |
| $800 to $1,499 | 13 (6.1%) | 3 (1.8%) |
| Total | 214 (100.0%) | 168 (100.0%) |
Health & Disability in Reform
Health Insurance Coverage by Age in Reform
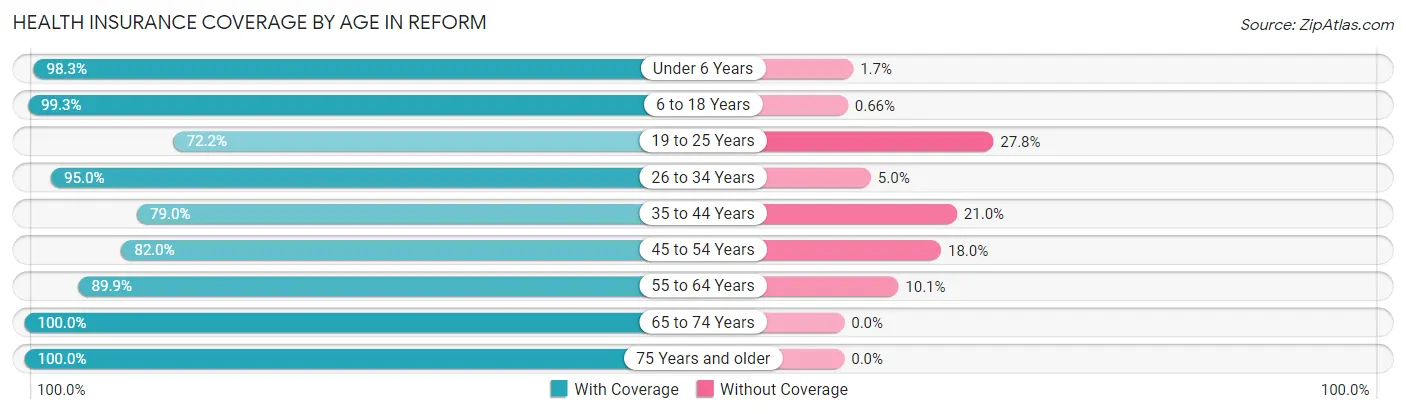
| Age Bracket | With Coverage | Without Coverage |
| Under 6 Years | 235 (98.3%) | 4 (1.7%) |
| 6 to 18 Years | 301 (99.3%) | 2 (0.7%) |
| 19 to 25 Years | 148 (72.2%) | 57 (27.8%) |
| 26 to 34 Years | 230 (95.0%) | 12 (5.0%) |
| 35 to 44 Years | 79 (79.0%) | 21 (21.0%) |
| 45 to 54 Years | 268 (82.0%) | 59 (18.0%) |
| 55 to 64 Years | 214 (89.9%) | 24 (10.1%) |
| 65 to 74 Years | 98 (100.0%) | 0 (0.0%) |
| 75 Years and older | 111 (100.0%) | 0 (0.0%) |
| Total | 1,684 (90.4%) | 179 (9.6%) |
Health Insurance Coverage by Citizenship Status in Reform
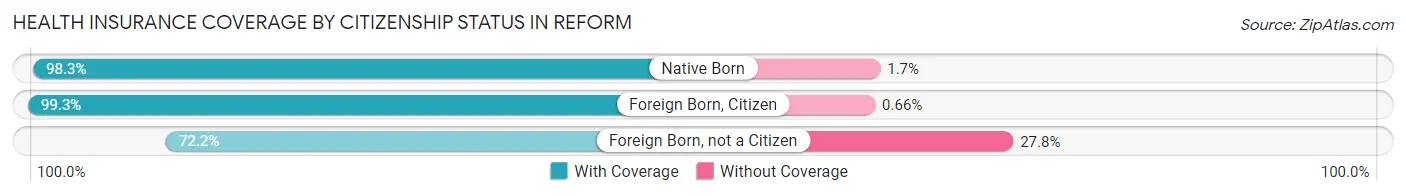
| Citizenship Status | With Coverage | Without Coverage |
| Native Born | 235 (98.3%) | 4 (1.7%) |
| Foreign Born, Citizen | 301 (99.3%) | 2 (0.7%) |
| Foreign Born, not a Citizen | 148 (72.2%) | 57 (27.8%) |
Health Insurance Coverage by Household Income in Reform
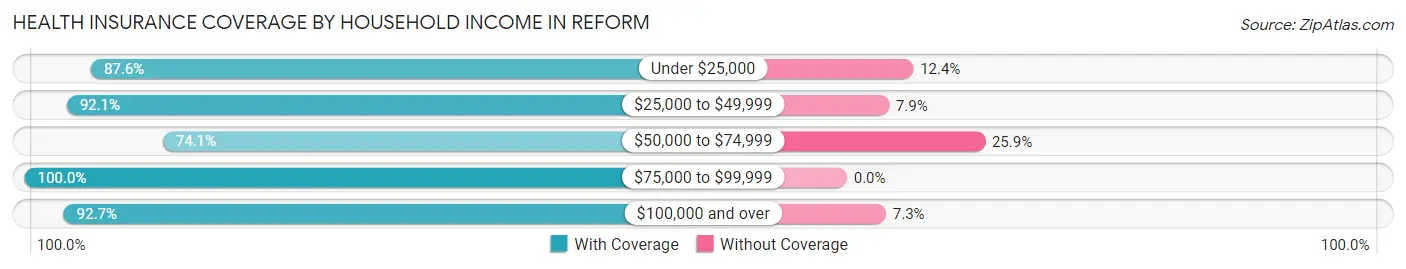
| Household Income | With Coverage | Without Coverage |
| Under $25,000 | 570 (87.6%) | 81 (12.4%) |
| $25,000 to $49,999 | 362 (92.1%) | 31 (7.9%) |
| $50,000 to $74,999 | 83 (74.1%) | 29 (25.9%) |
| $75,000 to $99,999 | 188 (100.0%) | 0 (0.0%) |
| $100,000 and over | 481 (92.7%) | 38 (7.3%) |
Public vs Private Health Insurance Coverage by Age in Reform
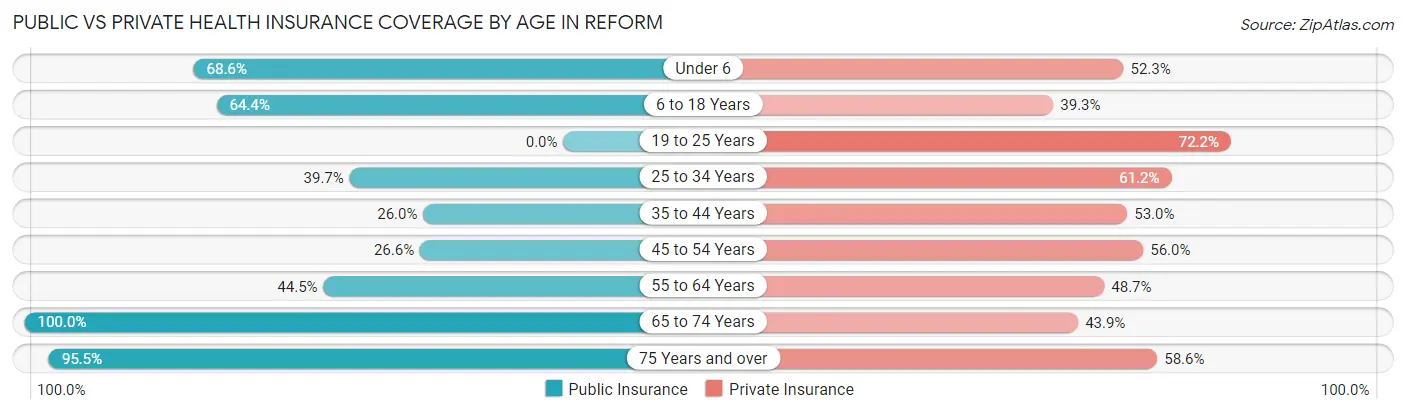
| Age Bracket | Public Insurance | Private Insurance |
| Under 6 | 164 (68.6%) | 125 (52.3%) |
| 6 to 18 Years | 195 (64.4%) | 119 (39.3%) |
| 19 to 25 Years | 0 (0.0%) | 148 (72.2%) |
| 25 to 34 Years | 96 (39.7%) | 148 (61.2%) |
| 35 to 44 Years | 26 (26.0%) | 53 (53.0%) |
| 45 to 54 Years | 87 (26.6%) | 183 (56.0%) |
| 55 to 64 Years | 106 (44.5%) | 116 (48.7%) |
| 65 to 74 Years | 98 (100.0%) | 43 (43.9%) |
| 75 Years and over | 106 (95.5%) | 65 (58.6%) |
| Total | 878 (47.1%) | 1,000 (53.7%) |
Disability Status by Sex by Age in Reform
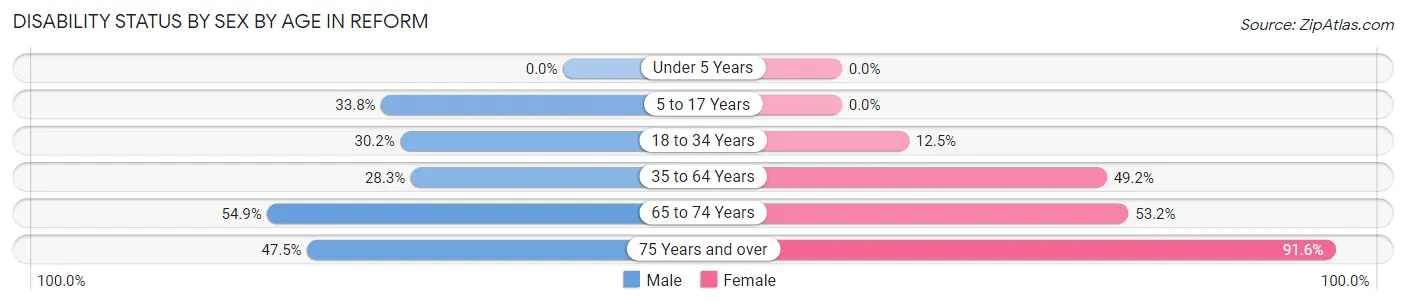
| Age Bracket | Male | Female |
| Under 5 Years | 0 (0.0%) | 0 (0.0%) |
| 5 to 17 Years | 52 (33.8%) | 0 (0.0%) |
| 18 to 34 Years | 68 (30.2%) | 37 (12.5%) |
| 35 to 64 Years | 84 (28.3%) | 181 (49.2%) |
| 65 to 74 Years | 28 (54.9%) | 25 (53.2%) |
| 75 Years and over | 19 (47.5%) | 65 (91.5%) |
Disability Class by Sex by Age in Reform
Disability Class: Hearing Difficulty
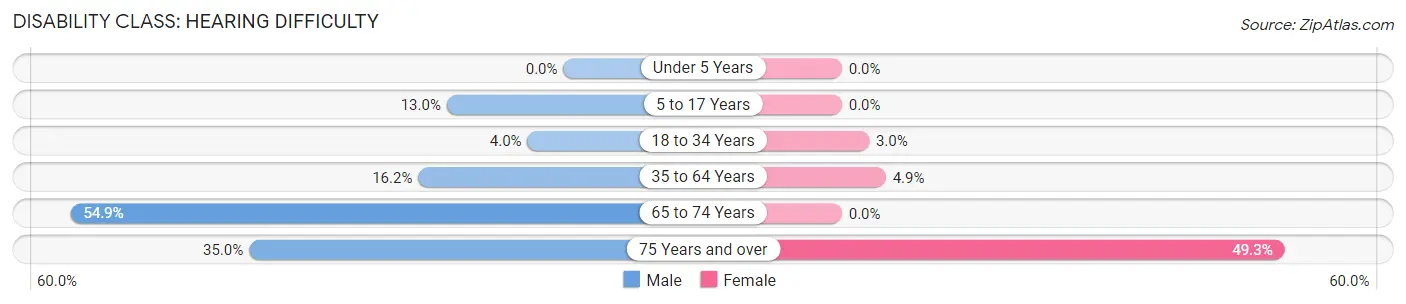
| Age Bracket | Male | Female |
| Under 5 Years | 0 (0.0%) | 0 (0.0%) |
| 5 to 17 Years | 20 (13.0%) | 0 (0.0%) |
| 18 to 34 Years | 9 (4.0%) | 9 (3.0%) |
| 35 to 64 Years | 48 (16.2%) | 18 (4.9%) |
| 65 to 74 Years | 28 (54.9%) | 0 (0.0%) |
| 75 Years and over | 14 (35.0%) | 35 (49.3%) |
Disability Class: Vision Difficulty
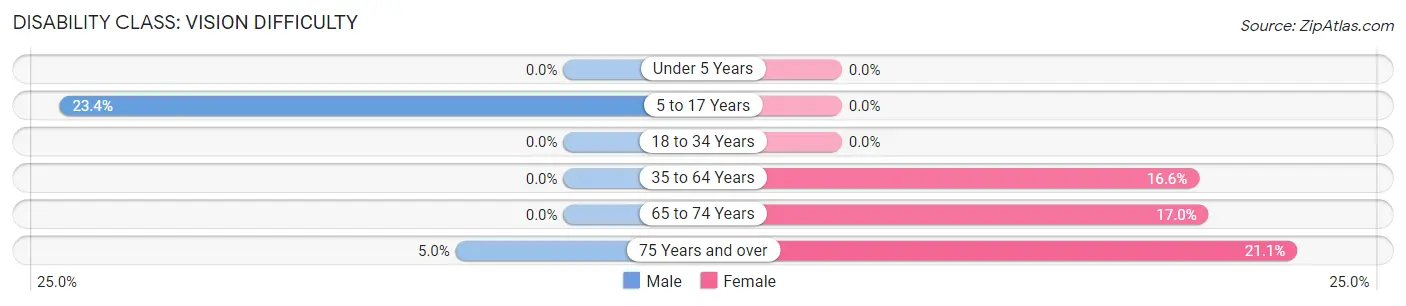
| Age Bracket | Male | Female |
| Under 5 Years | 0 (0.0%) | 0 (0.0%) |
| 5 to 17 Years | 36 (23.4%) | 0 (0.0%) |
| 18 to 34 Years | 0 (0.0%) | 0 (0.0%) |
| 35 to 64 Years | 0 (0.0%) | 61 (16.6%) |
| 65 to 74 Years | 0 (0.0%) | 8 (17.0%) |
| 75 Years and over | 2 (5.0%) | 15 (21.1%) |
Disability Class: Cognitive Difficulty
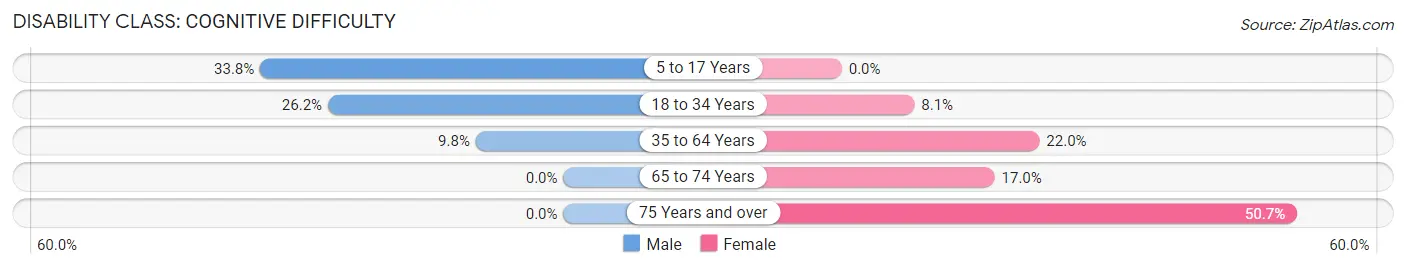
| Age Bracket | Male | Female |
| 5 to 17 Years | 52 (33.8%) | 0 (0.0%) |
| 18 to 34 Years | 59 (26.2%) | 24 (8.1%) |
| 35 to 64 Years | 29 (9.8%) | 81 (22.0%) |
| 65 to 74 Years | 0 (0.0%) | 8 (17.0%) |
| 75 Years and over | 0 (0.0%) | 36 (50.7%) |
Disability Class: Ambulatory Difficulty
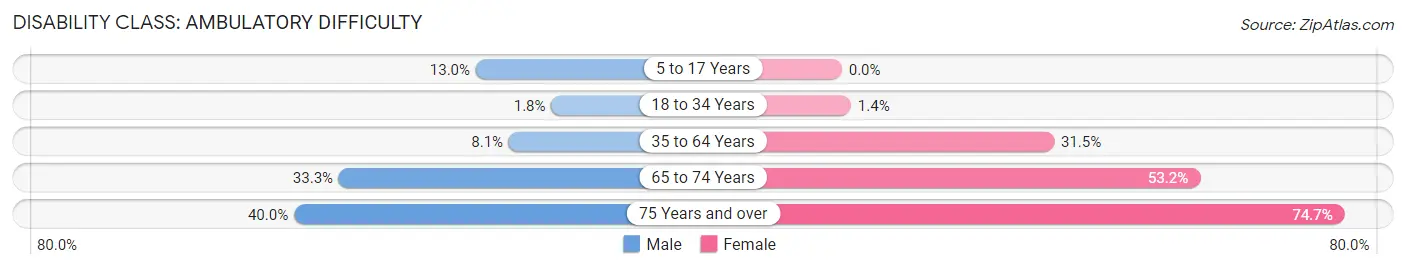
| Age Bracket | Male | Female |
| 5 to 17 Years | 20 (13.0%) | 0 (0.0%) |
| 18 to 34 Years | 4 (1.8%) | 4 (1.3%) |
| 35 to 64 Years | 24 (8.1%) | 116 (31.5%) |
| 65 to 74 Years | 17 (33.3%) | 25 (53.2%) |
| 75 Years and over | 16 (40.0%) | 53 (74.7%) |
Disability Class: Self-Care Difficulty
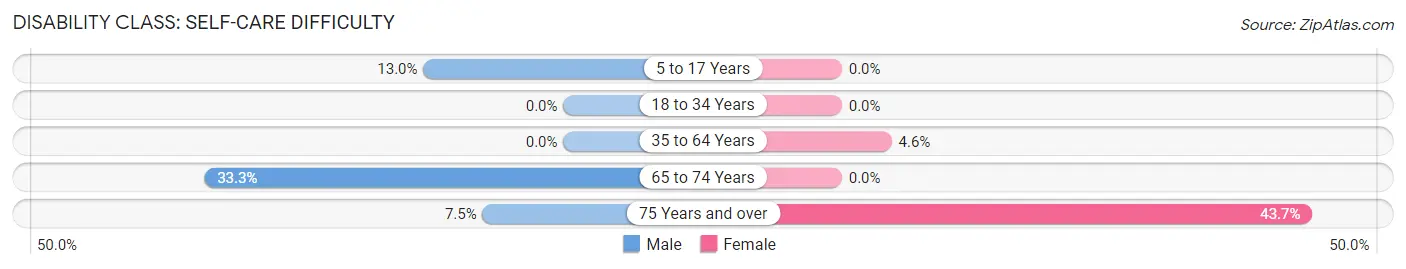
| Age Bracket | Male | Female |
| 5 to 17 Years | 20 (13.0%) | 0 (0.0%) |
| 18 to 34 Years | 0 (0.0%) | 0 (0.0%) |
| 35 to 64 Years | 0 (0.0%) | 17 (4.6%) |
| 65 to 74 Years | 17 (33.3%) | 0 (0.0%) |
| 75 Years and over | 3 (7.5%) | 31 (43.7%) |
Technology Access in Reform
Computing Device Access in Reform
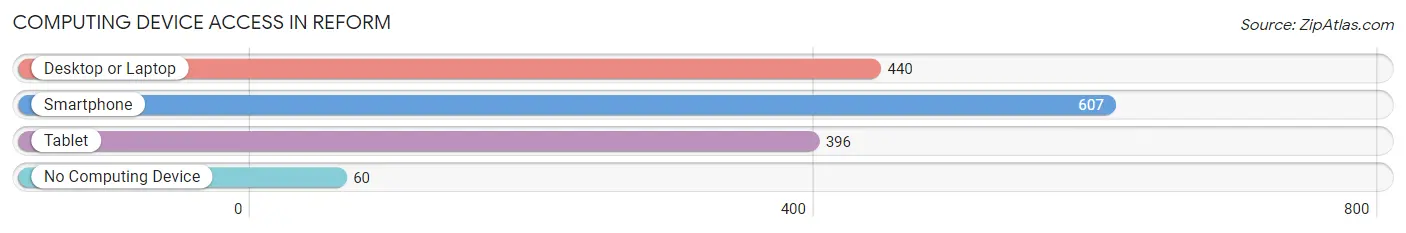
| Device Type | # Households | % Households |
| Desktop or Laptop | 440 | 60.0% |
| Smartphone | 607 | 82.7% |
| Tablet | 396 | 53.9% |
| No Computing Device | 60 | 8.2% |
| Total | 734 | 100.0% |
Internet Access in Reform
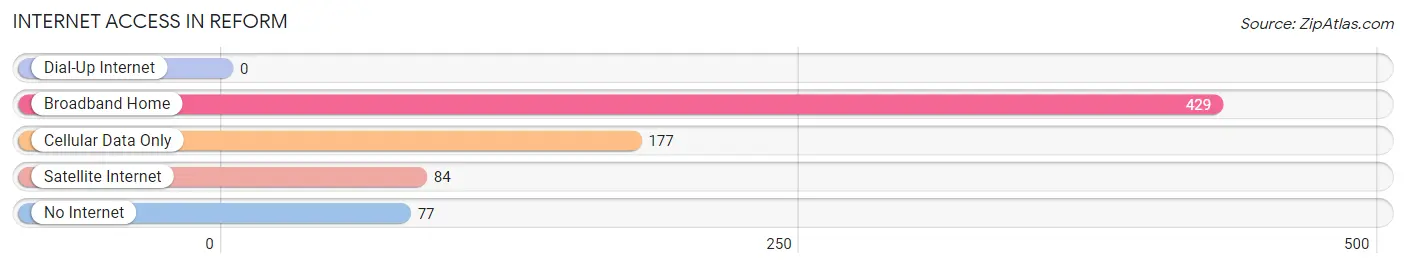
| Internet Type | # Households | % Households |
| Dial-Up Internet | 0 | 0.0% |
| Broadband Home | 429 | 58.5% |
| Cellular Data Only | 177 | 24.1% |
| Satellite Internet | 84 | 11.4% |
| No Internet | 77 | 10.5% |
| Total | 734 | 100.0% |
Reform Summary
Alabama is a state located in the southeastern region of the United States. It is bordered by Tennessee to the north, Georgia to the east, Florida and the Gulf of Mexico to the south, and Mississippi to the west. Alabama is the 30th largest state in the United States, with an area of 52,419 square miles, and the 24th most populous, with a population of 4,858,979 as of 2019. The state capital is Montgomery, and the largest city is Birmingham.
History
Alabama was first inhabited by Native American tribes, including the Cherokee, Chickasaw, Choctaw, Creek, and Seminole. The first Europeans to explore the area were Spanish explorers in 1540. The area was later colonized by the French in 1702 and the British in 1763. In 1817, Alabama became part of the Mississippi Territory, and in 1819, it became the 22nd state admitted to the Union.
During the Civil War, Alabama was a Confederate state, and Montgomery served as the Confederate capital from 1861 to 1865. After the war, Alabama was readmitted to the Union in 1868. During the Reconstruction era, the state was occupied by Union troops and was subject to martial law.
In the late 19th century, Alabama experienced a period of industrialization and economic growth, and the state's population increased significantly. In 1901, the state adopted a new constitution that disfranchised African Americans and effectively ended their political power in the state. This constitution remained in effect until the mid-1960s, when it was replaced by a new constitution that restored voting rights to African Americans.
Geography
Alabama is located in the southeastern region of the United States. It is bordered by Tennessee to the north, Georgia to the east, Florida and the Gulf of Mexico to the south, and Mississippi to the west. The state has a total area of 52,419 square miles, making it the 30th largest state in the country.
Alabama is divided into 67 counties and contains four major geographic regions: the Appalachian Mountains in the northeast, the Piedmont Plateau in the east, the Black Belt Prairie in the central part of the state, and the Gulf Coastal Plain in the south. The highest point in the state is Mount Cheaha, which has an elevation of 2,407 feet. The state's major rivers include the Alabama, Tombigbee, and Tennessee.
Economy
Alabama's economy is largely based on agriculture, manufacturing, and services. The state's major agricultural products include poultry, eggs, cattle, cotton, peanuts, and soybeans. The state is also a major producer of timber and is home to several large paper mills.
Manufacturing is a major part of the state's economy, with major industries including automotive, aerospace, steel, and chemical production. Alabama is also home to several military bases, which contribute significantly to the state's economy.
The state's service sector is also important, with major industries including tourism, healthcare, and finance. Alabama is home to several major universities, which contribute to the state's economy through research and development.
Demographics
As of 2019, Alabama had a population of 4,858,979, making it the 24th most populous state in the country. The state's population is largely concentrated in the cities of Birmingham, Montgomery, and Mobile.
The state's population is racially diverse, with the largest racial groups being white (68.5%), African American (26.2%), and Hispanic or Latino (3.9%). The state's population is also diverse in terms of religion, with the largest religious groups being Protestant (54.2%), Catholic (17.2%), and unaffiliated (17.1%).
Alabama has a median household income of $48,123, which is slightly lower than the national median of $53,482. The state's poverty rate is 17.3%, which is slightly higher than the national rate of 13.1%.
Common Questions
What is the Total Population of Reform?
Total Population of Reform is 1,913.
What is the Total Male Population of Reform?
Total Male Population of Reform is 891.
What is the Total Female Population of Reform?
Total Female Population of Reform is 1,022.
What is the Ratio of Males per 100 Females in Reform?
There are 87.18 Males per 100 Females in Reform.
What is the Ratio of Females per 100 Males in Reform?
There are 114.70 Females per 100 Males in Reform.
What is the Median Population Age in Reform?
Median Population Age in Reform is 34.5 Years.
What is the Average Family Size in Reform
Average Family Size in Reform is 3.4 People.
What is the Average Household Size in Reform
Average Household Size in Reform is 2.5 People.
What is Per Capita Income in Reform?
Per Capita income in Reform is $20,810.
What is the Median Family Income in Reform?
Median Family Income in Reform is $46,875.
What is the Median Household income in Reform?
Median Household Income in Reform is $32,375.
What is Income or Wage Gap in Reform?
Income or Wage Gap in Reform is 20.1%.
Women in Reform earn 79.9 cents for every dollar earned by a man.
What is Inequality or Gini Index in Reform?
Inequality or Gini Index in Reform is 0.52.
How Large is the Labor Force in Reform?
There are 762 People in the Labor Forcein in Reform.
What is the Percentage of People in the Labor Force in Reform?
50.9% of People are in the Labor Force in Reform.
What is the Unemployment Rate in Reform?
Unemployment Rate in Reform is 3.5%.