Prichard, AL
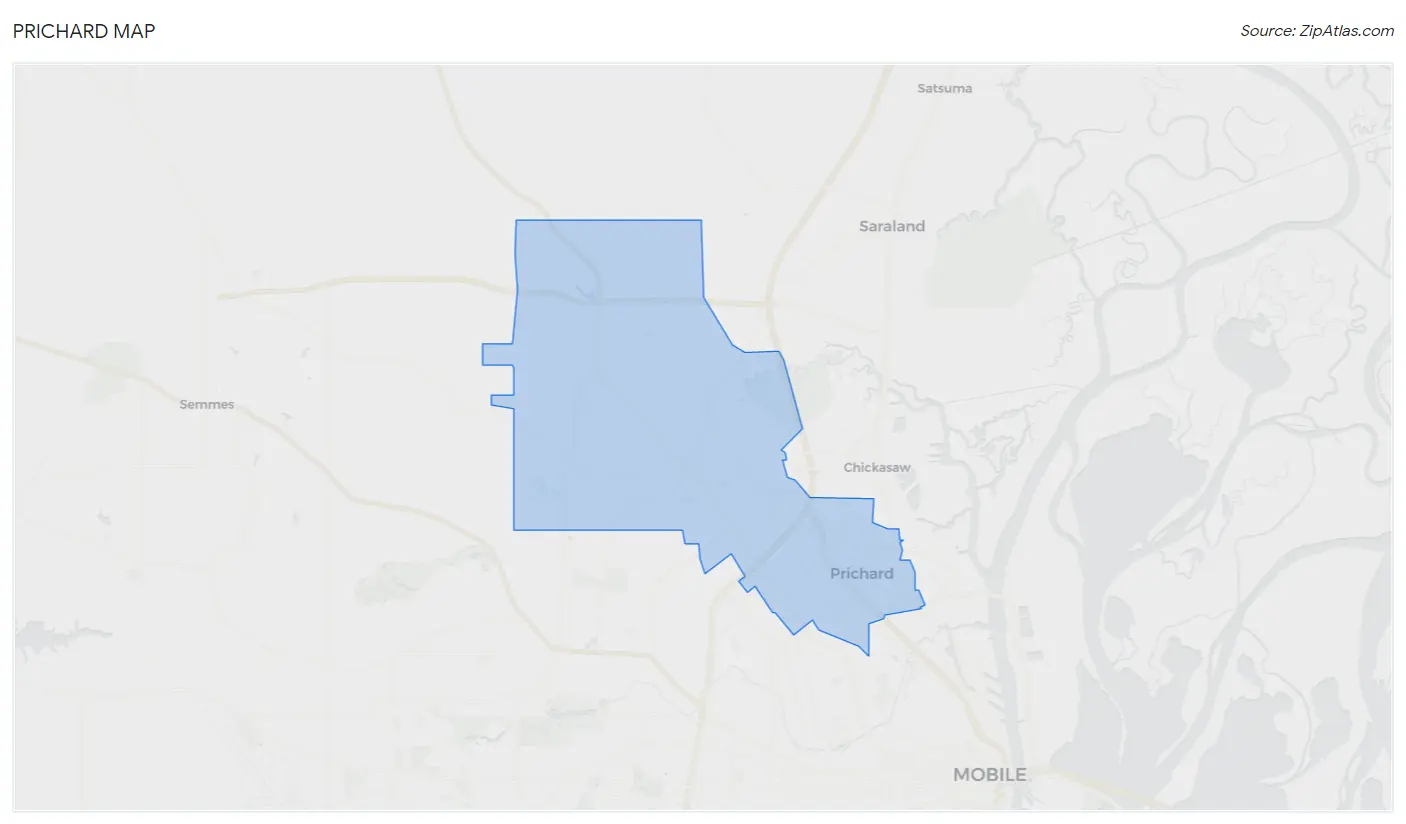
Prichard Map
Prichard Overview
19,353
TOTAL POPULATION
8,753
MALE POPULATION
10,600
FEMALE POPULATION
82.58
MALES / 100 FEMALES
121.10
FEMALES / 100 MALES
37.0
MEDIAN AGE
3.7
AVG FAMILY SIZE
2.8
AVG HOUSEHOLD SIZE
$16,937
PER CAPITA INCOME
$45,192
AVG FAMILY INCOME
$36,110
AVG HOUSEHOLD INCOME
12.3%
WAGE / INCOME GAP [ % ]
87.7¢/ $1
WAGE / INCOME GAP [ $ ]
0.44
INEQUALITY / GINI INDEX
6,803
LABOR FORCE [ PEOPLE ]
46.1%
PERCENT IN LABOR FORCE
10.5%
UNEMPLOYMENT RATE
Prichard Area Codes
Race in Prichard
The most populous races in Prichard are Black / African American (17,432 | 90.1%), White / Caucasian (1,722 | 8.9%), and Hispanic or Latino (217 | 1.1%).
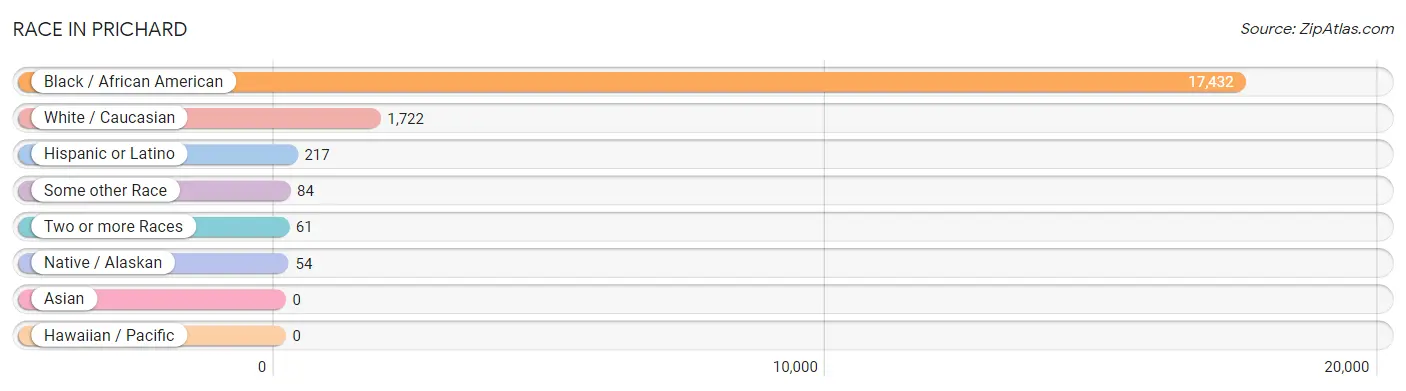
| Race | # Population | % Population |
| Asian | 0 | 0.0% |
| Black / African American | 17,432 | 90.1% |
| Hawaiian / Pacific | 0 | 0.0% |
| Hispanic or Latino | 217 | 1.1% |
| Native / Alaskan | 54 | 0.3% |
| White / Caucasian | 1,722 | 8.9% |
| Two or more Races | 61 | 0.3% |
| Some other Race | 84 | 0.4% |
| Total | 19,353 | 100.0% |
Ancestry in Prichard
The most populous ancestries reported in Prichard are American (696 | 3.6%), Irish (256 | 1.3%), Subsaharan African (239 | 1.2%), African (206 | 1.1%), and German (197 | 1.0%), together accounting for 8.2% of all Prichard residents.
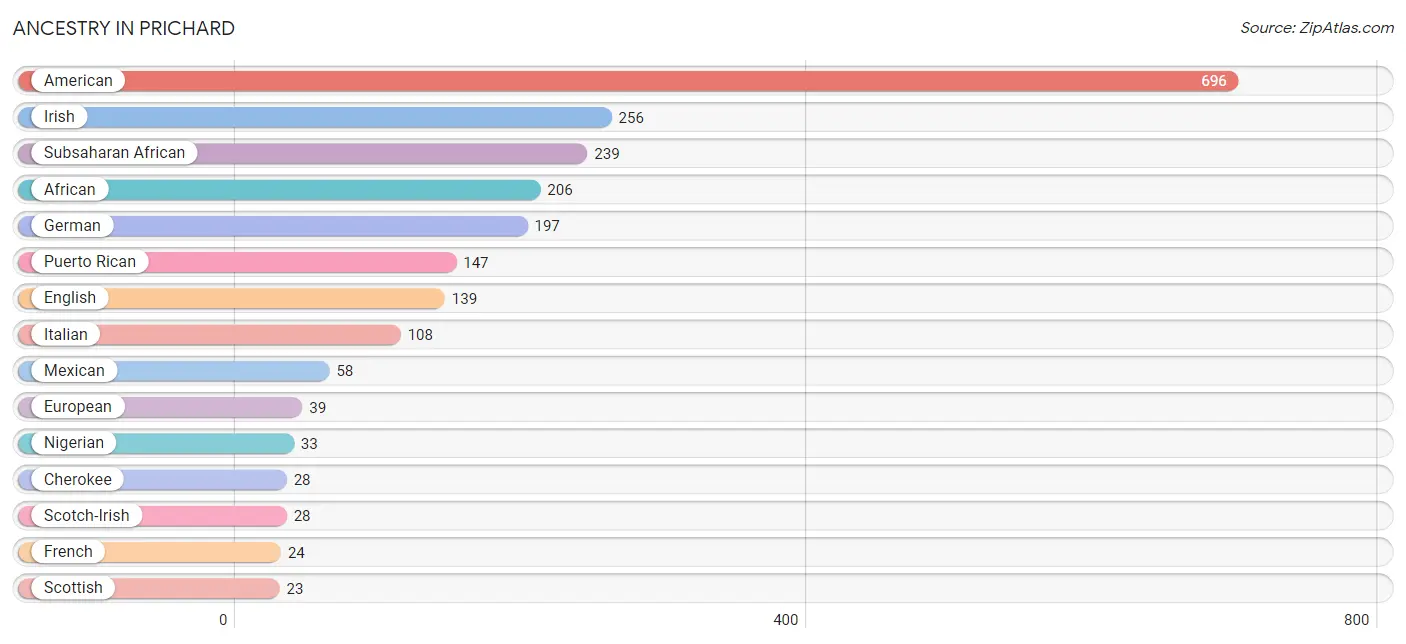
| Ancestry | # Population | % Population |
| African | 206 | 1.1% |
| American | 696 | 3.6% |
| Arab | 18 | 0.1% |
| Cherokee | 28 | 0.1% |
| Choctaw | 16 | 0.1% |
| Creek | 13 | 0.1% |
| Dutch | 6 | 0.0% |
| English | 139 | 0.7% |
| European | 39 | 0.2% |
| French | 24 | 0.1% |
| German | 197 | 1.0% |
| Greek | 14 | 0.1% |
| Irish | 256 | 1.3% |
| Italian | 108 | 0.6% |
| Korean | 1 | 0.0% |
| Lebanese | 1 | 0.0% |
| Mexican | 58 | 0.3% |
| Moroccan | 17 | 0.1% |
| Nigerian | 33 | 0.2% |
| Polish | 13 | 0.1% |
| Portuguese | 3 | 0.0% |
| Puerto Rican | 147 | 0.8% |
| Scotch-Irish | 28 | 0.1% |
| Scottish | 23 | 0.1% |
| Spaniard | 12 | 0.1% |
| Subsaharan African | 239 | 1.2% | View All 26 Rows |
Immigrants in Prichard
The most numerous immigrant groups reported in Prichard came from Africa (5 | 0.0%), Middle Africa (5 | 0.0%), Zaire (5 | 0.0%), Caribbean (2 | 0.0%), and Jamaica (2 | 0.0%), together accounting for 0.1% of all Prichard residents.
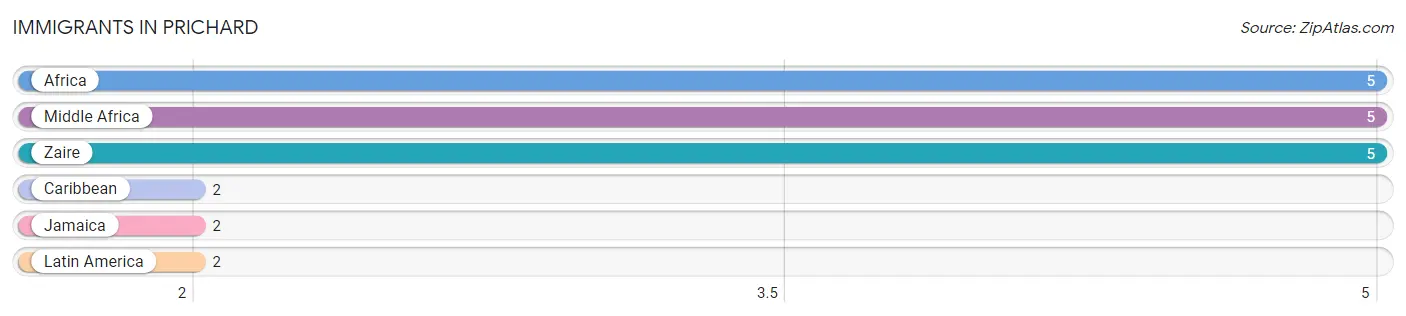
| Immigration Origin | # Population | % Population |
| Africa | 5 | 0.0% |
| Caribbean | 2 | 0.0% |
| Jamaica | 2 | 0.0% |
| Latin America | 2 | 0.0% |
| Middle Africa | 5 | 0.0% |
| Zaire | 5 | 0.0% | View All 6 Rows |
Sex and Age in Prichard
Sex and Age in Prichard
The most populous age groups in Prichard are 10 to 14 Years (918 | 10.5%) for men and 10 to 14 Years (1,008 | 9.5%) for women.
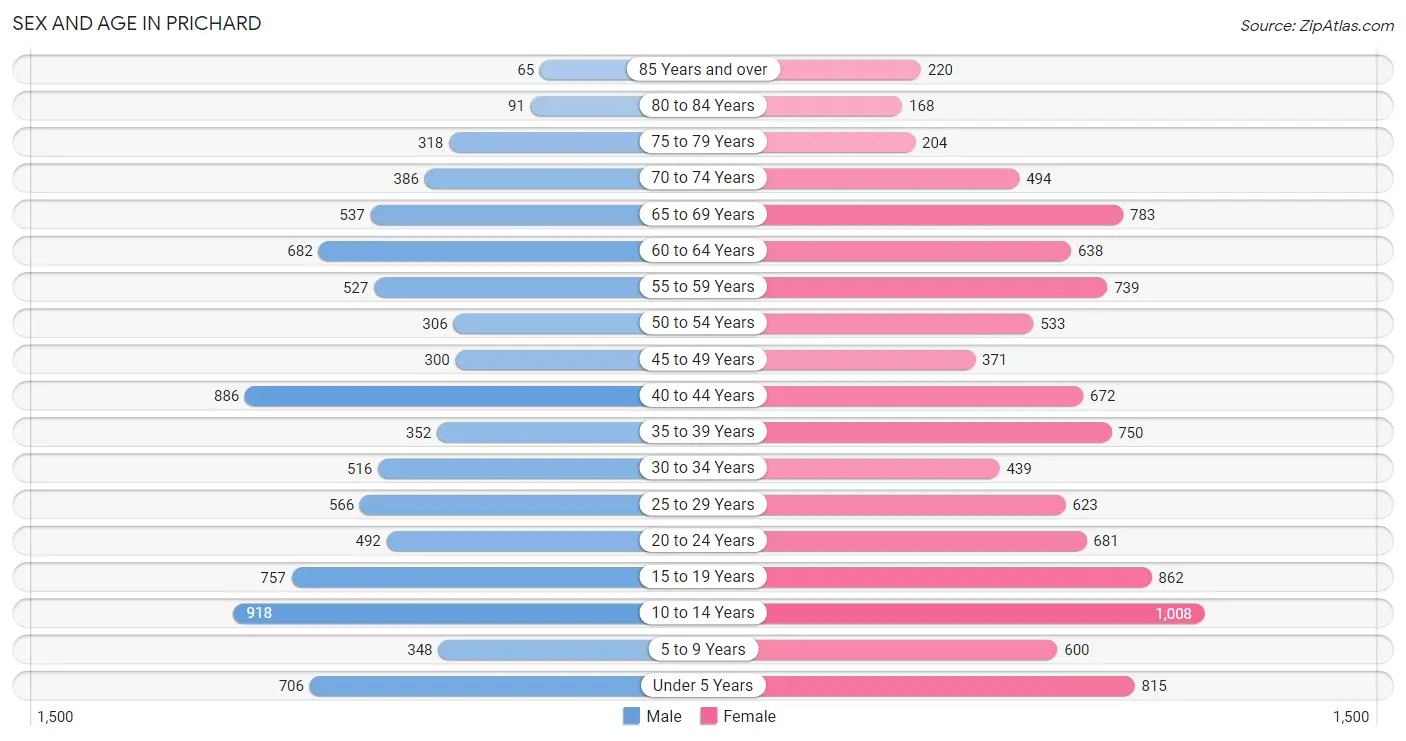
| Age Bracket | Male | Female |
| Under 5 Years | 706 (8.1%) | 815 (7.7%) |
| 5 to 9 Years | 348 (4.0%) | 600 (5.7%) |
| 10 to 14 Years | 918 (10.5%) | 1,008 (9.5%) |
| 15 to 19 Years | 757 (8.6%) | 862 (8.1%) |
| 20 to 24 Years | 492 (5.6%) | 681 (6.4%) |
| 25 to 29 Years | 566 (6.5%) | 623 (5.9%) |
| 30 to 34 Years | 516 (5.9%) | 439 (4.1%) |
| 35 to 39 Years | 352 (4.0%) | 750 (7.1%) |
| 40 to 44 Years | 886 (10.1%) | 672 (6.3%) |
| 45 to 49 Years | 300 (3.4%) | 371 (3.5%) |
| 50 to 54 Years | 306 (3.5%) | 533 (5.0%) |
| 55 to 59 Years | 527 (6.0%) | 739 (7.0%) |
| 60 to 64 Years | 682 (7.8%) | 638 (6.0%) |
| 65 to 69 Years | 537 (6.1%) | 783 (7.4%) |
| 70 to 74 Years | 386 (4.4%) | 494 (4.7%) |
| 75 to 79 Years | 318 (3.6%) | 204 (1.9%) |
| 80 to 84 Years | 91 (1.0%) | 168 (1.6%) |
| 85 Years and over | 65 (0.7%) | 220 (2.1%) |
| Total | 8,753 (100.0%) | 10,600 (100.0%) |
Families and Households in Prichard
Median Family Size in Prichard
The median family size in Prichard is 3.69 persons per family, with single female/mother families (1,949 | 47.6%) accounting for the largest median family size of 3.95 persons per family. On the other hand, single male/father families (309 | 7.5%) represent the smallest median family size with 3.06 persons per family.
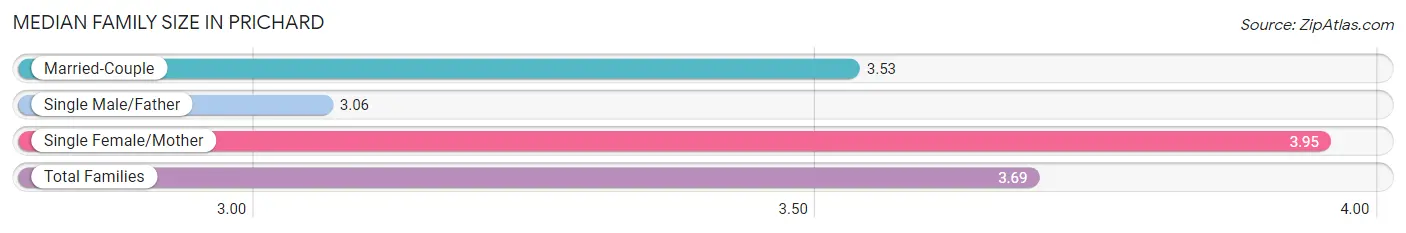
| Family Type | # Families | Family Size |
| Married-Couple | 1,839 (44.9%) | 3.53 |
| Single Male/Father | 309 (7.5%) | 3.06 |
| Single Female/Mother | 1,949 (47.6%) | 3.95 |
| Total Families | 4,097 (100.0%) | 3.69 |
Median Household Size in Prichard
The median household size in Prichard is 2.75 persons per household, with single female/mother households (1,949 | 28.9%) accounting for the largest median household size of 4.21 persons per household. non-family households (2,650 | 39.3%) represent the smallest median household size with 1.08 persons per household.
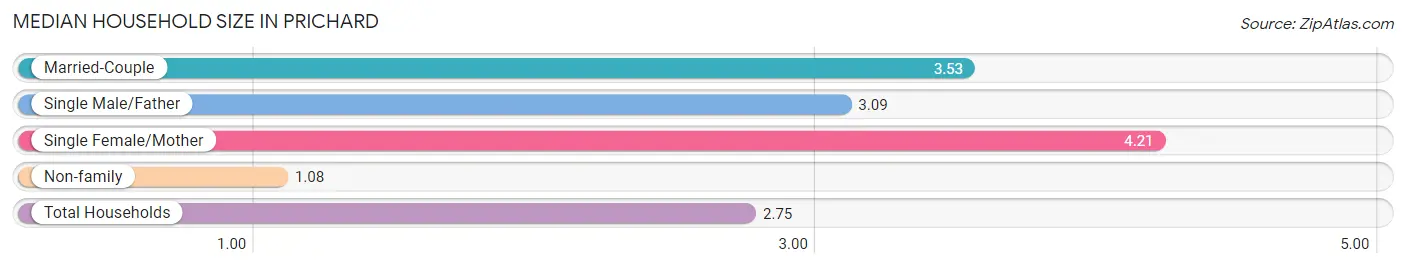
| Household Type | # Households | Household Size |
| Married-Couple | 1,839 (27.3%) | 3.53 |
| Single Male/Father | 309 (4.6%) | 3.09 |
| Single Female/Mother | 1,949 (28.9%) | 4.21 |
| Non-family | 2,650 (39.3%) | 1.08 |
| Total Households | 6,747 (100.0%) | 2.75 |
Household Size by Marriage Status in Prichard
Out of a total of 6,747 households in Prichard, 4,097 (60.7%) are family households, while 2,650 (39.3%) are nonfamily households. The most numerous type of family households are 2-person households, comprising 1,568, and the most common type of nonfamily households are 1-person households, comprising 2,483.
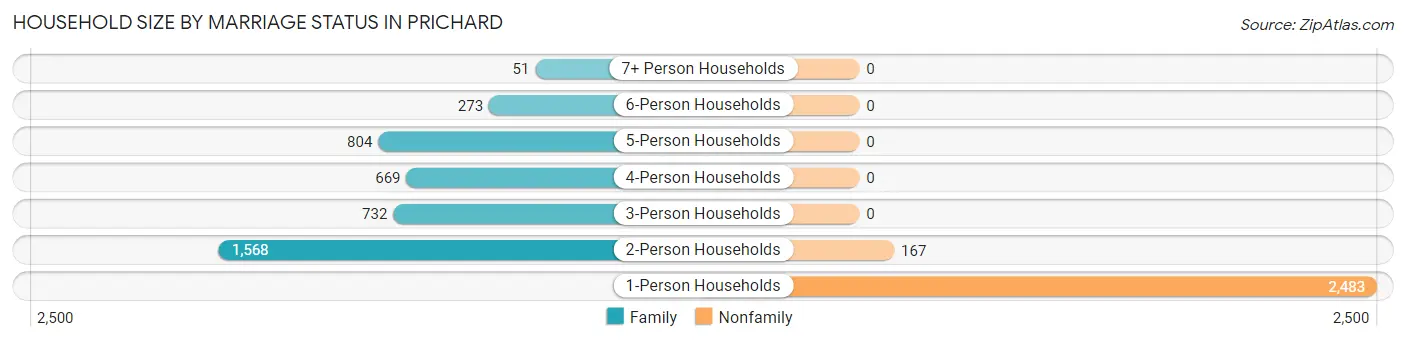
| Household Size | Family Households | Nonfamily Households |
| 1-Person Households | - | 2,483 (36.8%) |
| 2-Person Households | 1,568 (23.2%) | 167 (2.5%) |
| 3-Person Households | 732 (10.8%) | 0 (0.0%) |
| 4-Person Households | 669 (9.9%) | 0 (0.0%) |
| 5-Person Households | 804 (11.9%) | 0 (0.0%) |
| 6-Person Households | 273 (4.1%) | 0 (0.0%) |
| 7+ Person Households | 51 (0.8%) | 0 (0.0%) |
| Total | 4,097 (60.7%) | 2,650 (39.3%) |
Female Fertility in Prichard
Fertility by Age in Prichard
Average fertility rate in Prichard is 87.0 births per 1,000 women. Women in the age bracket of 20 to 34 years have the highest fertility rate with 161.0 births per 1,000 women. Women in the age bracket of 20 to 34 years acount for 71.4% of all women with births.
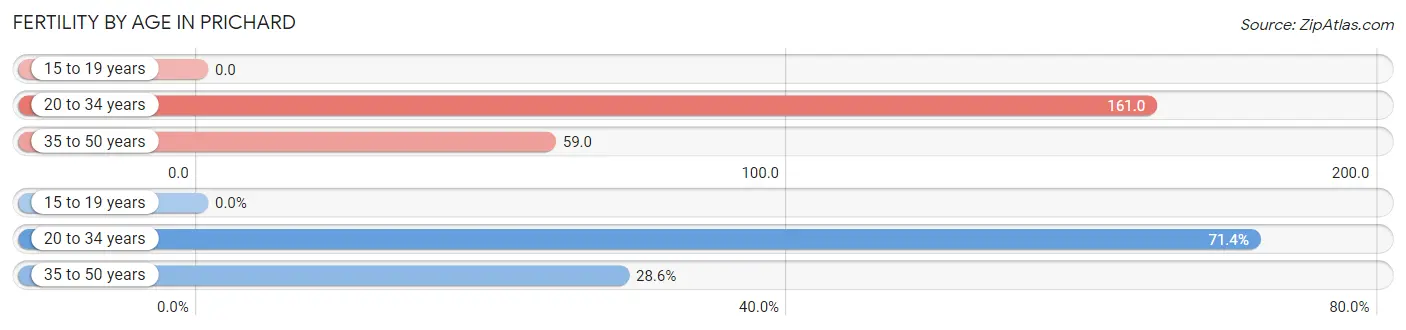
| Age Bracket | Women with Births | Births / 1,000 Women |
| 15 to 19 years | 0 (0.0%) | 0.0 |
| 20 to 34 years | 280 (71.4%) | 161.0 |
| 35 to 50 years | 112 (28.6%) | 59.0 |
| Total | 392 (100.0%) | 87.0 |
Fertility by Age by Marriage Status in Prichard
19.6% of women with births (392) in Prichard are married. The highest percentage of unmarried women with births falls into 20 to 34 years age bracket with 89.6% of them unmarried at the time of birth, while the lowest percentage of unmarried women with births belong to 35 to 50 years age bracket with 57.1% of them unmarried.
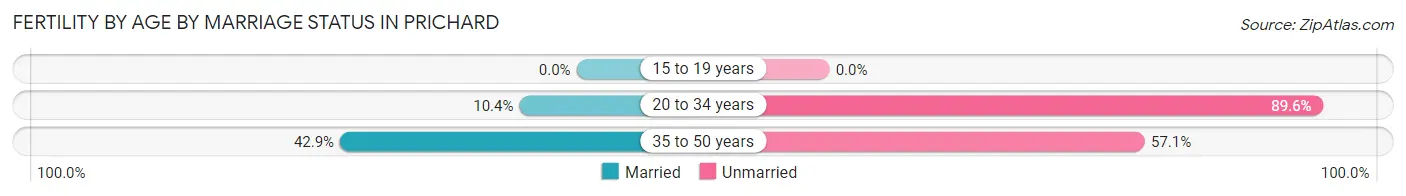
| Age Bracket | Married | Unmarried |
| 15 to 19 years | 0 (0.0%) | 0 (0.0%) |
| 20 to 34 years | 29 (10.4%) | 251 (89.6%) |
| 35 to 50 years | 48 (42.9%) | 64 (57.1%) |
| Total | 77 (19.6%) | 315 (80.4%) |
Fertility by Education in Prichard
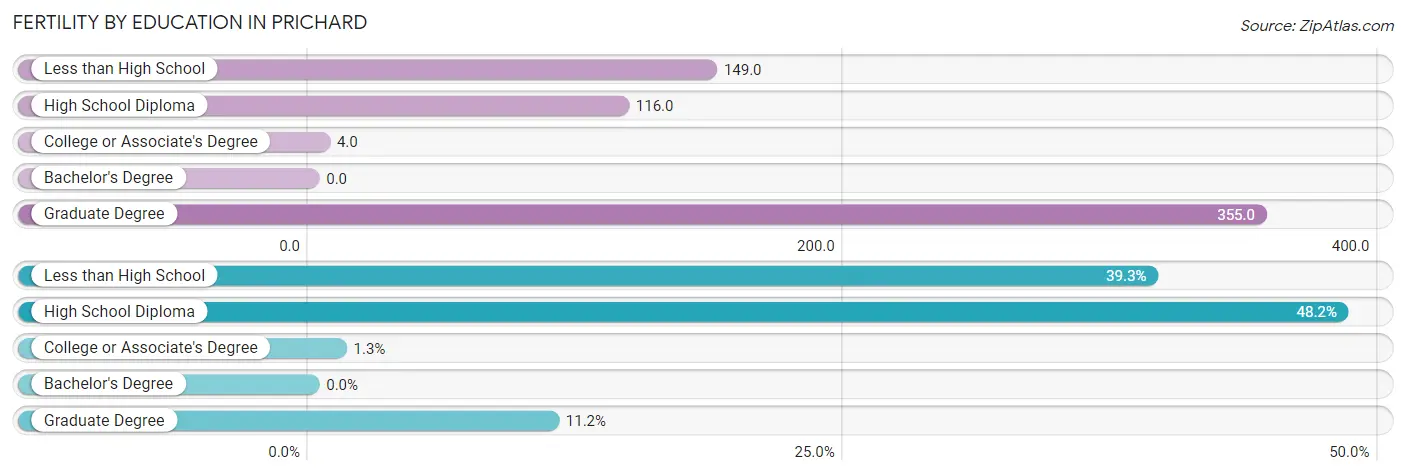
| Educational Attainment | Women with Births | Births / 1,000 Women |
| Less than High School | 154 (39.3%) | 149.0 |
| High School Diploma | 189 (48.2%) | 116.0 |
| College or Associate's Degree | 5 (1.3%) | 4.0 |
| Bachelor's Degree | 0 (0.0%) | 0.0 |
| Graduate Degree | 44 (11.2%) | 355.0 |
| Total | 392 (100.0%) | 87.0 |
Fertility by Education by Marriage Status in Prichard
80.4% of women with births in Prichard are unmarried. Women with the educational attainment of high school diploma are most likely to be married with 25.4% of them married at childbirth, while women with the educational attainment of college or associate's degree are least likely to be married with 100.0% of them unmarried at childbirth.
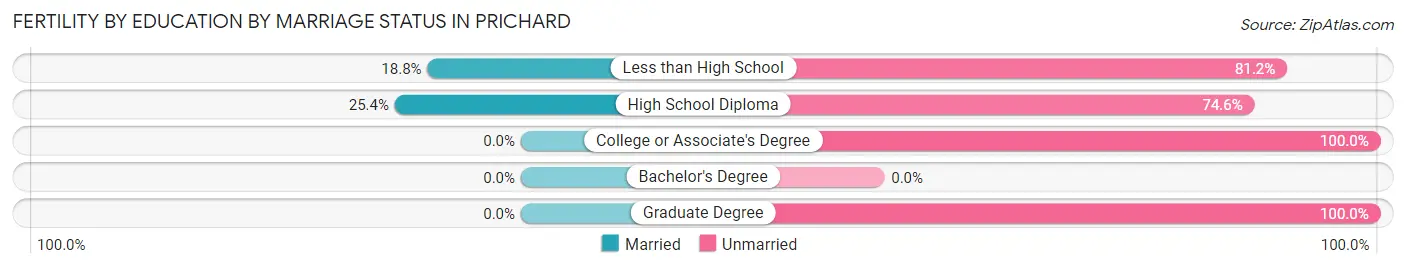
| Educational Attainment | Married | Unmarried |
| Less than High School | 29 (18.8%) | 125 (81.2%) |
| High School Diploma | 48 (25.4%) | 141 (74.6%) |
| College or Associate's Degree | 0 (0.0%) | 5 (100.0%) |
| Bachelor's Degree | 0 (0.0%) | 0 (0.0%) |
| Graduate Degree | 0 (0.0%) | 44 (100.0%) |
| Total | 77 (19.6%) | 315 (80.4%) |
Income in Prichard
Income Overview in Prichard
Per Capita Income in Prichard is $16,937, while median incomes of families and households are $45,192 and $36,110 respectively.
| Characteristic | Number | Measure |
| Per Capita Income | 19,353 | $16,937 |
| Median Family Income | 4,097 | $45,192 |
| Mean Family Income | 4,097 | $53,195 |
| Median Household Income | 6,747 | $36,110 |
| Mean Household Income | 6,747 | $44,699 |
| Income Deficit | 4,097 | $0 |
| Wage / Income Gap (%) | 19,353 | 12.28% |
| Wage / Income Gap ($) | 19,353 | 87.72¢ per $1 |
| Gini / Inequality Index | 19,353 | 0.44 |
Earnings by Sex in Prichard
Average Earnings in Prichard are $28,038, $29,985 for men and $26,302 for women, a difference of 12.3%.
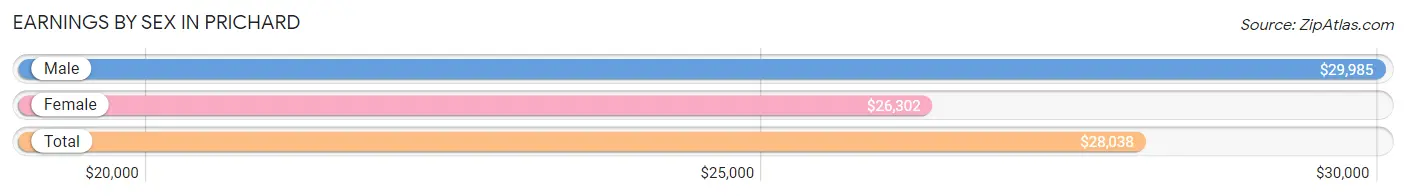
| Sex | Number | Average Earnings |
| Male | 3,198 (46.8%) | $29,985 |
| Female | 3,639 (53.2%) | $26,302 |
| Total | 6,837 (100.0%) | $28,038 |
Earnings by Sex by Income Bracket in Prichard
The most common earnings brackets in Prichard are $55,000 to $64,999 for men (390 | 12.2%) and $30,000 to $34,999 for women (613 | 16.9%).
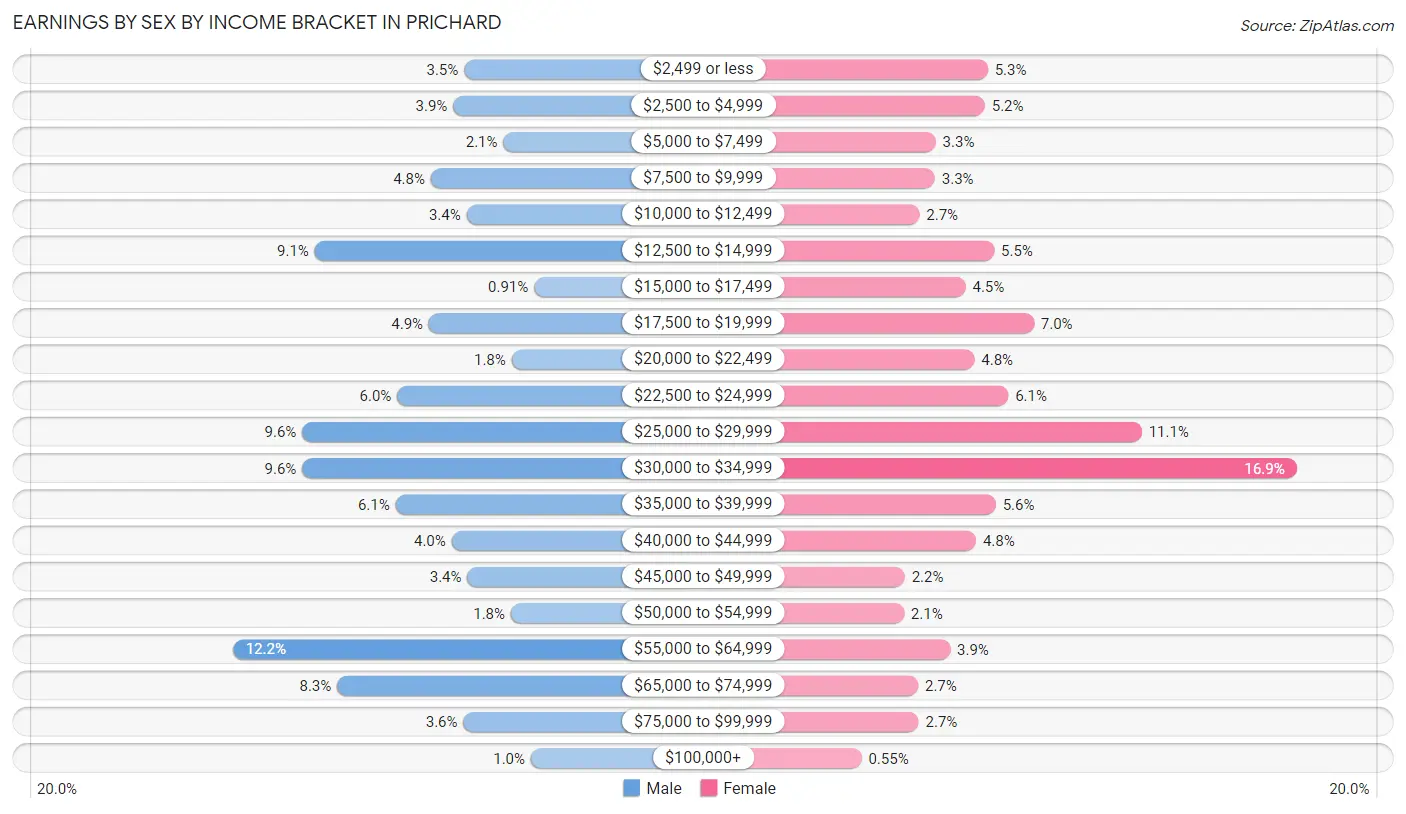
| Income | Male | Female |
| $2,499 or less | 113 (3.5%) | 192 (5.3%) |
| $2,500 to $4,999 | 126 (3.9%) | 188 (5.2%) |
| $5,000 to $7,499 | 66 (2.1%) | 121 (3.3%) |
| $7,500 to $9,999 | 153 (4.8%) | 120 (3.3%) |
| $10,000 to $12,499 | 110 (3.4%) | 99 (2.7%) |
| $12,500 to $14,999 | 292 (9.1%) | 201 (5.5%) |
| $15,000 to $17,499 | 29 (0.9%) | 162 (4.4%) |
| $17,500 to $19,999 | 155 (4.9%) | 255 (7.0%) |
| $20,000 to $22,499 | 56 (1.8%) | 174 (4.8%) |
| $22,500 to $24,999 | 193 (6.0%) | 220 (6.0%) |
| $25,000 to $29,999 | 307 (9.6%) | 402 (11.1%) |
| $30,000 to $34,999 | 307 (9.6%) | 613 (16.9%) |
| $35,000 to $39,999 | 195 (6.1%) | 203 (5.6%) |
| $40,000 to $44,999 | 128 (4.0%) | 176 (4.8%) |
| $45,000 to $49,999 | 109 (3.4%) | 79 (2.2%) |
| $50,000 to $54,999 | 57 (1.8%) | 78 (2.1%) |
| $55,000 to $64,999 | 390 (12.2%) | 141 (3.9%) |
| $65,000 to $74,999 | 265 (8.3%) | 97 (2.7%) |
| $75,000 to $99,999 | 114 (3.6%) | 98 (2.7%) |
| $100,000+ | 33 (1.0%) | 20 (0.5%) |
| Total | 3,198 (100.0%) | 3,639 (100.0%) |
Earnings by Sex by Educational Attainment in Prichard
Average earnings in Prichard are $33,581 for men and $29,113 for women, a difference of 13.3%. Men with an educational attainment of bachelor's degree enjoy the highest average annual earnings of $62,527, while those with less than high school education earn the least with $27,068. Women with an educational attainment of graduate degree earn the most with the average annual earnings of $37,159, while those with less than high school education have the smallest earnings of $21,250.
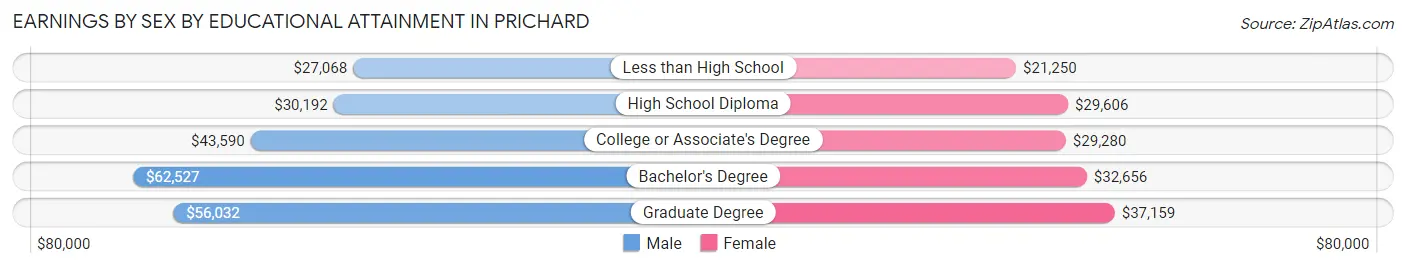
| Educational Attainment | Male Income | Female Income |
| Less than High School | $27,068 | $21,250 |
| High School Diploma | $30,192 | $29,606 |
| College or Associate's Degree | $43,590 | $29,280 |
| Bachelor's Degree | $62,527 | $32,656 |
| Graduate Degree | $56,032 | $37,159 |
| Total | $33,581 | $29,113 |
Family Income in Prichard
Family Income Brackets in Prichard
According to the Prichard family income data, there are 856 families falling into the $35,000 to $49,999 income range, which is the most common income bracket and makes up 20.9% of all families. Conversely, the $150,000 to $199,999 income bracket is the least frequent group with only 45 families (1.1%) belonging to this category.
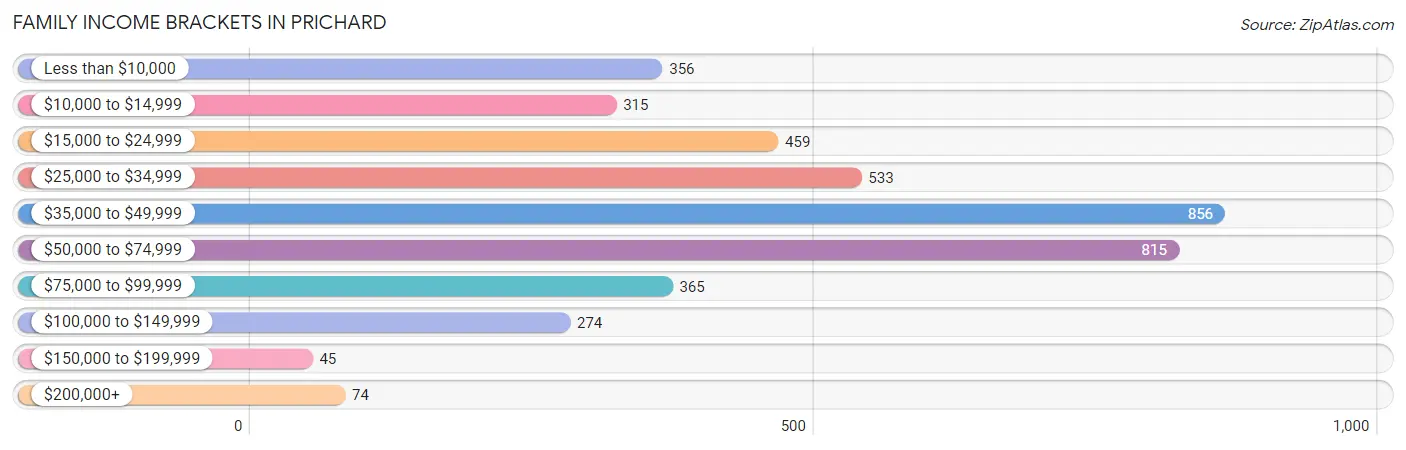
| Income Bracket | # Families | % Families |
| Less than $10,000 | 356 | 8.7% |
| $10,000 to $14,999 | 315 | 7.7% |
| $15,000 to $24,999 | 459 | 11.2% |
| $25,000 to $34,999 | 533 | 13.0% |
| $35,000 to $49,999 | 856 | 20.9% |
| $50,000 to $74,999 | 815 | 19.9% |
| $75,000 to $99,999 | 365 | 8.9% |
| $100,000 to $149,999 | 274 | 6.7% |
| $150,000 to $199,999 | 45 | 1.1% |
| $200,000+ | 74 | 1.8% |
Family Income by Famaliy Size in Prichard
6-person families (248 | 6.0%) account for the highest median family income in Prichard with $70,842 per family, while 2-person families (1,733 | 42.3%) have the highest median income of $21,288 per family member.
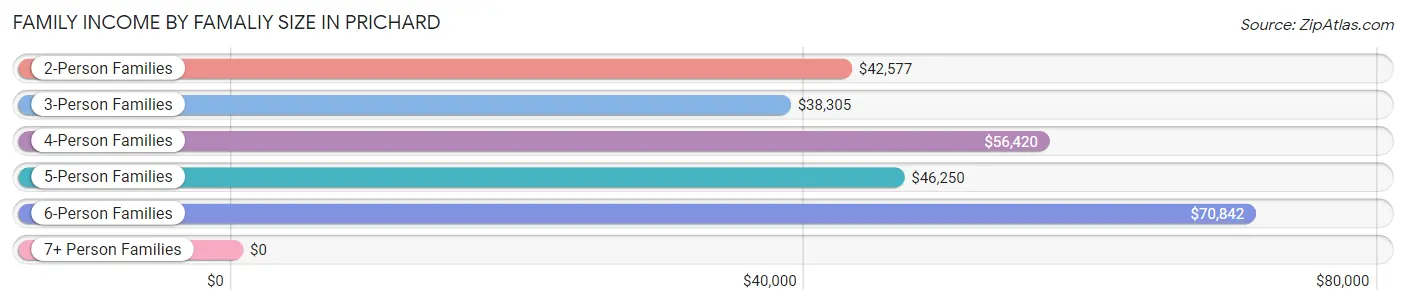
| Income Bracket | # Families | Median Income |
| 2-Person Families | 1,733 (42.3%) | $42,577 |
| 3-Person Families | 752 (18.3%) | $38,305 |
| 4-Person Families | 605 (14.8%) | $56,420 |
| 5-Person Families | 708 (17.3%) | $46,250 |
| 6-Person Families | 248 (6.0%) | $70,842 |
| 7+ Person Families | 51 (1.2%) | $0 |
| Total | 4,097 (100.0%) | $45,192 |
Family Income by Number of Earners in Prichard
The median family income in Prichard is $45,192, with families comprising 3+ earners (189) having the highest median family income of $125,746, while families with no earners (1,014) have the lowest median family income of $14,414, accounting for 4.6% and 24.7% of families, respectively.
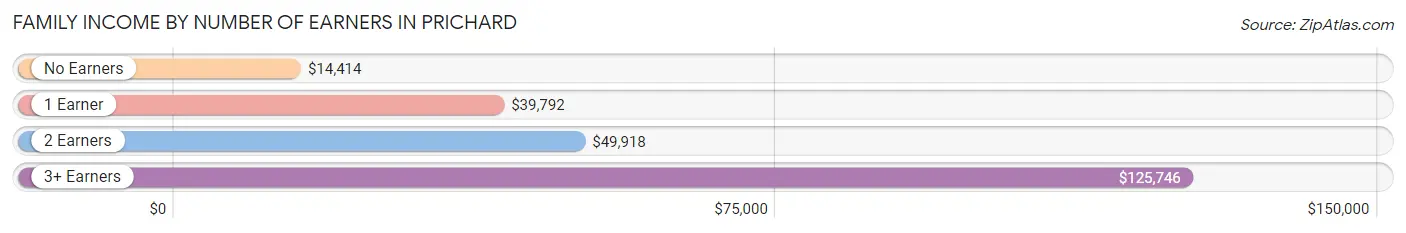
| Number of Earners | # Families | Median Income |
| No Earners | 1,014 (24.7%) | $14,414 |
| 1 Earner | 1,903 (46.5%) | $39,792 |
| 2 Earners | 991 (24.2%) | $49,918 |
| 3+ Earners | 189 (4.6%) | $125,746 |
| Total | 4,097 (100.0%) | $45,192 |
Household Income in Prichard
Household Income Brackets in Prichard
With 1,484 households falling in the category, the $35,000 to $49,999 income range is the most frequent in Prichard, accounting for 22.0% of all households. In contrast, only 81 households (1.2%) fall into the $200,000+ income bracket, making it the least populous group.
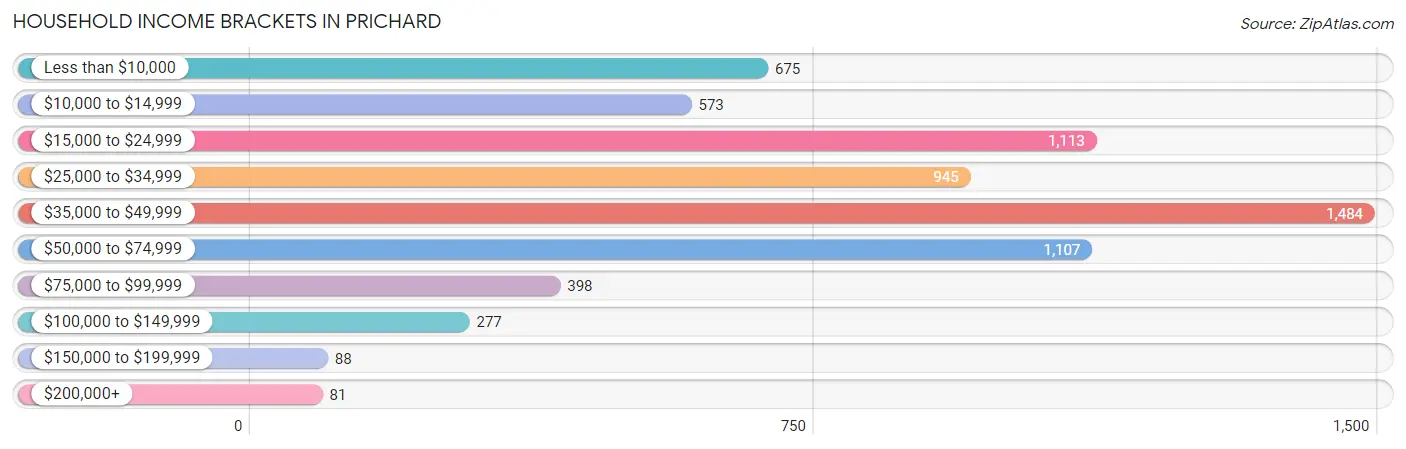
| Income Bracket | # Households | % Households |
| Less than $10,000 | 675 | 10.0% |
| $10,000 to $14,999 | 573 | 8.5% |
| $15,000 to $24,999 | 1,113 | 16.5% |
| $25,000 to $34,999 | 945 | 14.0% |
| $35,000 to $49,999 | 1,484 | 22.0% |
| $50,000 to $74,999 | 1,107 | 16.4% |
| $75,000 to $99,999 | 398 | 5.9% |
| $100,000 to $149,999 | 277 | 4.1% |
| $150,000 to $199,999 | 88 | 1.3% |
| $200,000+ | 81 | 1.2% |
Household Income by Householder Age in Prichard
The median household income in Prichard is $36,110, with the highest median household income of $43,849 found in the 25 to 44 years age bracket for the primary householder. A total of 1,977 households (29.3%) fall into this category. Meanwhile, the 15 to 24 years age bracket for the primary householder has the lowest median household income of $28,750, with 141 households (2.1%) in this group.
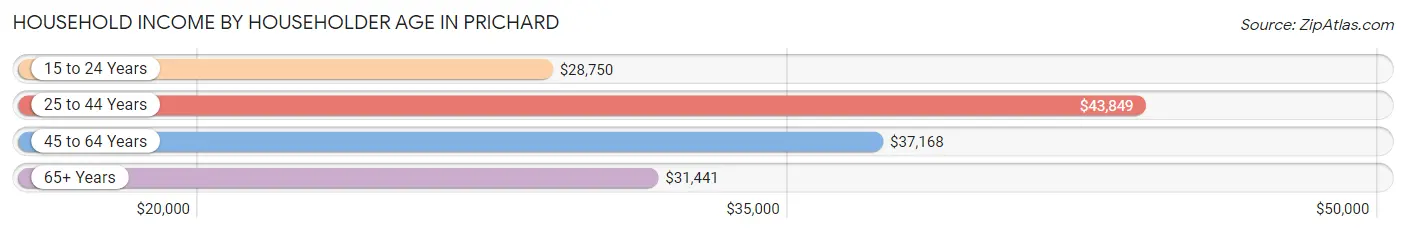
| Income Bracket | # Households | Median Income |
| 15 to 24 Years | 141 (2.1%) | $28,750 |
| 25 to 44 Years | 1,977 (29.3%) | $43,849 |
| 45 to 64 Years | 2,429 (36.0%) | $37,168 |
| 65+ Years | 2,200 (32.6%) | $31,441 |
| Total | 6,747 (100.0%) | $36,110 |
Poverty in Prichard
Income Below Poverty by Sex and Age in Prichard
With 27.4% poverty level for males and 35.1% for females among the residents of Prichard, 6 to 11 year old males and 15 year old females are the most vulnerable to poverty, with 418 males (67.0%) and 89 females (88.1%) in their respective age groups living below the poverty level.
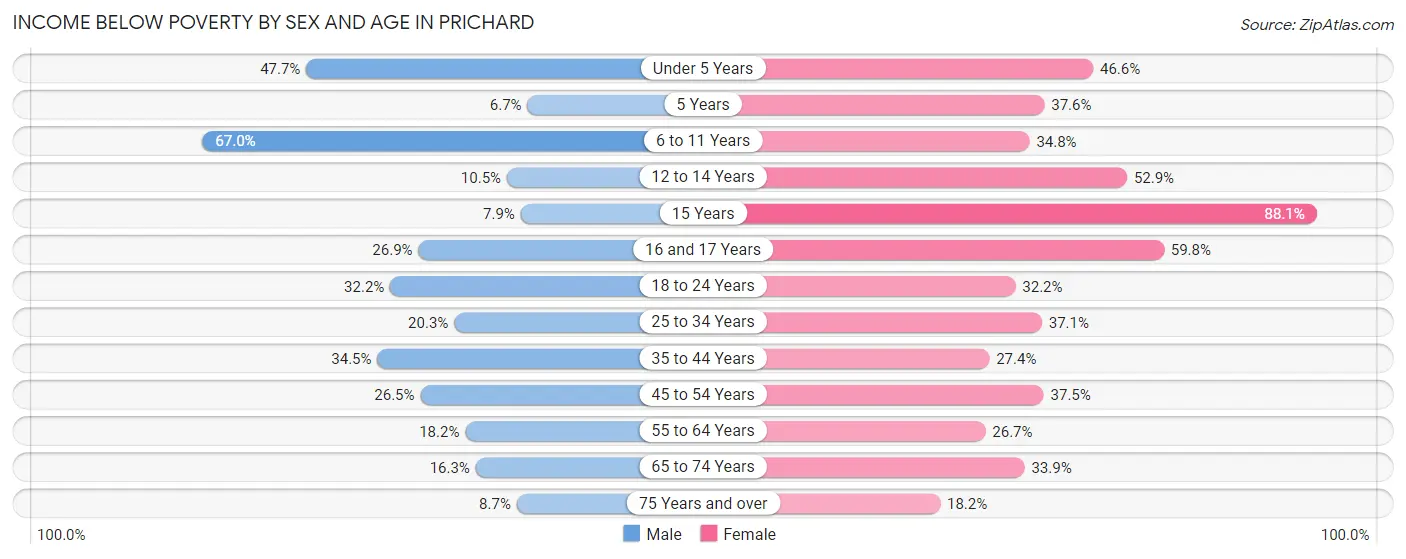
| Age Bracket | Male | Female |
| Under 5 Years | 337 (47.7%) | 380 (46.6%) |
| 5 Years | 4 (6.7%) | 62 (37.6%) |
| 6 to 11 Years | 418 (67.0%) | 348 (34.8%) |
| 12 to 14 Years | 61 (10.5%) | 235 (52.9%) |
| 15 Years | 8 (7.9%) | 89 (88.1%) |
| 16 and 17 Years | 53 (26.9%) | 211 (59.8%) |
| 18 to 24 Years | 244 (32.2%) | 213 (32.2%) |
| 25 to 34 Years | 208 (20.3%) | 394 (37.1%) |
| 35 to 44 Years | 417 (34.5%) | 381 (27.4%) |
| 45 to 54 Years | 155 (26.5%) | 333 (37.5%) |
| 55 to 64 Years | 218 (18.2%) | 367 (26.7%) |
| 65 to 74 Years | 150 (16.3%) | 433 (33.9%) |
| 75 Years and over | 41 (8.6%) | 108 (18.2%) |
| Total | 2,314 (27.4%) | 3,554 (35.1%) |
Income Above Poverty by Sex and Age in Prichard
According to the poverty statistics in Prichard, males aged 5 years and females aged 75 years and over are the age groups that are most secure financially, with 93.3% of males and 81.8% of females in these age groups living above the poverty line.
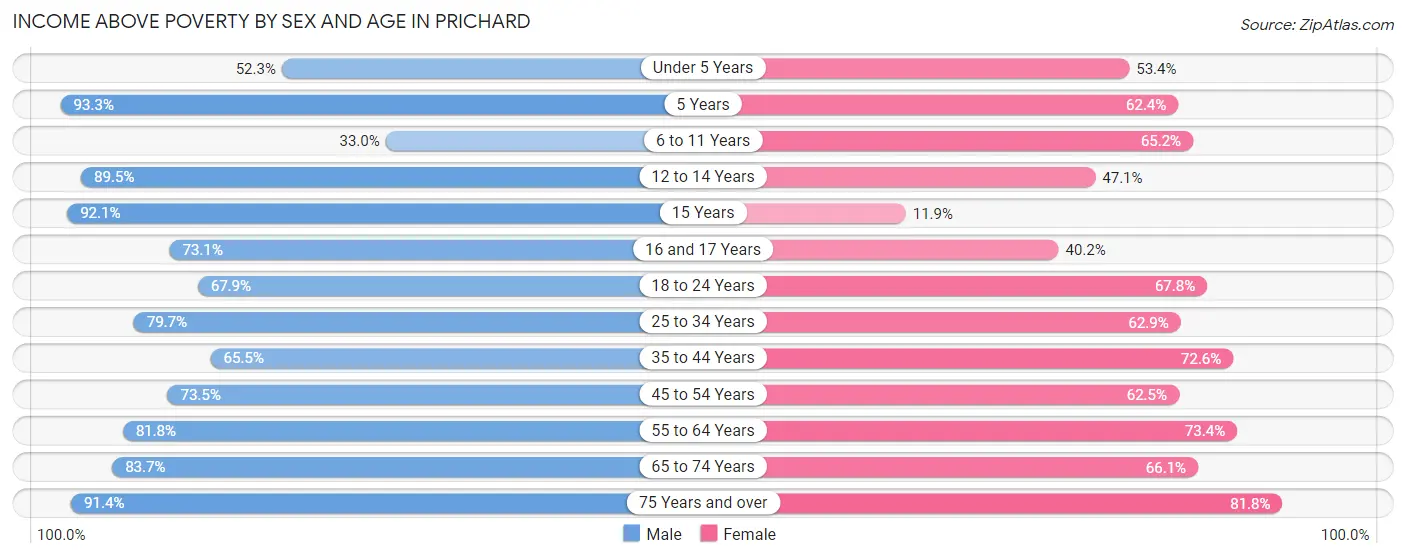
| Age Bracket | Male | Female |
| Under 5 Years | 369 (52.3%) | 435 (53.4%) |
| 5 Years | 56 (93.3%) | 103 (62.4%) |
| 6 to 11 Years | 206 (33.0%) | 651 (65.2%) |
| 12 to 14 Years | 521 (89.5%) | 209 (47.1%) |
| 15 Years | 93 (92.1%) | 12 (11.9%) |
| 16 and 17 Years | 144 (73.1%) | 142 (40.2%) |
| 18 to 24 Years | 515 (67.8%) | 448 (67.8%) |
| 25 to 34 Years | 818 (79.7%) | 667 (62.9%) |
| 35 to 44 Years | 791 (65.5%) | 1,011 (72.6%) |
| 45 to 54 Years | 429 (73.5%) | 556 (62.5%) |
| 55 to 64 Years | 979 (81.8%) | 1,010 (73.4%) |
| 65 to 74 Years | 772 (83.7%) | 844 (66.1%) |
| 75 Years and over | 433 (91.3%) | 484 (81.8%) |
| Total | 6,126 (72.6%) | 6,572 (64.9%) |
Income Below Poverty Among Married-Couple Families in Prichard
The poverty statistics for married-couple families in Prichard show that 13.7% or 251 of the total 1,839 families live below the poverty line. Families with 3 or 4 children have the highest poverty rate of 28.5%, comprising of 69 families. On the other hand, families with no children have the lowest poverty rate of 9.1%, which includes 82 families.
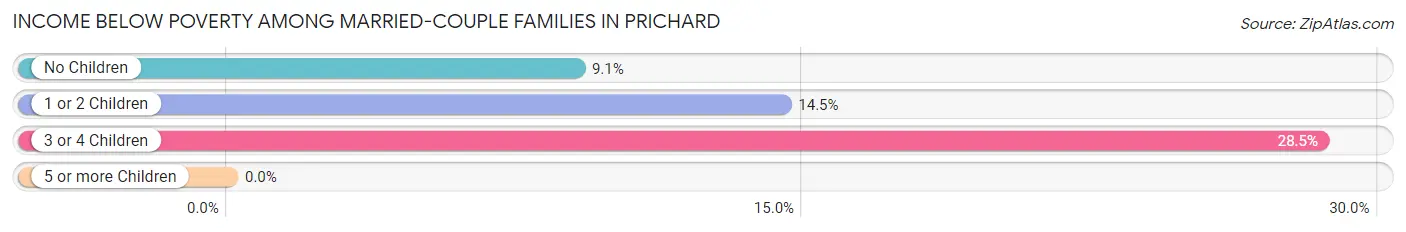
| Children | Above Poverty | Below Poverty |
| No Children | 823 (90.9%) | 82 (9.1%) |
| 1 or 2 Children | 592 (85.6%) | 100 (14.4%) |
| 3 or 4 Children | 173 (71.5%) | 69 (28.5%) |
| 5 or more Children | 0 (0.0%) | 0 (0.0%) |
| Total | 1,588 (86.4%) | 251 (13.7%) |
Income Below Poverty Among Single-Parent Households in Prichard
According to the poverty data in Prichard, 7.8% or 24 single-father households and 44.3% or 863 single-mother households are living below the poverty line. Among single-father households, those with no children have the highest poverty rate, with 24 households (9.6%) experiencing poverty. Likewise, among single-mother households, those with 3 or 4 children have the highest poverty rate, with 231 households (81.3%) falling below the poverty line.
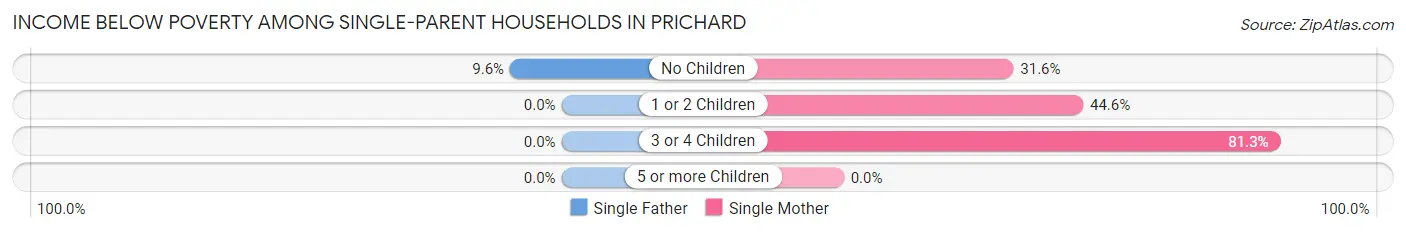
| Children | Single Father | Single Mother |
| No Children | 24 (9.6%) | 245 (31.6%) |
| 1 or 2 Children | 0 (0.0%) | 387 (44.6%) |
| 3 or 4 Children | 0 (0.0%) | 231 (81.3%) |
| 5 or more Children | 0 (0.0%) | 0 (0.0%) |
| Total | 24 (7.8%) | 863 (44.3%) |
Income Below Poverty Among Married-Couple vs Single-Parent Households in Prichard
The poverty data for Prichard shows that 251 of the married-couple family households (13.7%) and 887 of the single-parent households (39.3%) are living below the poverty level. Within the married-couple family households, those with 3 or 4 children have the highest poverty rate, with 69 households (28.5%) falling below the poverty line. Among the single-parent households, those with 3 or 4 children have the highest poverty rate, with 231 household (81.3%) living below poverty.
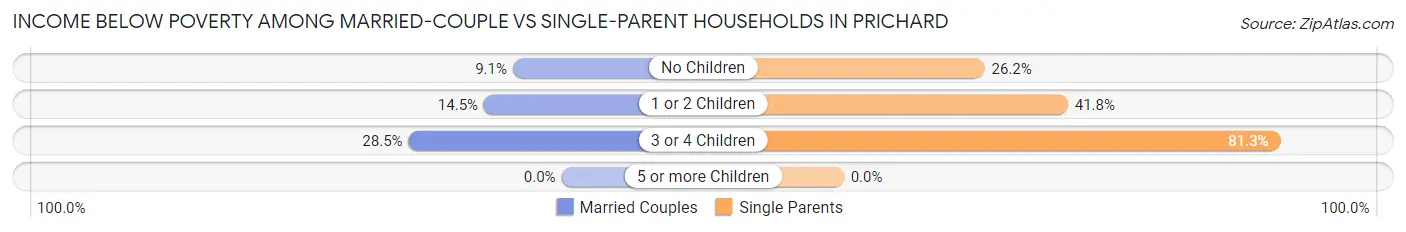
| Children | Married-Couple Families | Single-Parent Households |
| No Children | 82 (9.1%) | 269 (26.2%) |
| 1 or 2 Children | 100 (14.4%) | 387 (41.7%) |
| 3 or 4 Children | 69 (28.5%) | 231 (81.3%) |
| 5 or more Children | 0 (0.0%) | 0 (0.0%) |
| Total | 251 (13.7%) | 887 (39.3%) |
Employment Characteristics in Prichard
Employment by Class of Employer in Prichard
Among the 6,006 employed individuals in Prichard, private company employees (3,688 | 61.4%), local government employees (814 | 13.6%), and not-for-profit organizations (736 | 12.2%) make up the most common classes of employment.
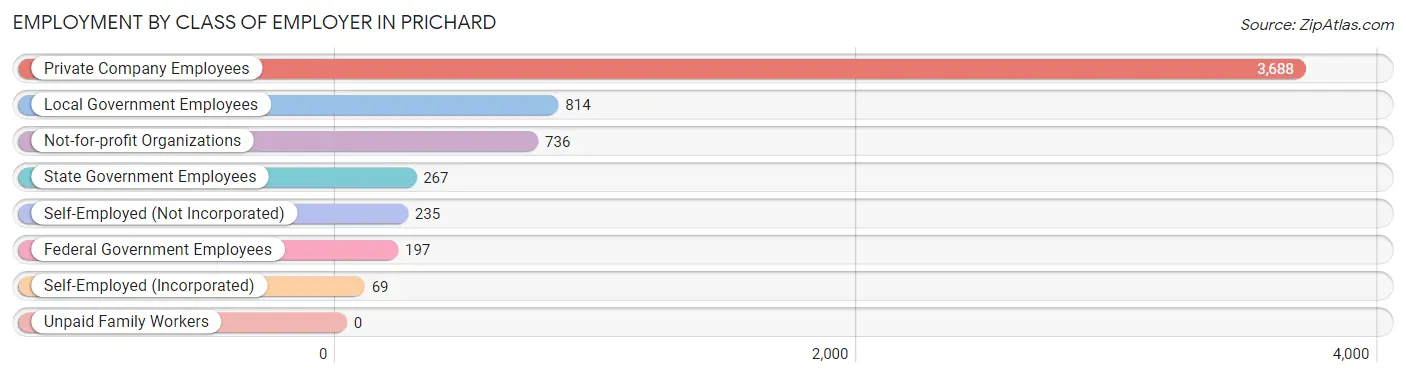
| Employer Class | # Employees | % Employees |
| Private Company Employees | 3,688 | 61.4% |
| Self-Employed (Incorporated) | 69 | 1.1% |
| Self-Employed (Not Incorporated) | 235 | 3.9% |
| Not-for-profit Organizations | 736 | 12.2% |
| Local Government Employees | 814 | 13.6% |
| State Government Employees | 267 | 4.4% |
| Federal Government Employees | 197 | 3.3% |
| Unpaid Family Workers | 0 | 0.0% |
| Total | 6,006 | 100.0% |
Employment Status by Age in Prichard
According to the labor force statistics for Prichard, out of the total population over 16 years of age (14,756), 46.1% or 6,803 individuals are in the labor force, with 10.5% or 714 of them unemployed. The age group with the highest labor force participation rate is 35 to 44 years, with 78.0% or 2,075 individuals in the labor force. Within the labor force, the 16 to 19 years age range has the highest percentage of unemployed individuals, with 22.9% or 50 of them being unemployed.
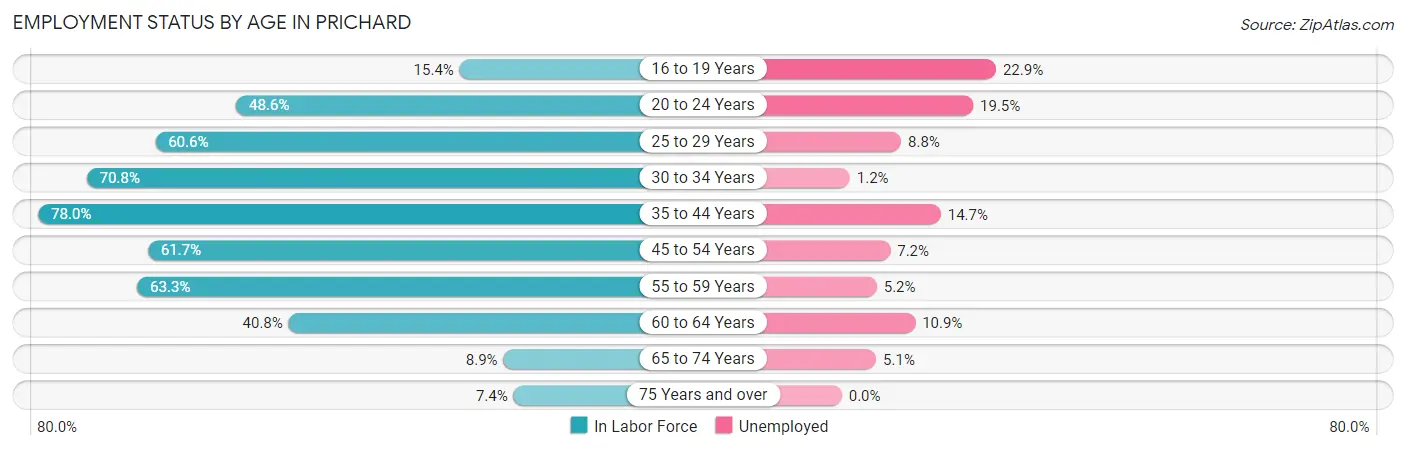
| Age Bracket | In Labor Force | Unemployed |
| 16 to 19 Years | 218 (15.4%) | 50 (22.9%) |
| 20 to 24 Years | 570 (48.6%) | 111 (19.5%) |
| 25 to 29 Years | 721 (60.6%) | 63 (8.8%) |
| 30 to 34 Years | 676 (70.8%) | 8 (1.2%) |
| 35 to 44 Years | 2,075 (78.0%) | 305 (14.7%) |
| 45 to 54 Years | 932 (61.7%) | 67 (7.2%) |
| 55 to 59 Years | 801 (63.3%) | 42 (5.2%) |
| 60 to 64 Years | 539 (40.8%) | 59 (10.9%) |
| 65 to 74 Years | 196 (8.9%) | 10 (5.1%) |
| 75 Years and over | 79 (7.4%) | 0 (0.0%) |
| Total | 6,803 (46.1%) | 714 (10.5%) |
Employment Status by Educational Attainment in Prichard
According to labor force statistics for Prichard, 64.5% of individuals (5,740) out of the total population between 25 and 64 years of age (8,900) are in the labor force, with 9.5% or 545 of them being unemployed. The group with the highest labor force participation rate are those with the educational attainment of bachelor's degree or higher, with 83.0% or 698 individuals in the labor force. Within the labor force, individuals with less than high school education have the highest percentage of unemployment, with 26.7% or 222 of them being unemployed.
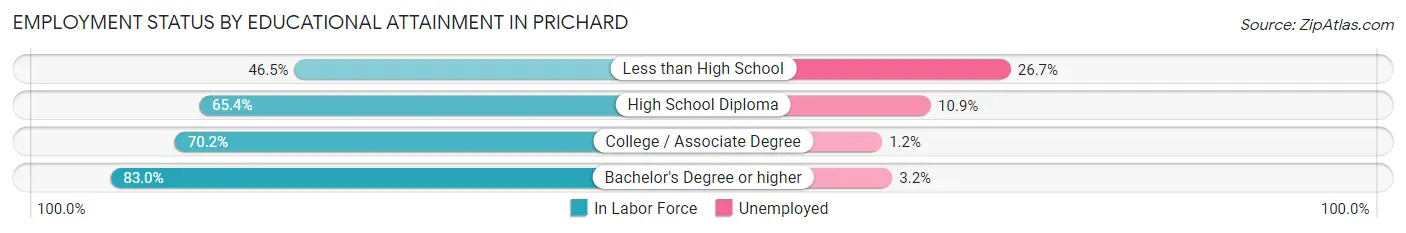
| Educational Attainment | In Labor Force | Unemployed |
| Less than High School | 832 (46.5%) | 478 (26.7%) |
| High School Diploma | 2,573 (65.4%) | 429 (10.9%) |
| College / Associate Degree | 1,640 (70.2%) | 28 (1.2%) |
| Bachelor's Degree or higher | 698 (83.0%) | 27 (3.2%) |
| Total | 5,740 (64.5%) | 846 (9.5%) |
Employment Occupations by Sex in Prichard
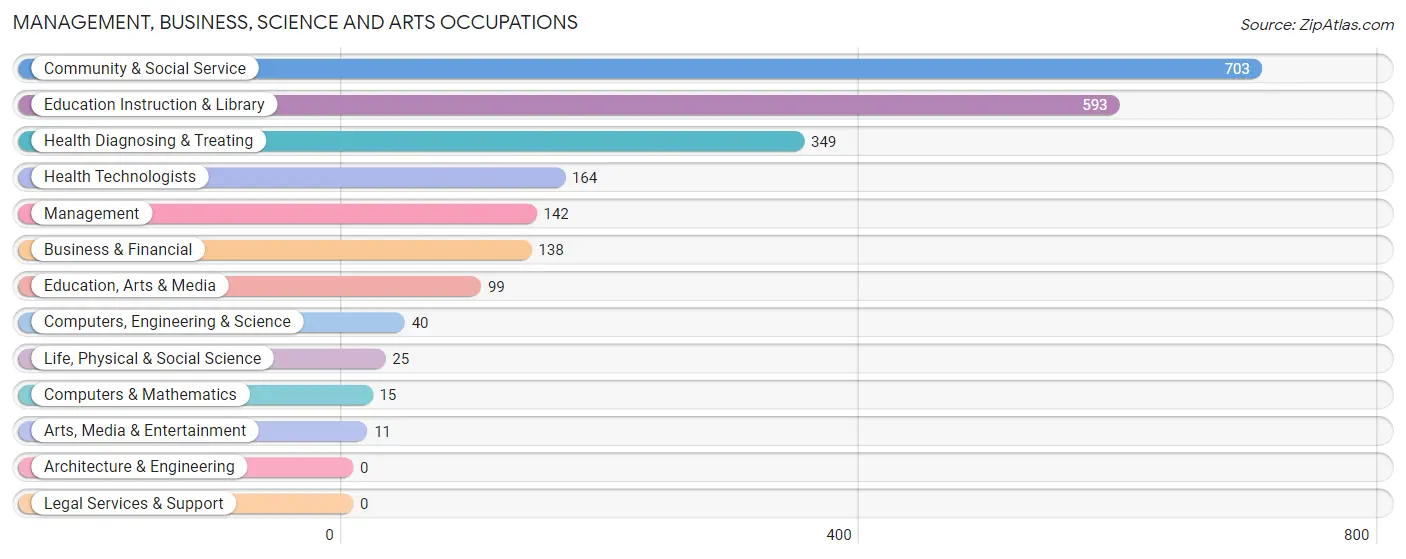
Management, Business, Science and Arts Occupations
The most common Management, Business, Science and Arts occupations in Prichard are Community & Social Service (703 | 11.6%), Education Instruction & Library (593 | 9.8%), Health Diagnosing & Treating (349 | 5.8%), Health Technologists (164 | 2.7%), and Management (142 | 2.3%).
Management, Business, Science and Arts Occupations by Sex
Within the Management, Business, Science and Arts occupations in Prichard, the most male-oriented occupations are Computers & Mathematics (100.0%), Computers, Engineering & Science (37.5%), and Management (35.9%), while the most female-oriented occupations are Life, Physical & Social Science (100.0%), Arts, Media & Entertainment (100.0%), and Health Technologists (92.1%).
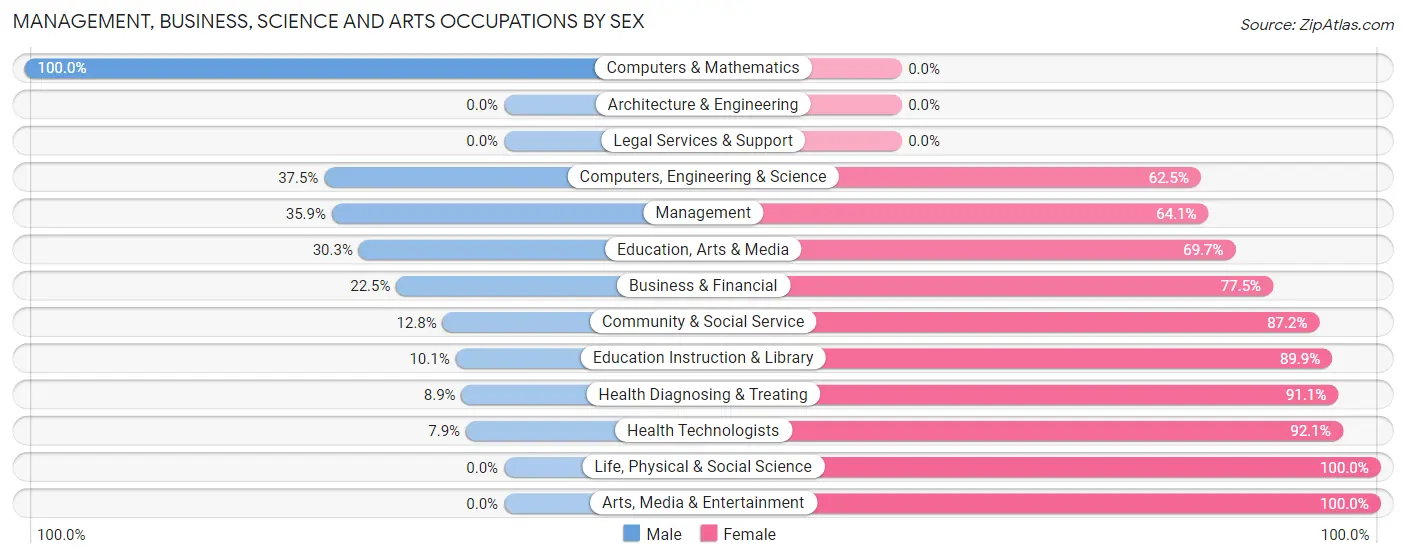
| Occupation | Male | Female |
| Management | 51 (35.9%) | 91 (64.1%) |
| Business & Financial | 31 (22.5%) | 107 (77.5%) |
| Computers, Engineering & Science | 15 (37.5%) | 25 (62.5%) |
| Computers & Mathematics | 15 (100.0%) | 0 (0.0%) |
| Architecture & Engineering | 0 (0.0%) | 0 (0.0%) |
| Life, Physical & Social Science | 0 (0.0%) | 25 (100.0%) |
| Community & Social Service | 90 (12.8%) | 613 (87.2%) |
| Education, Arts & Media | 30 (30.3%) | 69 (69.7%) |
| Legal Services & Support | 0 (0.0%) | 0 (0.0%) |
| Education Instruction & Library | 60 (10.1%) | 533 (89.9%) |
| Arts, Media & Entertainment | 0 (0.0%) | 11 (100.0%) |
| Health Diagnosing & Treating | 31 (8.9%) | 318 (91.1%) |
| Health Technologists | 13 (7.9%) | 151 (92.1%) |
| Total (Category) | 218 (15.9%) | 1,154 (84.1%) |
| Total (Overall) | 2,771 (45.7%) | 3,297 (54.3%) |
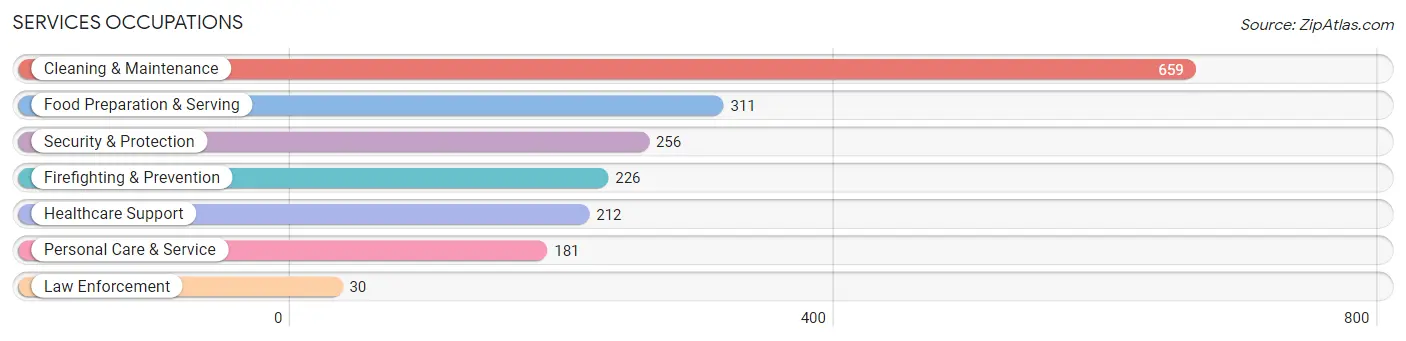
Services Occupations
The most common Services occupations in Prichard are Cleaning & Maintenance (659 | 10.9%), Food Preparation & Serving (311 | 5.1%), Security & Protection (256 | 4.2%), Firefighting & Prevention (226 | 3.7%), and Healthcare Support (212 | 3.5%).
Services Occupations by Sex
Within the Services occupations in Prichard, the most male-oriented occupations are Personal Care & Service (84.0%), Cleaning & Maintenance (51.6%), and Law Enforcement (46.7%), while the most female-oriented occupations are Healthcare Support (89.6%), Food Preparation & Serving (76.8%), and Firefighting & Prevention (54.9%).
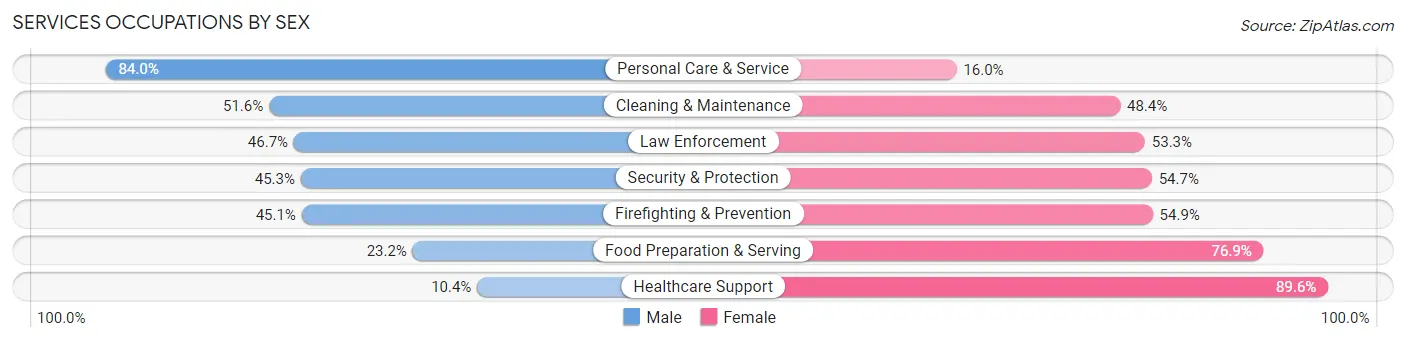
| Occupation | Male | Female |
| Healthcare Support | 22 (10.4%) | 190 (89.6%) |
| Security & Protection | 116 (45.3%) | 140 (54.7%) |
| Firefighting & Prevention | 102 (45.1%) | 124 (54.9%) |
| Law Enforcement | 14 (46.7%) | 16 (53.3%) |
| Food Preparation & Serving | 72 (23.2%) | 239 (76.8%) |
| Cleaning & Maintenance | 340 (51.6%) | 319 (48.4%) |
| Personal Care & Service | 152 (84.0%) | 29 (16.0%) |
| Total (Category) | 702 (43.4%) | 917 (56.6%) |
| Total (Overall) | 2,771 (45.7%) | 3,297 (54.3%) |
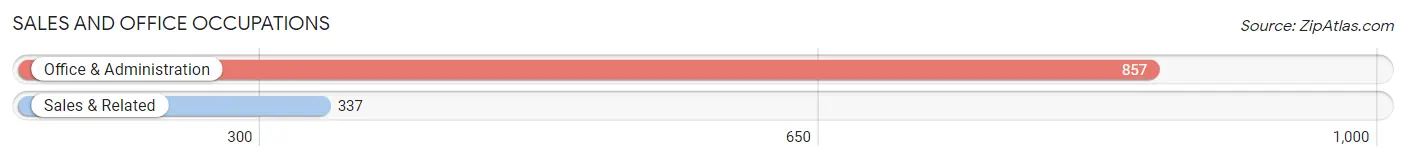
Sales and Office Occupations
The most common Sales and Office occupations in Prichard are Office & Administration (857 | 14.1%), and Sales & Related (337 | 5.6%).
Sales and Office Occupations by Sex
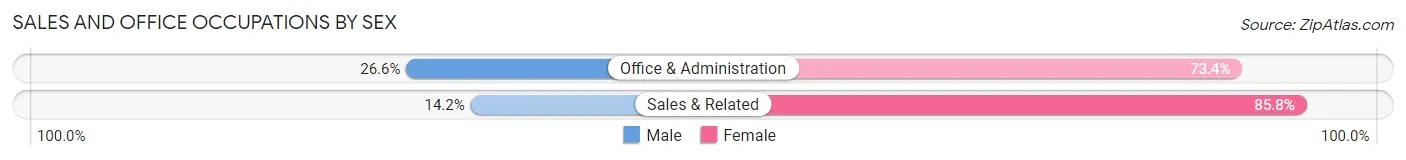
| Occupation | Male | Female |
| Sales & Related | 48 (14.2%) | 289 (85.8%) |
| Office & Administration | 228 (26.6%) | 629 (73.4%) |
| Total (Category) | 276 (23.1%) | 918 (76.9%) |
| Total (Overall) | 2,771 (45.7%) | 3,297 (54.3%) |
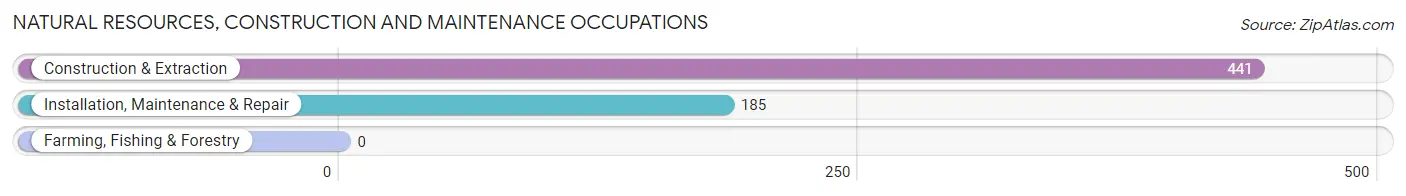
Natural Resources, Construction and Maintenance Occupations
The most common Natural Resources, Construction and Maintenance occupations in Prichard are Construction & Extraction (441 | 7.3%), and Installation, Maintenance & Repair (185 | 3.0%).
Natural Resources, Construction and Maintenance Occupations by Sex
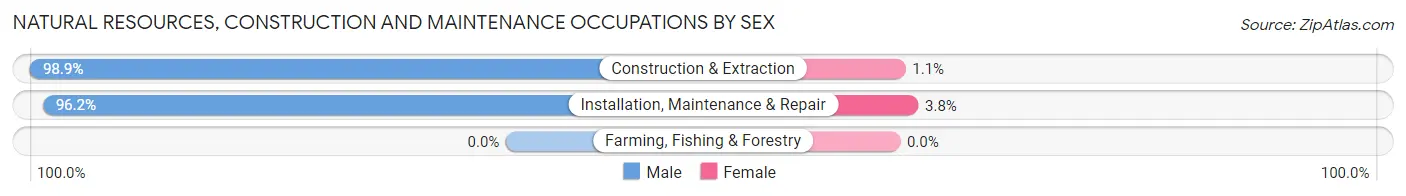
| Occupation | Male | Female |
| Farming, Fishing & Forestry | 0 (0.0%) | 0 (0.0%) |
| Construction & Extraction | 436 (98.9%) | 5 (1.1%) |
| Installation, Maintenance & Repair | 178 (96.2%) | 7 (3.8%) |
| Total (Category) | 614 (98.1%) | 12 (1.9%) |
| Total (Overall) | 2,771 (45.7%) | 3,297 (54.3%) |
Production, Transportation and Moving Occupations
The most common Production, Transportation and Moving occupations in Prichard are Material Moving (588 | 9.7%), Production (443 | 7.3%), and Transportation (226 | 3.7%).
Production, Transportation and Moving Occupations by Sex
| Occupation | Male | Female |
| Production | 299 (67.5%) | 144 (32.5%) |
| Transportation | 174 (77.0%) | 52 (23.0%) |
| Material Moving | 488 (83.0%) | 100 (17.0%) |
| Total (Category) | 961 (76.4%) | 296 (23.5%) |
| Total (Overall) | 2,771 (45.7%) | 3,297 (54.3%) |
Employment Industries by Sex in Prichard
Employment Industries in Prichard
The major employment industries in Prichard include Health Care & Social Assistance (1,027 | 16.9%), Educational Services (848 | 14.0%), Manufacturing (729 | 12.0%), Retail Trade (663 | 10.9%), and Administrative & Support (596 | 9.8%).
Employment Industries by Sex in Prichard
The Prichard industries that see more men than women are Wholesale Trade (100.0%), Information (100.0%), and Construction (92.1%), whereas the industries that tend to have a higher number of women are Arts, Entertainment & Recreation (100.0%), Educational Services (85.3%), and Mining, Quarrying, & Extraction (83.3%).
| Industry | Male | Female |
| Agriculture, Fishing & Hunting | 9 (75.0%) | 3 (25.0%) |
| Mining, Quarrying, & Extraction | 3 (16.7%) | 15 (83.3%) |
| Construction | 337 (92.1%) | 29 (7.9%) |
| Manufacturing | 520 (71.3%) | 209 (28.7%) |
| Wholesale Trade | 33 (100.0%) | 0 (0.0%) |
| Retail Trade | 233 (35.1%) | 430 (64.9%) |
| Transportation & Warehousing | 202 (68.2%) | 94 (31.8%) |
| Utilities | 91 (81.2%) | 21 (18.8%) |
| Information | 21 (100.0%) | 0 (0.0%) |
| Finance & Insurance | 31 (20.8%) | 118 (79.2%) |
| Real Estate, Rental & Leasing | 136 (86.6%) | 21 (13.4%) |
| Professional & Scientific | 39 (59.1%) | 27 (40.9%) |
| Enterprise Management | 0 (0.0%) | 0 (0.0%) |
| Administrative & Support | 372 (62.4%) | 224 (37.6%) |
| Educational Services | 125 (14.7%) | 723 (85.3%) |
| Health Care & Social Assistance | 205 (20.0%) | 822 (80.0%) |
| Arts, Entertainment & Recreation | 0 (0.0%) | 17 (100.0%) |
| Accommodation & Food Services | 128 (28.7%) | 318 (71.3%) |
| Public Administration | 74 (53.6%) | 64 (46.4%) |
| Total | 2,771 (45.7%) | 3,297 (54.3%) |
Education in Prichard
School Enrollment in Prichard
The most common levels of schooling among the 5,269 students in Prichard are middle school (1,521 | 28.9%), high school (1,111 | 21.1%), and college / undergraduate (1,108 | 21.0%).
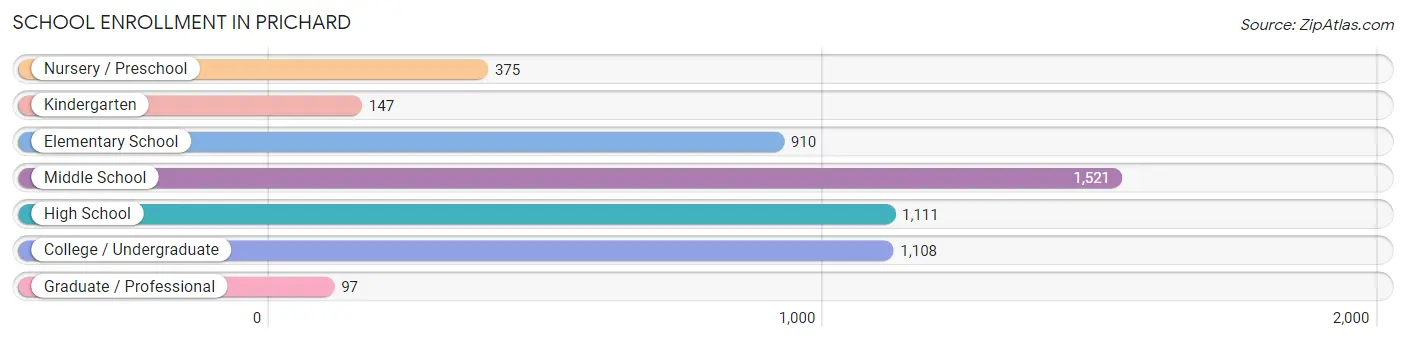
| School Level | # Students | % Students |
| Nursery / Preschool | 375 | 7.1% |
| Kindergarten | 147 | 2.8% |
| Elementary School | 910 | 17.3% |
| Middle School | 1,521 | 28.9% |
| High School | 1,111 | 21.1% |
| College / Undergraduate | 1,108 | 21.0% |
| Graduate / Professional | 97 | 1.8% |
| Total | 5,269 | 100.0% |
School Enrollment by Age by Funding Source in Prichard
Out of a total of 5,269 students who are enrolled in schools in Prichard, 374 (7.1%) attend a private institution, while the remaining 4,895 (92.9%) are enrolled in public schools. The age group of 35 years and over has the highest likelihood of being enrolled in private schools, with 48 (29.1% in the age bracket) enrolled. Conversely, the age group of 10 to 14 year olds has the lowest likelihood of being enrolled in a private school, with 1,890 (100.0% in the age bracket) attending a public institution.
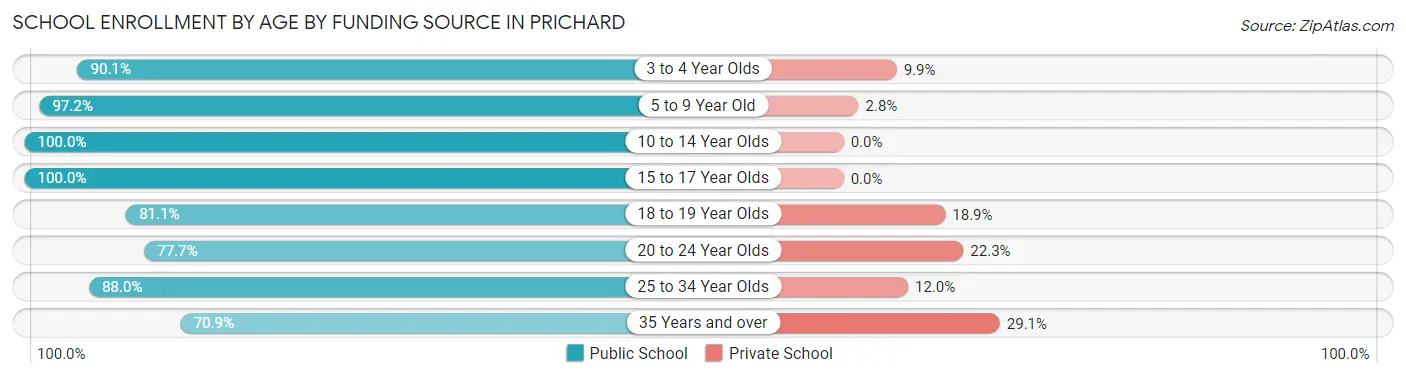
| Age Bracket | Public School | Private School |
| 3 to 4 Year Olds | 310 (90.1%) | 34 (9.9%) |
| 5 to 9 Year Old | 838 (97.2%) | 24 (2.8%) |
| 10 to 14 Year Olds | 1,890 (100.0%) | 0 (0.0%) |
| 15 to 17 Year Olds | 699 (100.0%) | 0 (0.0%) |
| 18 to 19 Year Olds | 428 (81.1%) | 100 (18.9%) |
| 20 to 24 Year Olds | 568 (77.7%) | 163 (22.3%) |
| 25 to 34 Year Olds | 44 (88.0%) | 6 (12.0%) |
| 35 Years and over | 117 (70.9%) | 48 (29.1%) |
| Total | 4,895 (92.9%) | 374 (7.1%) |
Educational Attainment by Field of Study in Prichard
Business (370 | 30.7%), science & technology (169 | 14.0%), arts & humanities (160 | 13.3%), education (155 | 12.9%), and liberal arts & history (100 | 8.3%) are the most common fields of study among 1,204 individuals in Prichard who have obtained a bachelor's degree or higher.
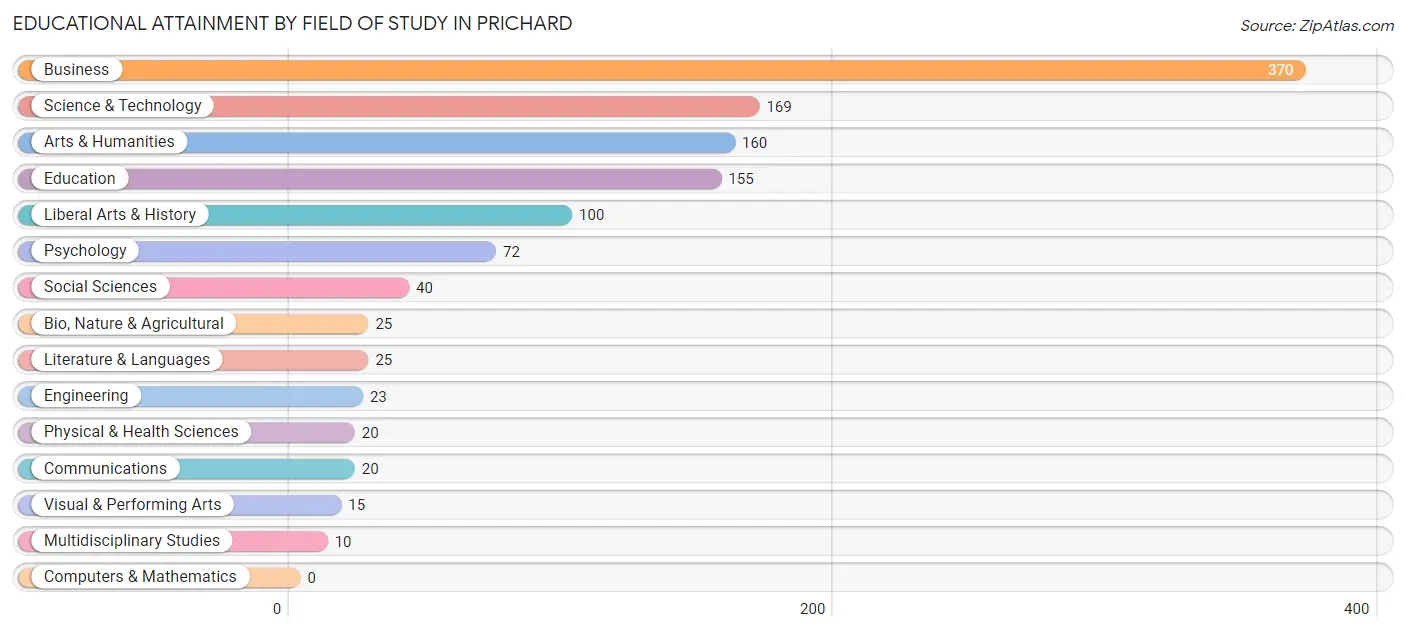
| Field of Study | # Graduates | % Graduates |
| Computers & Mathematics | 0 | 0.0% |
| Bio, Nature & Agricultural | 25 | 2.1% |
| Physical & Health Sciences | 20 | 1.7% |
| Psychology | 72 | 6.0% |
| Social Sciences | 40 | 3.3% |
| Engineering | 23 | 1.9% |
| Multidisciplinary Studies | 10 | 0.8% |
| Science & Technology | 169 | 14.0% |
| Business | 370 | 30.7% |
| Education | 155 | 12.9% |
| Literature & Languages | 25 | 2.1% |
| Liberal Arts & History | 100 | 8.3% |
| Visual & Performing Arts | 15 | 1.3% |
| Communications | 20 | 1.7% |
| Arts & Humanities | 160 | 13.3% |
| Total | 1,204 | 100.0% |
Transportation & Commute in Prichard
Vehicle Availability by Sex in Prichard
The most prevalent vehicle ownership categories in Prichard are males with 2 vehicles (1,212, accounting for 45.0%) and females with 2 vehicles (1,191, making up 39.2%).
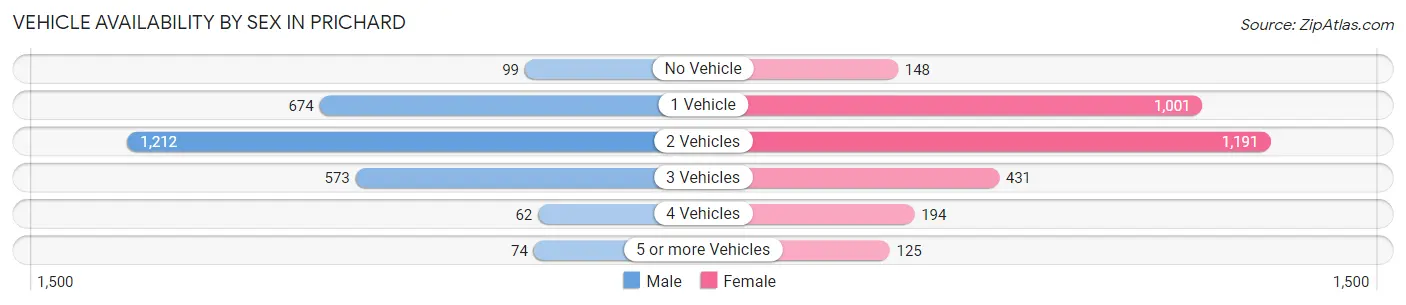
| Vehicles Available | Male | Female |
| No Vehicle | 99 (3.7%) | 148 (4.8%) |
| 1 Vehicle | 674 (25.0%) | 1,001 (32.4%) |
| 2 Vehicles | 1,212 (45.0%) | 1,191 (38.5%) |
| 3 Vehicles | 573 (21.3%) | 431 (14.0%) |
| 4 Vehicles | 62 (2.3%) | 194 (6.3%) |
| 5 or more Vehicles | 74 (2.8%) | 125 (4.1%) |
| Total | 2,694 (100.0%) | 3,090 (100.0%) |
Commute Time in Prichard
The most frequently occuring commute durations in Prichard are 15 to 19 minutes (1,285 commuters, 22.1%), 20 to 24 minutes (1,250 commuters, 21.5%), and 30 to 34 minutes (891 commuters, 15.3%).
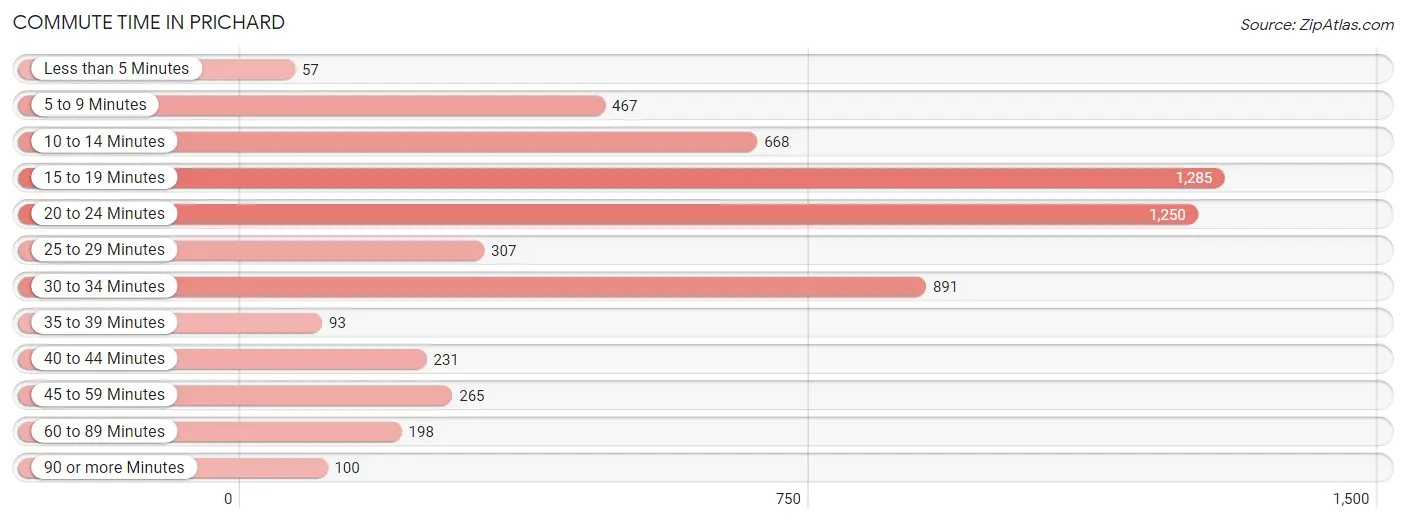
| Commute Time | # Commuters | % Commuters |
| Less than 5 Minutes | 57 | 1.0% |
| 5 to 9 Minutes | 467 | 8.0% |
| 10 to 14 Minutes | 668 | 11.5% |
| 15 to 19 Minutes | 1,285 | 22.1% |
| 20 to 24 Minutes | 1,250 | 21.5% |
| 25 to 29 Minutes | 307 | 5.3% |
| 30 to 34 Minutes | 891 | 15.3% |
| 35 to 39 Minutes | 93 | 1.6% |
| 40 to 44 Minutes | 231 | 4.0% |
| 45 to 59 Minutes | 265 | 4.6% |
| 60 to 89 Minutes | 198 | 3.4% |
| 90 or more Minutes | 100 | 1.7% |
Commute Time by Sex in Prichard
The most common commute times in Prichard are 20 to 24 minutes (551 commuters, 20.8%) for males and 15 to 19 minutes (896 commuters, 28.3%) for females.
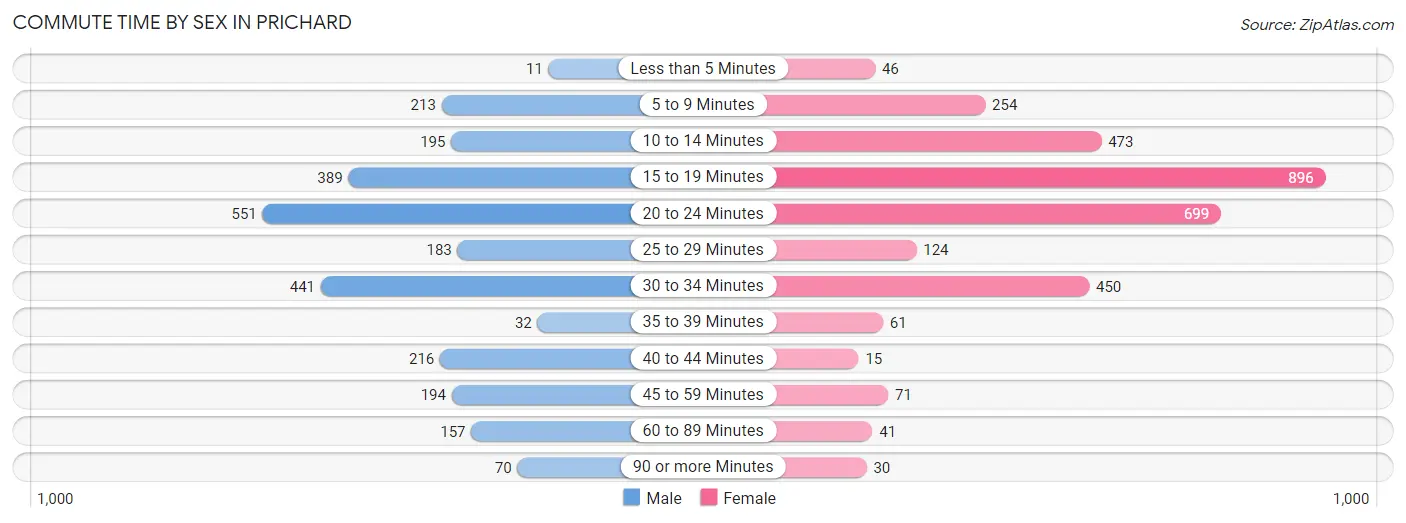
| Commute Time | Male | Female |
| Less than 5 Minutes | 11 (0.4%) | 46 (1.5%) |
| 5 to 9 Minutes | 213 (8.0%) | 254 (8.0%) |
| 10 to 14 Minutes | 195 (7.3%) | 473 (15.0%) |
| 15 to 19 Minutes | 389 (14.7%) | 896 (28.3%) |
| 20 to 24 Minutes | 551 (20.8%) | 699 (22.1%) |
| 25 to 29 Minutes | 183 (6.9%) | 124 (3.9%) |
| 30 to 34 Minutes | 441 (16.6%) | 450 (14.2%) |
| 35 to 39 Minutes | 32 (1.2%) | 61 (1.9%) |
| 40 to 44 Minutes | 216 (8.1%) | 15 (0.5%) |
| 45 to 59 Minutes | 194 (7.3%) | 71 (2.2%) |
| 60 to 89 Minutes | 157 (5.9%) | 41 (1.3%) |
| 90 or more Minutes | 70 (2.6%) | 30 (0.9%) |
Time of Departure to Work by Sex in Prichard
The most frequent times of departure to work in Prichard are 7:00 AM to 7:29 AM (645, 24.3%) for males and 7:00 AM to 7:29 AM (586, 18.5%) for females.
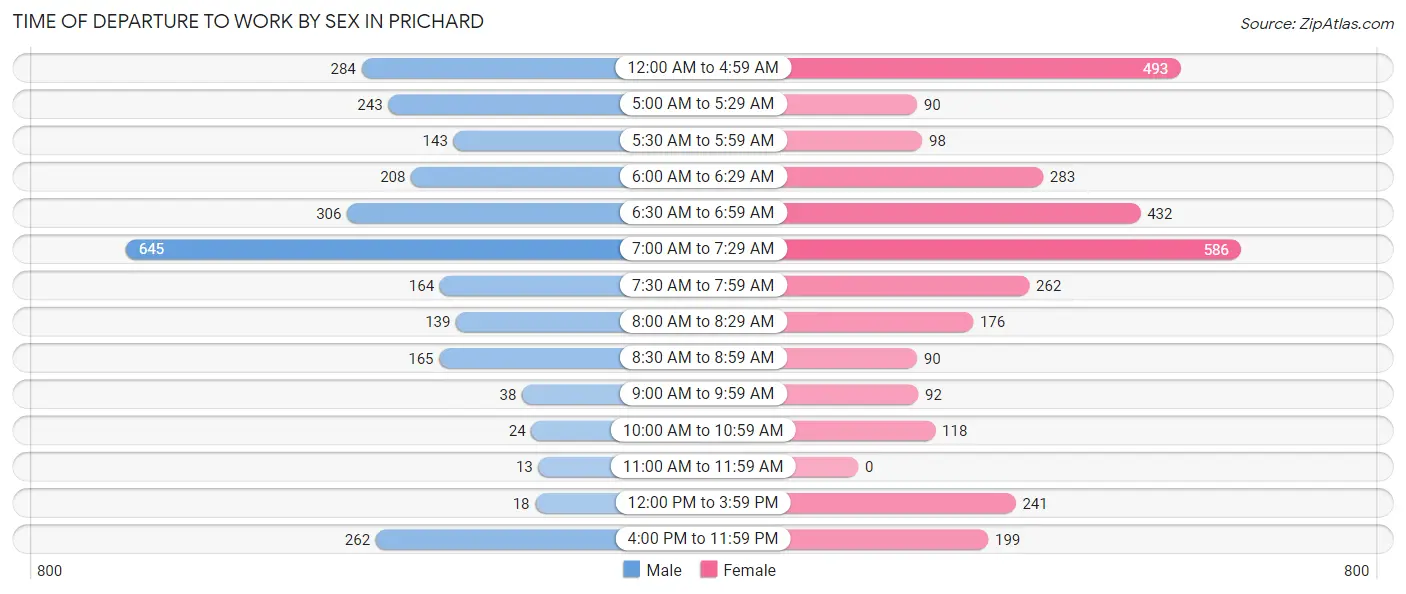
| Time of Departure | Male | Female |
| 12:00 AM to 4:59 AM | 284 (10.7%) | 493 (15.6%) |
| 5:00 AM to 5:29 AM | 243 (9.2%) | 90 (2.9%) |
| 5:30 AM to 5:59 AM | 143 (5.4%) | 98 (3.1%) |
| 6:00 AM to 6:29 AM | 208 (7.8%) | 283 (9.0%) |
| 6:30 AM to 6:59 AM | 306 (11.5%) | 432 (13.7%) |
| 7:00 AM to 7:29 AM | 645 (24.3%) | 586 (18.5%) |
| 7:30 AM to 7:59 AM | 164 (6.2%) | 262 (8.3%) |
| 8:00 AM to 8:29 AM | 139 (5.2%) | 176 (5.6%) |
| 8:30 AM to 8:59 AM | 165 (6.2%) | 90 (2.9%) |
| 9:00 AM to 9:59 AM | 38 (1.4%) | 92 (2.9%) |
| 10:00 AM to 10:59 AM | 24 (0.9%) | 118 (3.7%) |
| 11:00 AM to 11:59 AM | 13 (0.5%) | 0 (0.0%) |
| 12:00 PM to 3:59 PM | 18 (0.7%) | 241 (7.6%) |
| 4:00 PM to 11:59 PM | 262 (9.9%) | 199 (6.3%) |
| Total | 2,652 (100.0%) | 3,160 (100.0%) |
Housing Occupancy in Prichard
Occupancy by Ownership in Prichard
Of the total 6,747 dwellings in Prichard, owner-occupied units account for 3,782 (56.0%), while renter-occupied units make up 2,965 (44.0%).
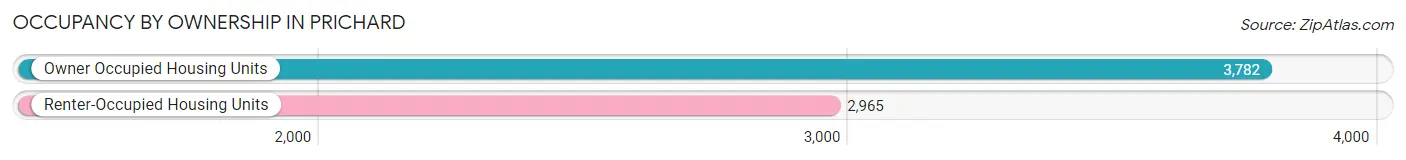
| Occupancy | # Housing Units | % Housing Units |
| Owner Occupied Housing Units | 3,782 | 56.0% |
| Renter-Occupied Housing Units | 2,965 | 44.0% |
| Total Occupied Housing Units | 6,747 | 100.0% |
Occupancy by Household Size in Prichard
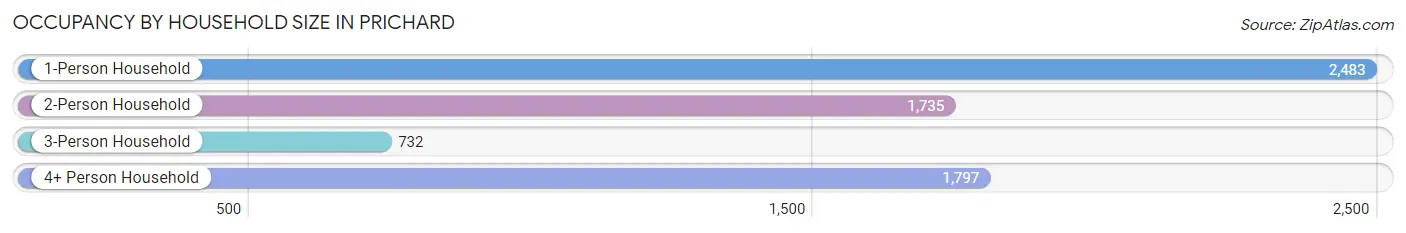
| Household Size | # Housing Units | % Housing Units |
| 1-Person Household | 2,483 | 36.8% |
| 2-Person Household | 1,735 | 25.7% |
| 3-Person Household | 732 | 10.8% |
| 4+ Person Household | 1,797 | 26.6% |
| Total Housing Units | 6,747 | 100.0% |
Occupancy by Ownership by Household Size in Prichard
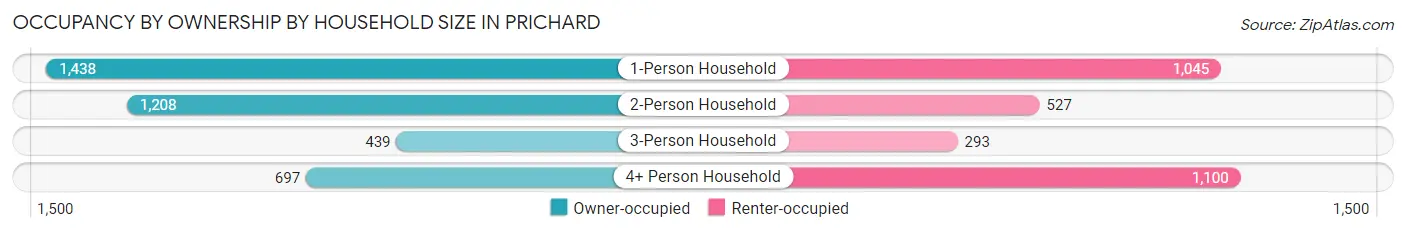
| Household Size | Owner-occupied | Renter-occupied |
| 1-Person Household | 1,438 (57.9%) | 1,045 (42.1%) |
| 2-Person Household | 1,208 (69.6%) | 527 (30.4%) |
| 3-Person Household | 439 (60.0%) | 293 (40.0%) |
| 4+ Person Household | 697 (38.8%) | 1,100 (61.2%) |
| Total Housing Units | 3,782 (56.0%) | 2,965 (44.0%) |
Occupancy by Educational Attainment in Prichard
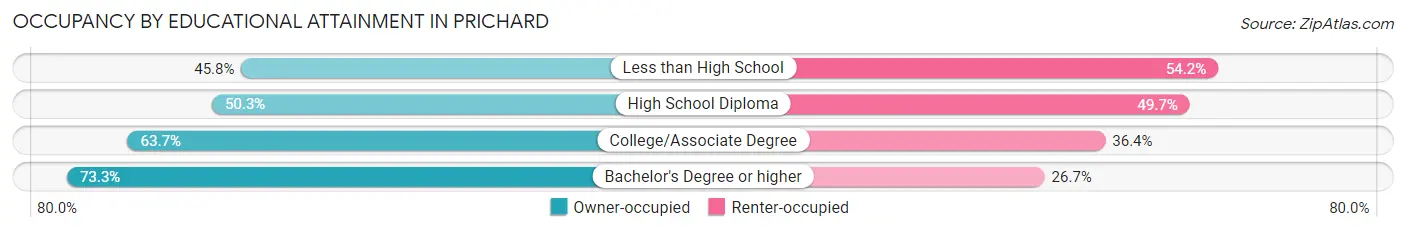
| Household Size | Owner-occupied | Renter-occupied |
| Less than High School | 528 (45.8%) | 625 (54.2%) |
| High School Diploma | 1,443 (50.3%) | 1,427 (49.7%) |
| College/Associate Degree | 1,224 (63.6%) | 699 (36.3%) |
| Bachelor's Degree or higher | 587 (73.3%) | 214 (26.7%) |
Occupancy by Age of Householder in Prichard
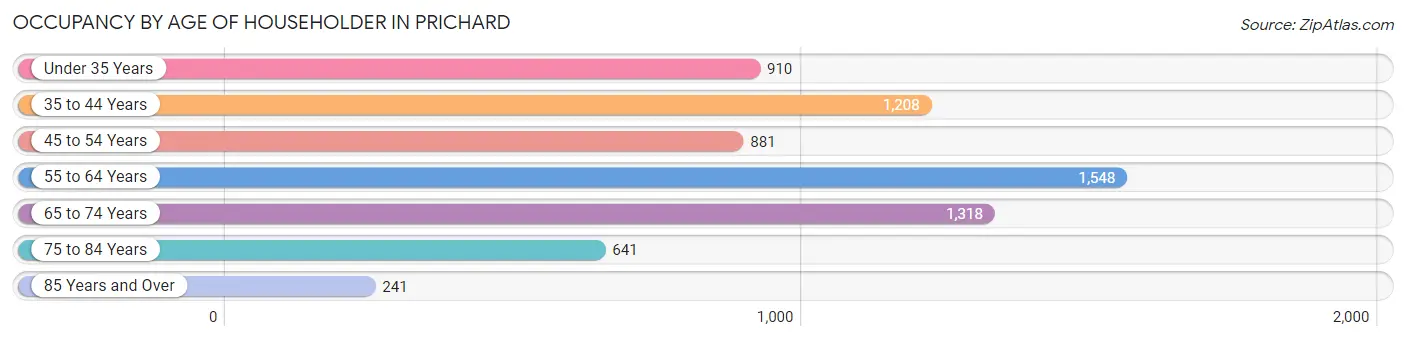
| Age Bracket | # Households | % Households |
| Under 35 Years | 910 | 13.5% |
| 35 to 44 Years | 1,208 | 17.9% |
| 45 to 54 Years | 881 | 13.1% |
| 55 to 64 Years | 1,548 | 22.9% |
| 65 to 74 Years | 1,318 | 19.5% |
| 75 to 84 Years | 641 | 9.5% |
| 85 Years and Over | 241 | 3.6% |
| Total | 6,747 | 100.0% |
Housing Finances in Prichard
Median Income by Occupancy in Prichard
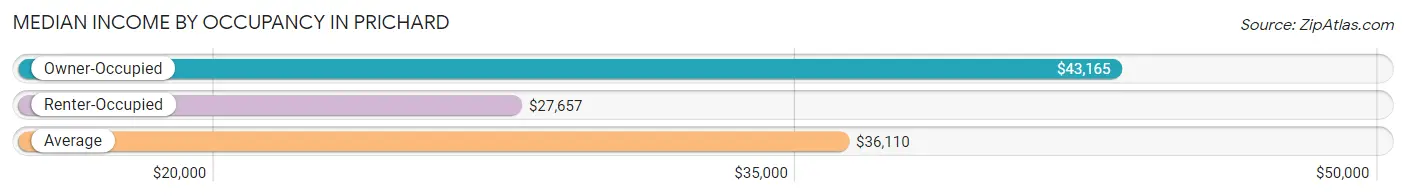
| Occupancy Type | # Households | Median Income |
| Owner-Occupied | 3,782 (56.0%) | $43,165 |
| Renter-Occupied | 2,965 (44.0%) | $27,657 |
| Average | 6,747 (100.0%) | $36,110 |
Occupancy by Householder Income Bracket in Prichard
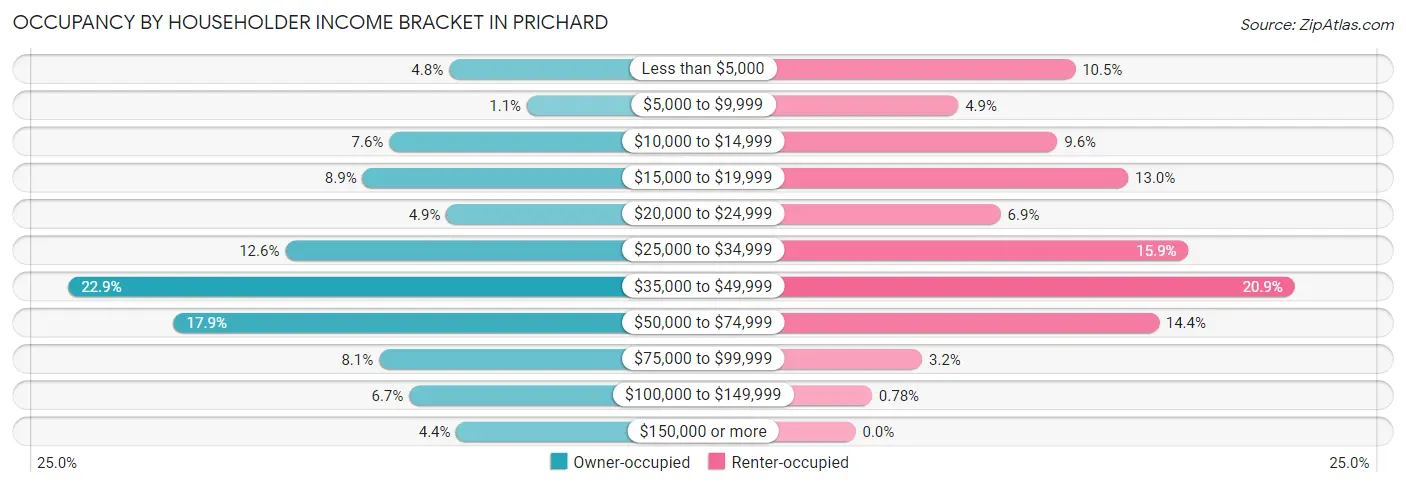
| Income Bracket | Owner-occupied | Renter-occupied |
| Less than $5,000 | 181 (4.8%) | 310 (10.5%) |
| $5,000 to $9,999 | 41 (1.1%) | 145 (4.9%) |
| $10,000 to $14,999 | 289 (7.6%) | 285 (9.6%) |
| $15,000 to $19,999 | 337 (8.9%) | 385 (13.0%) |
| $20,000 to $24,999 | 186 (4.9%) | 205 (6.9%) |
| $25,000 to $34,999 | 476 (12.6%) | 470 (15.9%) |
| $35,000 to $49,999 | 867 (22.9%) | 620 (20.9%) |
| $50,000 to $74,999 | 677 (17.9%) | 428 (14.4%) |
| $75,000 to $99,999 | 307 (8.1%) | 94 (3.2%) |
| $100,000 to $149,999 | 253 (6.7%) | 23 (0.8%) |
| $150,000 or more | 168 (4.4%) | 0 (0.0%) |
| Total | 3,782 (100.0%) | 2,965 (100.0%) |
Monthly Housing Cost Tiers in Prichard
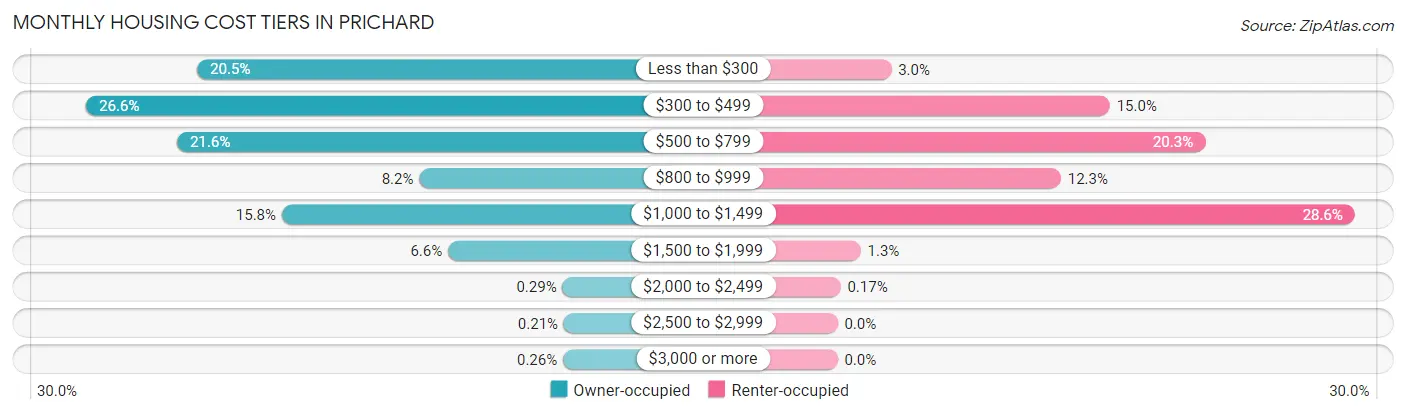
| Monthly Cost | Owner-occupied | Renter-occupied |
| Less than $300 | 774 (20.5%) | 88 (3.0%) |
| $300 to $499 | 1,006 (26.6%) | 446 (15.0%) |
| $500 to $799 | 816 (21.6%) | 602 (20.3%) |
| $800 to $999 | 310 (8.2%) | 366 (12.3%) |
| $1,000 to $1,499 | 597 (15.8%) | 847 (28.6%) |
| $1,500 to $1,999 | 250 (6.6%) | 38 (1.3%) |
| $2,000 to $2,499 | 11 (0.3%) | 5 (0.2%) |
| $2,500 to $2,999 | 8 (0.2%) | 0 (0.0%) |
| $3,000 or more | 10 (0.3%) | 0 (0.0%) |
| Total | 3,782 (100.0%) | 2,965 (100.0%) |
Physical Housing Characteristics in Prichard
Housing Structures in Prichard
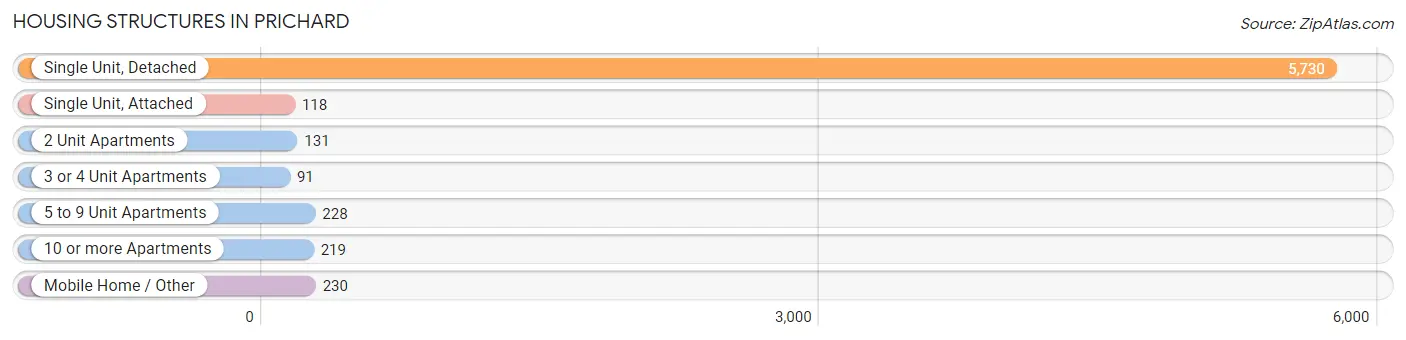
| Structure Type | # Housing Units | % Housing Units |
| Single Unit, Detached | 5,730 | 84.9% |
| Single Unit, Attached | 118 | 1.8% |
| 2 Unit Apartments | 131 | 1.9% |
| 3 or 4 Unit Apartments | 91 | 1.3% |
| 5 to 9 Unit Apartments | 228 | 3.4% |
| 10 or more Apartments | 219 | 3.3% |
| Mobile Home / Other | 230 | 3.4% |
| Total | 6,747 | 100.0% |
Housing Structures by Occupancy in Prichard
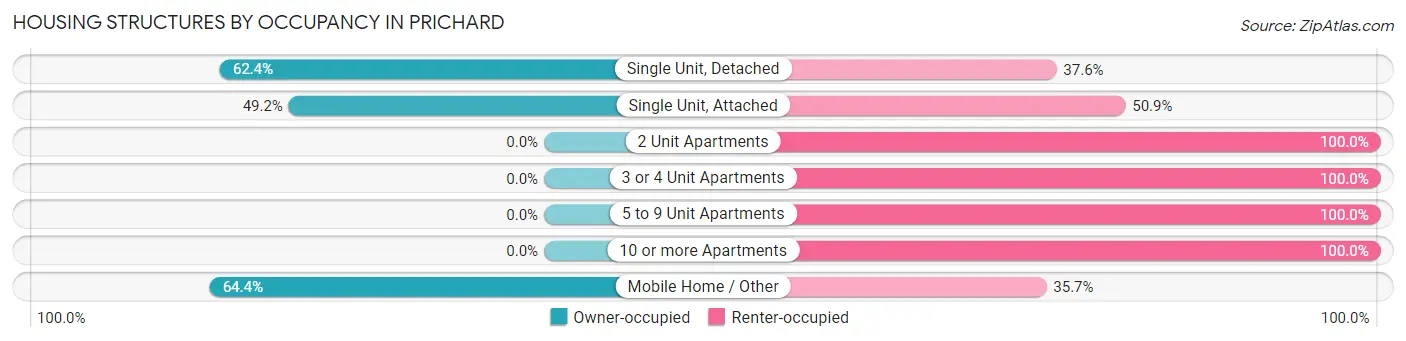
| Structure Type | Owner-occupied | Renter-occupied |
| Single Unit, Detached | 3,576 (62.4%) | 2,154 (37.6%) |
| Single Unit, Attached | 58 (49.1%) | 60 (50.8%) |
| 2 Unit Apartments | 0 (0.0%) | 131 (100.0%) |
| 3 or 4 Unit Apartments | 0 (0.0%) | 91 (100.0%) |
| 5 to 9 Unit Apartments | 0 (0.0%) | 228 (100.0%) |
| 10 or more Apartments | 0 (0.0%) | 219 (100.0%) |
| Mobile Home / Other | 148 (64.3%) | 82 (35.6%) |
| Total | 3,782 (56.0%) | 2,965 (44.0%) |
Housing Structures by Number of Rooms in Prichard
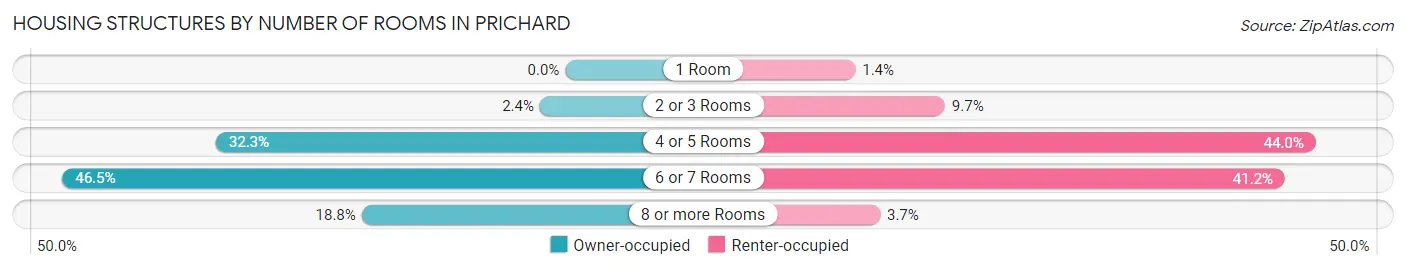
| Number of Rooms | Owner-occupied | Renter-occupied |
| 1 Room | 0 (0.0%) | 42 (1.4%) |
| 2 or 3 Rooms | 89 (2.4%) | 288 (9.7%) |
| 4 or 5 Rooms | 1,222 (32.3%) | 1,305 (44.0%) |
| 6 or 7 Rooms | 1,759 (46.5%) | 1,220 (41.1%) |
| 8 or more Rooms | 712 (18.8%) | 110 (3.7%) |
| Total | 3,782 (100.0%) | 2,965 (100.0%) |
Housing Structure by Heating Type in Prichard
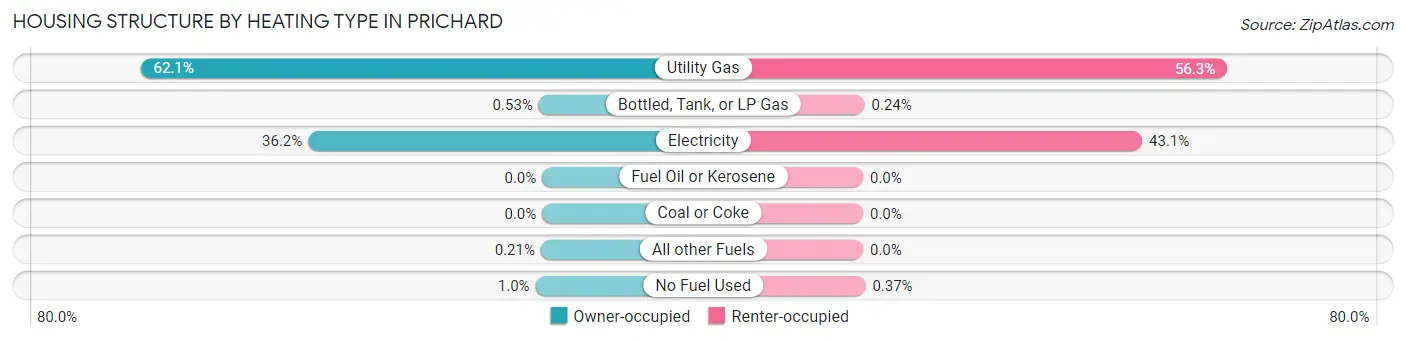
| Heating Type | Owner-occupied | Renter-occupied |
| Utility Gas | 2,347 (62.1%) | 1,668 (56.3%) |
| Bottled, Tank, or LP Gas | 20 (0.5%) | 7 (0.2%) |
| Electricity | 1,368 (36.2%) | 1,279 (43.1%) |
| Fuel Oil or Kerosene | 0 (0.0%) | 0 (0.0%) |
| Coal or Coke | 0 (0.0%) | 0 (0.0%) |
| All other Fuels | 8 (0.2%) | 0 (0.0%) |
| No Fuel Used | 39 (1.0%) | 11 (0.4%) |
| Total | 3,782 (100.0%) | 2,965 (100.0%) |
Household Vehicle Usage in Prichard
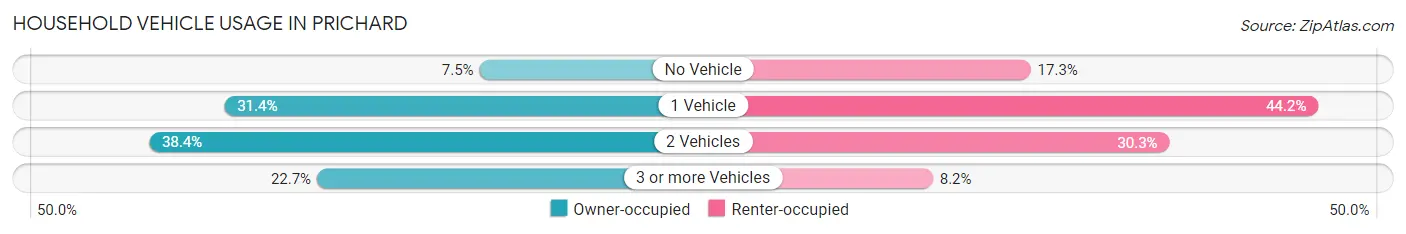
| Vehicles per Household | Owner-occupied | Renter-occupied |
| No Vehicle | 285 (7.5%) | 514 (17.3%) |
| 1 Vehicle | 1,186 (31.4%) | 1,310 (44.2%) |
| 2 Vehicles | 1,452 (38.4%) | 898 (30.3%) |
| 3 or more Vehicles | 859 (22.7%) | 243 (8.2%) |
| Total | 3,782 (100.0%) | 2,965 (100.0%) |
Real Estate & Mortgages in Prichard
Real Estate and Mortgage Overview in Prichard
| Characteristic | Without Mortgage | With Mortgage |
| Housing Units | 2,247 | 1,535 |
| Median Property Value | $57,800 | $98,700 |
| Median Household Income | $41,228 | $139 |
| Monthly Housing Costs | $356 | $0 |
| Real Estate Taxes | $297 | $321 |
Property Value by Mortgage Status in Prichard
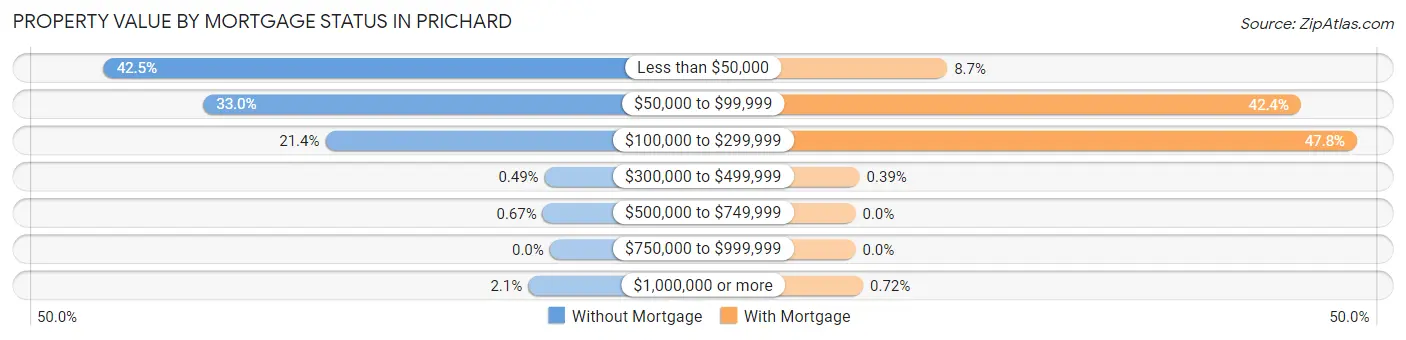
| Property Value | Without Mortgage | With Mortgage |
| Less than $50,000 | 954 (42.5%) | 134 (8.7%) |
| $50,000 to $99,999 | 741 (33.0%) | 651 (42.4%) |
| $100,000 to $299,999 | 480 (21.4%) | 733 (47.7%) |
| $300,000 to $499,999 | 11 (0.5%) | 6 (0.4%) |
| $500,000 to $749,999 | 15 (0.7%) | 0 (0.0%) |
| $750,000 to $999,999 | 0 (0.0%) | 0 (0.0%) |
| $1,000,000 or more | 46 (2.1%) | 11 (0.7%) |
| Total | 2,247 (100.0%) | 1,535 (100.0%) |
Household Income by Mortgage Status in Prichard
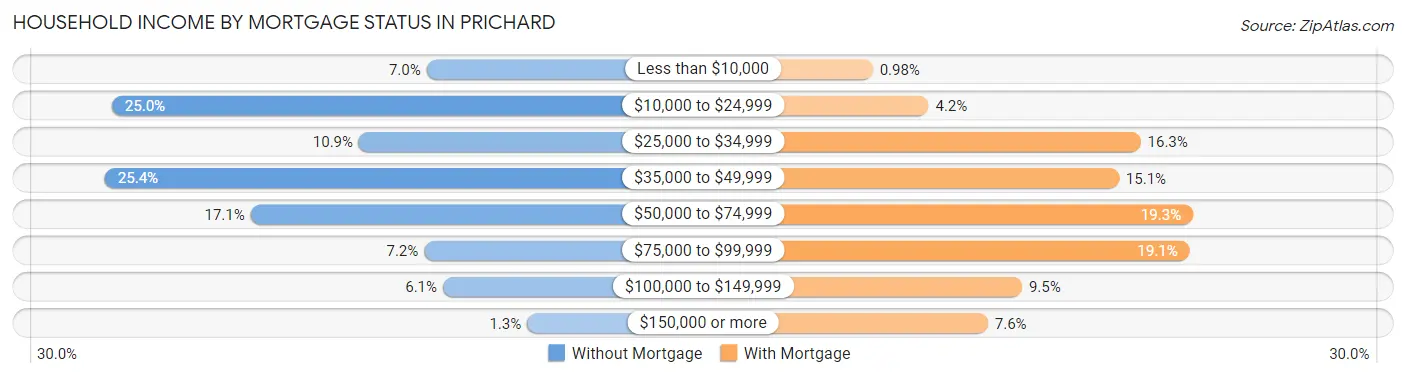
| Household Income | Without Mortgage | With Mortgage |
| Less than $10,000 | 158 (7.0%) | 15 (1.0%) |
| $10,000 to $24,999 | 562 (25.0%) | 64 (4.2%) |
| $25,000 to $34,999 | 245 (10.9%) | 250 (16.3%) |
| $35,000 to $49,999 | 571 (25.4%) | 231 (15.0%) |
| $50,000 to $74,999 | 384 (17.1%) | 296 (19.3%) |
| $75,000 to $99,999 | 161 (7.2%) | 293 (19.1%) |
| $100,000 to $149,999 | 137 (6.1%) | 146 (9.5%) |
| $150,000 or more | 29 (1.3%) | 116 (7.6%) |
| Total | 2,247 (100.0%) | 1,535 (100.0%) |
Property Value to Household Income Ratio in Prichard
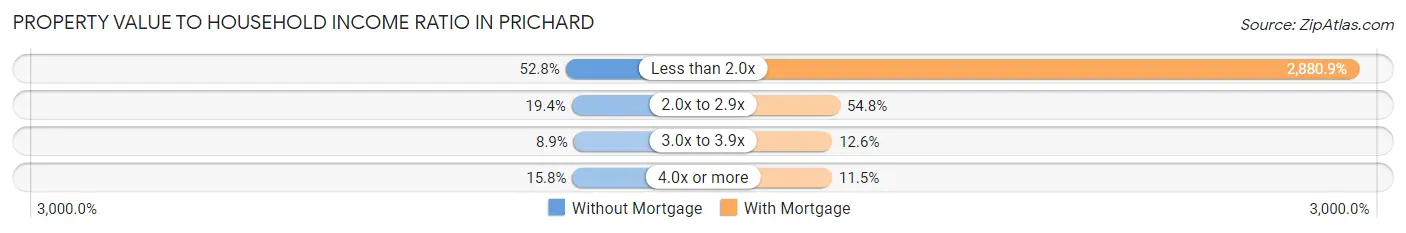
| Value-to-Income Ratio | Without Mortgage | With Mortgage |
| Less than 2.0x | 1,187 (52.8%) | 44,221 (2,880.8%) |
| 2.0x to 2.9x | 436 (19.4%) | 841 (54.8%) |
| 3.0x to 3.9x | 200 (8.9%) | 194 (12.6%) |
| 4.0x or more | 355 (15.8%) | 176 (11.5%) |
| Total | 2,247 (100.0%) | 1,535 (100.0%) |
Real Estate Taxes by Mortgage Status in Prichard
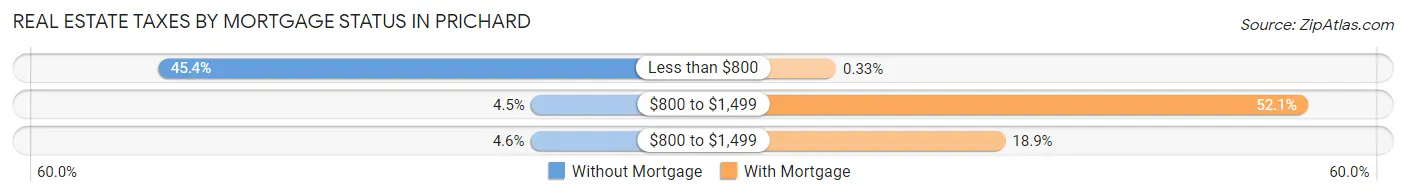
| Property Taxes | Without Mortgage | With Mortgage |
| Less than $800 | 1,020 (45.4%) | 5 (0.3%) |
| $800 to $1,499 | 102 (4.5%) | 800 (52.1%) |
| $800 to $1,499 | 103 (4.6%) | 290 (18.9%) |
| Total | 2,247 (100.0%) | 1,535 (100.0%) |
Health & Disability in Prichard
Health Insurance Coverage by Age in Prichard
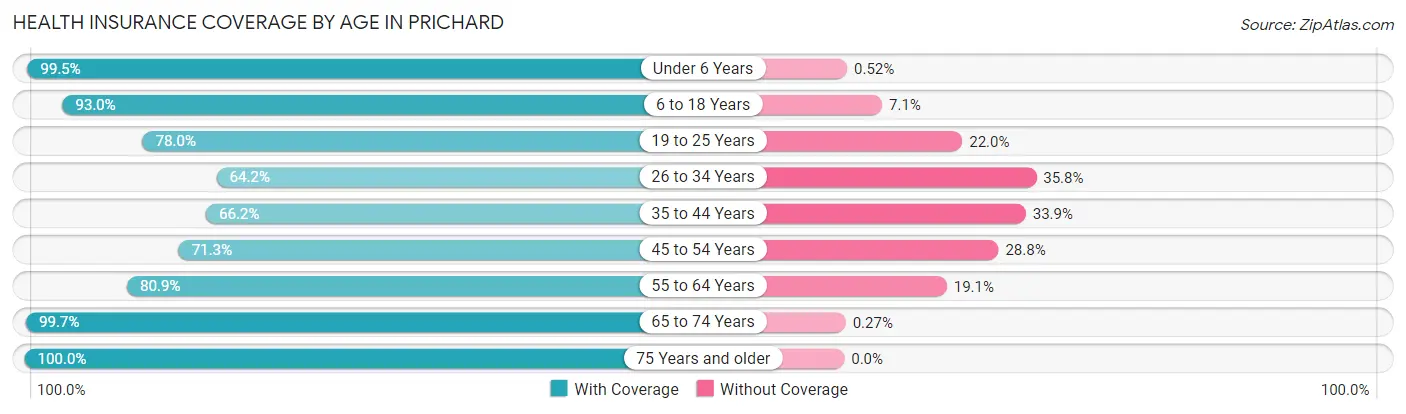
| Age Bracket | With Coverage | Without Coverage |
| Under 6 Years | 1,737 (99.5%) | 9 (0.5%) |
| 6 to 18 Years | 3,691 (92.9%) | 280 (7.0%) |
| 19 to 25 Years | 1,191 (78.0%) | 336 (22.0%) |
| 26 to 34 Years | 1,298 (64.2%) | 724 (35.8%) |
| 35 to 44 Years | 1,720 (66.1%) | 880 (33.9%) |
| 45 to 54 Years | 1,046 (71.3%) | 422 (28.7%) |
| 55 to 64 Years | 2,082 (80.9%) | 492 (19.1%) |
| 65 to 74 Years | 2,193 (99.7%) | 6 (0.3%) |
| 75 Years and older | 1,066 (100.0%) | 0 (0.0%) |
| Total | 16,024 (83.6%) | 3,149 (16.4%) |
Health Insurance Coverage by Citizenship Status in Prichard
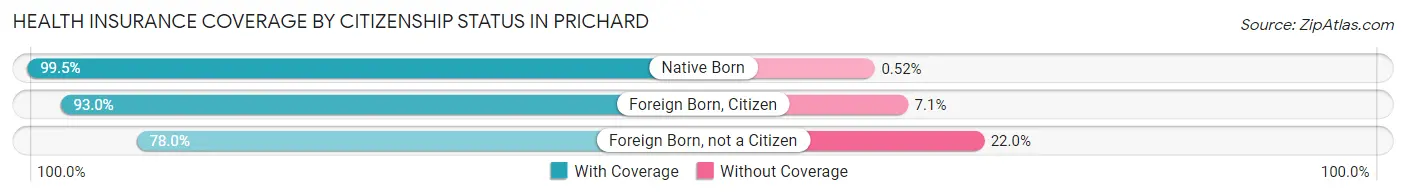
| Citizenship Status | With Coverage | Without Coverage |
| Native Born | 1,737 (99.5%) | 9 (0.5%) |
| Foreign Born, Citizen | 3,691 (92.9%) | 280 (7.0%) |
| Foreign Born, not a Citizen | 1,191 (78.0%) | 336 (22.0%) |
Health Insurance Coverage by Household Income in Prichard
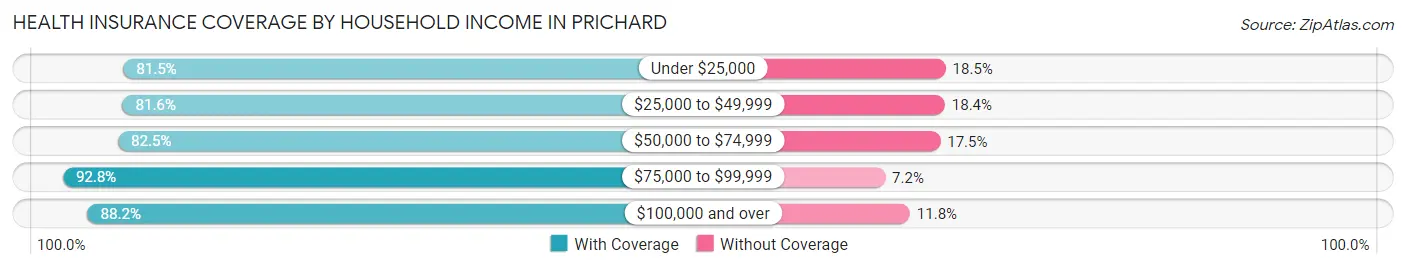
| Household Income | With Coverage | Without Coverage |
| Under $25,000 | 4,488 (81.5%) | 1,020 (18.5%) |
| $25,000 to $49,999 | 5,185 (81.6%) | 1,167 (18.4%) |
| $50,000 to $74,999 | 2,877 (82.5%) | 611 (17.5%) |
| $75,000 to $99,999 | 1,201 (92.8%) | 93 (7.2%) |
| $100,000 and over | 1,642 (88.2%) | 220 (11.8%) |
Public vs Private Health Insurance Coverage by Age in Prichard
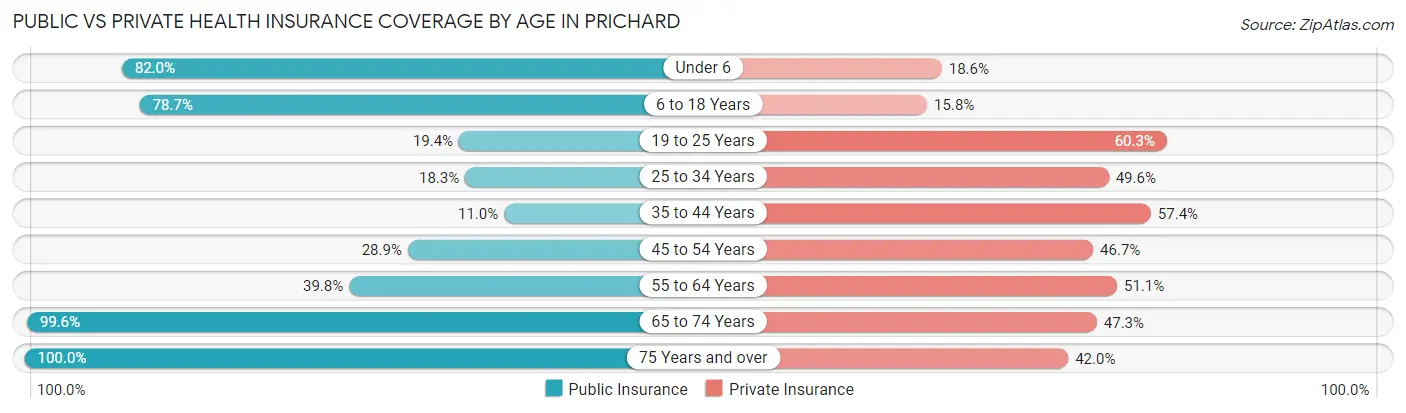
| Age Bracket | Public Insurance | Private Insurance |
| Under 6 | 1,431 (82.0%) | 324 (18.6%) |
| 6 to 18 Years | 3,124 (78.7%) | 629 (15.8%) |
| 19 to 25 Years | 296 (19.4%) | 921 (60.3%) |
| 25 to 34 Years | 369 (18.2%) | 1,002 (49.5%) |
| 35 to 44 Years | 286 (11.0%) | 1,492 (57.4%) |
| 45 to 54 Years | 424 (28.9%) | 685 (46.7%) |
| 55 to 64 Years | 1,024 (39.8%) | 1,315 (51.1%) |
| 65 to 74 Years | 2,190 (99.6%) | 1,041 (47.3%) |
| 75 Years and over | 1,066 (100.0%) | 448 (42.0%) |
| Total | 10,210 (53.2%) | 7,857 (41.0%) |
Disability Status by Sex by Age in Prichard
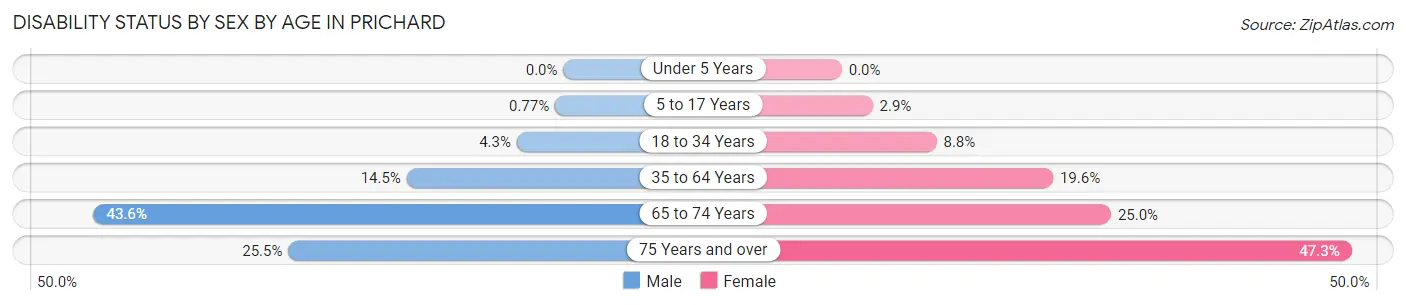
| Age Bracket | Male | Female |
| Under 5 Years | 0 (0.0%) | 0 (0.0%) |
| 5 to 17 Years | 12 (0.8%) | 59 (2.9%) |
| 18 to 34 Years | 85 (4.3%) | 189 (8.8%) |
| 35 to 64 Years | 434 (14.5%) | 717 (19.6%) |
| 65 to 74 Years | 402 (43.6%) | 319 (25.0%) |
| 75 Years and over | 121 (25.5%) | 280 (47.3%) |
Disability Class by Sex by Age in Prichard
Disability Class: Hearing Difficulty
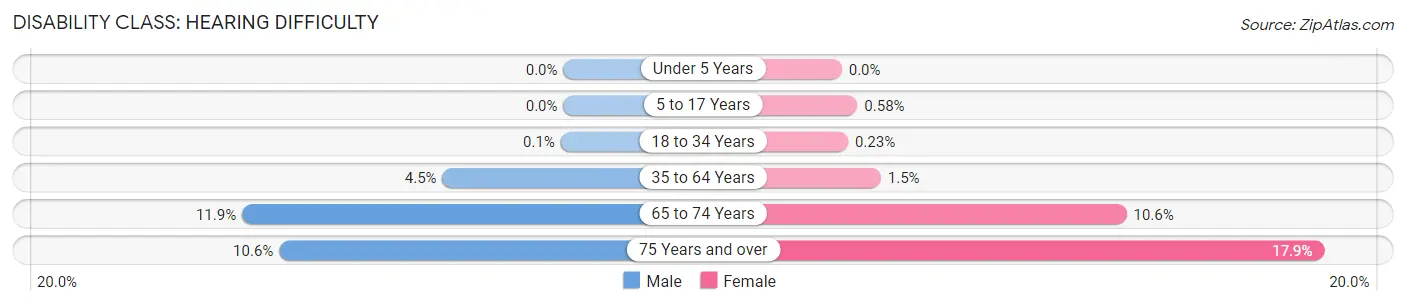
| Age Bracket | Male | Female |
| Under 5 Years | 0 (0.0%) | 0 (0.0%) |
| 5 to 17 Years | 0 (0.0%) | 12 (0.6%) |
| 18 to 34 Years | 2 (0.1%) | 5 (0.2%) |
| 35 to 64 Years | 134 (4.5%) | 53 (1.5%) |
| 65 to 74 Years | 110 (11.9%) | 135 (10.6%) |
| 75 Years and over | 50 (10.5%) | 106 (17.9%) |
Disability Class: Vision Difficulty
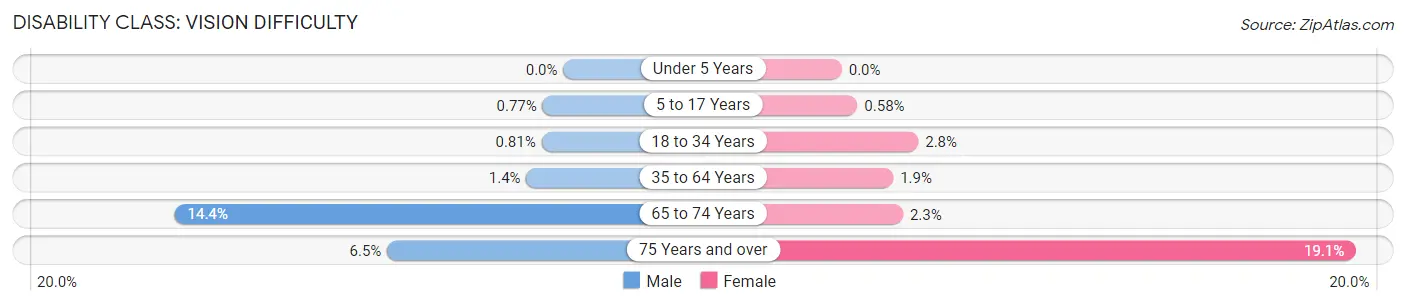
| Age Bracket | Male | Female |
| Under 5 Years | 0 (0.0%) | 0 (0.0%) |
| 5 to 17 Years | 12 (0.8%) | 12 (0.6%) |
| 18 to 34 Years | 16 (0.8%) | 61 (2.8%) |
| 35 to 64 Years | 41 (1.4%) | 70 (1.9%) |
| 65 to 74 Years | 133 (14.4%) | 29 (2.3%) |
| 75 Years and over | 31 (6.5%) | 113 (19.1%) |
Disability Class: Cognitive Difficulty
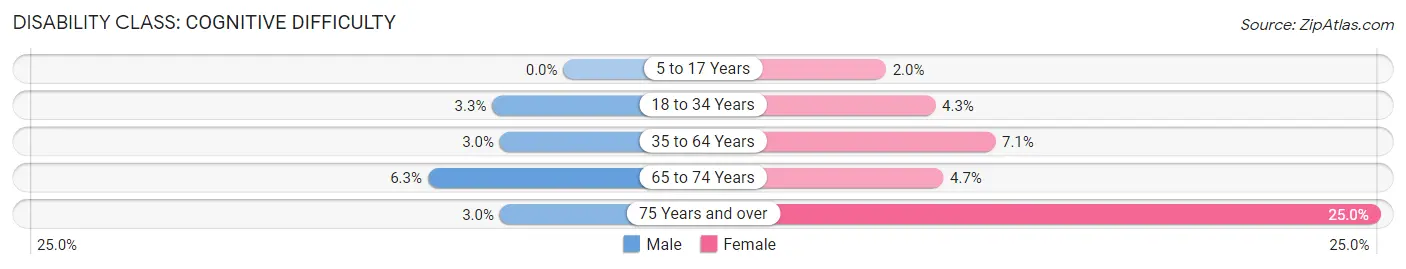
| Age Bracket | Male | Female |
| 5 to 17 Years | 0 (0.0%) | 42 (2.0%) |
| 18 to 34 Years | 65 (3.3%) | 93 (4.3%) |
| 35 to 64 Years | 88 (2.9%) | 260 (7.1%) |
| 65 to 74 Years | 58 (6.3%) | 60 (4.7%) |
| 75 Years and over | 14 (2.9%) | 148 (25.0%) |
Disability Class: Ambulatory Difficulty
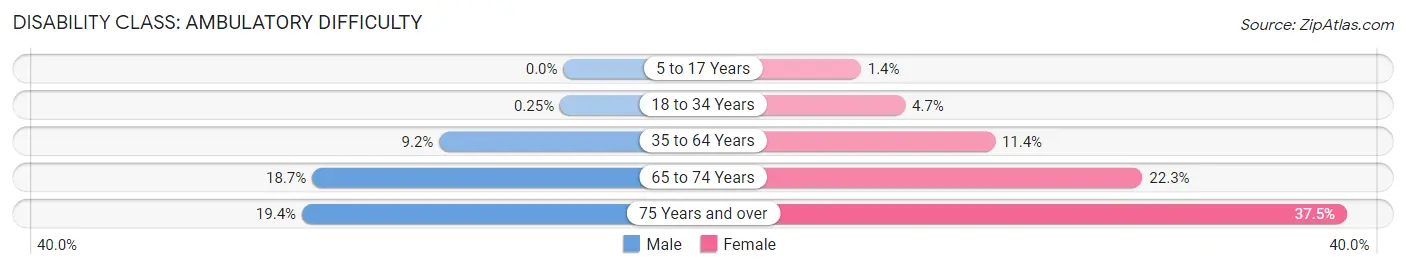
| Age Bracket | Male | Female |
| 5 to 17 Years | 0 (0.0%) | 29 (1.4%) |
| 18 to 34 Years | 5 (0.3%) | 101 (4.7%) |
| 35 to 64 Years | 275 (9.2%) | 416 (11.4%) |
| 65 to 74 Years | 172 (18.7%) | 285 (22.3%) |
| 75 Years and over | 92 (19.4%) | 222 (37.5%) |
Disability Class: Self-Care Difficulty
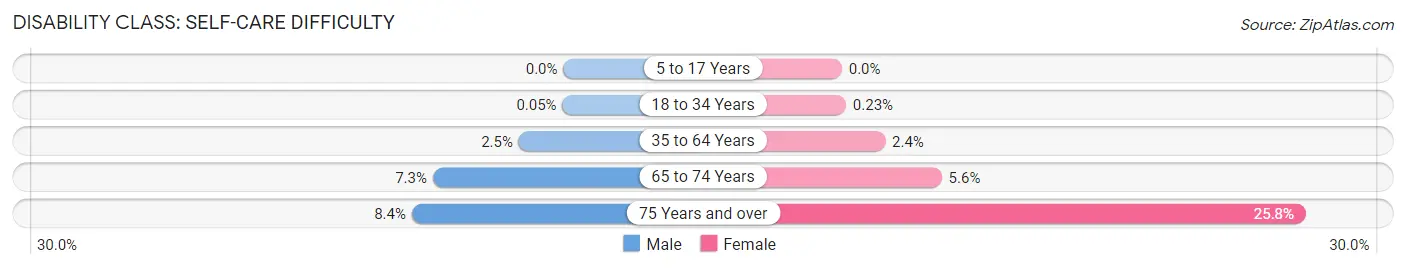
| Age Bracket | Male | Female |
| 5 to 17 Years | 0 (0.0%) | 0 (0.0%) |
| 18 to 34 Years | 1 (0.1%) | 5 (0.2%) |
| 35 to 64 Years | 74 (2.5%) | 88 (2.4%) |
| 65 to 74 Years | 67 (7.3%) | 71 (5.6%) |
| 75 Years and over | 40 (8.4%) | 153 (25.8%) |
Technology Access in Prichard
Computing Device Access in Prichard
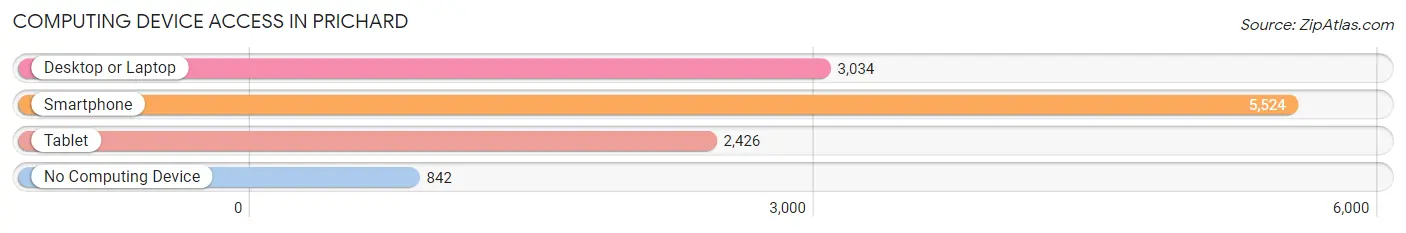
| Device Type | # Households | % Households |
| Desktop or Laptop | 3,034 | 45.0% |
| Smartphone | 5,524 | 81.9% |
| Tablet | 2,426 | 36.0% |
| No Computing Device | 842 | 12.5% |
| Total | 6,747 | 100.0% |
Internet Access in Prichard
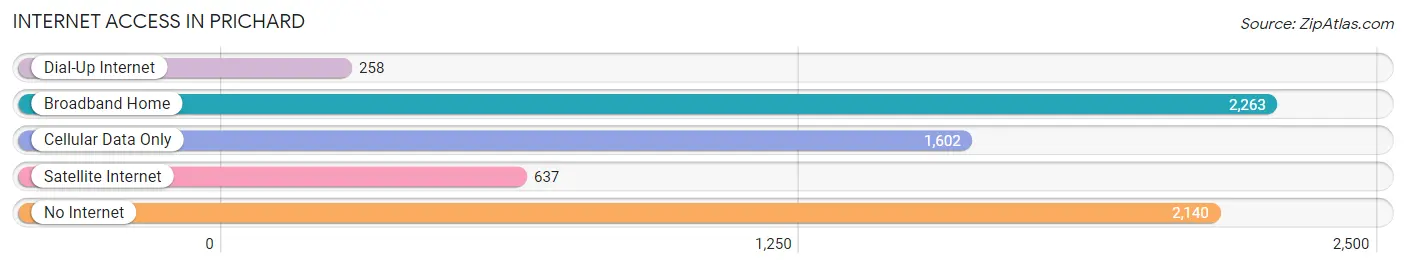
| Internet Type | # Households | % Households |
| Dial-Up Internet | 258 | 3.8% |
| Broadband Home | 2,263 | 33.5% |
| Cellular Data Only | 1,602 | 23.7% |
| Satellite Internet | 637 | 9.4% |
| No Internet | 2,140 | 31.7% |
| Total | 6,747 | 100.0% |
Prichard Summary
Prichard, Alabama is a city located in Mobile County, Alabama, United States. It is situated along the northern shore of Mobile Bay, approximately 8 miles north of the city of Mobile. The population of Prichard was 22,659 at the 2010 census.
History
Prichard was founded in 1881 by a group of investors led by John Prichard, a former mayor of Mobile. The city was incorporated in 1887 and was named after John Prichard. Prichard was originally a small farming community, but it quickly grew into a bustling industrial center. The city was home to several large factories, including the Prichard Iron Works, which produced iron and steel products for the region.
In the early 20th century, Prichard was a major center of African-American culture and commerce. The city was home to several prominent African-American businesses, including the Prichard Mutual Life Insurance Company, the Prichard Savings Bank, and the Prichard News.
In the 1950s, Prichard experienced a period of rapid growth and development. The city was home to several large industrial plants, including the Prichard Shipyard, which employed thousands of workers. The city also had a thriving retail sector, with several large department stores and shopping centers.
In the late 1960s, Prichard began to experience a period of decline. The city's industrial base began to decline, and many of the city's businesses closed. The city's population also began to decline, as many residents moved to other parts of the country in search of better economic opportunities.
Geography
Prichard is located at 30°45'25" North, 88°3'25" West (30.756944, -88.056944). According to the United States Census Bureau, the city has a total area of 11.2 square miles (29.0 km2), of which 10.9 square miles (28.2 km2) is land and 0.3 square miles (0.8 km2) is water.
Economy
Prichard's economy is largely based on the service sector. The city is home to several large retail stores, including Walmart, Target, and Lowe's. The city also has a thriving medical sector, with several hospitals and medical centers.
Prichard is also home to several large industrial plants, including the Prichard Shipyard, which produces ships and other vessels for the U.S. Navy. The city is also home to several large manufacturing plants, including the Prichard Iron Works, which produces iron and steel products for the region.
Demographics
As of the 2010 census, there were 22,659 people, 8,845 households, and 5,845 families residing in the city. The population density was 2,072.2 people per square mile (800.2/km2). There were 9,845 housing units at an average density of 899.3 per square mile (347.2/km2). The racial makeup of the city was 57.2% African American, 37.3% White, 0.3% Native American, 0.7% Asian, 0.1% Pacific Islander, 2.2% from other races, and 2.4% from two or more races. Hispanic or Latino of any race were 4.2% of the population.
There were 8,845 households, out of which 33.2% had children under the age of 18 living with them, 28.2% were married couples living together, 33.2% had a female householder with no husband present, and 32.2% were non-families. 27.2% of all households were made up of individuals, and 10.2% had someone living alone who was 65 years of age or older. The average household size was 2.54 and the average family size was 3.09.
In the city, the population was spread out, with 28.2% under the age of 18, 9.2% from 18 to 24, 27.2% from 25 to 44, 22.2% from 45 to 64, and 13.2% who were 65 years of age or older. The median age was 34 years. For every 100 females, there were 87.2 males. For every 100 females age 18 and over, there were 81.2 males.
The median income for a household in the city was $25,972, and the median income for a family was $30,972. Males had a median income of $27,972 versus $20,972 for females. The per capita income for the city was $13,972. About 22.2% of families and 25.2% of the population were below the poverty line, including 36.2% of those under age 18 and 16.2% of those age 65 or over.
Common Questions
What is the Total Population of Prichard?
Total Population of Prichard is 19,353.
What is the Total Male Population of Prichard?
Total Male Population of Prichard is 8,753.
What is the Total Female Population of Prichard?
Total Female Population of Prichard is 10,600.
What is the Ratio of Males per 100 Females in Prichard?
There are 82.58 Males per 100 Females in Prichard.
What is the Ratio of Females per 100 Males in Prichard?
There are 121.10 Females per 100 Males in Prichard.
What is the Median Population Age in Prichard?
Median Population Age in Prichard is 37.0 Years.
What is the Average Family Size in Prichard
Average Family Size in Prichard is 3.7 People.
What is the Average Household Size in Prichard
Average Household Size in Prichard is 2.8 People.
What is Per Capita Income in Prichard?
Per Capita income in Prichard is $16,937.
What is the Median Family Income in Prichard?
Median Family Income in Prichard is $45,192.
What is the Median Household income in Prichard?
Median Household Income in Prichard is $36,110.
What is Income or Wage Gap in Prichard?
Income or Wage Gap in Prichard is 12.3%.
Women in Prichard earn 87.7 cents for every dollar earned by a man.
What is Inequality or Gini Index in Prichard?
Inequality or Gini Index in Prichard is 0.44.
How Large is the Labor Force in Prichard?
There are 6,803 People in the Labor Forcein in Prichard.
What is the Percentage of People in the Labor Force in Prichard?
46.1% of People are in the Labor Force in Prichard.
What is the Unemployment Rate in Prichard?
Unemployment Rate in Prichard is 10.5%.