Immigrants from Trinidad and Tobago vs Taiwanese No Vehicles in Household
COMPARE
Immigrants from Trinidad and Tobago
Taiwanese
No Vehicles in Household
No Vehicles in Household Comparison
Immigrants from Trinidad and Tobago
Taiwanese
24.6%
NO VEHICLES IN HOUSEHOLD
0.0/ 100
METRIC RATING
333rd/ 347
METRIC RANK
11.7%
NO VEHICLES IN HOUSEHOLD
2.8/ 100
METRIC RATING
239th/ 347
METRIC RANK
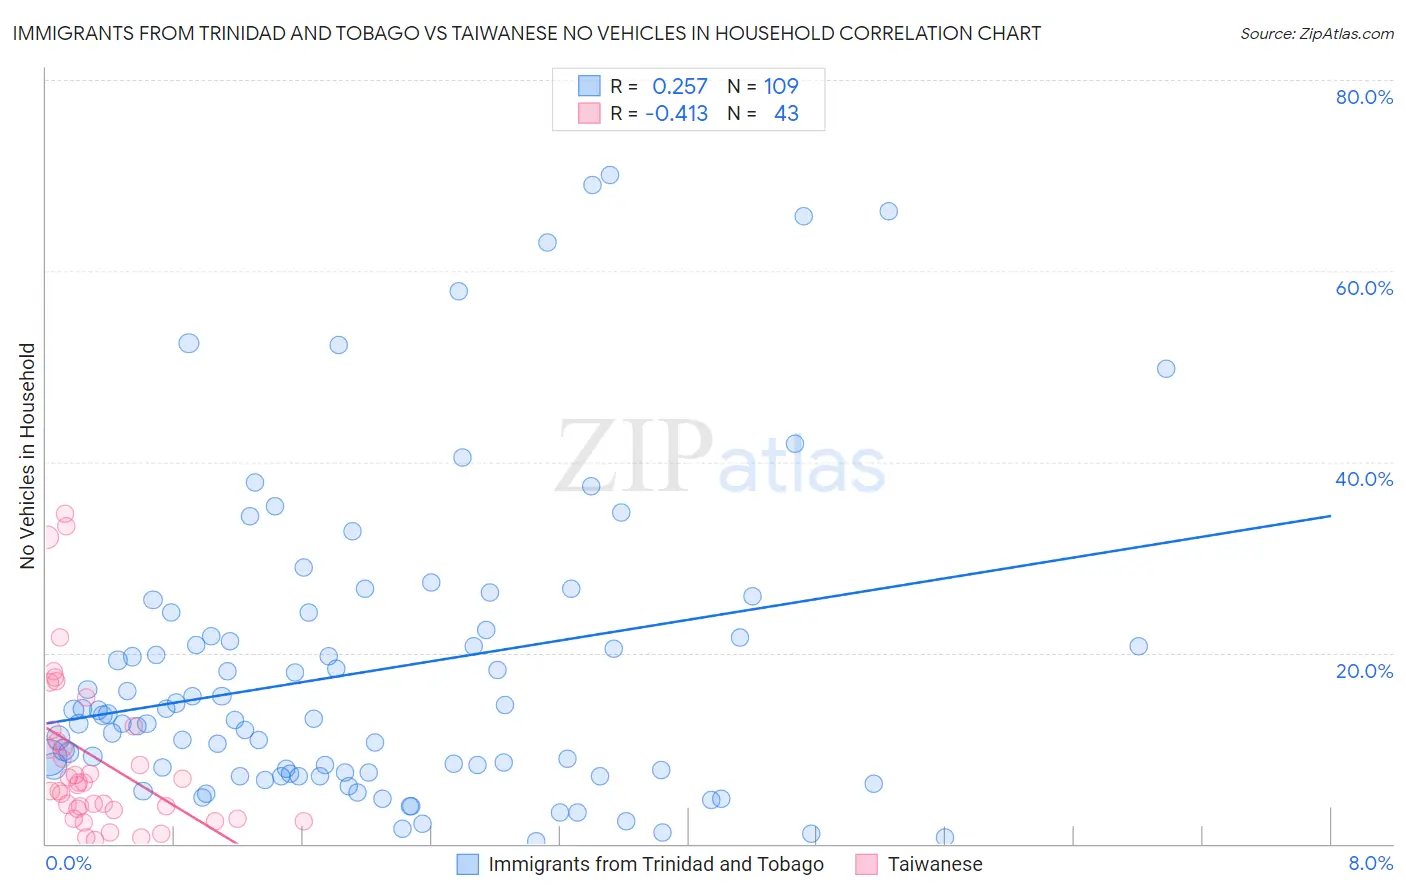
Immigrants from Trinidad and Tobago vs Taiwanese No Vehicles in Household Correlation Chart
The statistical analysis conducted on geographies consisting of 223,315,906 people shows a weak positive correlation between the proportion of Immigrants from Trinidad and Tobago and percentage of households with no vehicle available in the United States with a correlation coefficient (R) of 0.257 and weighted average of 24.6%. Similarly, the statistical analysis conducted on geographies consisting of 31,685,560 people shows a moderate negative correlation between the proportion of Taiwanese and percentage of households with no vehicle available in the United States with a correlation coefficient (R) of -0.413 and weighted average of 11.7%, a difference of 111.3%.
No Vehicles in Household Correlation Summary
| Measurement | Immigrants from Trinidad and Tobago | Taiwanese |
| Minimum | 0.21% | 0.39% |
| Maximum | 70.0% | 34.6% |
| Range | 69.8% | 34.2% |
| Mean | 18.1% | 9.0% |
| Median | 13.0% | 6.4% |
| Interquartile 25% (IQ1) | 7.4% | 3.6% |
| Interquartile 75% (IQ3) | 22.0% | 11.9% |
| Interquartile Range (IQR) | 14.6% | 8.3% |
| Standard Deviation (Sample) | 16.0% | 8.6% |
| Standard Deviation (Population) | 15.9% | 8.5% |
Similar Demographics by No Vehicles in Household
Demographics Similar to Immigrants from Trinidad and Tobago by No Vehicles in Household
In terms of no vehicles in household, the demographic groups most similar to Immigrants from Trinidad and Tobago are Immigrants from Ecuador (23.8%, a difference of 3.4%), Trinidadian and Tobagonian (23.7%, a difference of 3.7%), West Indian (23.7%, a difference of 3.9%), Immigrants from Bangladesh (25.8%, a difference of 4.5%), and Barbadian (26.1%, a difference of 5.9%).
| Demographics | Rating | Rank | No Vehicles in Household |
| Immigrants | West Indies | 0.0 /100 | #326 | Tragic 20.5% |
| Immigrants | Senegal | 0.0 /100 | #327 | Tragic 21.1% |
| Immigrants | Dominica | 0.0 /100 | #328 | Tragic 22.2% |
| Ecuadorians | 0.0 /100 | #329 | Tragic 22.8% |
| West Indians | 0.0 /100 | #330 | Tragic 23.7% |
| Trinidadians and Tobagonians | 0.0 /100 | #331 | Tragic 23.7% |
| Immigrants | Ecuador | 0.0 /100 | #332 | Tragic 23.8% |
| Immigrants | Trinidad and Tobago | 0.0 /100 | #333 | Tragic 24.6% |
| Immigrants | Bangladesh | 0.0 /100 | #334 | Tragic 25.8% |
| Barbadians | 0.0 /100 | #335 | Tragic 26.1% |
| Vietnamese | 0.0 /100 | #336 | Tragic 26.2% |
| Immigrants | Uzbekistan | 0.0 /100 | #337 | Tragic 26.7% |
| Guyanese | 0.0 /100 | #338 | Tragic 29.3% |
| Dominicans | 0.0 /100 | #339 | Tragic 29.4% |
| Immigrants | Barbados | 0.0 /100 | #340 | Tragic 29.5% |
Demographics Similar to Taiwanese by No Vehicles in Household
In terms of no vehicles in household, the demographic groups most similar to Taiwanese are Immigrants (11.7%, a difference of 0.060%), Eastern European (11.7%, a difference of 0.070%), Turkish (11.7%, a difference of 0.18%), Russian (11.6%, a difference of 0.46%), and Ute (11.6%, a difference of 0.51%).
| Demographics | Rating | Rank | No Vehicles in Household |
| Immigrants | Turkey | 4.8 /100 | #232 | Tragic 11.5% |
| Houma | 4.7 /100 | #233 | Tragic 11.5% |
| Immigrants | Peru | 4.5 /100 | #234 | Tragic 11.5% |
| Kiowa | 4.0 /100 | #235 | Tragic 11.5% |
| Cree | 3.5 /100 | #236 | Tragic 11.6% |
| Ute | 3.3 /100 | #237 | Tragic 11.6% |
| Russians | 3.2 /100 | #238 | Tragic 11.6% |
| Taiwanese | 2.8 /100 | #239 | Tragic 11.7% |
| Immigrants | Immigrants | 2.7 /100 | #240 | Tragic 11.7% |
| Eastern Europeans | 2.7 /100 | #241 | Tragic 11.7% |
| Turks | 2.6 /100 | #242 | Tragic 11.7% |
| Cheyenne | 2.4 /100 | #243 | Tragic 11.7% |
| Immigrants | Portugal | 2.2 /100 | #244 | Tragic 11.7% |
| Immigrants | Honduras | 2.1 /100 | #245 | Tragic 11.8% |
| Menominee | 2.0 /100 | #246 | Tragic 11.8% |