Immigrants from Sweden vs Cheyenne No Vehicles in Household
COMPARE
Immigrants from Sweden
Cheyenne
No Vehicles in Household
No Vehicles in Household Comparison
Immigrants from Sweden
Cheyenne
10.8%
NO VEHICLES IN HOUSEHOLD
22.9/ 100
METRIC RATING
198th/ 347
METRIC RANK
11.7%
NO VEHICLES IN HOUSEHOLD
2.4/ 100
METRIC RATING
243rd/ 347
METRIC RANK
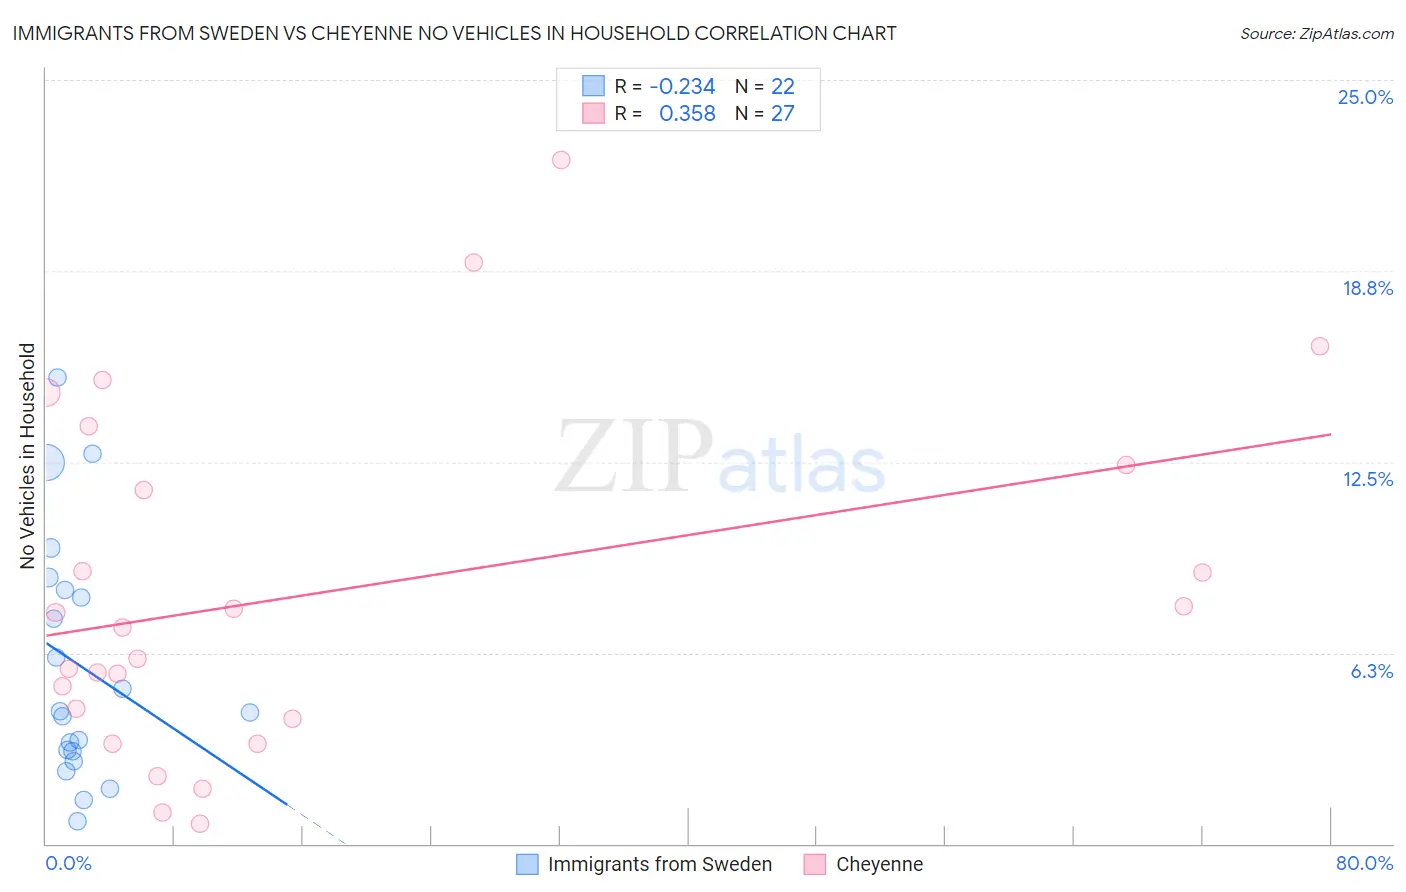
Immigrants from Sweden vs Cheyenne No Vehicles in Household Correlation Chart
The statistical analysis conducted on geographies consisting of 164,538,272 people shows a weak negative correlation between the proportion of Immigrants from Sweden and percentage of households with no vehicle available in the United States with a correlation coefficient (R) of -0.234 and weighted average of 10.8%. Similarly, the statistical analysis conducted on geographies consisting of 80,645,180 people shows a mild positive correlation between the proportion of Cheyenne and percentage of households with no vehicle available in the United States with a correlation coefficient (R) of 0.358 and weighted average of 11.7%, a difference of 8.2%.
No Vehicles in Household Correlation Summary
| Measurement | Immigrants from Sweden | Cheyenne |
| Minimum | 0.75% | 0.64% |
| Maximum | 15.3% | 22.4% |
| Range | 14.5% | 21.7% |
| Mean | 5.8% | 8.2% |
| Median | 4.3% | 7.1% |
| Interquartile 25% (IQ1) | 3.0% | 4.1% |
| Interquartile 75% (IQ3) | 8.3% | 12.4% |
| Interquartile Range (IQR) | 5.3% | 8.3% |
| Standard Deviation (Sample) | 4.0% | 5.7% |
| Standard Deviation (Population) | 3.9% | 5.6% |
Similar Demographics by No Vehicles in Household
Demographics Similar to Immigrants from Sweden by No Vehicles in Household
In terms of no vehicles in household, the demographic groups most similar to Immigrants from Sweden are Shoshone (10.8%, a difference of 0.21%), Central American (10.8%, a difference of 0.25%), Immigrants from Asia (10.9%, a difference of 0.31%), Immigrants from Brazil (10.8%, a difference of 0.59%), and Cambodian (10.9%, a difference of 0.64%).
| Demographics | Rating | Rank | No Vehicles in Household |
| Immigrants | Northern Europe | 33.1 /100 | #191 | Fair 10.7% |
| Carpatho Rusyns | 32.1 /100 | #192 | Fair 10.7% |
| Ukrainians | 28.0 /100 | #193 | Fair 10.7% |
| Pueblo | 27.0 /100 | #194 | Fair 10.8% |
| Immigrants | Brazil | 26.3 /100 | #195 | Fair 10.8% |
| Central Americans | 24.3 /100 | #196 | Fair 10.8% |
| Shoshone | 24.1 /100 | #197 | Fair 10.8% |
| Immigrants | Sweden | 22.9 /100 | #198 | Fair 10.8% |
| Immigrants | Asia | 21.3 /100 | #199 | Fair 10.9% |
| Cambodians | 19.6 /100 | #200 | Poor 10.9% |
| Immigrants | Western Europe | 19.1 /100 | #201 | Poor 10.9% |
| Romanians | 17.9 /100 | #202 | Poor 10.9% |
| Iroquois | 17.6 /100 | #203 | Poor 10.9% |
| Guatemalans | 16.1 /100 | #204 | Poor 11.0% |
| Immigrants | Chile | 15.9 /100 | #205 | Poor 11.0% |
Demographics Similar to Cheyenne by No Vehicles in Household
In terms of no vehicles in household, the demographic groups most similar to Cheyenne are Immigrants from Portugal (11.7%, a difference of 0.18%), Turkish (11.7%, a difference of 0.33%), Immigrants from Honduras (11.8%, a difference of 0.37%), Eastern European (11.7%, a difference of 0.44%), and Immigrants (11.7%, a difference of 0.45%).
| Demographics | Rating | Rank | No Vehicles in Household |
| Cree | 3.5 /100 | #236 | Tragic 11.6% |
| Ute | 3.3 /100 | #237 | Tragic 11.6% |
| Russians | 3.2 /100 | #238 | Tragic 11.6% |
| Taiwanese | 2.8 /100 | #239 | Tragic 11.7% |
| Immigrants | Immigrants | 2.7 /100 | #240 | Tragic 11.7% |
| Eastern Europeans | 2.7 /100 | #241 | Tragic 11.7% |
| Turks | 2.6 /100 | #242 | Tragic 11.7% |
| Cheyenne | 2.4 /100 | #243 | Tragic 11.7% |
| Immigrants | Portugal | 2.2 /100 | #244 | Tragic 11.7% |
| Immigrants | Honduras | 2.1 /100 | #245 | Tragic 11.8% |
| Menominee | 2.0 /100 | #246 | Tragic 11.8% |
| Immigrants | Czechoslovakia | 2.0 /100 | #247 | Tragic 11.8% |
| Immigrants | Belgium | 1.9 /100 | #248 | Tragic 11.8% |
| Immigrants | Nigeria | 1.9 /100 | #249 | Tragic 11.8% |
| Paiute | 1.8 /100 | #250 | Tragic 11.8% |