Guamanian/Chamorro vs Ecuadorian No Vehicles in Household
COMPARE
Guamanian/Chamorro
Ecuadorian
No Vehicles in Household
No Vehicles in Household Comparison
Guamanians/Chamorros
Ecuadorians
8.0%
NO VEHICLES IN HOUSEHOLD
99.9/ 100
METRIC RATING
49th/ 347
METRIC RANK
22.8%
NO VEHICLES IN HOUSEHOLD
0.0/ 100
METRIC RATING
329th/ 347
METRIC RANK
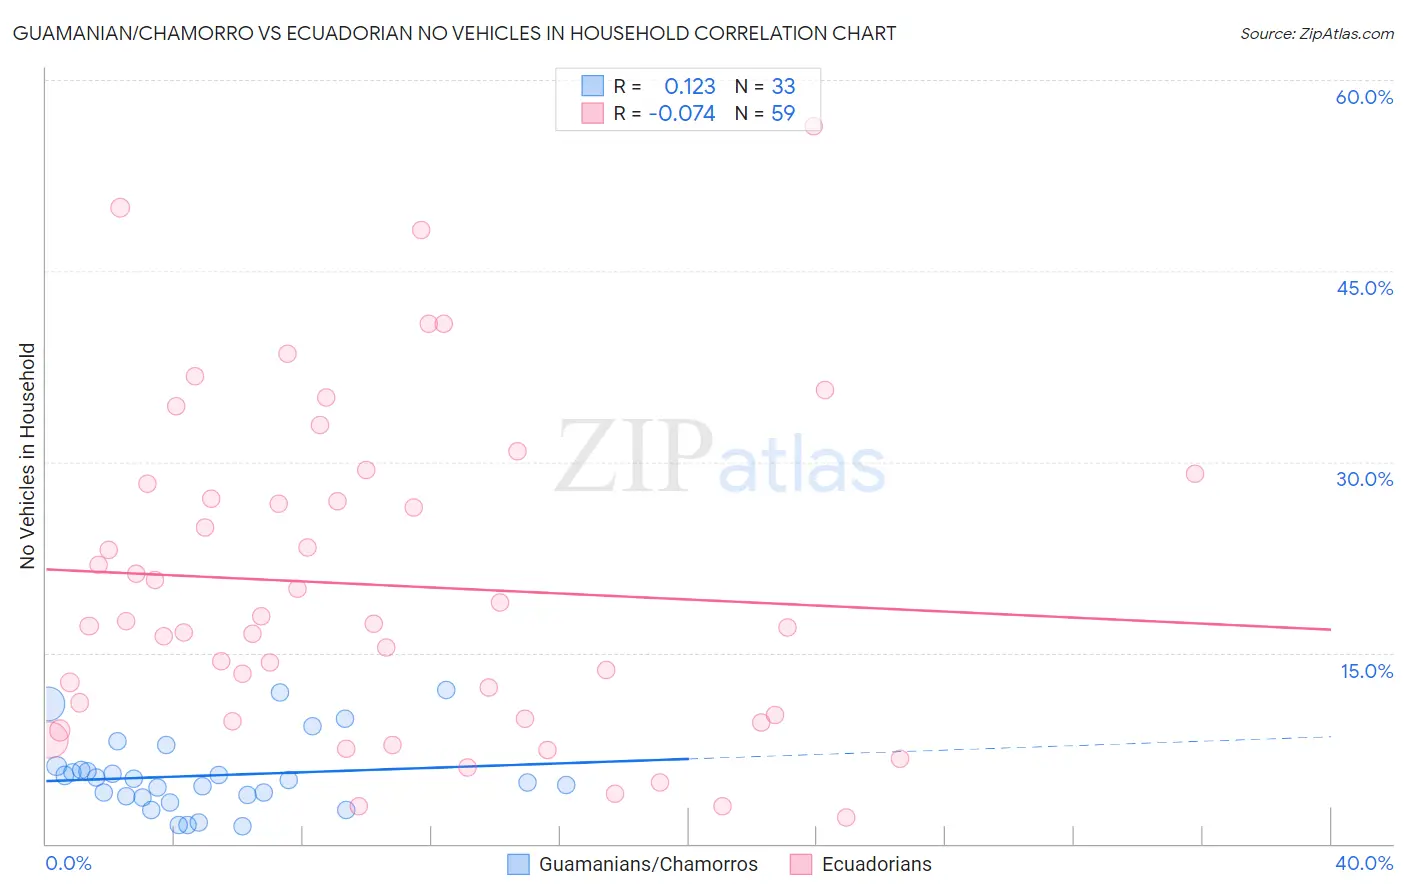
Guamanian/Chamorro vs Ecuadorian No Vehicles in Household Correlation Chart
The statistical analysis conducted on geographies consisting of 221,696,459 people shows a poor positive correlation between the proportion of Guamanians/Chamorros and percentage of households with no vehicle available in the United States with a correlation coefficient (R) of 0.123 and weighted average of 8.0%. Similarly, the statistical analysis conducted on geographies consisting of 317,233,310 people shows a slight negative correlation between the proportion of Ecuadorians and percentage of households with no vehicle available in the United States with a correlation coefficient (R) of -0.074 and weighted average of 22.8%, a difference of 185.1%.
No Vehicles in Household Correlation Summary
| Measurement | Guamanian/Chamorro | Ecuadorian |
| Minimum | 1.4% | 2.1% |
| Maximum | 12.1% | 56.4% |
| Range | 10.7% | 54.3% |
| Mean | 5.4% | 20.3% |
| Median | 5.0% | 17.3% |
| Interquartile 25% (IQ1) | 3.7% | 9.8% |
| Interquartile 75% (IQ3) | 6.0% | 28.3% |
| Interquartile Range (IQR) | 2.3% | 18.5% |
| Standard Deviation (Sample) | 2.9% | 12.7% |
| Standard Deviation (Population) | 2.8% | 12.5% |
Similar Demographics by No Vehicles in Household
Demographics Similar to Guamanians/Chamorros by No Vehicles in Household
In terms of no vehicles in household, the demographic groups most similar to Guamanians/Chamorros are Belgian (8.0%, a difference of 0.070%), Afghan (8.0%, a difference of 0.17%), Korean (8.0%, a difference of 0.17%), Northern European (7.9%, a difference of 0.65%), and Hawaiian (8.0%, a difference of 0.75%).
| Demographics | Rating | Rank | No Vehicles in Household |
| Swiss | 99.9 /100 | #42 | Exceptional 7.9% |
| Chickasaw | 99.9 /100 | #43 | Exceptional 7.9% |
| Choctaw | 99.9 /100 | #44 | Exceptional 7.9% |
| Immigrants | Nonimmigrants | 99.9 /100 | #45 | Exceptional 7.9% |
| Spanish | 99.9 /100 | #46 | Exceptional 7.9% |
| Northern Europeans | 99.9 /100 | #47 | Exceptional 7.9% |
| Afghans | 99.9 /100 | #48 | Exceptional 8.0% |
| Guamanians/Chamorros | 99.9 /100 | #49 | Exceptional 8.0% |
| Belgians | 99.9 /100 | #50 | Exceptional 8.0% |
| Koreans | 99.9 /100 | #51 | Exceptional 8.0% |
| Hawaiians | 99.9 /100 | #52 | Exceptional 8.0% |
| Slovenes | 99.9 /100 | #53 | Exceptional 8.0% |
| Immigrants | Venezuela | 99.9 /100 | #54 | Exceptional 8.1% |
| Celtics | 99.9 /100 | #55 | Exceptional 8.1% |
| Immigrants | Afghanistan | 99.9 /100 | #56 | Exceptional 8.1% |
Demographics Similar to Ecuadorians by No Vehicles in Household
In terms of no vehicles in household, the demographic groups most similar to Ecuadorians are Immigrants from Dominica (22.2%, a difference of 2.3%), West Indian (23.7%, a difference of 4.2%), Trinidadian and Tobagonian (23.7%, a difference of 4.4%), Immigrants from Ecuador (23.8%, a difference of 4.7%), and Immigrants from Senegal (21.1%, a difference of 7.6%).
| Demographics | Rating | Rank | No Vehicles in Household |
| Immigrants | Cabo Verde | 0.0 /100 | #322 | Tragic 18.4% |
| Immigrants | Yemen | 0.0 /100 | #323 | Tragic 19.5% |
| Immigrants | Caribbean | 0.0 /100 | #324 | Tragic 19.6% |
| Senegalese | 0.0 /100 | #325 | Tragic 19.8% |
| Immigrants | West Indies | 0.0 /100 | #326 | Tragic 20.5% |
| Immigrants | Senegal | 0.0 /100 | #327 | Tragic 21.1% |
| Immigrants | Dominica | 0.0 /100 | #328 | Tragic 22.2% |
| Ecuadorians | 0.0 /100 | #329 | Tragic 22.8% |
| West Indians | 0.0 /100 | #330 | Tragic 23.7% |
| Trinidadians and Tobagonians | 0.0 /100 | #331 | Tragic 23.7% |
| Immigrants | Ecuador | 0.0 /100 | #332 | Tragic 23.8% |
| Immigrants | Trinidad and Tobago | 0.0 /100 | #333 | Tragic 24.6% |
| Immigrants | Bangladesh | 0.0 /100 | #334 | Tragic 25.8% |
| Barbadians | 0.0 /100 | #335 | Tragic 26.1% |
| Vietnamese | 0.0 /100 | #336 | Tragic 26.2% |