Guamanian/Chamorro vs Czechoslovakian No Vehicles in Household
COMPARE
Guamanian/Chamorro
Czechoslovakian
No Vehicles in Household
No Vehicles in Household Comparison
Guamanians/Chamorros
Czechoslovakians
8.0%
NO VEHICLES IN HOUSEHOLD
99.9/ 100
METRIC RATING
49th/ 347
METRIC RANK
7.8%
NO VEHICLES IN HOUSEHOLD
99.9/ 100
METRIC RATING
40th/ 347
METRIC RANK
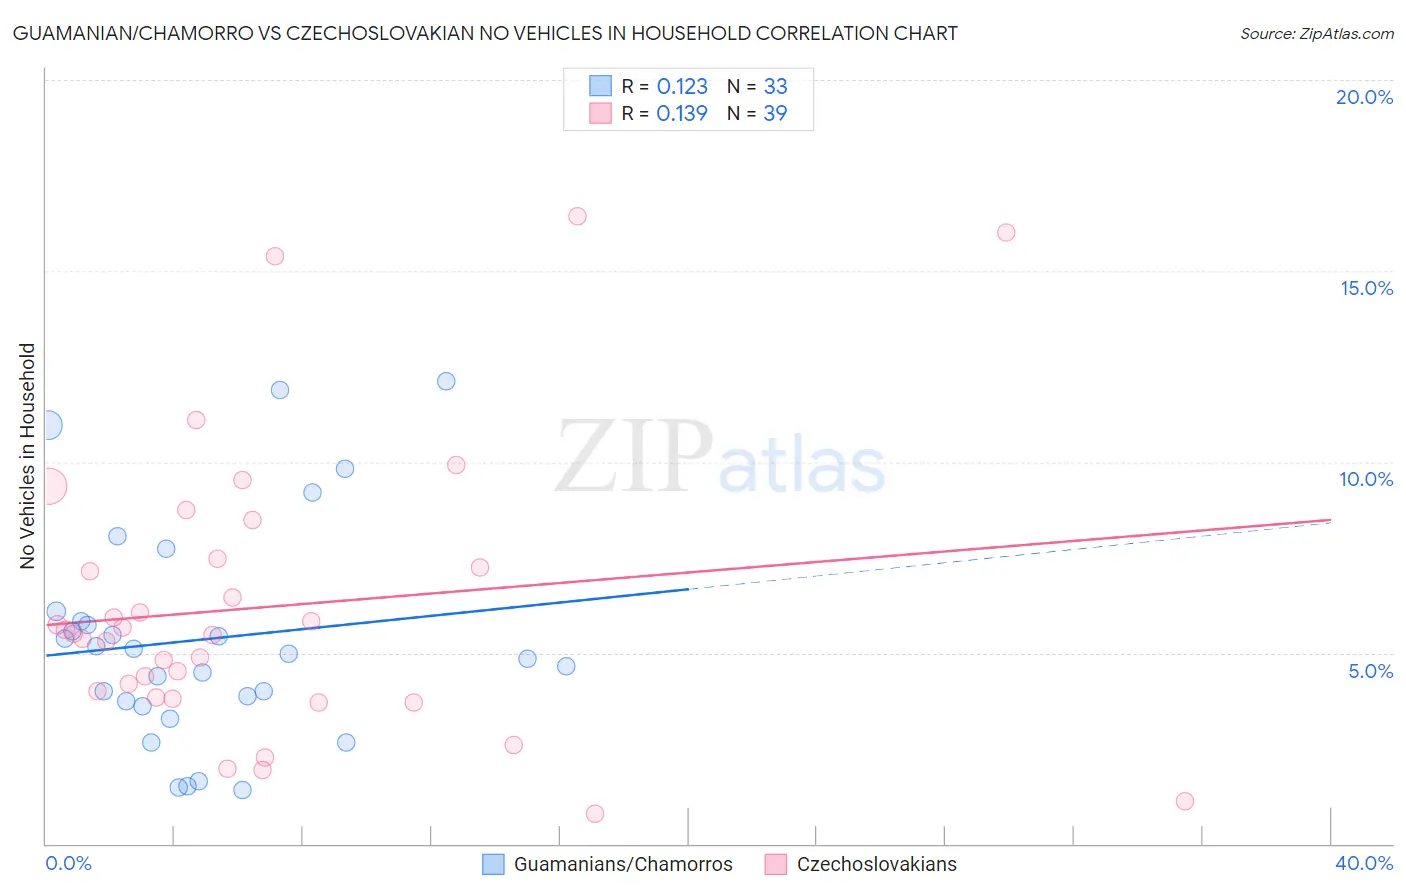
Guamanian/Chamorro vs Czechoslovakian No Vehicles in Household Correlation Chart
The statistical analysis conducted on geographies consisting of 221,696,459 people shows a poor positive correlation between the proportion of Guamanians/Chamorros and percentage of households with no vehicle available in the United States with a correlation coefficient (R) of 0.123 and weighted average of 8.0%. Similarly, the statistical analysis conducted on geographies consisting of 367,718,828 people shows a poor positive correlation between the proportion of Czechoslovakians and percentage of households with no vehicle available in the United States with a correlation coefficient (R) of 0.139 and weighted average of 7.8%, a difference of 1.9%.
No Vehicles in Household Correlation Summary
| Measurement | Guamanian/Chamorro | Czechoslovakian |
| Minimum | 1.4% | 0.79% |
| Maximum | 12.1% | 16.4% |
| Range | 10.7% | 15.7% |
| Mean | 5.4% | 6.2% |
| Median | 5.0% | 5.5% |
| Interquartile 25% (IQ1) | 3.7% | 3.8% |
| Interquartile 75% (IQ3) | 6.0% | 7.5% |
| Interquartile Range (IQR) | 2.3% | 3.6% |
| Standard Deviation (Sample) | 2.9% | 3.7% |
| Standard Deviation (Population) | 2.8% | 3.7% |
Demographics Similar to Guamanians/Chamorros and Czechoslovakians by No Vehicles in Household
In terms of no vehicles in household, the demographic groups most similar to Guamanians/Chamorros are Belgian (8.0%, a difference of 0.070%), Afghan (8.0%, a difference of 0.17%), Korean (8.0%, a difference of 0.17%), Northern European (7.9%, a difference of 0.65%), and Hawaiian (8.0%, a difference of 0.75%). Similarly, the demographic groups most similar to Czechoslovakians are Immigrants from Fiji (7.8%, a difference of 0.10%), French Canadian (7.8%, a difference of 0.14%), Swiss (7.9%, a difference of 0.28%), Chickasaw (7.9%, a difference of 0.36%), and Creek (7.8%, a difference of 0.68%).
| Demographics | Rating | Rank | No Vehicles in Household |
| Immigrants | Vietnam | 100.0 /100 | #34 | Exceptional 7.7% |
| Cherokee | 99.9 /100 | #35 | Exceptional 7.7% |
| Iraqis | 99.9 /100 | #36 | Exceptional 7.7% |
| Basques | 99.9 /100 | #37 | Exceptional 7.8% |
| Creek | 99.9 /100 | #38 | Exceptional 7.8% |
| Immigrants | Fiji | 99.9 /100 | #39 | Exceptional 7.8% |
| Czechoslovakians | 99.9 /100 | #40 | Exceptional 7.8% |
| French Canadians | 99.9 /100 | #41 | Exceptional 7.8% |
| Swiss | 99.9 /100 | #42 | Exceptional 7.9% |
| Chickasaw | 99.9 /100 | #43 | Exceptional 7.9% |
| Choctaw | 99.9 /100 | #44 | Exceptional 7.9% |
| Immigrants | Nonimmigrants | 99.9 /100 | #45 | Exceptional 7.9% |
| Spanish | 99.9 /100 | #46 | Exceptional 7.9% |
| Northern Europeans | 99.9 /100 | #47 | Exceptional 7.9% |
| Afghans | 99.9 /100 | #48 | Exceptional 8.0% |
| Guamanians/Chamorros | 99.9 /100 | #49 | Exceptional 8.0% |
| Belgians | 99.9 /100 | #50 | Exceptional 8.0% |
| Koreans | 99.9 /100 | #51 | Exceptional 8.0% |
| Hawaiians | 99.9 /100 | #52 | Exceptional 8.0% |
| Slovenes | 99.9 /100 | #53 | Exceptional 8.0% |
| Immigrants | Venezuela | 99.9 /100 | #54 | Exceptional 8.1% |