French vs Immigrants from Indonesia 3 or more Vehicles in Household
COMPARE
French
Immigrants from Indonesia
3 or more Vehicles in Household
3 or more Vehicles in Household Comparison
French
Immigrants from Indonesia
21.4%
3 OR MORE VEHICLES IN HOUSEHOLD
99.4/ 100
METRIC RATING
88th/ 347
METRIC RANK
21.1%
3 OR MORE VEHICLES IN HOUSEHOLD
98.8/ 100
METRIC RATING
93rd/ 347
METRIC RANK
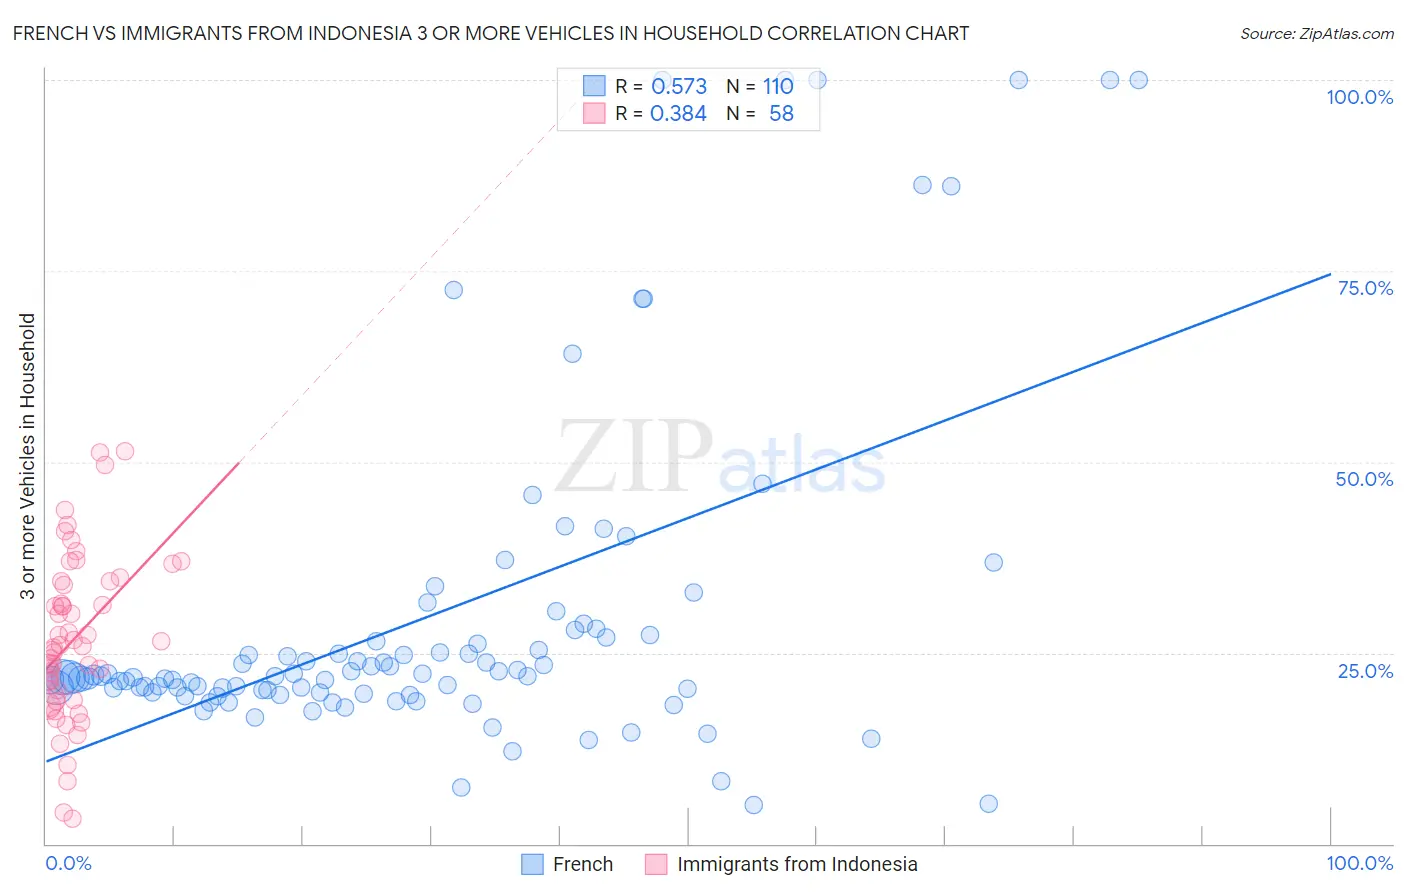
French vs Immigrants from Indonesia 3 or more Vehicles in Household Correlation Chart
The statistical analysis conducted on geographies consisting of 571,506,399 people shows a substantial positive correlation between the proportion of French and percentage of households with 3 or more vehicles available in the United States with a correlation coefficient (R) of 0.573 and weighted average of 21.4%. Similarly, the statistical analysis conducted on geographies consisting of 215,673,146 people shows a mild positive correlation between the proportion of Immigrants from Indonesia and percentage of households with 3 or more vehicles available in the United States with a correlation coefficient (R) of 0.384 and weighted average of 21.1%, a difference of 1.4%.
3 or more Vehicles in Household Correlation Summary
| Measurement | French | Immigrants from Indonesia |
| Minimum | 5.1% | 3.3% |
| Maximum | 100.0% | 51.4% |
| Range | 94.9% | 48.1% |
| Mean | 29.6% | 26.9% |
| Median | 21.9% | 26.0% |
| Interquartile 25% (IQ1) | 19.8% | 19.0% |
| Interquartile 75% (IQ3) | 27.1% | 34.3% |
| Interquartile Range (IQR) | 7.3% | 15.3% |
| Standard Deviation (Sample) | 22.0% | 10.7% |
| Standard Deviation (Population) | 21.9% | 10.6% |
Demographics Similar to French and Immigrants from Indonesia by 3 or more Vehicles in Household
In terms of 3 or more vehicles in household, the demographic groups most similar to French are Immigrants from the Azores (21.5%, a difference of 0.26%), Delaware (21.5%, a difference of 0.38%), Laotian (21.5%, a difference of 0.46%), Icelander (21.5%, a difference of 0.47%), and Chippewa (21.5%, a difference of 0.53%). Similarly, the demographic groups most similar to Immigrants from Indonesia are Apache (21.2%, a difference of 0.20%), Immigrants from Cambodia (21.1%, a difference of 0.23%), Belgian (21.2%, a difference of 0.28%), Pakistani (21.0%, a difference of 0.37%), and Cree (21.0%, a difference of 0.46%).
| Demographics | Rating | Rank | 3 or more Vehicles in Household |
| Afghans | 99.7 /100 | #80 | Exceptional 21.7% |
| Celtics | 99.7 /100 | #81 | Exceptional 21.7% |
| Immigrants | El Salvador | 99.6 /100 | #82 | Exceptional 21.5% |
| Chippewa | 99.6 /100 | #83 | Exceptional 21.5% |
| Icelanders | 99.6 /100 | #84 | Exceptional 21.5% |
| Laotians | 99.6 /100 | #85 | Exceptional 21.5% |
| Delaware | 99.6 /100 | #86 | Exceptional 21.5% |
| Immigrants | Azores | 99.5 /100 | #87 | Exceptional 21.5% |
| French | 99.4 /100 | #88 | Exceptional 21.4% |
| Marshallese | 99.2 /100 | #89 | Exceptional 21.3% |
| Immigrants | Afghanistan | 99.1 /100 | #90 | Exceptional 21.2% |
| Belgians | 98.9 /100 | #91 | Exceptional 21.2% |
| Apache | 98.9 /100 | #92 | Exceptional 21.2% |
| Immigrants | Indonesia | 98.8 /100 | #93 | Exceptional 21.1% |
| Immigrants | Cambodia | 98.6 /100 | #94 | Exceptional 21.1% |
| Pakistanis | 98.5 /100 | #95 | Exceptional 21.0% |
| Cree | 98.4 /100 | #96 | Exceptional 21.0% |
| Canadians | 98.3 /100 | #97 | Exceptional 21.0% |
| Hmong | 98.2 /100 | #98 | Exceptional 21.0% |
| Alaska Natives | 98.2 /100 | #99 | Exceptional 21.0% |
| Comanche | 98.2 /100 | #100 | Exceptional 21.0% |