Bahamian vs Ottawa 1 or more Vehicles in Household

COMPARE

Bahamian
Race
Ancestry
AfghanAfricanAlaska NativeAlaskan AthabascanAlbanianAleutAlsatianAmericanApacheArabArapahoArgentineanArmenianAssyrian/Chaldean/SyriacAustralianAustrianBahamianBangladeshiBarbadianBasqueBelgianBelizeanBermudanBhutaneseBlackfeetBolivianBrazilianBritishBritish West IndianBulgarianBurmeseCajunCambodianCanadianCape VerdeanCarpatho RusynCelticCentral AmericanCentral American IndianCherokeeCheyenneChickasawChileanChineseChippewaChoctawColombianColvilleComancheCosta RicanCreeCreekCroatianCrowCubanCypriotCzechCzechoslovakianDanishDelawareDominicanDutchDutch West IndianEastern EuropeanEcuadorianEgyptianEnglishEstonianEthiopianEuropeanFijianFilipinoFinnishFrenchFrench American IndianFrench CanadianGermanGerman RussianGhanaianGreekGuamanian/ChamorroGuatemalanGuyaneseHaitianHmongHonduranHopiHoumaHungarianIcelanderIndian (Asian)IndonesianInupiatIranianIraqiIrishIroquoisIsraeliItalianJamaicanJapaneseJordanianKenyanKiowaKoreanLaotianLatvianLebaneseLiberianLithuanianLumbeeLuxembourgerMacedonianMalaysianMalteseMarshalleseMenomineeMexicanMexican American IndianMongolianMoroccanNative HawaiianNavajoNepaleseNew ZealanderNicaraguanNigerianNorthern EuropeanNorwegianOkinawanOsagePaiutePakistaniPalestinianPanamanianParaguayanPennsylvania GermanPeruvianPimaPolishPortuguesePotawatomiPuebloPuerto RicanPuget Sound SalishRomanianRussianSalvadoranSamoanScandinavianScotch-IrishScottishSeminoleSenegaleseSerbianShoshoneSierra LeoneanSiouxSlavicSlovakSloveneSomaliSouth AfricanSouth AmericanSouth American IndianSoviet UnionSpaniardSpanishSpanish AmericanSpanish American IndianSri LankanSubsaharan AfricanSudaneseSwedishSwissSyrianTaiwaneseThaiTlingit-HaidaTohono O'OdhamTonganTrinidadian and TobagonianTsimshianTurkishU.S. Virgin IslanderUgandanUkrainianUruguayanUteVenezuelanVietnameseWelshWest IndianYakamaYaquiYugoslavianYumanYup'ikZimbabwean
Immigration
NonimmigrantsImmigrantsAfghanistanAfricaAlbaniaArgentinaArmeniaAsiaAustraliaAustriaBahamasBangladeshBarbadosBelarusBelgiumBelizeBoliviaBosnia and HerzegovinaBrazilBulgariaBurma/MyanmarCabo VerdeCambodiaCameroonCanadaCaribbeanCentral AmericaChileChinaColombiaCongoCosta RicaCroatiaCubaCzechoslovakiaDenmarkDominicaDominican RepublicEastern AfricaEastern AsiaEastern EuropeEcuadorEgyptEl SalvadorEnglandEritreaEthiopiaEuropeFijiFranceGermanyGhanaGreeceGrenadaGuatemalaGuyanaHaitiHondurasHong KongHungaryIndiaIndonesiaIranIraqIrelandIsraelItalyJamaicaJapanJordanKazakhstanKenyaKoreaKuwaitLaosLatin AmericaLatviaLebanonLiberiaLithuaniaMalaysiaMexicoMicronesiaMiddle AfricaMoldovaMoroccoNepalNetherlandsNicaraguaNigeriaNorth AmericaNorth MacedoniaNorthern AfricaNorthern EuropeNorwayOceaniaPakistanPanamaPeruPhilippinesPolandPortugalRomaniaRussiaSaudi ArabiaScotlandSenegalSerbiaSierra LeoneSingaporeSomaliaSouth AfricaSouth AmericaSouth Central AsiaSouth Eastern AsiaSouthern EuropeSpainSri LankaSt. Vincent and the GrenadinesSudanSwedenSwitzerlandSyriaTaiwanThailandTrinidad and TobagoTurkeyUgandaUkraineUruguayUzbekistanVenezuelaVietnamWest IndiesWestern AfricaWestern AsiaWestern EuropeYemenZaireZimbabweAzores
Ottawa
Race
Ancestry
AfghanAfricanAlaska NativeAlaskan AthabascanAlbanianAleutAlsatianAmericanApacheArabArapahoArgentineanArmenianAssyrian/Chaldean/SyriacAustralianAustrianBangladeshiBarbadianBasqueBelgianBelizeanBermudanBhutaneseBlackfeetBolivianBrazilianBritishBritish West IndianBulgarianBurmeseCajunCambodianCanadianCape VerdeanCarpatho RusynCelticCentral AmericanCentral American IndianCherokeeCheyenneChickasawChileanChineseChippewaChoctawColombianColvilleComancheCosta RicanCreeCreekCroatianCrowCubanCypriotCzechCzechoslovakianDanishDelawareDominicanDutchDutch West IndianEastern EuropeanEcuadorianEgyptianEnglishEstonianEthiopianEuropeanFijianFilipinoFinnishFrenchFrench American IndianFrench CanadianGermanGerman RussianGhanaianGreekGuamanian/ChamorroGuatemalanGuyaneseHaitianHmongHonduranHopiHoumaHungarianIcelanderIndian (Asian)IndonesianInupiatIranianIraqiIrishIroquoisIsraeliItalianJamaicanJapaneseJordanianKenyanKiowaKoreanLaotianLatvianLebaneseLiberianLithuanianLumbeeLuxembourgerMacedonianMalaysianMalteseMarshalleseMenomineeMexicanMexican American IndianMongolianMoroccanNative HawaiianNavajoNepaleseNew ZealanderNicaraguanNigerianNorthern EuropeanNorwegianOkinawanOsageOttawaPaiutePakistaniPalestinianPanamanianParaguayanPennsylvania GermanPeruvianPimaPolishPortuguesePotawatomiPuebloPuerto RicanPuget Sound SalishRomanianRussianSalvadoranSamoanScandinavianScotch-IrishScottishSeminoleSenegaleseSerbianShoshoneSierra LeoneanSiouxSlavicSlovakSloveneSomaliSouth AfricanSouth AmericanSouth American IndianSoviet UnionSpaniardSpanishSpanish AmericanSpanish American IndianSri LankanSubsaharan AfricanSudaneseSwedishSwissSyrianTaiwaneseThaiTlingit-HaidaTohono O'OdhamTonganTrinidadian and TobagonianTsimshianTurkishU.S. Virgin IslanderUgandanUkrainianUruguayanUteVenezuelanVietnameseWelshWest IndianYakamaYaquiYugoslavianYumanYup'ikZimbabwean
Immigration
NonimmigrantsImmigrantsAfghanistanAfricaAlbaniaArgentinaArmeniaAsiaAustraliaAustriaBahamasBangladeshBarbadosBelarusBelgiumBelizeBoliviaBosnia and HerzegovinaBrazilBulgariaBurma/MyanmarCabo VerdeCambodiaCameroonCanadaCaribbeanCentral AmericaChileChinaColombiaCongoCosta RicaCroatiaCubaCzechoslovakiaDenmarkDominicaDominican RepublicEastern AfricaEastern AsiaEastern EuropeEcuadorEgyptEl SalvadorEnglandEritreaEthiopiaEuropeFijiFranceGermanyGhanaGreeceGrenadaGuatemalaGuyanaHaitiHondurasHong KongHungaryIndiaIndonesiaIranIraqIrelandIsraelItalyJamaicaJapanJordanKazakhstanKenyaKoreaKuwaitLaosLatin AmericaLatviaLebanonLiberiaLithuaniaMalaysiaMexicoMicronesiaMiddle AfricaMoldovaMoroccoNepalNetherlandsNicaraguaNigeriaNorth AmericaNorth MacedoniaNorthern AfricaNorthern EuropeNorwayOceaniaPakistanPanamaPeruPhilippinesPolandPortugalRomaniaRussiaSaudi ArabiaScotlandSenegalSerbiaSierra LeoneSingaporeSomaliaSouth AfricaSouth AmericaSouth Central AsiaSouth Eastern AsiaSouthern EuropeSpainSri LankaSt. Vincent and the GrenadinesSudanSwedenSwitzerlandSyriaTaiwanThailandTrinidad and TobagoTurkeyUgandaUkraineUruguayUzbekistanVenezuelaVietnamWest IndiesWestern AfricaWestern AsiaWestern EuropeYemenZaireZimbabweAzores
1 or more Vehicles in Household
Income
Poverty
Unemployment
Labor Participation
Family Structure
Vehicle Availability
Education Level
Disability

1 or more Vehicles in Household Comparison

Bahamians

Ottawa

Excellent
Exceptional
90.2%
1 OR MORE VEHICLES IN HOUSEHOLD
80.5/ 100
METRIC RATING
146th/ 347
METRIC RANK
92.7%
1 OR MORE VEHICLES IN HOUSEHOLD
100.0/ 100
METRIC RATING
21st/ 347
METRIC RANK

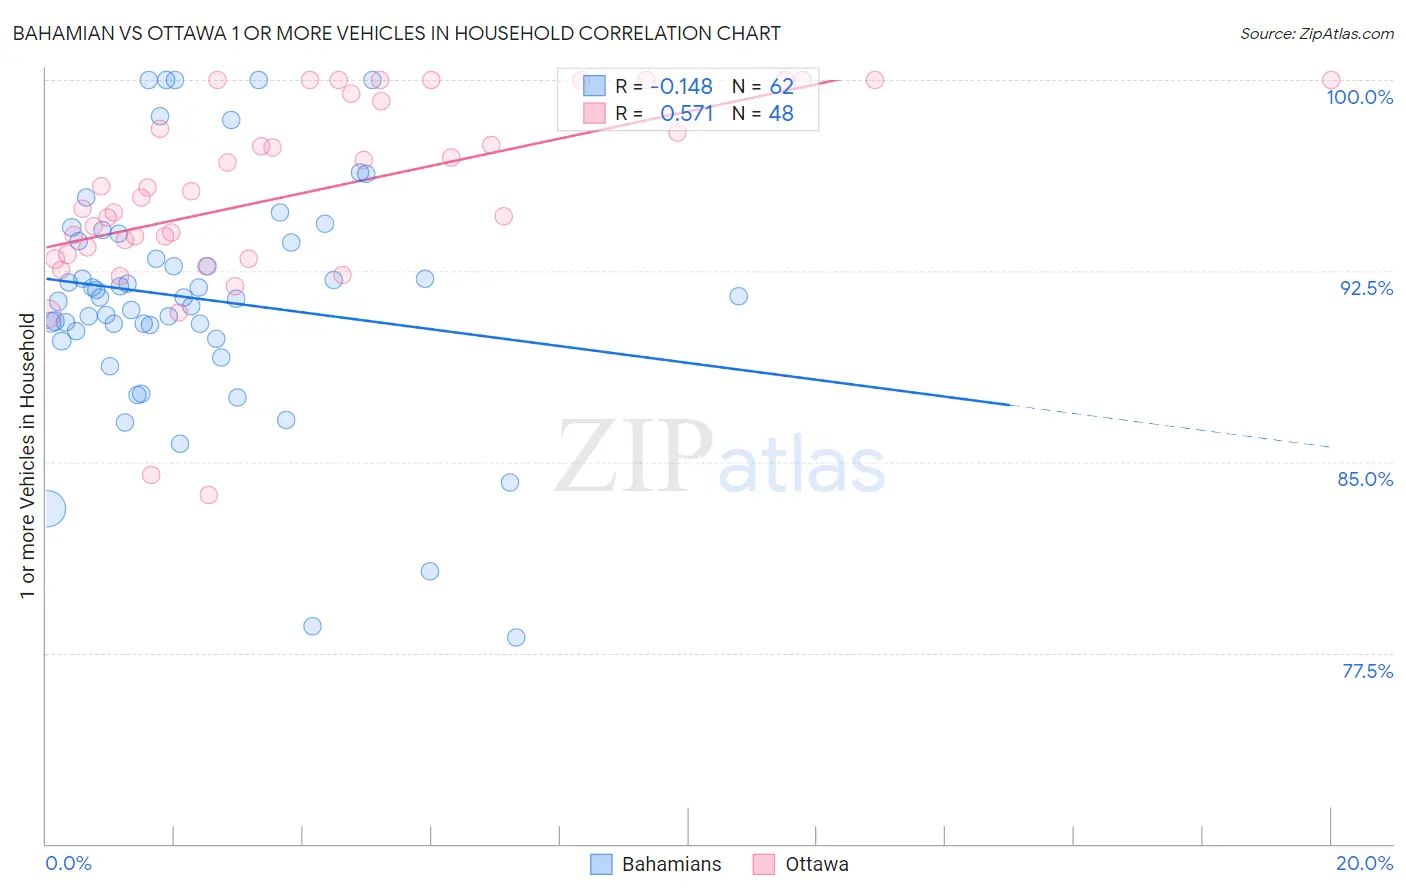
Bahamian vs Ottawa 1 or more Vehicles in Household Correlation Chart

The statistical analysis conducted on geographies consisting of 112,631,692 people shows a poor negative correlation between the proportion of Bahamians and percentage of households with 1 or more vehicles available in the United States with a correlation coefficient (R) of -0.148 and weighted average of 90.2%. Similarly, the statistical analysis conducted on geographies consisting of 49,944,544 people shows a substantial positive correlation between the proportion of Ottawa and percentage of households with 1 or more vehicles available in the United States with a correlation coefficient (R) of 0.571 and weighted average of 92.7%, a difference of 2.8%.
Bahamian vs Ottawa 1 or more Vehicles in Household

1 or more Vehicles in Household Correlation Summary

MeasurementBahamianOttawa
Minimum78.1%83.7%
Maximum100.0%100.0%
Range21.9%16.3%
Mean91.4%95.6%
Median91.5%95.5%
Interquartile 25% (IQ1)90.1%93.3%
Interquartile 75% (IQ3)93.7%99.3%
Interquartile Range (IQR)3.6%6.0%
Standard Deviation (Sample)4.7%3.8%
Standard Deviation (Population)4.6%3.8%

Similar Demographics by 1 or more Vehicles in Household

Demographics Similar to Bahamians by 1 or more Vehicles in Household

In terms of 1 or more vehicles in household, the demographic groups most similar to Bahamians are Immigrants from Zimbabwe (90.2%, a difference of 0.020%), Sioux (90.2%, a difference of 0.020%), Chilean (90.2%, a difference of 0.020%), Immigrants from Bahamas (90.2%, a difference of 0.030%), and Immigrants from Eastern Africa (90.1%, a difference of 0.050%).
DemographicsRating | Rank1 or more Vehicles in Household
Estonians
85.6
/100
|
#139
Excellent
90.3%
Sudanese
85.2
/100
|
#140
Excellent
90.3%
Immigrants | Moldova
83.1
/100
|
#141
Excellent
90.2%
Immigrants | Lithuania
83.0
/100
|
#142
Excellent
90.2%
Immigrants | Bahamas
81.5
/100
|
#143
Excellent
90.2%
Immigrants | Zimbabwe
81.5
/100
|
#144
Excellent
90.2%
Sioux
81.3
/100
|
#145
Excellent
90.2%
Bahamians
80.5
/100
|
#146
Excellent
90.2%
Chileans
79.8
/100
|
#147
Good
90.2%
Immigrants | Eastern Africa
78.2
/100
|
#148
Good
90.1%
Immigrants | Nicaragua
76.7
/100
|
#149
Good
90.1%
Immigrants | Micronesia
75.9
/100
|
#150
Good
90.1%
Immigrants | Bosnia and Herzegovina
75.4
/100
|
#151
Good
90.1%
Tlingit-Haida
74.3
/100
|
#152
Good
90.1%
New Zealanders
73.8
/100
|
#153
Good
90.1%

Demographics Similar to Ottawa by 1 or more Vehicles in Household

In terms of 1 or more vehicles in household, the demographic groups most similar to Ottawa are French (92.7%, a difference of 0.010%), Arapaho (92.7%, a difference of 0.020%), Nepalese (92.6%, a difference of 0.080%), Yaqui (92.6%, a difference of 0.15%), and Immigrants from Iraq (92.5%, a difference of 0.17%).
DemographicsRating | Rank1 or more Vehicles in Household
Irish
100.0
/100
|
#14
Exceptional
93.1%
Mexicans
100.0
/100
|
#15
Exceptional
93.0%
Assyrians/Chaldeans/Syriacs
100.0
/100
|
#16
Exceptional
93.0%
Europeans
100.0
/100
|
#17
Exceptional
93.0%
Welsh
100.0
/100
|
#18
Exceptional
93.0%
Tongans
100.0
/100
|
#19
Exceptional
92.9%
Arapaho
100.0
/100
|
#20
Exceptional
92.7%
Ottawa
100.0
/100
|
#21
Exceptional
92.7%
French
100.0
/100
|
#22
Exceptional
92.7%
Nepalese
100.0
/100
|
#23
Exceptional
92.6%
Yaqui
100.0
/100
|
#24
Exceptional
92.6%
Immigrants | Iraq
100.0
/100
|
#25
Exceptional
92.5%
British
100.0
/100
|
#26
Exceptional
92.5%
Americans
100.0
/100
|
#27
Exceptional
92.5%
Sri Lankans
100.0
/100
|
#28
Exceptional
92.5%