Zip Codes with the Highest Percentage of Population Employed in Farming, Fishing & Forestry in Lynchburg, VA
RELATED REPORTS & OPTIONS
Farming, Fishing & Forestry
Lynchburg
Compare Zip Codes
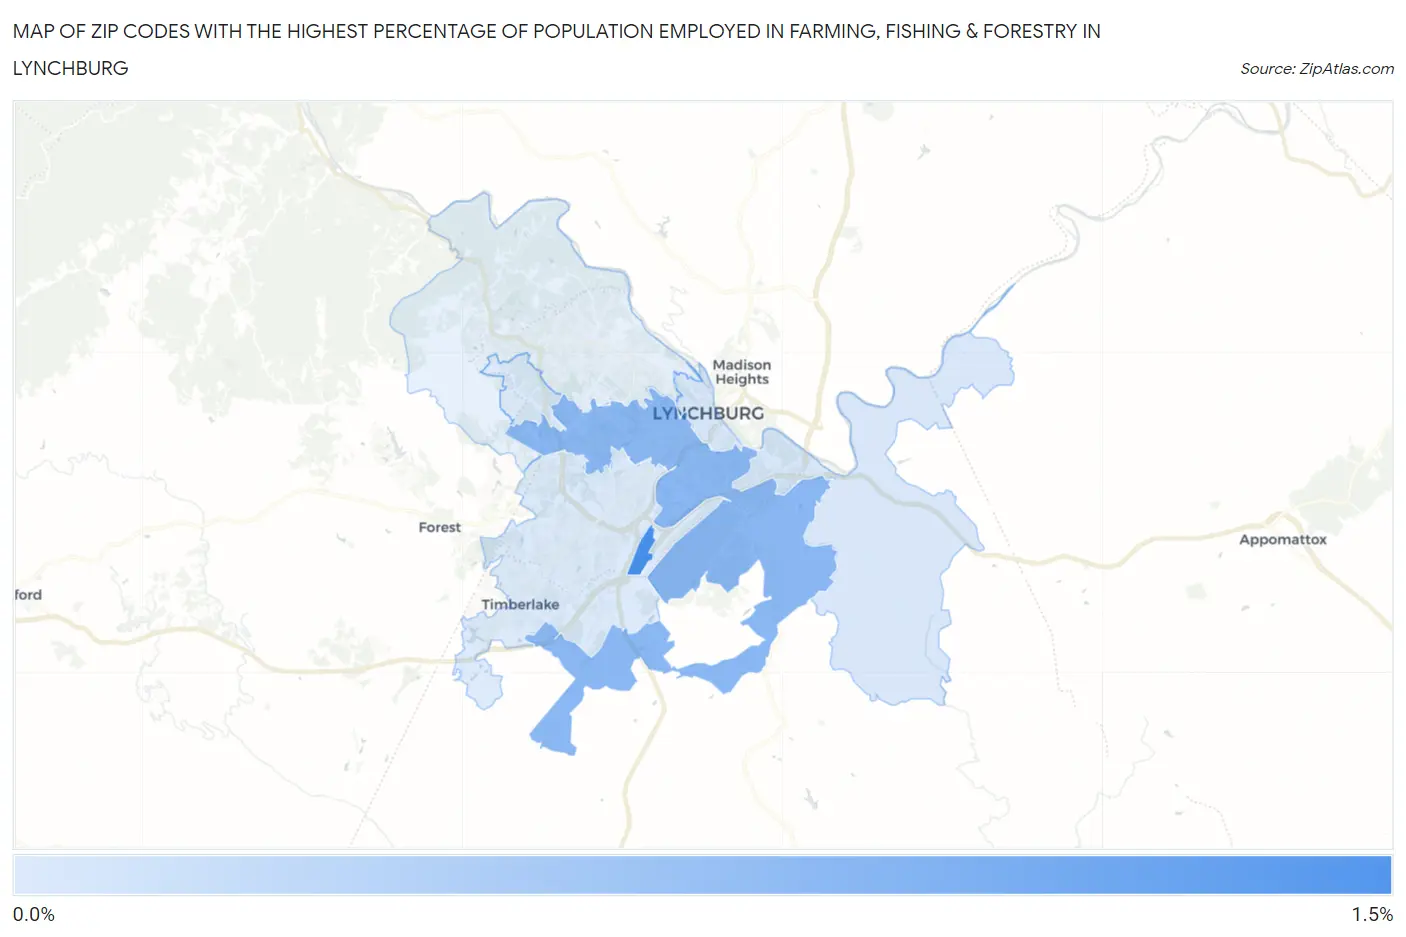
Map of Zip Codes with the Highest Percentage of Population Employed in Farming, Fishing & Forestry in Lynchburg
0.0%
1.5%
Zip Codes with the Highest Percentage of Population Employed in Farming, Fishing & Forestry in Lynchburg, VA
| Zip Code | % Employed | vs State | vs National | |
| 1. | 24515 | 1.1% | 0.33%(+0.754)#166 | 0.61%(+0.477)#9,395 |
| 2. | 24501 | 0.74% | 0.33%(+0.411)#220 | 0.61%(+0.134)#11,138 |
| 3. | 24504 | 0.33% | 0.33%(+0.001)#279 | 0.61%(-0.276)#14,488 |
| 4. | 24502 | 0.31% | 0.33%(-0.021)#282 | 0.61%(-0.298)#14,734 |
1
Common Questions
What are the Top 3 Zip Codes with the Highest Percentage of Population Employed in Farming, Fishing & Forestry in Lynchburg, VA?
Top 3 Zip Codes with the Highest Percentage of Population Employed in Farming, Fishing & Forestry in Lynchburg, VA are:
What zip code has the Highest Percentage of Population Employed in Farming, Fishing & Forestry in Lynchburg, VA?
24515 has the Highest Percentage of Population Employed in Farming, Fishing & Forestry in Lynchburg, VA with 1.1%.
What is the Percentage of Population Employed in Farming, Fishing & Forestry in Lynchburg, VA?
Percentage of Population Employed in Farming, Fishing & Forestry in Lynchburg is 0.40%.
What is the Percentage of Population Employed in Farming, Fishing & Forestry in Virginia?
Percentage of Population Employed in Farming, Fishing & Forestry in Virginia is 0.33%.
What is the Percentage of Population Employed in Farming, Fishing & Forestry in the United States?
Percentage of Population Employed in Farming, Fishing & Forestry in the United States is 0.61%.