Somali vs Immigrants from Europe Male Unemployment

COMPARE

Somali
Race
Ancestry
AfghanAfricanAlaska NativeAlaskan AthabascanAlbanianAleutAlsatianAmericanApacheArabArapahoArgentineanArmenianAssyrian/Chaldean/SyriacAustralianAustrianBahamianBangladeshiBarbadianBasqueBelgianBelizeanBermudanBhutaneseBlackfeetBolivianBrazilianBritishBritish West IndianBulgarianBurmeseCajunCambodianCanadianCape VerdeanCarpatho RusynCelticCentral AmericanCentral American IndianCherokeeCheyenneChickasawChileanChineseChippewaChoctawColombianColvilleComancheCosta RicanCreeCreekCroatianCrowCubanCypriotCzechCzechoslovakianDanishDelawareDominicanDutchDutch West IndianEastern EuropeanEcuadorianEgyptianEnglishEstonianEthiopianEuropeanFijianFilipinoFinnishFrenchFrench American IndianFrench CanadianGermanGerman RussianGhanaianGreekGuamanian/ChamorroGuatemalanGuyaneseHaitianHmongHonduranHopiHoumaHungarianIcelanderIndian (Asian)IndonesianInupiatIranianIraqiIrishIroquoisIsraeliItalianJamaicanJapaneseJordanianKenyanKiowaKoreanLaotianLatvianLebaneseLiberianLithuanianLumbeeLuxembourgerMacedonianMalaysianMalteseMarshalleseMenomineeMexicanMexican American IndianMongolianMoroccanNative HawaiianNavajoNepaleseNew ZealanderNicaraguanNigerianNorthern EuropeanNorwegianOkinawanOsageOttawaPaiutePakistaniPalestinianPanamanianParaguayanPennsylvania GermanPeruvianPimaPolishPortuguesePotawatomiPuebloPuerto RicanPuget Sound SalishRomanianRussianSalvadoranSamoanScandinavianScotch-IrishScottishSeminoleSenegaleseSerbianShoshoneSierra LeoneanSiouxSlavicSlovakSloveneSomaliSouth AfricanSouth AmericanSouth American IndianSoviet UnionSpaniardSpanishSpanish AmericanSpanish American IndianSri LankanSubsaharan AfricanSudaneseSwedishSwissSyrianTaiwaneseThaiTlingit-HaidaTohono O'OdhamTonganTrinidadian and TobagonianTsimshianTurkishU.S. Virgin IslanderUgandanUkrainianUruguayanUteVenezuelanVietnameseWelshWest IndianYakamaYaquiYugoslavianYumanYup'ikZimbabwean
Immigration
NonimmigrantsImmigrantsAfghanistanAfricaAlbaniaArgentinaArmeniaAsiaAustraliaAustriaBahamasBangladeshBarbadosBelarusBelgiumBelizeBoliviaBosnia and HerzegovinaBrazilBulgariaBurma/MyanmarCabo VerdeCambodiaCameroonCanadaCaribbeanCentral AmericaChileChinaColombiaCongoCosta RicaCroatiaCubaCzechoslovakiaDenmarkDominicaDominican RepublicEastern AfricaEastern AsiaEastern EuropeEcuadorEgyptEl SalvadorEnglandEritreaEthiopiaFijiFranceGermanyGhanaGreeceGrenadaGuatemalaGuyanaHaitiHondurasHong KongHungaryIndiaIndonesiaIranIraqIrelandIsraelItalyJamaicaJapanJordanKazakhstanKenyaKoreaKuwaitLaosLatin AmericaLatviaLebanonLiberiaLithuaniaMalaysiaMexicoMicronesiaMiddle AfricaMoldovaMoroccoNepalNetherlandsNicaraguaNigeriaNorth AmericaNorth MacedoniaNorthern AfricaNorthern EuropeNorwayOceaniaPakistanPanamaPeruPhilippinesPolandPortugalRomaniaRussiaSaudi ArabiaScotlandSenegalSerbiaSierra LeoneSingaporeSomaliaSouth AfricaSouth AmericaSouth Central AsiaSouth Eastern AsiaSouthern EuropeSpainSri LankaSt. Vincent and the GrenadinesSudanSwedenSwitzerlandSyriaTaiwanThailandTrinidad and TobagoTurkeyUgandaUkraineUruguayUzbekistanVenezuelaVietnamWest IndiesWestern AfricaWestern AsiaWestern EuropeYemenZaireZimbabweAzores
Immigrants from Europe
Race
Ancestry
AfghanAfricanAlaska NativeAlaskan AthabascanAlbanianAleutAlsatianAmericanApacheArabArapahoArgentineanArmenianAssyrian/Chaldean/SyriacAustralianAustrianBahamianBangladeshiBarbadianBasqueBelgianBelizeanBermudanBhutaneseBlackfeetBolivianBrazilianBritishBritish West IndianBulgarianBurmeseCajunCambodianCanadianCape VerdeanCarpatho RusynCelticCentral AmericanCentral American IndianCherokeeCheyenneChickasawChileanChineseChippewaChoctawColombianColvilleComancheCosta RicanCreeCreekCroatianCrowCubanCypriotCzechCzechoslovakianDanishDelawareDominicanDutchDutch West IndianEastern EuropeanEcuadorianEgyptianEnglishEstonianEthiopianEuropeanFijianFilipinoFinnishFrenchFrench American IndianFrench CanadianGermanGerman RussianGhanaianGreekGuamanian/ChamorroGuatemalanGuyaneseHaitianHmongHonduranHopiHoumaHungarianIcelanderIndian (Asian)IndonesianInupiatIranianIraqiIrishIroquoisIsraeliItalianJamaicanJapaneseJordanianKenyanKiowaKoreanLaotianLatvianLebaneseLiberianLithuanianLumbeeLuxembourgerMacedonianMalaysianMalteseMarshalleseMenomineeMexicanMexican American IndianMongolianMoroccanNative HawaiianNavajoNepaleseNew ZealanderNicaraguanNigerianNorthern EuropeanNorwegianOkinawanOsageOttawaPaiutePakistaniPalestinianPanamanianParaguayanPennsylvania GermanPeruvianPimaPolishPortuguesePotawatomiPuebloPuerto RicanPuget Sound SalishRomanianRussianSalvadoranSamoanScandinavianScotch-IrishScottishSeminoleSenegaleseSerbianShoshoneSierra LeoneanSiouxSlavicSlovakSloveneSouth AfricanSouth AmericanSouth American IndianSoviet UnionSpaniardSpanishSpanish AmericanSpanish American IndianSri LankanSubsaharan AfricanSudaneseSwedishSwissSyrianTaiwaneseThaiTlingit-HaidaTohono O'OdhamTonganTrinidadian and TobagonianTsimshianTurkishU.S. Virgin IslanderUgandanUkrainianUruguayanUteVenezuelanVietnameseWelshWest IndianYakamaYaquiYugoslavianYumanYup'ikZimbabwean
Immigration
NonimmigrantsImmigrantsAfghanistanAfricaAlbaniaArgentinaArmeniaAsiaAustraliaAustriaBahamasBangladeshBarbadosBelarusBelgiumBelizeBoliviaBosnia and HerzegovinaBrazilBulgariaBurma/MyanmarCabo VerdeCambodiaCameroonCanadaCaribbeanCentral AmericaChileChinaColombiaCongoCosta RicaCroatiaCubaCzechoslovakiaDenmarkDominicaDominican RepublicEastern AfricaEastern AsiaEastern EuropeEcuadorEgyptEl SalvadorEnglandEritreaEthiopiaEuropeFijiFranceGermanyGhanaGreeceGrenadaGuatemalaGuyanaHaitiHondurasHong KongHungaryIndiaIndonesiaIranIraqIrelandIsraelItalyJamaicaJapanJordanKazakhstanKenyaKoreaKuwaitLaosLatin AmericaLatviaLebanonLiberiaLithuaniaMalaysiaMexicoMicronesiaMiddle AfricaMoldovaMoroccoNepalNetherlandsNicaraguaNigeriaNorth AmericaNorth MacedoniaNorthern AfricaNorthern EuropeNorwayOceaniaPakistanPanamaPeruPhilippinesPolandPortugalRomaniaRussiaSaudi ArabiaScotlandSenegalSerbiaSierra LeoneSingaporeSomaliaSouth AfricaSouth AmericaSouth Central AsiaSouth Eastern AsiaSouthern EuropeSpainSri LankaSt. Vincent and the GrenadinesSudanSwedenSwitzerlandSyriaTaiwanThailandTrinidad and TobagoTurkeyUgandaUkraineUruguayUzbekistanVenezuelaVietnamWest IndiesWestern AfricaWestern AsiaWestern EuropeYemenZaireZimbabweAzores
Male Unemployment
Income
Poverty
Unemployment
Labor Participation
Family Structure
Vehicle Availability
Education Level
Disability

Male Unemployment Comparison

Somalis

Immigrants from Europe

Tragic
Good
5.6%
MALE UNEMPLOYMENT
1.5/ 100
METRIC RATING
233rd/ 347
METRIC RANK
5.2%
MALE UNEMPLOYMENT
76.2/ 100
METRIC RATING
149th/ 347
METRIC RANK

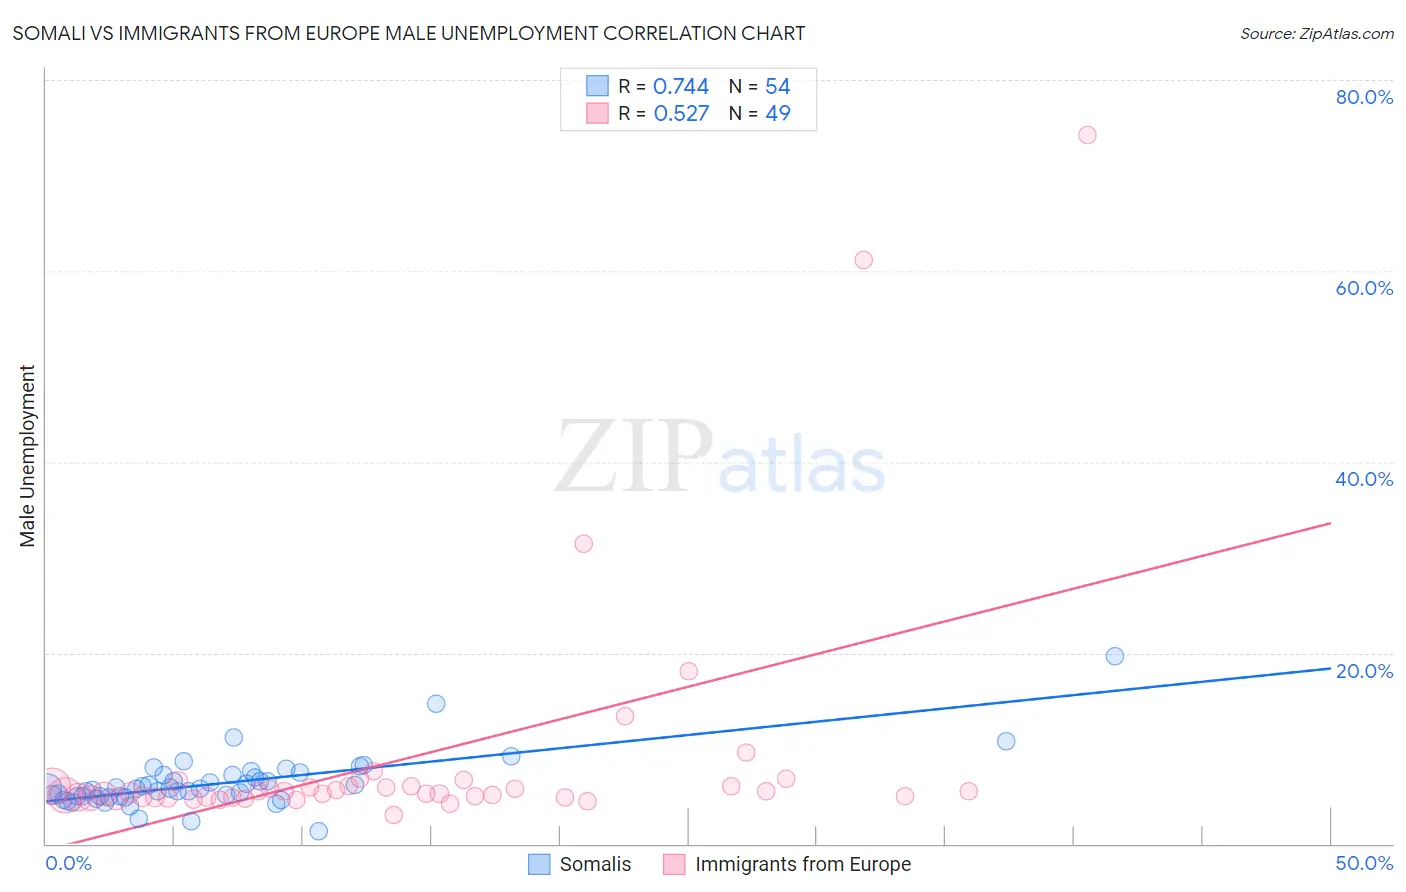
Somali vs Immigrants from Europe Male Unemployment Correlation Chart

The statistical analysis conducted on geographies consisting of 99,217,448 people shows a strong positive correlation between the proportion of Somalis and unemployment rate among males in the United States with a correlation coefficient (R) of 0.744 and weighted average of 5.6%. Similarly, the statistical analysis conducted on geographies consisting of 540,308,967 people shows a substantial positive correlation between the proportion of Immigrants from Europe and unemployment rate among males in the United States with a correlation coefficient (R) of 0.527 and weighted average of 5.2%, a difference of 7.9%.
Somali vs Immigrants from Europe Male Unemployment

Male Unemployment Correlation Summary

MeasurementSomaliImmigrants from Europe
Minimum1.3%3.1%
Maximum19.7%74.2%
Range18.4%71.1%
Mean6.3%8.9%
Median5.8%5.3%
Interquartile 25% (IQ1)4.9%4.8%
Interquartile 75% (IQ3)7.1%6.0%
Interquartile Range (IQR)2.2%1.2%
Standard Deviation (Sample)2.8%13.0%
Standard Deviation (Population)2.8%12.9%

Similar Demographics by Male Unemployment

Demographics Similar to Somalis by Male Unemployment

In terms of male unemployment, the demographic groups most similar to Somalis are Immigrants from Somalia (5.6%, a difference of 0.0%), Immigrants from Honduras (5.6%, a difference of 0.030%), Moroccan (5.6%, a difference of 0.080%), Choctaw (5.6%, a difference of 0.11%), and Immigrants from Africa (5.6%, a difference of 0.16%).
DemographicsRating | RankMale Unemployment
Immigrants | Cambodia
1.8
/100
|
#226
Tragic
5.6%
Immigrants | Panama
1.8
/100
|
#227
Tragic
5.6%
Seminole
1.8
/100
|
#228
Tragic
5.6%
Central Americans
1.8
/100
|
#229
Tragic
5.6%
Immigrants | Africa
1.7
/100
|
#230
Tragic
5.6%
Choctaw
1.6
/100
|
#231
Tragic
5.6%
Moroccans
1.6
/100
|
#232
Tragic
5.6%
Somalis
1.5
/100
|
#233
Tragic
5.6%
Immigrants | Somalia
1.5
/100
|
#234
Tragic
5.6%
Immigrants | Honduras
1.5
/100
|
#235
Tragic
5.6%
Guatemalans
1.2
/100
|
#236
Tragic
5.6%
Hondurans
1.1
/100
|
#237
Tragic
5.6%
Native Hawaiians
1.1
/100
|
#238
Tragic
5.6%
Immigrants | Guatemala
1.1
/100
|
#239
Tragic
5.6%
Immigrants | Cameroon
1.0
/100
|
#240
Tragic
5.6%

Demographics Similar to Immigrants from Europe by Male Unemployment

In terms of male unemployment, the demographic groups most similar to Immigrants from Europe are Immigrants from Italy (5.2%, a difference of 0.010%), Indian (Asian) (5.2%, a difference of 0.020%), Slovak (5.2%, a difference of 0.060%), Immigrants from Burma/Myanmar (5.2%, a difference of 0.11%), and Egyptian (5.2%, a difference of 0.11%).
DemographicsRating | RankMale Unemployment
Fijians
78.3
/100
|
#142
Good
5.2%
Syrians
78.0
/100
|
#143
Good
5.2%
Sri Lankans
77.9
/100
|
#144
Good
5.2%
Macedonians
77.7
/100
|
#145
Good
5.2%
Immigrants | Kenya
77.6
/100
|
#146
Good
5.2%
Immigrants | Burma/Myanmar
77.5
/100
|
#147
Good
5.2%
Immigrants | Italy
76.3
/100
|
#148
Good
5.2%
Immigrants | Europe
76.2
/100
|
#149
Good
5.2%
Indians (Asian)
76.0
/100
|
#150
Good
5.2%
Slovaks
75.5
/100
|
#151
Good
5.2%
Egyptians
74.8
/100
|
#152
Good
5.2%
Immigrants | Uruguay
73.9
/100
|
#153
Good
5.2%
Laotians
73.8
/100
|
#154
Good
5.2%
Immigrants | Hungary
73.4
/100
|
#155
Good
5.2%
Americans
72.7
/100
|
#156
Good
5.2%