Croatian vs Immigrants from Europe Male Unemployment

COMPARE

Croatian
Race
Ancestry
AfghanAfricanAlaska NativeAlaskan AthabascanAlbanianAleutAlsatianAmericanApacheArabArapahoArgentineanArmenianAssyrian/Chaldean/SyriacAustralianAustrianBahamianBangladeshiBarbadianBasqueBelgianBelizeanBermudanBhutaneseBlackfeetBolivianBrazilianBritishBritish West IndianBulgarianBurmeseCajunCambodianCanadianCape VerdeanCarpatho RusynCelticCentral AmericanCentral American IndianCherokeeCheyenneChickasawChileanChineseChippewaChoctawColombianColvilleComancheCosta RicanCreeCreekCroatianCrowCubanCypriotCzechCzechoslovakianDanishDelawareDominicanDutchDutch West IndianEastern EuropeanEcuadorianEgyptianEnglishEstonianEthiopianEuropeanFijianFilipinoFinnishFrenchFrench American IndianFrench CanadianGermanGerman RussianGhanaianGreekGuamanian/ChamorroGuatemalanGuyaneseHaitianHmongHonduranHopiHoumaHungarianIcelanderIndian (Asian)IndonesianInupiatIranianIraqiIrishIroquoisIsraeliItalianJamaicanJapaneseJordanianKenyanKiowaKoreanLaotianLatvianLebaneseLiberianLithuanianLumbeeLuxembourgerMacedonianMalaysianMalteseMarshalleseMenomineeMexicanMexican American IndianMongolianMoroccanNative HawaiianNavajoNepaleseNew ZealanderNicaraguanNigerianNorthern EuropeanNorwegianOkinawanOsageOttawaPaiutePakistaniPalestinianPanamanianParaguayanPennsylvania GermanPeruvianPimaPolishPortuguesePotawatomiPuebloPuerto RicanPuget Sound SalishRomanianRussianSalvadoranSamoanScandinavianScotch-IrishScottishSeminoleSenegaleseSerbianShoshoneSierra LeoneanSiouxSlavicSlovakSloveneSomaliSouth AfricanSouth AmericanSouth American IndianSoviet UnionSpaniardSpanishSpanish AmericanSpanish American IndianSri LankanSubsaharan AfricanSudaneseSwedishSwissSyrianTaiwaneseThaiTlingit-HaidaTohono O'OdhamTonganTrinidadian and TobagonianTsimshianTurkishU.S. Virgin IslanderUgandanUkrainianUruguayanUteVenezuelanVietnameseWelshWest IndianYakamaYaquiYugoslavianYumanYup'ikZimbabwean
Immigration
NonimmigrantsImmigrantsAfghanistanAfricaAlbaniaArgentinaArmeniaAsiaAustraliaAustriaBahamasBangladeshBarbadosBelarusBelgiumBelizeBoliviaBosnia and HerzegovinaBrazilBulgariaBurma/MyanmarCabo VerdeCambodiaCameroonCanadaCaribbeanCentral AmericaChileChinaColombiaCongoCosta RicaCroatiaCubaCzechoslovakiaDenmarkDominicaDominican RepublicEastern AfricaEastern AsiaEastern EuropeEcuadorEgyptEl SalvadorEnglandEritreaEthiopiaFijiFranceGermanyGhanaGreeceGrenadaGuatemalaGuyanaHaitiHondurasHong KongHungaryIndiaIndonesiaIranIraqIrelandIsraelItalyJamaicaJapanJordanKazakhstanKenyaKoreaKuwaitLaosLatin AmericaLatviaLebanonLiberiaLithuaniaMalaysiaMexicoMicronesiaMiddle AfricaMoldovaMoroccoNepalNetherlandsNicaraguaNigeriaNorth AmericaNorth MacedoniaNorthern AfricaNorthern EuropeNorwayOceaniaPakistanPanamaPeruPhilippinesPolandPortugalRomaniaRussiaSaudi ArabiaScotlandSenegalSerbiaSierra LeoneSingaporeSomaliaSouth AfricaSouth AmericaSouth Central AsiaSouth Eastern AsiaSouthern EuropeSpainSri LankaSt. Vincent and the GrenadinesSudanSwedenSwitzerlandSyriaTaiwanThailandTrinidad and TobagoTurkeyUgandaUkraineUruguayUzbekistanVenezuelaVietnamWest IndiesWestern AfricaWestern AsiaWestern EuropeYemenZaireZimbabweAzores
Immigrants from Europe
Race
Ancestry
AfghanAfricanAlaska NativeAlaskan AthabascanAlbanianAleutAlsatianAmericanApacheArabArapahoArgentineanArmenianAssyrian/Chaldean/SyriacAustralianAustrianBahamianBangladeshiBarbadianBasqueBelgianBelizeanBermudanBhutaneseBlackfeetBolivianBrazilianBritishBritish West IndianBulgarianBurmeseCajunCambodianCanadianCape VerdeanCarpatho RusynCelticCentral AmericanCentral American IndianCherokeeCheyenneChickasawChileanChineseChippewaChoctawColombianColvilleComancheCosta RicanCreeCreekCrowCubanCypriotCzechCzechoslovakianDanishDelawareDominicanDutchDutch West IndianEastern EuropeanEcuadorianEgyptianEnglishEstonianEthiopianEuropeanFijianFilipinoFinnishFrenchFrench American IndianFrench CanadianGermanGerman RussianGhanaianGreekGuamanian/ChamorroGuatemalanGuyaneseHaitianHmongHonduranHopiHoumaHungarianIcelanderIndian (Asian)IndonesianInupiatIranianIraqiIrishIroquoisIsraeliItalianJamaicanJapaneseJordanianKenyanKiowaKoreanLaotianLatvianLebaneseLiberianLithuanianLumbeeLuxembourgerMacedonianMalaysianMalteseMarshalleseMenomineeMexicanMexican American IndianMongolianMoroccanNative HawaiianNavajoNepaleseNew ZealanderNicaraguanNigerianNorthern EuropeanNorwegianOkinawanOsageOttawaPaiutePakistaniPalestinianPanamanianParaguayanPennsylvania GermanPeruvianPimaPolishPortuguesePotawatomiPuebloPuerto RicanPuget Sound SalishRomanianRussianSalvadoranSamoanScandinavianScotch-IrishScottishSeminoleSenegaleseSerbianShoshoneSierra LeoneanSiouxSlavicSlovakSloveneSomaliSouth AfricanSouth AmericanSouth American IndianSoviet UnionSpaniardSpanishSpanish AmericanSpanish American IndianSri LankanSubsaharan AfricanSudaneseSwedishSwissSyrianTaiwaneseThaiTlingit-HaidaTohono O'OdhamTonganTrinidadian and TobagonianTsimshianTurkishU.S. Virgin IslanderUgandanUkrainianUruguayanUteVenezuelanVietnameseWelshWest IndianYakamaYaquiYugoslavianYumanYup'ikZimbabwean
Immigration
NonimmigrantsImmigrantsAfghanistanAfricaAlbaniaArgentinaArmeniaAsiaAustraliaAustriaBahamasBangladeshBarbadosBelarusBelgiumBelizeBoliviaBosnia and HerzegovinaBrazilBulgariaBurma/MyanmarCabo VerdeCambodiaCameroonCanadaCaribbeanCentral AmericaChileChinaColombiaCongoCosta RicaCroatiaCubaCzechoslovakiaDenmarkDominicaDominican RepublicEastern AfricaEastern AsiaEastern EuropeEcuadorEgyptEl SalvadorEnglandEritreaEthiopiaEuropeFijiFranceGermanyGhanaGreeceGrenadaGuatemalaGuyanaHaitiHondurasHong KongHungaryIndiaIndonesiaIranIraqIrelandIsraelItalyJamaicaJapanJordanKazakhstanKenyaKoreaKuwaitLaosLatin AmericaLatviaLebanonLiberiaLithuaniaMalaysiaMexicoMicronesiaMiddle AfricaMoldovaMoroccoNepalNetherlandsNicaraguaNigeriaNorth AmericaNorth MacedoniaNorthern AfricaNorthern EuropeNorwayOceaniaPakistanPanamaPeruPhilippinesPolandPortugalRomaniaRussiaSaudi ArabiaScotlandSenegalSerbiaSierra LeoneSingaporeSomaliaSouth AfricaSouth AmericaSouth Central AsiaSouth Eastern AsiaSouthern EuropeSpainSri LankaSt. Vincent and the GrenadinesSudanSwedenSwitzerlandSyriaTaiwanThailandTrinidad and TobagoTurkeyUgandaUkraineUruguayUzbekistanVenezuelaVietnamWest IndiesWestern AfricaWestern AsiaWestern EuropeYemenZaireZimbabweAzores
Male Unemployment
Income
Poverty
Unemployment
Labor Participation
Family Structure
Vehicle Availability
Education Level
Disability

Male Unemployment Comparison

Croatians

Immigrants from Europe

Exceptional
Good
4.9%
MALE UNEMPLOYMENT
98.9/ 100
METRIC RATING
50th/ 347
METRIC RANK
5.2%
MALE UNEMPLOYMENT
76.2/ 100
METRIC RATING
149th/ 347
METRIC RANK

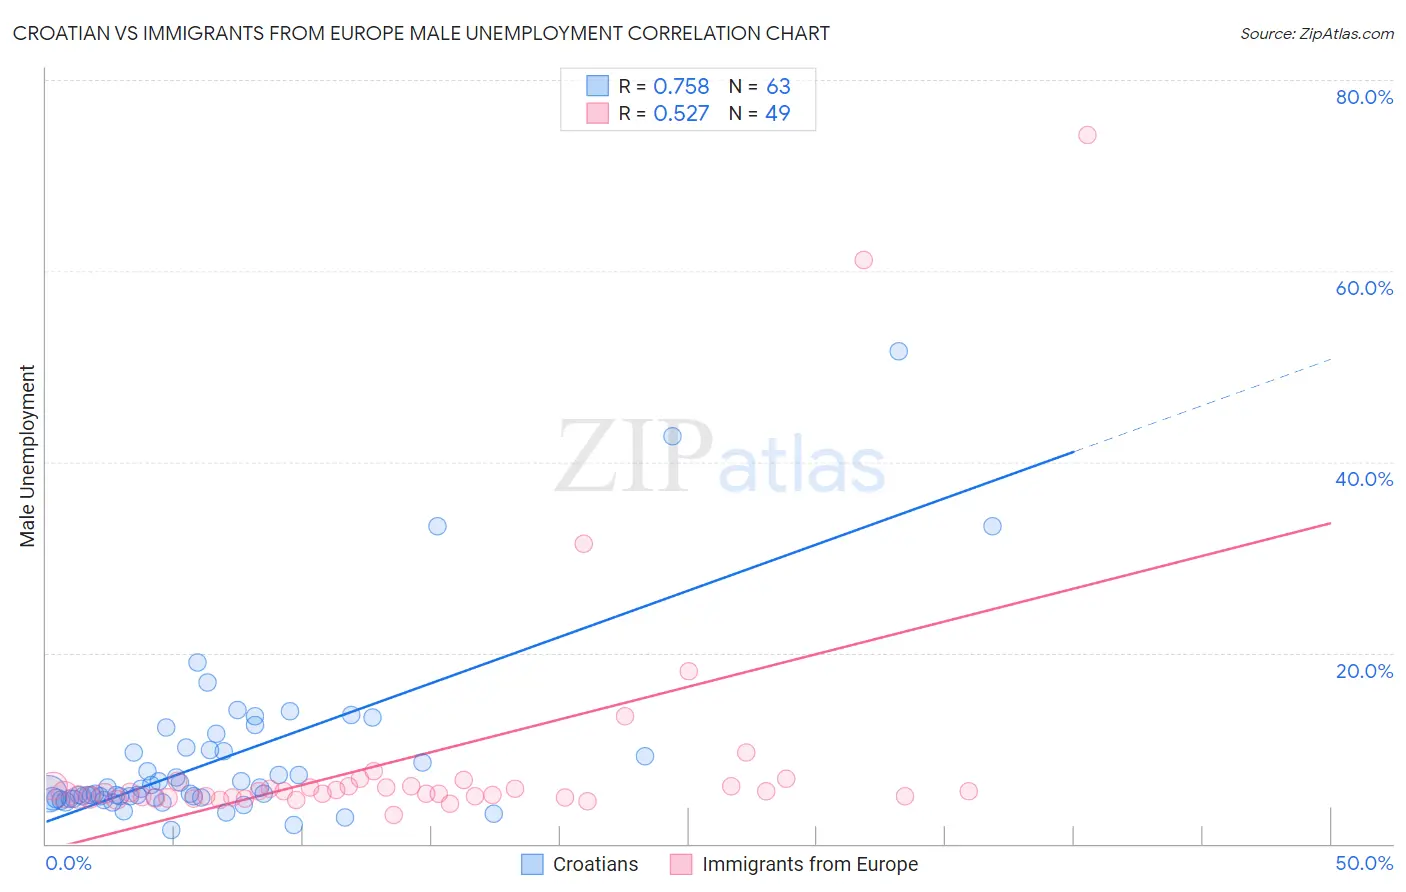
Croatian vs Immigrants from Europe Male Unemployment Correlation Chart

The statistical analysis conducted on geographies consisting of 374,058,909 people shows a strong positive correlation between the proportion of Croatians and unemployment rate among males in the United States with a correlation coefficient (R) of 0.758 and weighted average of 4.9%. Similarly, the statistical analysis conducted on geographies consisting of 540,308,967 people shows a substantial positive correlation between the proportion of Immigrants from Europe and unemployment rate among males in the United States with a correlation coefficient (R) of 0.527 and weighted average of 5.2%, a difference of 5.2%.
Croatian vs Immigrants from Europe Male Unemployment

Male Unemployment Correlation Summary

MeasurementCroatianImmigrants from Europe
Minimum1.5%3.1%
Maximum51.6%74.2%
Range50.1%71.1%
Mean9.1%8.9%
Median5.3%5.3%
Interquartile 25% (IQ1)4.8%4.8%
Interquartile 75% (IQ3)9.8%6.0%
Interquartile Range (IQR)5.0%1.2%
Standard Deviation (Sample)9.1%13.0%
Standard Deviation (Population)9.1%12.9%

Similar Demographics by Male Unemployment

Demographics Similar to Croatians by Male Unemployment

In terms of male unemployment, the demographic groups most similar to Croatians are Polish (4.9%, a difference of 0.010%), Immigrants from Scotland (4.9%, a difference of 0.020%), Austrian (4.9%, a difference of 0.040%), Slovene (5.0%, a difference of 0.040%), and Irish (5.0%, a difference of 0.060%).
DemographicsRating | RankMale Unemployment
Immigrants | Japan
99.2
/100
|
#43
Exceptional
4.9%
Immigrants | Korea
99.1
/100
|
#44
Exceptional
4.9%
Immigrants | Zimbabwe
99.0
/100
|
#45
Exceptional
4.9%
Bhutanese
98.9
/100
|
#46
Exceptional
4.9%
Austrians
98.9
/100
|
#47
Exceptional
4.9%
Immigrants | Scotland
98.9
/100
|
#48
Exceptional
4.9%
Poles
98.9
/100
|
#49
Exceptional
4.9%
Croatians
98.9
/100
|
#50
Exceptional
4.9%
Slovenes
98.8
/100
|
#51
Exceptional
5.0%
Irish
98.8
/100
|
#52
Exceptional
5.0%
Jordanians
98.8
/100
|
#53
Exceptional
5.0%
Yugoslavians
98.7
/100
|
#54
Exceptional
5.0%
Czechoslovakians
98.7
/100
|
#55
Exceptional
5.0%
Immigrants | Bulgaria
98.7
/100
|
#56
Exceptional
5.0%
Turks
98.5
/100
|
#57
Exceptional
5.0%

Demographics Similar to Immigrants from Europe by Male Unemployment

In terms of male unemployment, the demographic groups most similar to Immigrants from Europe are Immigrants from Italy (5.2%, a difference of 0.010%), Indian (Asian) (5.2%, a difference of 0.020%), Slovak (5.2%, a difference of 0.060%), Immigrants from Burma/Myanmar (5.2%, a difference of 0.11%), and Egyptian (5.2%, a difference of 0.11%).
DemographicsRating | RankMale Unemployment
Fijians
78.3
/100
|
#142
Good
5.2%
Syrians
78.0
/100
|
#143
Good
5.2%
Sri Lankans
77.9
/100
|
#144
Good
5.2%
Macedonians
77.7
/100
|
#145
Good
5.2%
Immigrants | Kenya
77.6
/100
|
#146
Good
5.2%
Immigrants | Burma/Myanmar
77.5
/100
|
#147
Good
5.2%
Immigrants | Italy
76.3
/100
|
#148
Good
5.2%
Immigrants | Europe
76.2
/100
|
#149
Good
5.2%
Indians (Asian)
76.0
/100
|
#150
Good
5.2%
Slovaks
75.5
/100
|
#151
Good
5.2%
Egyptians
74.8
/100
|
#152
Good
5.2%
Immigrants | Uruguay
73.9
/100
|
#153
Good
5.2%
Laotians
73.8
/100
|
#154
Good
5.2%
Immigrants | Hungary
73.4
/100
|
#155
Good
5.2%
Americans
72.7
/100
|
#156
Good
5.2%