Salvadoran vs Immigrants from Latin America Unemployment Among Ages 20 to 24 years

COMPARE

Salvadoran
Race
Ancestry
AfghanAfricanAlaska NativeAlaskan AthabascanAlbanianAleutAlsatianAmericanApacheArabArapahoArgentineanArmenianAssyrian/Chaldean/SyriacAustralianAustrianBahamianBangladeshiBarbadianBasqueBelgianBelizeanBermudanBhutaneseBlackfeetBolivianBrazilianBritishBritish West IndianBulgarianBurmeseCajunCambodianCanadianCape VerdeanCarpatho RusynCelticCentral AmericanCentral American IndianCherokeeCheyenneChickasawChileanChineseChippewaChoctawColombianColvilleComancheCosta RicanCreeCreekCroatianCrowCubanCypriotCzechCzechoslovakianDanishDelawareDominicanDutchDutch West IndianEastern EuropeanEcuadorianEgyptianEnglishEstonianEthiopianEuropeanFijianFilipinoFinnishFrenchFrench American IndianFrench CanadianGermanGerman RussianGhanaianGreekGuamanian/ChamorroGuatemalanGuyaneseHaitianHmongHonduranHopiHoumaHungarianIcelanderIndian (Asian)IndonesianInupiatIranianIraqiIrishIroquoisIsraeliItalianJamaicanJapaneseJordanianKenyanKiowaKoreanLaotianLatvianLebaneseLiberianLithuanianLumbeeLuxembourgerMacedonianMalaysianMalteseMarshalleseMenomineeMexicanMexican American IndianMongolianMoroccanNative HawaiianNavajoNepaleseNew ZealanderNicaraguanNigerianNorthern EuropeanNorwegianOkinawanOsageOttawaPaiutePakistaniPalestinianPanamanianParaguayanPennsylvania GermanPeruvianPimaPolishPortuguesePotawatomiPuebloPuerto RicanPuget Sound SalishRomanianRussianSalvadoranSamoanScandinavianScotch-IrishScottishSeminoleSenegaleseSerbianShoshoneSierra LeoneanSiouxSlavicSlovakSloveneSomaliSouth AfricanSouth AmericanSouth American IndianSoviet UnionSpaniardSpanishSpanish AmericanSpanish American IndianSri LankanSubsaharan AfricanSudaneseSwedishSwissSyrianTaiwaneseThaiTlingit-HaidaTohono O'OdhamTonganTrinidadian and TobagonianTsimshianTurkishU.S. Virgin IslanderUgandanUkrainianUruguayanUteVenezuelanVietnameseWelshWest IndianYakamaYaquiYugoslavianYumanYup'ikZimbabwean
Immigration
NonimmigrantsImmigrantsAfghanistanAfricaAlbaniaArgentinaArmeniaAsiaAustraliaAustriaBahamasBangladeshBarbadosBelarusBelgiumBelizeBoliviaBosnia and HerzegovinaBrazilBulgariaBurma/MyanmarCabo VerdeCambodiaCameroonCanadaCaribbeanCentral AmericaChileChinaColombiaCongoCosta RicaCroatiaCubaCzechoslovakiaDenmarkDominicaDominican RepublicEastern AfricaEastern AsiaEastern EuropeEcuadorEgyptEl SalvadorEnglandEritreaEthiopiaEuropeFijiFranceGermanyGhanaGreeceGrenadaGuatemalaGuyanaHaitiHondurasHong KongHungaryIndiaIndonesiaIranIraqIrelandIsraelItalyJamaicaJapanJordanKazakhstanKenyaKoreaKuwaitLaosLatviaLebanonLiberiaLithuaniaMalaysiaMexicoMicronesiaMiddle AfricaMoldovaMoroccoNepalNetherlandsNicaraguaNigeriaNorth AmericaNorth MacedoniaNorthern AfricaNorthern EuropeNorwayOceaniaPakistanPanamaPeruPhilippinesPolandPortugalRomaniaRussiaSaudi ArabiaScotlandSenegalSerbiaSierra LeoneSingaporeSomaliaSouth AfricaSouth AmericaSouth Central AsiaSouth Eastern AsiaSouthern EuropeSpainSri LankaSt. Vincent and the GrenadinesSudanSwedenSwitzerlandSyriaTaiwanThailandTrinidad and TobagoTurkeyUgandaUkraineUruguayUzbekistanVenezuelaVietnamWest IndiesWestern AfricaWestern AsiaWestern EuropeYemenZaireZimbabweAzores
Immigrants from Latin America
Race
Ancestry
AfghanAfricanAlaska NativeAlaskan AthabascanAlbanianAleutAlsatianAmericanApacheArabArapahoArgentineanArmenianAssyrian/Chaldean/SyriacAustralianAustrianBahamianBangladeshiBarbadianBasqueBelgianBelizeanBermudanBhutaneseBlackfeetBolivianBrazilianBritishBritish West IndianBulgarianBurmeseCajunCambodianCanadianCape VerdeanCarpatho RusynCelticCentral AmericanCentral American IndianCherokeeCheyenneChickasawChileanChineseChippewaChoctawColombianColvilleComancheCosta RicanCreeCreekCroatianCrowCubanCypriotCzechCzechoslovakianDanishDelawareDominicanDutchDutch West IndianEastern EuropeanEcuadorianEgyptianEnglishEstonianEthiopianEuropeanFijianFilipinoFinnishFrenchFrench American IndianFrench CanadianGermanGerman RussianGhanaianGreekGuamanian/ChamorroGuatemalanGuyaneseHaitianHmongHonduranHopiHoumaHungarianIcelanderIndian (Asian)IndonesianInupiatIranianIraqiIrishIroquoisIsraeliItalianJamaicanJapaneseJordanianKenyanKiowaKoreanLaotianLatvianLebaneseLiberianLithuanianLumbeeLuxembourgerMacedonianMalaysianMalteseMarshalleseMenomineeMexicanMexican American IndianMongolianMoroccanNative HawaiianNavajoNepaleseNew ZealanderNicaraguanNigerianNorthern EuropeanNorwegianOkinawanOsageOttawaPaiutePakistaniPalestinianPanamanianParaguayanPennsylvania GermanPeruvianPimaPolishPortuguesePotawatomiPuebloPuerto RicanPuget Sound SalishRomanianRussianSamoanScandinavianScotch-IrishScottishSeminoleSenegaleseSerbianShoshoneSierra LeoneanSiouxSlavicSlovakSloveneSomaliSouth AfricanSouth AmericanSouth American IndianSoviet UnionSpaniardSpanishSpanish AmericanSpanish American IndianSri LankanSubsaharan AfricanSudaneseSwedishSwissSyrianTaiwaneseThaiTlingit-HaidaTohono O'OdhamTonganTrinidadian and TobagonianTsimshianTurkishU.S. Virgin IslanderUgandanUkrainianUruguayanUteVenezuelanVietnameseWelshWest IndianYakamaYaquiYugoslavianYumanYup'ikZimbabwean
Immigration
NonimmigrantsImmigrantsAfghanistanAfricaAlbaniaArgentinaArmeniaAsiaAustraliaAustriaBahamasBangladeshBarbadosBelarusBelgiumBelizeBoliviaBosnia and HerzegovinaBrazilBulgariaBurma/MyanmarCabo VerdeCambodiaCameroonCanadaCaribbeanCentral AmericaChileChinaColombiaCongoCosta RicaCroatiaCubaCzechoslovakiaDenmarkDominicaDominican RepublicEastern AfricaEastern AsiaEastern EuropeEcuadorEgyptEl SalvadorEnglandEritreaEthiopiaEuropeFijiFranceGermanyGhanaGreeceGrenadaGuatemalaGuyanaHaitiHondurasHong KongHungaryIndiaIndonesiaIranIraqIrelandIsraelItalyJamaicaJapanJordanKazakhstanKenyaKoreaKuwaitLaosLatin AmericaLatviaLebanonLiberiaLithuaniaMalaysiaMexicoMicronesiaMiddle AfricaMoldovaMoroccoNepalNetherlandsNicaraguaNigeriaNorth AmericaNorth MacedoniaNorthern AfricaNorthern EuropeNorwayOceaniaPakistanPanamaPeruPhilippinesPolandPortugalRomaniaRussiaSaudi ArabiaScotlandSenegalSerbiaSierra LeoneSingaporeSomaliaSouth AfricaSouth AmericaSouth Central AsiaSouth Eastern AsiaSouthern EuropeSpainSri LankaSt. Vincent and the GrenadinesSudanSwedenSwitzerlandSyriaTaiwanThailandTrinidad and TobagoTurkeyUgandaUkraineUruguayUzbekistanVenezuelaVietnamWest IndiesWestern AfricaWestern AsiaWestern EuropeYemenZaireZimbabweAzores
Unemployment Among Ages 20 to 24 years
Income
Poverty
Unemployment
Labor Participation
Family Structure
Vehicle Availability
Education Level
Disability

Unemployment Among Ages 20 to 24 years Comparison

Salvadorans

Immigrants from Latin America

Tragic
Tragic
10.7%
UNEMPLOYMENT AMONG AGES 20 TO 24 YEARS
2.4/ 100
METRIC RATING
239th/ 347
METRIC RANK
11.0%
UNEMPLOYMENT AMONG AGES 20 TO 24 YEARS
0.1/ 100
METRIC RATING
262nd/ 347
METRIC RANK

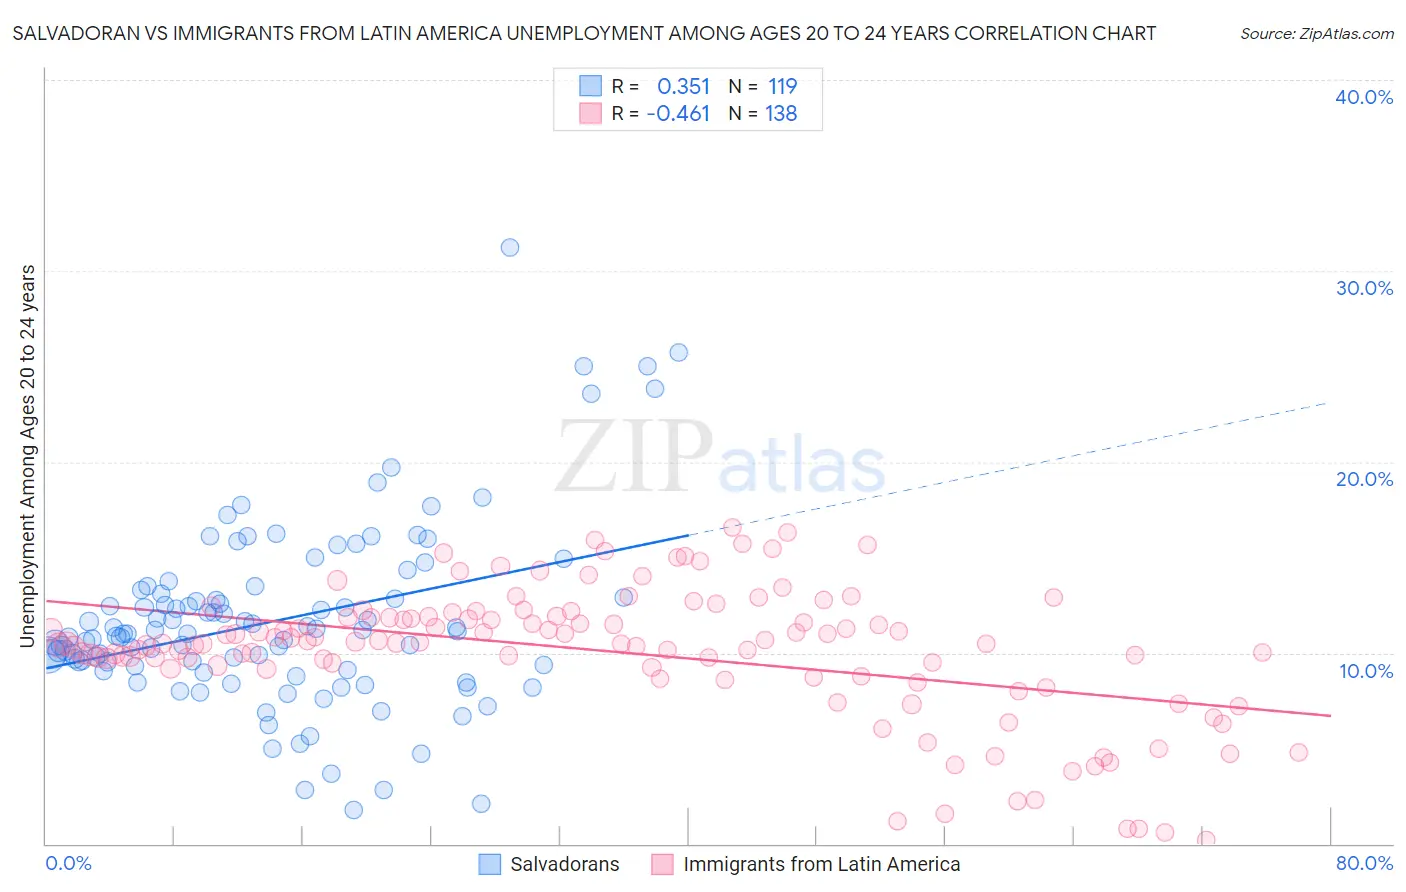
Salvadoran vs Immigrants from Latin America Unemployment Among Ages 20 to 24 years Correlation Chart

The statistical analysis conducted on geographies consisting of 387,862,775 people shows a mild positive correlation between the proportion of Salvadorans and unemployment rate among population between the ages 20 and 24 in the United States with a correlation coefficient (R) of 0.351 and weighted average of 10.7%. Similarly, the statistical analysis conducted on geographies consisting of 518,664,657 people shows a moderate negative correlation between the proportion of Immigrants from Latin America and unemployment rate among population between the ages 20 and 24 in the United States with a correlation coefficient (R) of -0.461 and weighted average of 11.0%, a difference of 2.9%.
Salvadoran vs Immigrants from Latin America Unemployment Among Ages 20 to 24 years

Unemployment Among Ages 20 to 24 years Correlation Summary

MeasurementSalvadoranImmigrants from Latin America
Minimum1.8%0.20%
Maximum31.2%16.6%
Range29.4%16.4%
Mean11.7%10.1%
Median11.0%10.5%
Interquartile 25% (IQ1)9.3%9.2%
Interquartile 75% (IQ3)13.1%11.9%
Interquartile Range (IQR)3.8%2.7%
Standard Deviation (Sample)4.8%3.5%
Standard Deviation (Population)4.7%3.5%

Similar Demographics by Unemployment Among Ages 20 to 24 years

Demographics Similar to Salvadorans by Unemployment Among Ages 20 to 24 years

In terms of unemployment among ages 20 to 24 years, the demographic groups most similar to Salvadorans are Immigrants from Pakistan (10.6%, a difference of 0.060%), Immigrants (10.6%, a difference of 0.080%), Immigrants from Central America (10.7%, a difference of 0.19%), Mexican (10.6%, a difference of 0.25%), and Immigrants from Ukraine (10.6%, a difference of 0.29%).
DemographicsRating | RankUnemployment Among Ages 20 to 24 years
Israelis
3.7
/100
|
#232
Tragic
10.6%
Choctaw
3.6
/100
|
#233
Tragic
10.6%
Immigrants | Africa
3.5
/100
|
#234
Tragic
10.6%
Immigrants | Ukraine
3.3
/100
|
#235
Tragic
10.6%
Mexicans
3.2
/100
|
#236
Tragic
10.6%
Immigrants | Immigrants
2.7
/100
|
#237
Tragic
10.6%
Immigrants | Pakistan
2.6
/100
|
#238
Tragic
10.6%
Salvadorans
2.4
/100
|
#239
Tragic
10.7%
Immigrants | Central America
2.0
/100
|
#240
Tragic
10.7%
Immigrants | El Salvador
1.7
/100
|
#241
Tragic
10.7%
Moroccans
1.4
/100
|
#242
Tragic
10.7%
Immigrants | Belarus
1.3
/100
|
#243
Tragic
10.7%
Immigrants | Mexico
1.2
/100
|
#244
Tragic
10.7%
Hispanics or Latinos
1.0
/100
|
#245
Tragic
10.7%
Immigrants | Iran
0.9
/100
|
#246
Tragic
10.8%

Demographics Similar to Immigrants from Latin America by Unemployment Among Ages 20 to 24 years

In terms of unemployment among ages 20 to 24 years, the demographic groups most similar to Immigrants from Latin America are Marshallese (11.0%, a difference of 0.29%), Puget Sound Salish (10.9%, a difference of 0.46%), Immigrants from Lebanon (10.9%, a difference of 0.70%), Panamanian (10.9%, a difference of 0.73%), and Dutch West Indian (10.9%, a difference of 0.83%).
DemographicsRating | RankUnemployment Among Ages 20 to 24 years
Immigrants | Israel
0.3
/100
|
#255
Tragic
10.8%
Immigrants | Bahamas
0.3
/100
|
#256
Tragic
10.9%
Immigrants | Western Asia
0.3
/100
|
#257
Tragic
10.9%
Dutch West Indians
0.3
/100
|
#258
Tragic
10.9%
Panamanians
0.2
/100
|
#259
Tragic
10.9%
Immigrants | Lebanon
0.2
/100
|
#260
Tragic
10.9%
Puget Sound Salish
0.2
/100
|
#261
Tragic
10.9%
Immigrants | Latin America
0.1
/100
|
#262
Tragic
11.0%
Marshallese
0.1
/100
|
#263
Tragic
11.0%
Sub-Saharan Africans
0.0
/100
|
#264
Tragic
11.1%
Immigrants | Ireland
0.0
/100
|
#265
Tragic
11.1%
Immigrants | Liberia
0.0
/100
|
#266
Tragic
11.1%
Immigrants | Greece
0.0
/100
|
#267
Tragic
11.1%
Maltese
0.0
/100
|
#268
Tragic
11.2%
Ute
0.0
/100
|
#269
Tragic
11.2%