Salvadoran vs Assyrian/Chaldean/Syriac Unemployment Among Ages 20 to 24 years
COMPARE
Salvadoran
Assyrian/Chaldean/Syriac
Unemployment Among Ages 20 to 24 years
Unemployment Among Ages 20 to 24 years Comparison
Salvadorans
Assyrians/Chaldeans/Syriacs
10.7%
UNEMPLOYMENT AMONG AGES 20 TO 24 YEARS
2.4/ 100
METRIC RATING
239th/ 347
METRIC RANK
9.9%
UNEMPLOYMENT AMONG AGES 20 TO 24 YEARS
98.3/ 100
METRIC RATING
78th/ 347
METRIC RANK
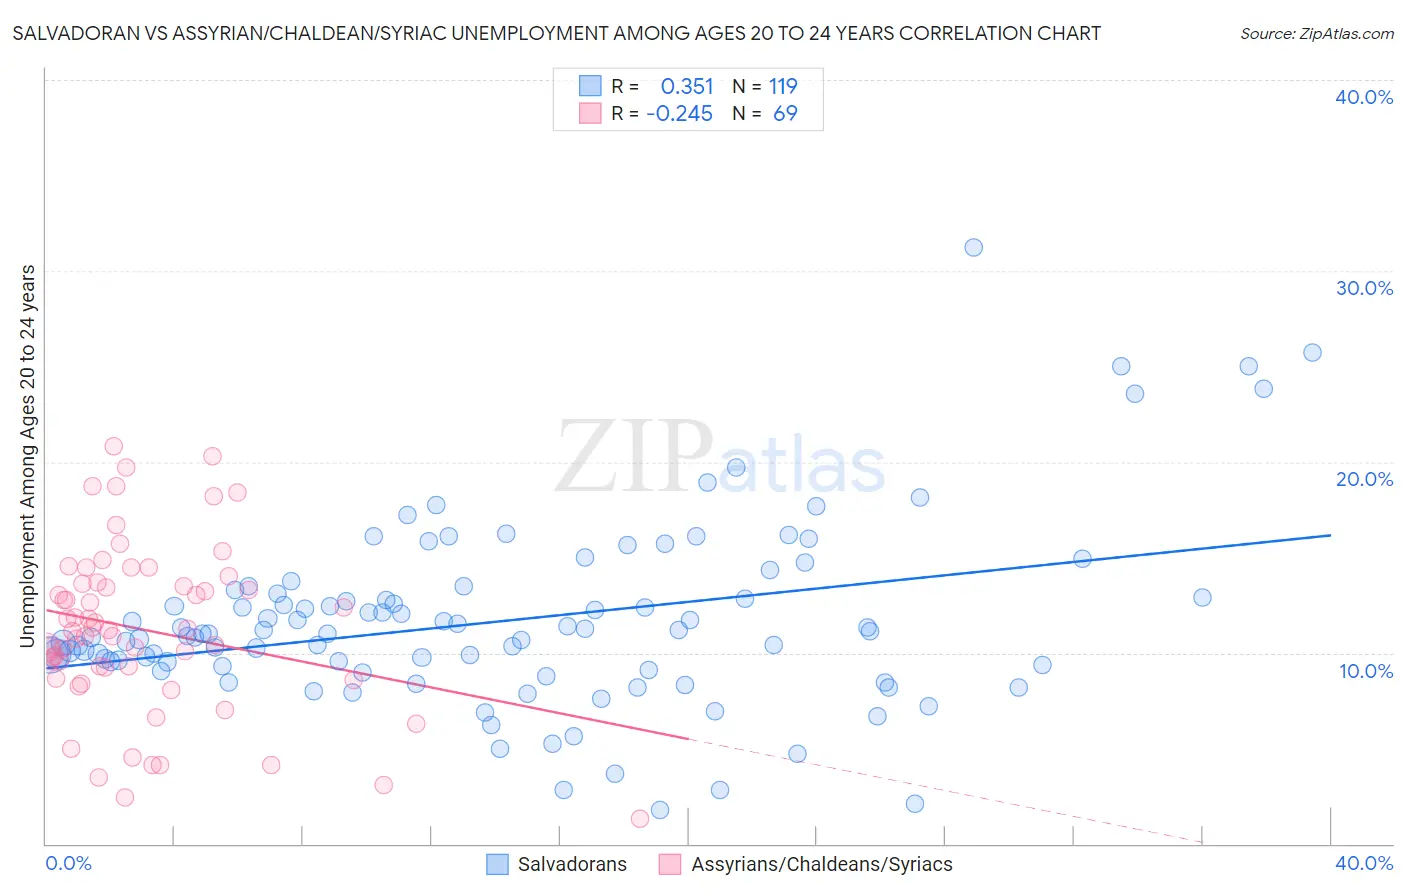
Salvadoran vs Assyrian/Chaldean/Syriac Unemployment Among Ages 20 to 24 years Correlation Chart
The statistical analysis conducted on geographies consisting of 387,862,775 people shows a mild positive correlation between the proportion of Salvadorans and unemployment rate among population between the ages 20 and 24 in the United States with a correlation coefficient (R) of 0.351 and weighted average of 10.7%. Similarly, the statistical analysis conducted on geographies consisting of 109,491,073 people shows a weak negative correlation between the proportion of Assyrians/Chaldeans/Syriacs and unemployment rate among population between the ages 20 and 24 in the United States with a correlation coefficient (R) of -0.245 and weighted average of 9.9%, a difference of 7.4%.
Unemployment Among Ages 20 to 24 years Correlation Summary
| Measurement | Salvadoran | Assyrian/Chaldean/Syriac |
| Minimum | 1.8% | 1.3% |
| Maximum | 31.2% | 20.8% |
| Range | 29.4% | 19.5% |
| Mean | 11.7% | 11.2% |
| Median | 11.0% | 11.2% |
| Interquartile 25% (IQ1) | 9.3% | 8.9% |
| Interquartile 75% (IQ3) | 13.1% | 13.7% |
| Interquartile Range (IQR) | 3.8% | 4.8% |
| Standard Deviation (Sample) | 4.8% | 4.4% |
| Standard Deviation (Population) | 4.7% | 4.3% |
Similar Demographics by Unemployment Among Ages 20 to 24 years
Demographics Similar to Salvadorans by Unemployment Among Ages 20 to 24 years
In terms of unemployment among ages 20 to 24 years, the demographic groups most similar to Salvadorans are Immigrants from Pakistan (10.6%, a difference of 0.060%), Immigrants (10.6%, a difference of 0.080%), Immigrants from Central America (10.7%, a difference of 0.19%), Mexican (10.6%, a difference of 0.25%), and Immigrants from Ukraine (10.6%, a difference of 0.29%).
| Demographics | Rating | Rank | Unemployment Among Ages 20 to 24 years |
| Israelis | 3.7 /100 | #232 | Tragic 10.6% |
| Choctaw | 3.6 /100 | #233 | Tragic 10.6% |
| Immigrants | Africa | 3.5 /100 | #234 | Tragic 10.6% |
| Immigrants | Ukraine | 3.3 /100 | #235 | Tragic 10.6% |
| Mexicans | 3.2 /100 | #236 | Tragic 10.6% |
| Immigrants | Immigrants | 2.7 /100 | #237 | Tragic 10.6% |
| Immigrants | Pakistan | 2.6 /100 | #238 | Tragic 10.6% |
| Salvadorans | 2.4 /100 | #239 | Tragic 10.7% |
| Immigrants | Central America | 2.0 /100 | #240 | Tragic 10.7% |
| Immigrants | El Salvador | 1.7 /100 | #241 | Tragic 10.7% |
| Moroccans | 1.4 /100 | #242 | Tragic 10.7% |
| Immigrants | Belarus | 1.3 /100 | #243 | Tragic 10.7% |
| Immigrants | Mexico | 1.2 /100 | #244 | Tragic 10.7% |
| Hispanics or Latinos | 1.0 /100 | #245 | Tragic 10.7% |
| Immigrants | Iran | 0.9 /100 | #246 | Tragic 10.8% |
Demographics Similar to Assyrians/Chaldeans/Syriacs by Unemployment Among Ages 20 to 24 years
In terms of unemployment among ages 20 to 24 years, the demographic groups most similar to Assyrians/Chaldeans/Syriacs are Icelander (9.9%, a difference of 0.020%), Chickasaw (9.9%, a difference of 0.030%), Czechoslovakian (9.9%, a difference of 0.050%), Immigrants from Netherlands (9.9%, a difference of 0.070%), and Immigrants from Australia (9.9%, a difference of 0.14%).
| Demographics | Rating | Rank | Unemployment Among Ages 20 to 24 years |
| Celtics | 98.9 /100 | #71 | Exceptional 9.9% |
| Bolivians | 98.9 /100 | #72 | Exceptional 9.9% |
| Kenyans | 98.7 /100 | #73 | Exceptional 9.9% |
| Immigrants | Laos | 98.7 /100 | #74 | Exceptional 9.9% |
| Immigrants | Australia | 98.6 /100 | #75 | Exceptional 9.9% |
| Czechoslovakians | 98.4 /100 | #76 | Exceptional 9.9% |
| Chickasaw | 98.4 /100 | #77 | Exceptional 9.9% |
| Assyrians/Chaldeans/Syriacs | 98.3 /100 | #78 | Exceptional 9.9% |
| Icelanders | 98.3 /100 | #79 | Exceptional 9.9% |
| Immigrants | Netherlands | 98.2 /100 | #80 | Exceptional 9.9% |
| Yaqui | 98.0 /100 | #81 | Exceptional 9.9% |
| Sri Lankans | 98.0 /100 | #82 | Exceptional 9.9% |
| Immigrants | Bulgaria | 98.0 /100 | #83 | Exceptional 9.9% |
| Latvians | 97.9 /100 | #84 | Exceptional 9.9% |
| New Zealanders | 97.8 /100 | #85 | Exceptional 9.9% |