Salvadoran vs Immigrants from Europe Unemployment Among Ages 20 to 24 years

COMPARE

Salvadoran
Race
Ancestry
AfghanAfricanAlaska NativeAlaskan AthabascanAlbanianAleutAlsatianAmericanApacheArabArapahoArgentineanArmenianAssyrian/Chaldean/SyriacAustralianAustrianBahamianBangladeshiBarbadianBasqueBelgianBelizeanBermudanBhutaneseBlackfeetBolivianBrazilianBritishBritish West IndianBulgarianBurmeseCajunCambodianCanadianCape VerdeanCarpatho RusynCelticCentral AmericanCentral American IndianCherokeeCheyenneChickasawChileanChineseChippewaChoctawColombianColvilleComancheCosta RicanCreeCreekCroatianCrowCubanCypriotCzechCzechoslovakianDanishDelawareDominicanDutchDutch West IndianEastern EuropeanEcuadorianEgyptianEnglishEstonianEthiopianEuropeanFijianFilipinoFinnishFrenchFrench American IndianFrench CanadianGermanGerman RussianGhanaianGreekGuamanian/ChamorroGuatemalanGuyaneseHaitianHmongHonduranHopiHoumaHungarianIcelanderIndian (Asian)IndonesianInupiatIranianIraqiIrishIroquoisIsraeliItalianJamaicanJapaneseJordanianKenyanKiowaKoreanLaotianLatvianLebaneseLiberianLithuanianLumbeeLuxembourgerMacedonianMalaysianMalteseMarshalleseMenomineeMexicanMexican American IndianMongolianMoroccanNative HawaiianNavajoNepaleseNew ZealanderNicaraguanNigerianNorthern EuropeanNorwegianOkinawanOsageOttawaPaiutePakistaniPalestinianPanamanianParaguayanPennsylvania GermanPeruvianPimaPolishPortuguesePotawatomiPuebloPuerto RicanPuget Sound SalishRomanianRussianSalvadoranSamoanScandinavianScotch-IrishScottishSeminoleSenegaleseSerbianShoshoneSierra LeoneanSiouxSlavicSlovakSloveneSomaliSouth AfricanSouth AmericanSouth American IndianSoviet UnionSpaniardSpanishSpanish AmericanSpanish American IndianSri LankanSubsaharan AfricanSudaneseSwedishSwissSyrianTaiwaneseThaiTlingit-HaidaTohono O'OdhamTonganTrinidadian and TobagonianTsimshianTurkishU.S. Virgin IslanderUgandanUkrainianUruguayanUteVenezuelanVietnameseWelshWest IndianYakamaYaquiYugoslavianYumanYup'ikZimbabwean
Immigration
NonimmigrantsImmigrantsAfghanistanAfricaAlbaniaArgentinaArmeniaAsiaAustraliaAustriaBahamasBangladeshBarbadosBelarusBelgiumBelizeBoliviaBosnia and HerzegovinaBrazilBulgariaBurma/MyanmarCabo VerdeCambodiaCameroonCanadaCaribbeanCentral AmericaChileChinaColombiaCongoCosta RicaCroatiaCubaCzechoslovakiaDenmarkDominicaDominican RepublicEastern AfricaEastern AsiaEastern EuropeEcuadorEgyptEl SalvadorEnglandEritreaEthiopiaFijiFranceGermanyGhanaGreeceGrenadaGuatemalaGuyanaHaitiHondurasHong KongHungaryIndiaIndonesiaIranIraqIrelandIsraelItalyJamaicaJapanJordanKazakhstanKenyaKoreaKuwaitLaosLatin AmericaLatviaLebanonLiberiaLithuaniaMalaysiaMexicoMicronesiaMiddle AfricaMoldovaMoroccoNepalNetherlandsNicaraguaNigeriaNorth AmericaNorth MacedoniaNorthern AfricaNorthern EuropeNorwayOceaniaPakistanPanamaPeruPhilippinesPolandPortugalRomaniaRussiaSaudi ArabiaScotlandSenegalSerbiaSierra LeoneSingaporeSomaliaSouth AfricaSouth AmericaSouth Central AsiaSouth Eastern AsiaSouthern EuropeSpainSri LankaSt. Vincent and the GrenadinesSudanSwedenSwitzerlandSyriaTaiwanThailandTrinidad and TobagoTurkeyUgandaUkraineUruguayUzbekistanVenezuelaVietnamWest IndiesWestern AfricaWestern AsiaWestern EuropeYemenZaireZimbabweAzores
Immigrants from Europe
Race
Ancestry
AfghanAfricanAlaska NativeAlaskan AthabascanAlbanianAleutAlsatianAmericanApacheArabArapahoArgentineanArmenianAssyrian/Chaldean/SyriacAustralianAustrianBahamianBangladeshiBarbadianBasqueBelgianBelizeanBermudanBhutaneseBlackfeetBolivianBrazilianBritishBritish West IndianBulgarianBurmeseCajunCambodianCanadianCape VerdeanCarpatho RusynCelticCentral AmericanCentral American IndianCherokeeCheyenneChickasawChileanChineseChippewaChoctawColombianColvilleComancheCosta RicanCreeCreekCroatianCrowCubanCypriotCzechCzechoslovakianDanishDelawareDominicanDutchDutch West IndianEastern EuropeanEcuadorianEgyptianEnglishEstonianEthiopianEuropeanFijianFilipinoFinnishFrenchFrench American IndianFrench CanadianGermanGerman RussianGhanaianGreekGuamanian/ChamorroGuatemalanGuyaneseHaitianHmongHonduranHopiHoumaHungarianIcelanderIndian (Asian)IndonesianInupiatIranianIraqiIrishIroquoisIsraeliItalianJamaicanJapaneseJordanianKenyanKiowaKoreanLaotianLatvianLebaneseLiberianLithuanianLumbeeLuxembourgerMacedonianMalaysianMalteseMarshalleseMenomineeMexicanMexican American IndianMongolianMoroccanNative HawaiianNavajoNepaleseNew ZealanderNicaraguanNigerianNorthern EuropeanNorwegianOkinawanOsageOttawaPaiutePakistaniPalestinianPanamanianParaguayanPennsylvania GermanPeruvianPimaPolishPortuguesePotawatomiPuebloPuerto RicanPuget Sound SalishRomanianRussianSamoanScandinavianScotch-IrishScottishSeminoleSenegaleseSerbianShoshoneSierra LeoneanSiouxSlavicSlovakSloveneSomaliSouth AfricanSouth AmericanSouth American IndianSoviet UnionSpaniardSpanishSpanish AmericanSpanish American IndianSri LankanSubsaharan AfricanSudaneseSwedishSwissSyrianTaiwaneseThaiTlingit-HaidaTohono O'OdhamTonganTrinidadian and TobagonianTsimshianTurkishU.S. Virgin IslanderUgandanUkrainianUruguayanUteVenezuelanVietnameseWelshWest IndianYakamaYaquiYugoslavianYumanYup'ikZimbabwean
Immigration
NonimmigrantsImmigrantsAfghanistanAfricaAlbaniaArgentinaArmeniaAsiaAustraliaAustriaBahamasBangladeshBarbadosBelarusBelgiumBelizeBoliviaBosnia and HerzegovinaBrazilBulgariaBurma/MyanmarCabo VerdeCambodiaCameroonCanadaCaribbeanCentral AmericaChileChinaColombiaCongoCosta RicaCroatiaCubaCzechoslovakiaDenmarkDominicaDominican RepublicEastern AfricaEastern AsiaEastern EuropeEcuadorEgyptEl SalvadorEnglandEritreaEthiopiaEuropeFijiFranceGermanyGhanaGreeceGrenadaGuatemalaGuyanaHaitiHondurasHong KongHungaryIndiaIndonesiaIranIraqIrelandIsraelItalyJamaicaJapanJordanKazakhstanKenyaKoreaKuwaitLaosLatin AmericaLatviaLebanonLiberiaLithuaniaMalaysiaMexicoMicronesiaMiddle AfricaMoldovaMoroccoNepalNetherlandsNicaraguaNigeriaNorth AmericaNorth MacedoniaNorthern AfricaNorthern EuropeNorwayOceaniaPakistanPanamaPeruPhilippinesPolandPortugalRomaniaRussiaSaudi ArabiaScotlandSenegalSerbiaSierra LeoneSingaporeSomaliaSouth AfricaSouth AmericaSouth Central AsiaSouth Eastern AsiaSouthern EuropeSpainSri LankaSt. Vincent and the GrenadinesSudanSwedenSwitzerlandSyriaTaiwanThailandTrinidad and TobagoTurkeyUgandaUkraineUruguayUzbekistanVenezuelaVietnamWest IndiesWestern AfricaWestern AsiaWestern EuropeYemenZaireZimbabweAzores
Unemployment Among Ages 20 to 24 years
Income
Poverty
Unemployment
Labor Participation
Family Structure
Vehicle Availability
Education Level
Disability

Unemployment Among Ages 20 to 24 years Comparison

Salvadorans

Immigrants from Europe

Tragic
Poor
10.7%
UNEMPLOYMENT AMONG AGES 20 TO 24 YEARS
2.4/ 100
METRIC RATING
239th/ 347
METRIC RANK
10.4%
UNEMPLOYMENT AMONG AGES 20 TO 24 YEARS
18.5/ 100
METRIC RATING
206th/ 347
METRIC RANK

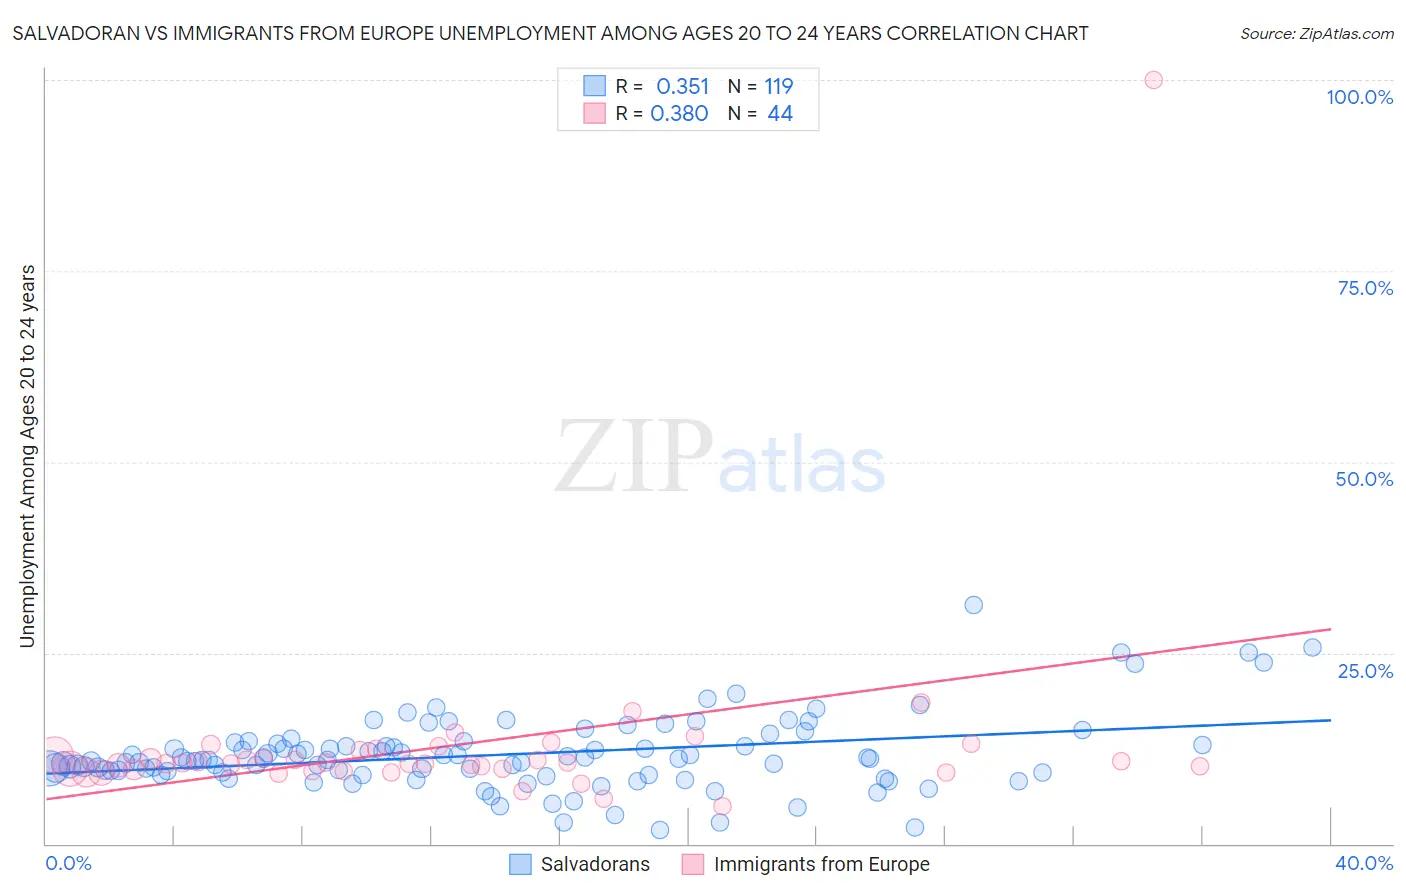
Salvadoran vs Immigrants from Europe Unemployment Among Ages 20 to 24 years Correlation Chart

The statistical analysis conducted on geographies consisting of 387,862,775 people shows a mild positive correlation between the proportion of Salvadorans and unemployment rate among population between the ages 20 and 24 in the United States with a correlation coefficient (R) of 0.351 and weighted average of 10.7%. Similarly, the statistical analysis conducted on geographies consisting of 510,398,062 people shows a mild positive correlation between the proportion of Immigrants from Europe and unemployment rate among population between the ages 20 and 24 in the United States with a correlation coefficient (R) of 0.380 and weighted average of 10.4%, a difference of 2.0%.
Salvadoran vs Immigrants from Europe Unemployment Among Ages 20 to 24 years

Unemployment Among Ages 20 to 24 years Correlation Summary

MeasurementSalvadoranImmigrants from Europe
Minimum1.8%4.9%
Maximum31.2%100.0%
Range29.4%95.1%
Mean11.7%12.8%
Median11.0%10.5%
Interquartile 25% (IQ1)9.3%9.6%
Interquartile 75% (IQ3)13.1%11.9%
Interquartile Range (IQR)3.8%2.2%
Standard Deviation (Sample)4.8%13.7%
Standard Deviation (Population)4.7%13.5%

Similar Demographics by Unemployment Among Ages 20 to 24 years

Demographics Similar to Salvadorans by Unemployment Among Ages 20 to 24 years

In terms of unemployment among ages 20 to 24 years, the demographic groups most similar to Salvadorans are Immigrants from Pakistan (10.6%, a difference of 0.060%), Immigrants (10.6%, a difference of 0.080%), Immigrants from Central America (10.7%, a difference of 0.19%), Mexican (10.6%, a difference of 0.25%), and Immigrants from Ukraine (10.6%, a difference of 0.29%).
DemographicsRating | RankUnemployment Among Ages 20 to 24 years
Israelis
3.7
/100
|
#232
Tragic
10.6%
Choctaw
3.6
/100
|
#233
Tragic
10.6%
Immigrants | Africa
3.5
/100
|
#234
Tragic
10.6%
Immigrants | Ukraine
3.3
/100
|
#235
Tragic
10.6%
Mexicans
3.2
/100
|
#236
Tragic
10.6%
Immigrants | Immigrants
2.7
/100
|
#237
Tragic
10.6%
Immigrants | Pakistan
2.6
/100
|
#238
Tragic
10.6%
Salvadorans
2.4
/100
|
#239
Tragic
10.7%
Immigrants | Central America
2.0
/100
|
#240
Tragic
10.7%
Immigrants | El Salvador
1.7
/100
|
#241
Tragic
10.7%
Moroccans
1.4
/100
|
#242
Tragic
10.7%
Immigrants | Belarus
1.3
/100
|
#243
Tragic
10.7%
Immigrants | Mexico
1.2
/100
|
#244
Tragic
10.7%
Hispanics or Latinos
1.0
/100
|
#245
Tragic
10.7%
Immigrants | Iran
0.9
/100
|
#246
Tragic
10.8%

Demographics Similar to Immigrants from Europe by Unemployment Among Ages 20 to 24 years

In terms of unemployment among ages 20 to 24 years, the demographic groups most similar to Immigrants from Europe are Cypriot (10.4%, a difference of 0.030%), Immigrants from Honduras (10.4%, a difference of 0.030%), Immigrants from Northern Europe (10.4%, a difference of 0.060%), Immigrants from Hong Kong (10.5%, a difference of 0.060%), and Peruvian (10.5%, a difference of 0.080%).
DemographicsRating | RankUnemployment Among Ages 20 to 24 years
Portuguese
21.8
/100
|
#199
Fair
10.4%
Russians
21.2
/100
|
#200
Fair
10.4%
Immigrants | Peru
21.2
/100
|
#201
Fair
10.4%
Immigrants | Middle Africa
20.9
/100
|
#202
Fair
10.4%
South Americans
20.6
/100
|
#203
Fair
10.4%
Immigrants | Northern Europe
19.5
/100
|
#204
Poor
10.4%
Cypriots
18.9
/100
|
#205
Poor
10.4%
Immigrants | Europe
18.5
/100
|
#206
Poor
10.4%
Immigrants | Honduras
17.9
/100
|
#207
Poor
10.4%
Immigrants | Hong Kong
17.6
/100
|
#208
Poor
10.5%
Peruvians
17.2
/100
|
#209
Poor
10.5%
Immigrants | Belgium
16.9
/100
|
#210
Poor
10.5%
Immigrants | Guatemala
14.6
/100
|
#211
Poor
10.5%
Immigrants | Sri Lanka
14.0
/100
|
#212
Poor
10.5%
Guatemalans
12.2
/100
|
#213
Poor
10.5%