Osage vs Immigrants from South Africa Male Unemployment

COMPARE

Osage
Race
Ancestry
AfghanAfricanAlaska NativeAlaskan AthabascanAlbanianAleutAlsatianAmericanApacheArabArapahoArgentineanArmenianAssyrian/Chaldean/SyriacAustralianAustrianBahamianBangladeshiBarbadianBasqueBelgianBelizeanBermudanBhutaneseBlackfeetBolivianBrazilianBritishBritish West IndianBulgarianBurmeseCajunCambodianCanadianCape VerdeanCarpatho RusynCelticCentral AmericanCentral American IndianCherokeeCheyenneChickasawChileanChineseChippewaChoctawColombianColvilleComancheCosta RicanCreeCreekCroatianCrowCubanCypriotCzechCzechoslovakianDanishDelawareDominicanDutchDutch West IndianEastern EuropeanEcuadorianEgyptianEnglishEstonianEthiopianEuropeanFijianFilipinoFinnishFrenchFrench American IndianFrench CanadianGermanGerman RussianGhanaianGreekGuamanian/ChamorroGuatemalanGuyaneseHaitianHmongHonduranHopiHoumaHungarianIcelanderIndian (Asian)IndonesianInupiatIranianIraqiIrishIroquoisIsraeliItalianJamaicanJapaneseJordanianKenyanKiowaKoreanLaotianLatvianLebaneseLiberianLithuanianLumbeeLuxembourgerMacedonianMalaysianMalteseMarshalleseMenomineeMexicanMexican American IndianMongolianMoroccanNative HawaiianNavajoNepaleseNew ZealanderNicaraguanNigerianNorthern EuropeanNorwegianOkinawanOsageOttawaPaiutePakistaniPalestinianPanamanianParaguayanPennsylvania GermanPeruvianPimaPolishPortuguesePotawatomiPuebloPuerto RicanPuget Sound SalishRomanianRussianSalvadoranSamoanScandinavianScotch-IrishScottishSeminoleSenegaleseSerbianShoshoneSierra LeoneanSiouxSlavicSlovakSloveneSomaliSouth AfricanSouth AmericanSouth American IndianSoviet UnionSpaniardSpanishSpanish AmericanSpanish American IndianSri LankanSubsaharan AfricanSudaneseSwedishSwissSyrianTaiwaneseThaiTlingit-HaidaTohono O'OdhamTonganTrinidadian and TobagonianTsimshianTurkishU.S. Virgin IslanderUgandanUkrainianUruguayanUteVenezuelanVietnameseWelshWest IndianYakamaYaquiYugoslavianYumanYup'ikZimbabwean
Immigration
NonimmigrantsImmigrantsAfghanistanAfricaAlbaniaArgentinaArmeniaAsiaAustraliaAustriaBahamasBangladeshBarbadosBelarusBelgiumBelizeBoliviaBosnia and HerzegovinaBrazilBulgariaBurma/MyanmarCabo VerdeCambodiaCameroonCanadaCaribbeanCentral AmericaChileChinaColombiaCongoCosta RicaCroatiaCubaCzechoslovakiaDenmarkDominicaDominican RepublicEastern AfricaEastern AsiaEastern EuropeEcuadorEgyptEl SalvadorEnglandEritreaEthiopiaEuropeFijiFranceGermanyGhanaGreeceGrenadaGuatemalaGuyanaHaitiHondurasHong KongHungaryIndiaIndonesiaIranIraqIrelandIsraelItalyJamaicaJapanJordanKazakhstanKenyaKoreaKuwaitLaosLatin AmericaLatviaLebanonLiberiaLithuaniaMalaysiaMexicoMicronesiaMiddle AfricaMoldovaMoroccoNepalNetherlandsNicaraguaNigeriaNorth AmericaNorth MacedoniaNorthern AfricaNorthern EuropeNorwayOceaniaPakistanPanamaPeruPhilippinesPolandPortugalRomaniaRussiaSaudi ArabiaScotlandSenegalSerbiaSierra LeoneSingaporeSomaliaSouth AmericaSouth Central AsiaSouth Eastern AsiaSouthern EuropeSpainSri LankaSt. Vincent and the GrenadinesSudanSwedenSwitzerlandSyriaTaiwanThailandTrinidad and TobagoTurkeyUgandaUkraineUruguayUzbekistanVenezuelaVietnamWest IndiesWestern AfricaWestern AsiaWestern EuropeYemenZaireZimbabweAzores
Immigrants from South Africa
Race
Ancestry
AfghanAfricanAlaska NativeAlaskan AthabascanAlbanianAleutAlsatianAmericanApacheArabArapahoArgentineanArmenianAssyrian/Chaldean/SyriacAustralianAustrianBahamianBangladeshiBarbadianBasqueBelgianBelizeanBermudanBhutaneseBlackfeetBolivianBrazilianBritishBritish West IndianBulgarianBurmeseCajunCambodianCanadianCape VerdeanCarpatho RusynCelticCentral AmericanCentral American IndianCherokeeCheyenneChickasawChileanChineseChippewaChoctawColombianColvilleComancheCosta RicanCreeCreekCroatianCrowCubanCypriotCzechCzechoslovakianDanishDelawareDominicanDutchDutch West IndianEastern EuropeanEcuadorianEgyptianEnglishEstonianEthiopianEuropeanFijianFilipinoFinnishFrenchFrench American IndianFrench CanadianGermanGerman RussianGhanaianGreekGuamanian/ChamorroGuatemalanGuyaneseHaitianHmongHonduranHopiHoumaHungarianIcelanderIndian (Asian)IndonesianInupiatIranianIraqiIrishIroquoisIsraeliItalianJamaicanJapaneseJordanianKenyanKiowaKoreanLaotianLatvianLebaneseLiberianLithuanianLumbeeLuxembourgerMacedonianMalaysianMalteseMarshalleseMenomineeMexicanMexican American IndianMongolianMoroccanNative HawaiianNavajoNepaleseNew ZealanderNicaraguanNigerianNorthern EuropeanNorwegianOkinawanOttawaPaiutePakistaniPalestinianPanamanianParaguayanPennsylvania GermanPeruvianPimaPolishPortuguesePotawatomiPuebloPuerto RicanPuget Sound SalishRomanianRussianSalvadoranSamoanScandinavianScotch-IrishScottishSeminoleSenegaleseSerbianShoshoneSierra LeoneanSiouxSlavicSlovakSloveneSomaliSouth AfricanSouth AmericanSouth American IndianSoviet UnionSpaniardSpanishSpanish AmericanSpanish American IndianSri LankanSubsaharan AfricanSudaneseSwedishSwissSyrianTaiwaneseThaiTlingit-HaidaTohono O'OdhamTonganTrinidadian and TobagonianTsimshianTurkishU.S. Virgin IslanderUgandanUkrainianUruguayanUteVenezuelanVietnameseWelshWest IndianYakamaYaquiYugoslavianYumanYup'ikZimbabwean
Immigration
NonimmigrantsImmigrantsAfghanistanAfricaAlbaniaArgentinaArmeniaAsiaAustraliaAustriaBahamasBangladeshBarbadosBelarusBelgiumBelizeBoliviaBosnia and HerzegovinaBrazilBulgariaBurma/MyanmarCabo VerdeCambodiaCameroonCanadaCaribbeanCentral AmericaChileChinaColombiaCongoCosta RicaCroatiaCubaCzechoslovakiaDenmarkDominicaDominican RepublicEastern AfricaEastern AsiaEastern EuropeEcuadorEgyptEl SalvadorEnglandEritreaEthiopiaEuropeFijiFranceGermanyGhanaGreeceGrenadaGuatemalaGuyanaHaitiHondurasHong KongHungaryIndiaIndonesiaIranIraqIrelandIsraelItalyJamaicaJapanJordanKazakhstanKenyaKoreaKuwaitLaosLatin AmericaLatviaLebanonLiberiaLithuaniaMalaysiaMexicoMicronesiaMiddle AfricaMoldovaMoroccoNepalNetherlandsNicaraguaNigeriaNorth AmericaNorth MacedoniaNorthern AfricaNorthern EuropeNorwayOceaniaPakistanPanamaPeruPhilippinesPolandPortugalRomaniaRussiaSaudi ArabiaScotlandSenegalSerbiaSierra LeoneSingaporeSomaliaSouth AfricaSouth AmericaSouth Central AsiaSouth Eastern AsiaSouthern EuropeSpainSri LankaSt. Vincent and the GrenadinesSudanSwedenSwitzerlandSyriaTaiwanThailandTrinidad and TobagoTurkeyUgandaUkraineUruguayUzbekistanVenezuelaVietnamWest IndiesWestern AfricaWestern AsiaWestern EuropeYemenZaireZimbabweAzores
Male Unemployment
Income
Poverty
Unemployment
Labor Participation
Family Structure
Vehicle Availability
Education Level
Disability

Male Unemployment Comparison

Osage

Immigrants from South Africa

Average
Exceptional
5.3%
MALE UNEMPLOYMENT
42.5/ 100
METRIC RATING
178th/ 347
METRIC RANK
5.0%
MALE UNEMPLOYMENT
97.1/ 100
METRIC RATING
72nd/ 347
METRIC RANK

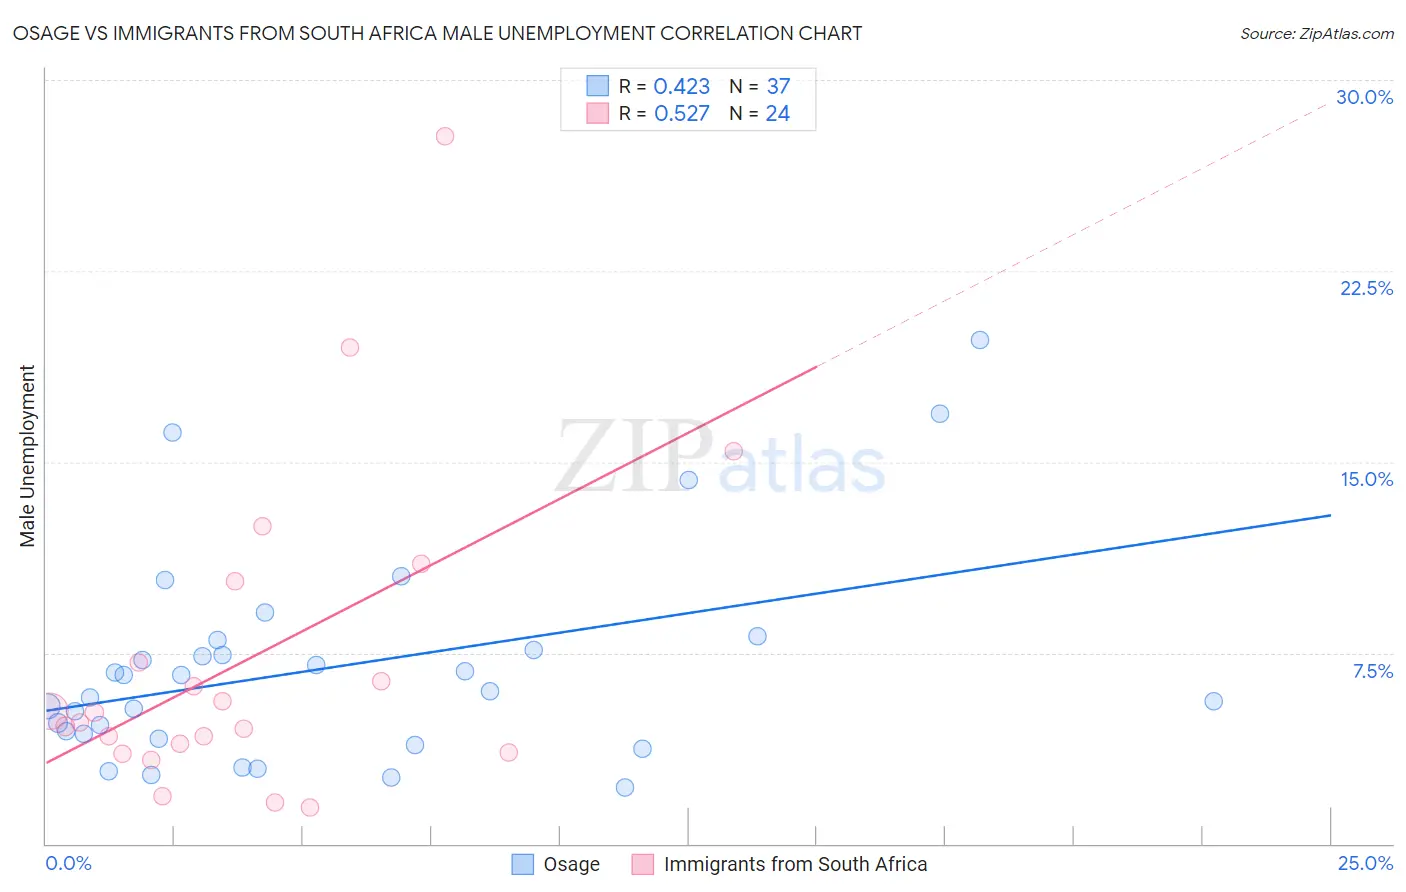
Osage vs Immigrants from South Africa Male Unemployment Correlation Chart

The statistical analysis conducted on geographies consisting of 91,677,196 people shows a moderate positive correlation between the proportion of Osage and unemployment rate among males in the United States with a correlation coefficient (R) of 0.423 and weighted average of 5.3%. Similarly, the statistical analysis conducted on geographies consisting of 232,631,377 people shows a substantial positive correlation between the proportion of Immigrants from South Africa and unemployment rate among males in the United States with a correlation coefficient (R) of 0.527 and weighted average of 5.0%, a difference of 5.9%.
Osage vs Immigrants from South Africa Male Unemployment

Male Unemployment Correlation Summary

MeasurementOsageImmigrants from South Africa
Minimum2.2%1.4%
Maximum19.8%27.8%
Range17.6%26.4%
Mean6.9%7.2%
Median6.0%5.0%
Interquartile 25% (IQ1)4.2%3.8%
Interquartile 75% (IQ3)7.8%8.7%
Interquartile Range (IQR)3.6%5.0%
Standard Deviation (Sample)4.1%6.2%
Standard Deviation (Population)4.0%6.1%

Similar Demographics by Male Unemployment

Demographics Similar to Osage by Male Unemployment

In terms of male unemployment, the demographic groups most similar to Osage are Immigrants from Oceania (5.3%, a difference of 0.10%), Immigrants from Peru (5.3%, a difference of 0.13%), Malaysian (5.3%, a difference of 0.17%), Immigrants from Poland (5.3%, a difference of 0.21%), and Immigrants from Afghanistan (5.3%, a difference of 0.28%).
DemographicsRating | RankMale Unemployment
Peruvians
51.9
/100
|
#171
Average
5.3%
Immigrants | Kazakhstan
50.8
/100
|
#172
Average
5.3%
Immigrants | Russia
50.7
/100
|
#173
Average
5.3%
Immigrants | Iran
50.0
/100
|
#174
Average
5.3%
Immigrants | Iraq
48.1
/100
|
#175
Average
5.3%
Immigrants | Poland
46.0
/100
|
#176
Average
5.3%
Immigrants | Peru
44.6
/100
|
#177
Average
5.3%
Osage
42.5
/100
|
#178
Average
5.3%
Immigrants | Oceania
40.8
/100
|
#179
Average
5.3%
Malaysians
39.6
/100
|
#180
Fair
5.3%
Immigrants | Afghanistan
37.9
/100
|
#181
Fair
5.3%
Potawatomi
37.8
/100
|
#182
Fair
5.3%
Taiwanese
37.6
/100
|
#183
Fair
5.3%
Spaniards
35.1
/100
|
#184
Fair
5.3%
Koreans
34.9
/100
|
#185
Fair
5.3%

Demographics Similar to Immigrants from South Africa by Male Unemployment

In terms of male unemployment, the demographic groups most similar to Immigrants from South Africa are New Zealander (5.0%, a difference of 0.070%), Greek (5.0%, a difference of 0.080%), White/Caucasian (5.0%, a difference of 0.090%), Immigrants from North America (5.0%, a difference of 0.11%), and Assyrian/Chaldean/Syriac (5.0%, a difference of 0.14%).
DemographicsRating | RankMale Unemployment
Icelanders
97.6
/100
|
#65
Exceptional
5.0%
Finns
97.5
/100
|
#66
Exceptional
5.0%
Immigrants | Canada
97.5
/100
|
#67
Exceptional
5.0%
Australians
97.4
/100
|
#68
Exceptional
5.0%
Immigrants | Sweden
97.4
/100
|
#69
Exceptional
5.0%
Whites/Caucasians
97.3
/100
|
#70
Exceptional
5.0%
New Zealanders
97.3
/100
|
#71
Exceptional
5.0%
Immigrants | South Africa
97.1
/100
|
#72
Exceptional
5.0%
Greeks
97.0
/100
|
#73
Exceptional
5.0%
Immigrants | North America
96.9
/100
|
#74
Exceptional
5.0%
Assyrians/Chaldeans/Syriacs
96.9
/100
|
#75
Exceptional
5.0%
Immigrants | Sudan
96.5
/100
|
#76
Exceptional
5.0%
Iranians
96.4
/100
|
#77
Exceptional
5.0%
Immigrants | Northern Europe
96.4
/100
|
#78
Exceptional
5.0%
South Africans
96.4
/100
|
#79
Exceptional
5.0%