Native Hawaiian vs Spanish American Unemployment Among Ages 65 to 74 years
COMPARE
Native Hawaiian
Spanish American
Unemployment Among Ages 65 to 74 years
Unemployment Among Ages 65 to 74 years Comparison
Native Hawaiians
Spanish Americans
5.6%
UNEMPLOYMENT AMONG AGES 65 TO 74 YEARS
0.4/ 100
METRIC RATING
256th/ 347
METRIC RANK
5.4%
UNEMPLOYMENT AMONG AGES 65 TO 74 YEARS
38.2/ 100
METRIC RATING
182nd/ 347
METRIC RANK
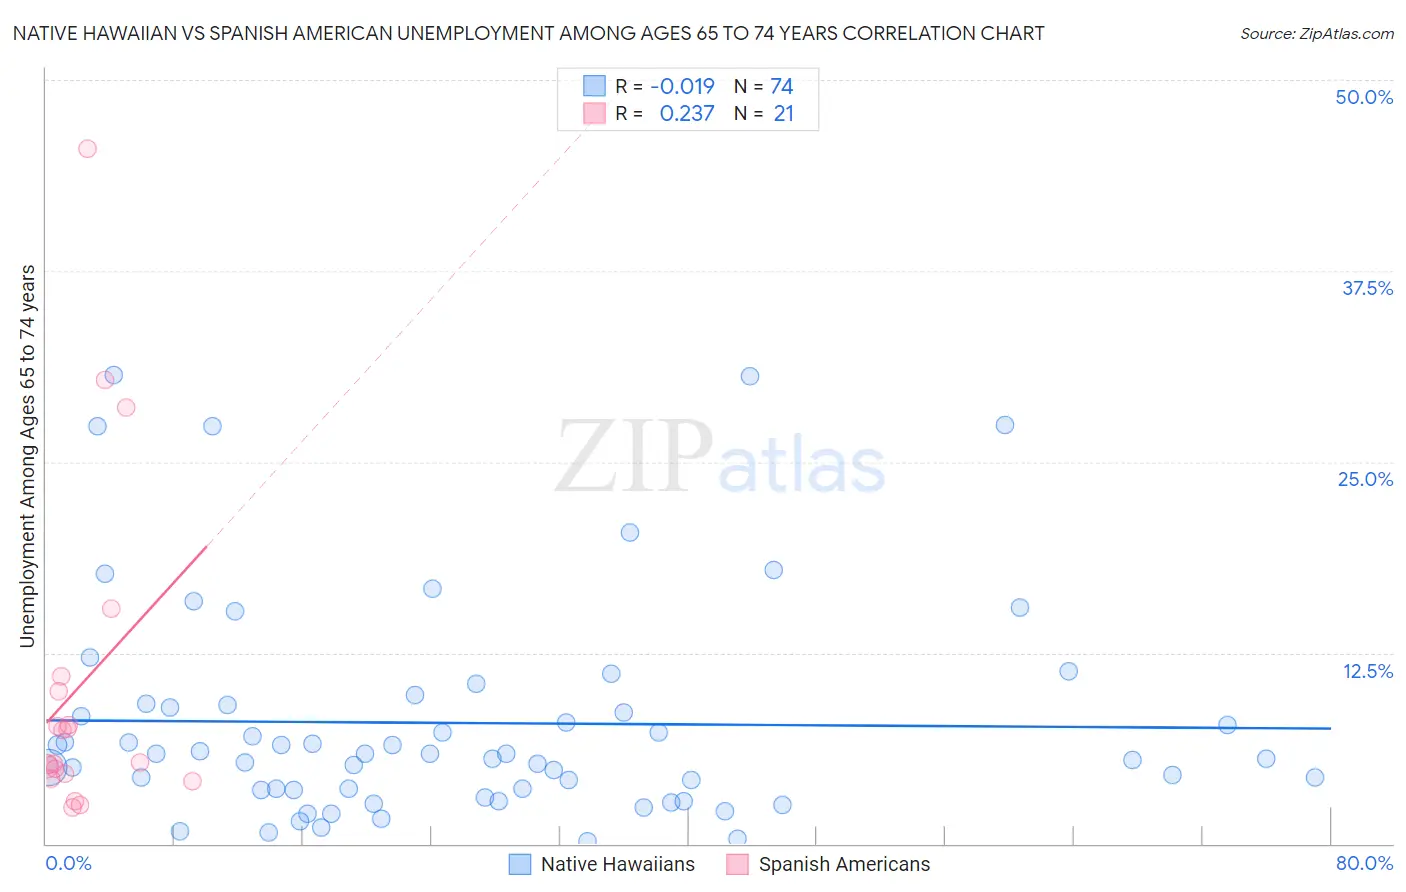
Native Hawaiian vs Spanish American Unemployment Among Ages 65 to 74 years Correlation Chart
The statistical analysis conducted on geographies consisting of 294,979,379 people shows no correlation between the proportion of Native Hawaiians and unemployment rate among population between the ages 65 and 74 in the United States with a correlation coefficient (R) of -0.019 and weighted average of 5.6%. Similarly, the statistical analysis conducted on geographies consisting of 98,707,730 people shows a weak positive correlation between the proportion of Spanish Americans and unemployment rate among population between the ages 65 and 74 in the United States with a correlation coefficient (R) of 0.237 and weighted average of 5.4%, a difference of 4.3%.
Unemployment Among Ages 65 to 74 years Correlation Summary
| Measurement | Native Hawaiian | Spanish American |
| Minimum | 0.20% | 2.4% |
| Maximum | 30.7% | 45.5% |
| Range | 30.5% | 43.1% |
| Mean | 7.9% | 10.4% |
| Median | 5.9% | 5.3% |
| Interquartile 25% (IQ1) | 3.5% | 4.4% |
| Interquartile 75% (IQ3) | 9.1% | 10.5% |
| Interquartile Range (IQR) | 5.6% | 6.1% |
| Standard Deviation (Sample) | 7.1% | 11.1% |
| Standard Deviation (Population) | 7.1% | 10.8% |
Similar Demographics by Unemployment Among Ages 65 to 74 years
Demographics Similar to Native Hawaiians by Unemployment Among Ages 65 to 74 years
In terms of unemployment among ages 65 to 74 years, the demographic groups most similar to Native Hawaiians are Immigrants from Haiti (5.6%, a difference of 0.10%), Immigrants from Southern Europe (5.6%, a difference of 0.12%), Immigrants from Costa Rica (5.6%, a difference of 0.19%), Immigrants from Brazil (5.6%, a difference of 0.21%), and Colombian (5.6%, a difference of 0.27%).
| Demographics | Rating | Rank | Unemployment Among Ages 65 to 74 years |
| Trinidadians and Tobagonians | 0.8 /100 | #249 | Tragic 5.6% |
| Cape Verdeans | 0.7 /100 | #250 | Tragic 5.6% |
| Brazilians | 0.5 /100 | #251 | Tragic 5.6% |
| Colombians | 0.5 /100 | #252 | Tragic 5.6% |
| Immigrants | Brazil | 0.5 /100 | #253 | Tragic 5.6% |
| Immigrants | Costa Rica | 0.5 /100 | #254 | Tragic 5.6% |
| Immigrants | Haiti | 0.4 /100 | #255 | Tragic 5.6% |
| Native Hawaiians | 0.4 /100 | #256 | Tragic 5.6% |
| Immigrants | Southern Europe | 0.3 /100 | #257 | Tragic 5.6% |
| Immigrants | Western Africa | 0.3 /100 | #258 | Tragic 5.6% |
| Sierra Leoneans | 0.2 /100 | #259 | Tragic 5.6% |
| Immigrants | Barbados | 0.2 /100 | #260 | Tragic 5.6% |
| South Americans | 0.2 /100 | #261 | Tragic 5.6% |
| Immigrants | St. Vincent and the Grenadines | 0.2 /100 | #262 | Tragic 5.6% |
| Immigrants | Jamaica | 0.2 /100 | #263 | Tragic 5.6% |
Demographics Similar to Spanish Americans by Unemployment Among Ages 65 to 74 years
In terms of unemployment among ages 65 to 74 years, the demographic groups most similar to Spanish Americans are Immigrants from Spain (5.4%, a difference of 0.030%), Soviet Union (5.4%, a difference of 0.060%), Immigrants from Senegal (5.4%, a difference of 0.11%), Immigrants from Ireland (5.4%, a difference of 0.13%), and Guamanian/Chamorro (5.4%, a difference of 0.14%).
| Demographics | Rating | Rank | Unemployment Among Ages 65 to 74 years |
| Immigrants | Iran | 49.0 /100 | #175 | Average 5.4% |
| Immigrants | Western Europe | 47.3 /100 | #176 | Average 5.4% |
| Arabs | 46.8 /100 | #177 | Average 5.4% |
| French | 43.1 /100 | #178 | Average 5.4% |
| Guamanians/Chamorros | 42.1 /100 | #179 | Average 5.4% |
| Immigrants | Ireland | 42.0 /100 | #180 | Average 5.4% |
| Soviet Union | 40.0 /100 | #181 | Fair 5.4% |
| Spanish Americans | 38.2 /100 | #182 | Fair 5.4% |
| Immigrants | Spain | 37.3 /100 | #183 | Fair 5.4% |
| Immigrants | Senegal | 35.2 /100 | #184 | Fair 5.4% |
| Russians | 34.4 /100 | #185 | Fair 5.4% |
| Lithuanians | 32.4 /100 | #186 | Fair 5.4% |
| Immigrants | Nonimmigrants | 30.6 /100 | #187 | Fair 5.4% |
| Immigrants | Europe | 28.8 /100 | #188 | Fair 5.4% |
| Immigrants | Africa | 28.3 /100 | #189 | Fair 5.4% |